Plastic Japonez Reciclare Pina La 100%
9
Japan’s economy contracted considerably in 2009 due to the effects of the “Le hman Shoc k” in September of the previous year. Looking at economic ind icat ors, Jap an’s GDP fell by 5.2 % and its industrial production by 21.9% signaling a dramatic decline in the economy compared with the previous year. The results of our 2009 survey deeply ree ct the effects of this recession: “resin production” and “domestic plastic products consumption” dropped sharply by 17% and 23%, respectively, and “total plastic waste discharge” decreased by 9%. At the same time, exports of plastic waste as a destination of mechanical recycling have held steady atabout1,500thousandtonssince2007,agurethat represents more than 70% of all mechanical recycling and that reflects the strong growth in China and in Asia overall. The Plastic Waste Management Institute has been revising its system for making estimations to improve the accuracy of this flowchart. With the revision of Japan’s Home Appliance Recycling Law, “LCD and plasma TVs” and “clothes dryers” became targets of recycling in April 2009, and this year, we added “clothes dryers” to our estimation system to reflect this revision. We have included “LCD and plasma TVs” in our estimation system since the 2004 version ofthisowchar tconsiderin gthebigeffectthatthese products have on plastic waste. The Plastic Waste Management Institute would like to extend its deep appreciation to the Ministry of the Environment (MOE), Ministry of Economy, Trade and Industry (METI), and various local governments and concerned organizations for providing valuable data and helpful advice during the course of this survey. NO 40 2011.5 Pl astic Products,P l astic Waste and Resource Recovery [2009] Plastic Waste Management Institute JAPAN Backgro und information and notes on the publication of the Flowchart of Plastic Products, Plastic Waste and Resource Reco very ( 2009 ) PWMI Newsletter 2009 Highlights 1. “Total plastic waste discharge” has been at about 10,000 thousand tons since 2000, but decreased to 9,120 thousand tons in 2009. 2. At 8,430 thousand tons, “domestic plastic products consumption” dropped considerably falling below the amount of “total plastic waste discharge.” This is because products placed on the market and stocked in the past came to be discharged as plastic waste in 2009. 3. The ratios of mechanical recycling, feedstock recycling *1, and energy recovery *2 all increased, and the effective plastic utilization rate increased by 3% over the previous year to 79%.
-
Upload
mariana-gorceag -
Category
Documents
-
view
228 -
download
0
Transcript of Plastic Japonez Reciclare Pina La 100%
8/3/2019 Plastic Japonez Reciclare Pina La 100%
http://slidepdf.com/reader/full/plastic-japonez-reciclare-pina-la-100 1/9
Japan’s economy contracted considerably in 2009
due to the effects of the “Le hman Shoc k” in
September of the previous year. Looking at economic
ind icat ors , Jap an’s GDP fell by 5.2 % and its
industrial production by 21.9% signaling a dramatic
decline in the economy compared with the previous
year.
Theresultsofour2009surveydeeplyreectthe
effects of this recession: “resin production” and
“domestic plastic products consumption” dropped
sharply by 17% and 23%, respectively, and “total
plastic waste discharge” decreased by 9%.
At the same time, exports of plastic waste as a
destination of mechanical recycling have held steady
atabout1,500thousandtonssince2007,agurethat
represents more than 70% of all mechanical recycling
and that reflects the strong growth in China and in
Asia overall.
The Plastic Waste Management Institute has been
revising its system for making estimations to improve
the accuracy of this flowchart. With the revision of
Japan’s Home Appliance Recycling Law, “LCD and
plasma TVs” and “clothes dryers” became targets of
recycling in April 2009, and this year, we added
“clothes dryers” to our estimation system to reflect
this revision. We have included “LCD and plasma
TVs” in our estimation system since the 2004 version
ofthisowchartconsideringthebigeffectthatthese
products have on plastic waste.
The Plastic Waste Management Institute would
like to extend its deep appreciation to the Ministry of
the Environment (MOE), Ministry of Economy,
Trade and Indus try (METI), and various local
governments and concerned organizations for
providing valuable data and helpful advice during the
course of this survey.
NO 40 2011.5
Plastic Products,Plastic Waste andResource Recovery[2009]
Plastic Waste Management InstituteJAPAN
Background information and notes on the publication of the Flowchart ofPlastic Products, Plastic Waste and Resource Recovery (2009)
PWMI Newsletter
2009 Highlights1. “Total plastic waste discharge” has been at about 10,000 thousand tons since 2000, but decreased to
9,120 thousand tons in 2009.2. At 8,430 thousand tons, “domestic plastic products consumption” dropped considerably falling below
the amount of “total plastic waste discharge.” This is because products placed on the market andstocked in the past came to be discharged as plastic waste in 2009.3. The ratios of mechanical recycling, feedstock recycling *1, and energy recovery *2 all increased, and the
effective plastic utilization rate increased by 3% over the previous year to 79%.
8/3/2019 Plastic Japonez Reciclare Pina La 100%
http://slidepdf.com/reader/full/plastic-japonez-reciclare-pina-la-100 2/9
2
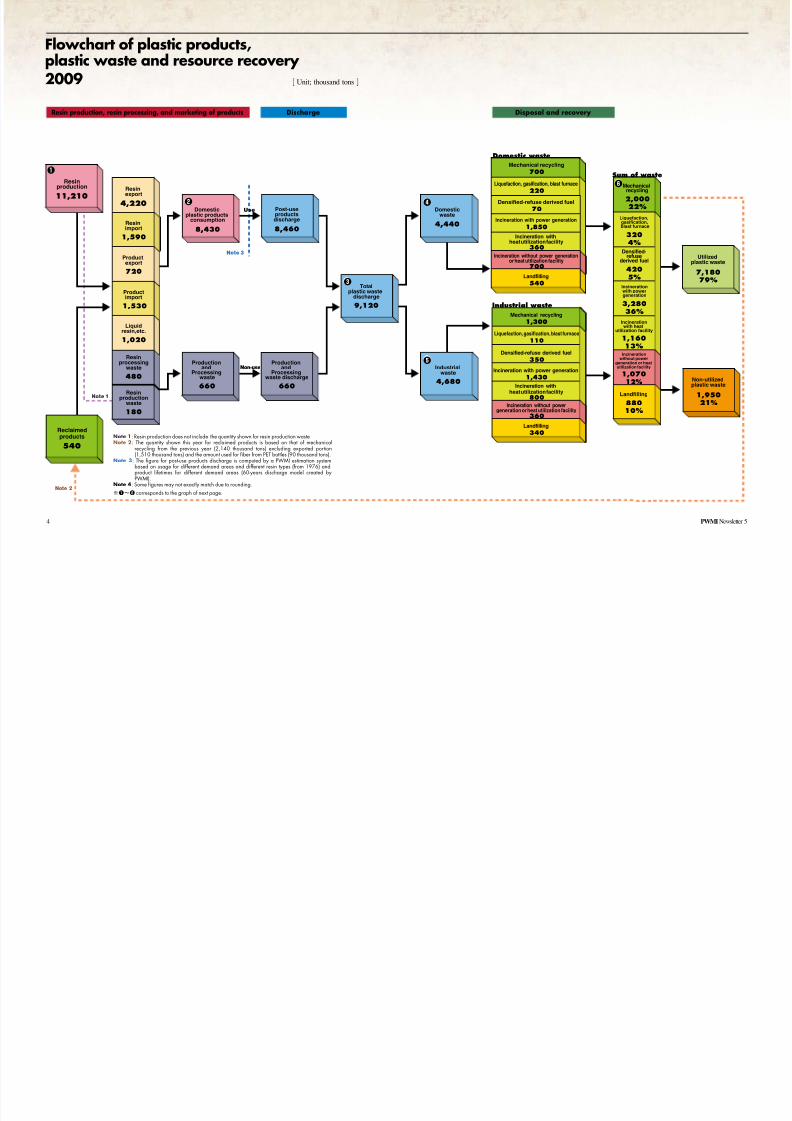
“Domestic plastic products consumption” in 2009
decreased significantly to 8,430 thousand tons
(-2,470 thousand tons relative to the previous year;
-23%), while “resin production” also fell noticeably
to 11,210 thousand tons (-2,240 thousand tons;
-17%).
“Total plastic waste discharge” also decreased to9,120 thousand tons (-860 thousand tons; -9%), but
this rate of decrease was small compared to that of
“resin production” and “domestic plastic products
consumption.” The reason for this is that, excluding
plastic consumed and discharged in 2009, plastic
products placed on the market and stocked in the past
came to be discharged in that year.
Breaking down plastic waste discharge for 2009,
we have domestic (general) plastic waste at 4,440
thousand tons (-580 thousand tons; -12%) and
industrial plastic waste at 4,680 thousand tons (-280
thousand tons; -5%), which indicates a large drop in
domestic plastic waste. This is because plastic
discharged as domestic plastic waste is often used for
short-term applications (packages, containers, etc.),
wh ic h i s e a s i ly a f f e c t e d by c ha ng e s in th e
consumption of plastic products.
Turning to methods of disposal and recovery, the
total amount of plastic waste dropped by 860
thousand tons from 9,980 to 9,120 thousand tons.
Her e , th e amo un t of p l as t i c wa s t e us ed fo r
mechanical recycling and energy recovery dropped
to 2,000 thousand tons (-130 thousand tons; -6%) and
4,860 thousand tons (-330 thousand tons; -6%),
respectively. On the other hand, the amount for
feedstock recycling increased to 320 thousand tons
(+70 thousand tons; +28%) thanks to increased useof plastic waste as fuel for blast furnaces, coke
furnaces,andgasication.
The effective utilization rate of plastic waste
increased overall by 3% to 79% with mechanical
recycling, feedstock recycling, and energy recovery
contributing 22%, 4%, and 54%, respectively.
Incineration without power generation or heat
utilizationfacilityandlandllingdecreasedto1,070
thousand tons (-110 thousand tons; -9%) and 880
tho usan d ton s ( -34 0 tho usan d ton s ; -28% ) ,
respectively,indicatingabigdropinlandlling.
Export s of plasti c waste as a destinati on of
mechanical recycling decreased slightly to 1490
thousand tons (-30 thousand tons; -2%), marking the
third straight year that results have held steady.
*1 feedstock recycling = blast/coke furnaces + gasification +
liquefaction
*2energyrecovery=densied-refusederivedfuel+incineration
with power generation + incineration with heat utilization facility
1-1 Resin production This figu re was dete rmin ed on the basis of
chemical-industry statistics from the Ministry of
Economy, Trade and Industry (METI).
1-2 Reclaimed products Forconveniencesake,thegureusedhereasinput
is that of mechanical recycling from the previous
yeartakingguresforexportandimportofplastic
waste into account (Ministry of Finance, trade
statistics).
1-3 Domestic plastic products consumption
・(Domestic plastic products consumption) =
(Resin production) - (Resin export) + (Resin
import) - (Liquid resin, etc.) - (Resin processing
waste) + (Reclaimed products) - (Product export)
+ (Product import)
・Resin export and import figures are based on
trade statistics from the Ministry of Finance.
・Figuresforliquidresin,syntheticber,etc.that
fall outside plastic waste discharge are based on
chemical-industry statistics from the Ministry of
Economy, Trade and Industry.
・Figures for plastic product export and import arebased on trade statistics from the Ministry of
Finance.
・Figure for processing waste considers discharged
waste from the processing step that is not turned
into products.
2-1 Industrial waste and domestic waste
・Industrial waste is waste generated by business
activities as defined by the Waste Disposal and
Public Cleansing Law, and includes ashes, sludge,
waste oil, waste acid, waste alkali, and waste
plastic. Its disposal is generally the responsibility
(1) Resin production, resin processing, and
marketing of products
(2) Discharge
Explanation o fowchart items
8/3/2019 Plastic Japonez Reciclare Pina La 100%
http://slidepdf.com/reader/full/plastic-japonez-reciclare-pina-la-100 3/9
PWMI Newsletter 3
of the party that generates the waste. Domestic
waste is waste other than industrial waste and its
disposal is mainly handled by local governments.
2-2 Post-use products discharge ・Thisgureisdetermindbyanestimationsystem
developed by PWMI based on usage quantities bydemand-generatingeldsandbyresintype(usage
quantities have been calculated annually from
1976) and on product lifetimes by demand-
generatingelds(usingaPWMIdischargemodel
for the last 60 years) ・Considering that the export/import of new and
used automobiles affects the amount of plastic
waste in Japan, corrections are made to the
amounts of reclaimed plastic products and plastic
waste discharge related to the transport industry.
From 2004, corrections have also been made to the
amount of reclaimed plastic products in Japan
based on export/import amounts of four types of
home appliances (televisions, refrigerators, air
conditioners, and washing machines). ・Discharge ratios for domestic waste and indust-
rial waste have been estimated using a PWMI
dischargemodelfordemand-generatingelds.
2-3 Production and processing waste discharge
・Amount of production waste is not included in
amount of res in produc t ion , and amount
of processing waste is extrapolated from the re-sults of questionnaires.
2-4 Total plastic waste discharge
・Thisgureisthesumtotalofpost-useproducts
discharge and production and processing waste
discharge.
2-5 Breakdown of total plastic waste discharge by
resin type
・These breakdown figures were estimated from
amounts for pos t -u se produc ts d ischarge ,
production and processing waste discharge,breakdown of resin production, etc.
3-1 Mechanical recycling
・All mechanical recycling figures and break-
downs are extrapolated from the results of ques-
tionnaires sent to recycling companies.
・“Recycled material” indicates pellets, flakes,
uff,blocks,andingots,while“recycledproducts”
refertolmsheets,stakes,pipes,etc.
・Theexportgureunder“destinationofrecycling
use” for mechanical recycling is based on “scrap
plastic” statistics from Ministry of Finance trade
gures.
3-2 Densified-refuse derived fuel, liquefaction,
gasication, blast furnace raw material
・Figures for liquefaction, gasification, blast
furnace raw materials, and coke-oven chemical
materials approved as product recycling proceduresby the Containers and Packaging Recycling Law
have been deter mine d on the basi s of bid s
announced by the Japan Containers and Packaging
Recycling Association and results of question-
naires.
・The figure for densified-refuse derived fuel
includes energy recovery as cement kiln fuel and
power-generation.
3-3 Disposal and recovery of domestic waste
・Incineration/landllingratio
This ratio is determined on the basis of past
surveys conducted by PWMI.
・Incineration with power generation / incineration
with heat utilization “Incineration with power generation” means
incineration processing by an incinerator equipped
with power-generation facilities and “incineration
with heat utilization” means incineration proce-
ssing by an incinerator that, while not equipped
with power-generation facilities, has facilities for
utilizing heat externally. The ratios shown are
determined by PWMI surveys based on valuespublished by the Ministry of the Environment. The
announcement of these values, by the way, is now
made at an earlier date by the ministry, and this
report theref ore uses actual values from the
previousscalyear.
3-4 Disposal and recovery of industrial waste
・Disposal and recovery of industrial waste is
partially commissioned to local governments as
bus i ness- re la t ed waste . The ra t io of such
processing by business to that commissioned to
local governments is determined on the basis of PWMI surveys. The percentage breakdown of
commissioned processing into incineration with
power generation, incineration with heat utilization
facility, incineration without power generation or
heatutilizationfacility,andlandllingisbasedon
guresfordomesticwasteprocessing. The incineration/ landfi lling ratio in the
processing of industrial waste and the energy
recovery rate in incineration with power generation
are based on the latest surveys conducted by
PWMIinscalyears2006/2008.
(3) Disposal and recovery
8/3/2019 Plastic Japonez Reciclare Pina La 100%
http://slidepdf.com/reader/full/plastic-japonez-reciclare-pina-la-100 4/9
4 PWMINewsletter 5
Resin production, resin processing, and marketing of products Discharge Disposal and recovery
Non-use
Use
Industrial waste
Domestic waste
Densified-refuse derived fuel
350
Incineration with power generation
1,430
Incineration with
heat utilization facility800
Incineration without powergeneration or heat utilization facility
360
※6
Mechanical recycling
1,300
Liquefaction, gasification, blast furnace
110
Landfilling
340
Domesticplastic products
consumption
8,430
Post-useproductsdischarge
8,460
Totalplastic waste
discharge
9,120
Domesticwaste
4,440
Industrialwaste
4,680
Reclaimedproducts
540
Productionand
Processingwaste
660
Productionand
Processingwaste discharge
660Non-utilizedplastic waste
1,95021%
Utilizedplastic waste
7,18079%
Resin
export4,220
Resinimport
1,590
Productexport
720
Productimport
1,530
Liquidresin,etc.
1,020
Resinprocessing
waste
480
Resinproduction
waste
180
Incinerationwith heat
utilization facility
1,16013%
Incinerationwithout power
generation or heatutilization facility
1,07012%
Sum of waste
Incinerationwith powergeneration
3,28036%
Densified-refuse
derived fuel
4205%
Mechanicalrecycling
2,00022%
Liquefaction,gasification,blast furnace
3204%
Landfilling
88010%
Mechanical recycling
700
Densified-refuse derived fuel
70
Incineration with power generation
1,850
Incineration withheat utilization facility
360
Incineration without power generationor heat utilization facility
700
Liquefaction, gasification, blast furnace
220
Landfilling
540
Resinproduction
11,210
❶
❷
❸
❹
❺
❻
Note 1
Note 2
Note 3
Flowchart of plastic products,plastic waste and resource recovery2009 [ Unit; thousand tons ]
Note 1: Resin production does not include the quantity shown for resin production wasteNote 2: The quantity shown this year for reclaimed products is based on that of mechanical
recycling from the previous year (2,140 thousand tons) excluding exported portion(1,510 thousand tons) and the amount used for fiber from PET bottles (90 thousand tons).
Note 3: The figure for post-use products discharge is computed by a PWMI estimation systembased on usage for different demand areas and different resin types (from 1976) andproduct lifetimes for different demand areas (60-years discharge model created byPWMI).
Note 4: Some figures may not exactly match due to rounding.
※❶〜❻ corresponds to the graph of next page.
8/3/2019 Plastic Japonez Reciclare Pina La 100%
http://slidepdf.com/reader/full/plastic-japonez-reciclare-pina-la-100 5/9
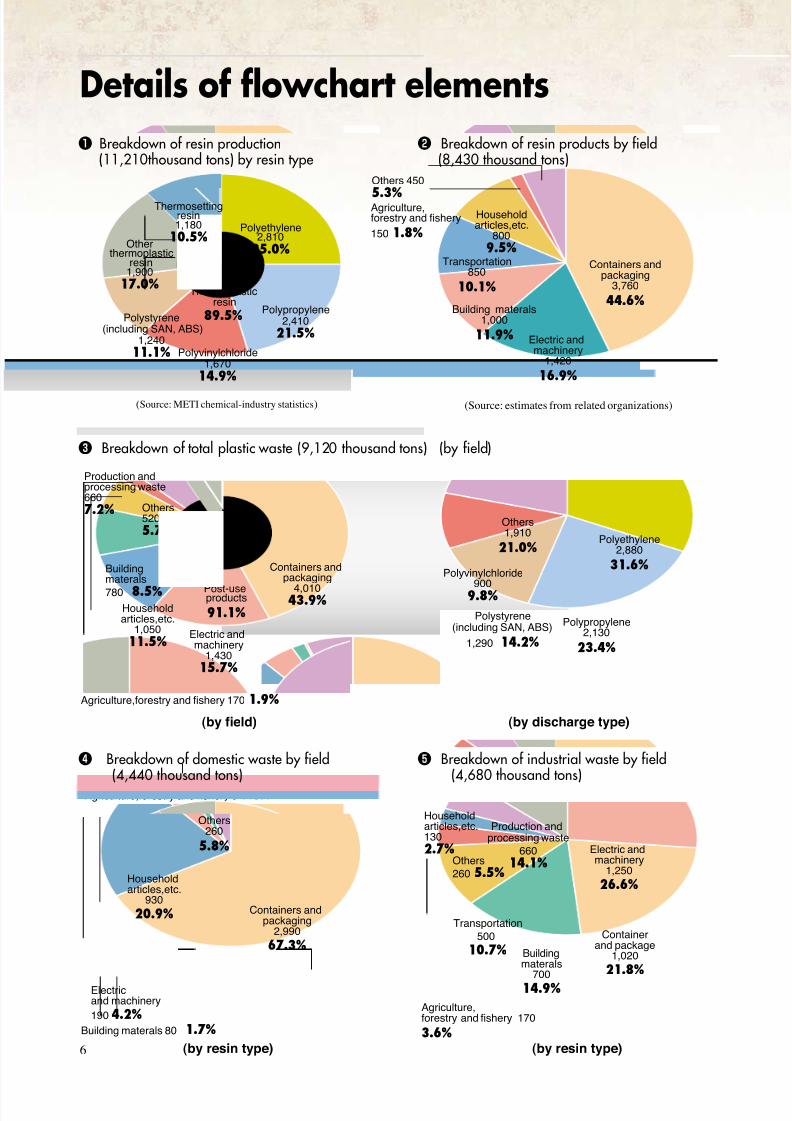
Containers andpackaging
3,760
44.6%Building materals
1,000
11.9% Electric andmachinery
1,420
16.9%
Transportation850
10.1%
Householdarticles,etc.
800
9.5%
Agriculture,forestry and fishery
150 1.8%
Others 450
5.3%
Thermoplasticresin
89.5%
Electric andmachinery
1,250
26.6%
Containerand package
1,020
21.8%
Transportation
500
10.7% Buildingmaterals
700
14.9%
Agriculture,forestry and fishery 170
3.6%
Householdarticles,etc.130
2.7%Others
260 5.5%
Production andprocessing waste
660
14.1%
Containers andpackaging
2,990
67.3%
Householdarticles,etc.
930
20.9%
Electricand machinery
190 4.2%
Others260
5.8%
Polyethylene2,810
25.0%
Polypropylene2,410
21.5%
Polyvinylchloride1,670
14.9%
Polystyrene(including SAN, ABS)
1,240
11.1%
Otherthermoplastic
resin1,900
17.0%
Transportration
500 5.5%Agriculture,forestry and fishery 170 1.9%
Agriculture,forestry and fishery 0 0.1%
Buildingmaterals
780 8.5%
Building materals 80 1.7%
Householdarticles,etc.
1,050
11.5%
Containers andpackaging
4,01043.9%
Electric andmachinery
1,430
15.7%
Others520
5.7%
Post-useproducts
91.1%
Thermosettingresin1,180
10.5%
Production andprocessing waste660
7.2%Others1,910
21.0%
Polystyrene(including SAN, ABS)
1,290 14.2%
Polyethylene2,880
31.6%
Polypropylene2,130
23.4%
Polyvinylchloride
9009.8%
Details of flowchart elements
❸ Breakdown of total plastic waste (9,120 thousand tons) (by field)
(Source: estimates from related organizations)
❶ Breakdown of resin production(11,210thousand tons) by resin type
❷ Breakdown of resin products by field(8,430 thousand tons)
(by field) (by discharge type)
(by resin type) (by resin type)
❺ Breakdown of industrial waste by field(4,680 thousand tons)
❹ Breakdown of domestic waste by field(4,440 thousand tons)
(Source: METI chemical-industry statistics)
6
8/3/2019 Plastic Japonez Reciclare Pina La 100%
http://slidepdf.com/reader/full/plastic-japonez-reciclare-pina-la-100 6/9
PWMI Newsletter 7
0 20 40 60 80 100 110 120 55010 30 50 70 90 130 5001 40 1 50 1 60 1 70 1 80 1 90 2 00 2 10 2 20 2 3 0 2 40
[ thousand tons ]
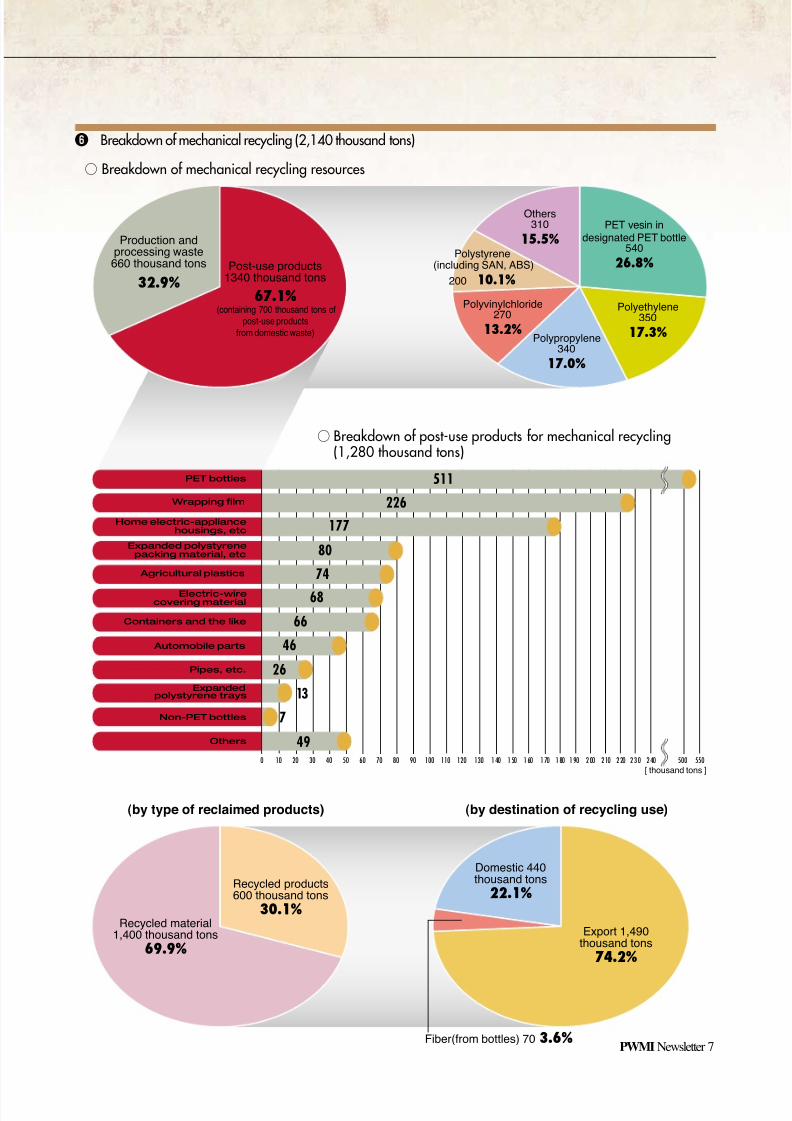
Post-use products1340 thousand tons
67.1%(containing 700 thousand tons of
post-use products
from domestic waste)
Production andprocessing waste660 thousand tons
32.9%
Export 1,490thousand tons
74.2%
Domestic 440thousand tons
22.1%
Fiber(from bottles) 70 3.6%
Recycled material1,400 thousand tons
69.9%
Recycled products600 thousand tons
30.1%
511
226
177
80
74
68
66
46
26
49
Others310
15.5%
Polypropylene340
17.0%
Polyethylene350
17.3%
PET vesin indesignated PET bottle
540
26.8%
Polyvinylchloride270
13.2%
Polystyrene(including SAN, ABS)
200 10.1%
7
13
Electric-wirecovering material
Containers and the like
Automobile parts
PET bottles
Expanded polystyrenepacking material, etc
Home electric-appliancehousings, etc
Wrapping film
Expandedpolystyrene trays
Pipes, etc.
Non-PET bottles
Agricultural plastics
Others
❻ Breakdown of mechanical recycling (2,140 thousand tons)
○ Breakdown of post-use products for mechanical recycling(1,280 thousand tons)
(by type of reclaimed products) (by destination of recycling use)
○ Breakdown of mechanical recycling resources
8/3/2019 Plastic Japonez Reciclare Pina La 100%
http://slidepdf.com/reader/full/plastic-japonez-reciclare-pina-la-100 7/9
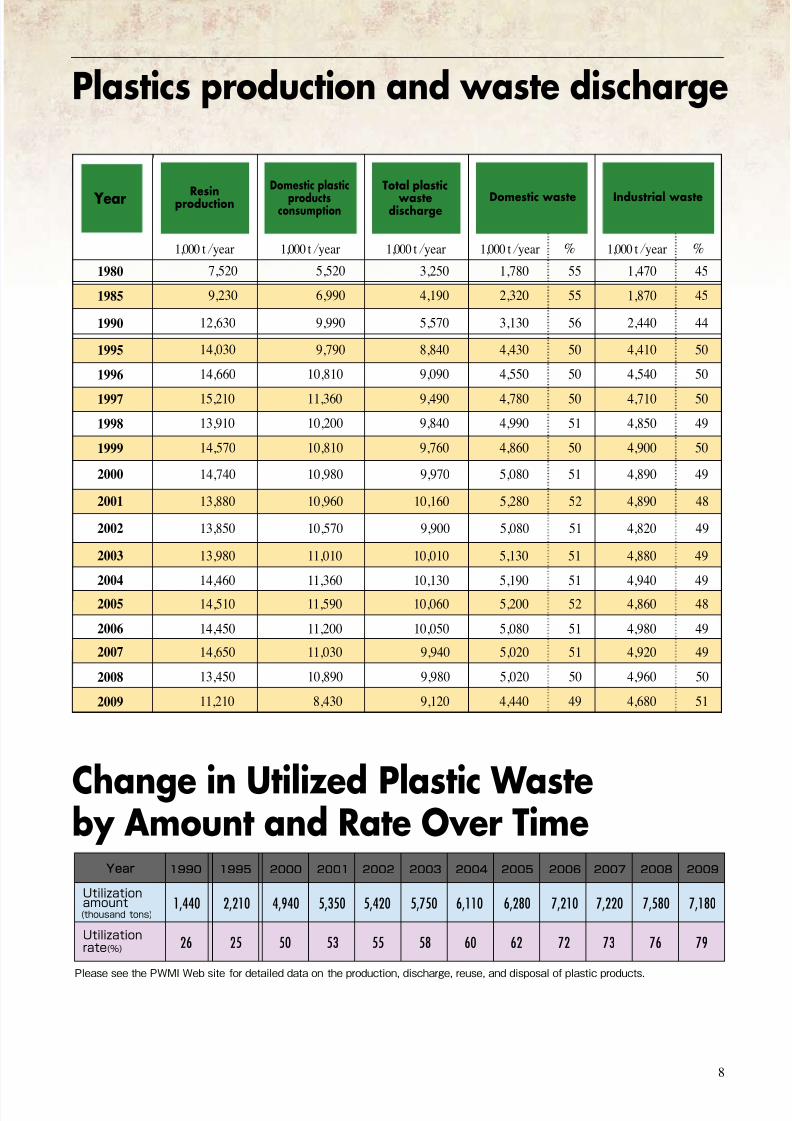
8
Plastics production and waste discharge
Change in Utilized Plastic Wasteby Amount and Rate Over Time
1980
1985
1990
1995
1996
1997
1998
1999
2000
7,520
9,230
12,630
14,030
14,660
15,210
13,910
14,570
14,740
5,520
6,990
9,990
9,790
10,810
11,360
10,200
10,810
10,980
3,250
4,190
5,570
8,840
9,090
9,490
9,840
9,760
9,970
1,780
2,320
3,130
4,430
4,550
4,780
4,990
4,860
5,080
55
55
56
50
50
50
51
50
51
45
45
44
50
50
50
49
50
49
1,470
1,870
2,440
4,410
4,540
4,710
4,850
4,900
4,890
1,000 t/year 1,000 t /year 1,000 t /year 1,000 t/year 1,000 t/year %%
Resinproduction YearDomestic plastic
productsconsumption
Total plastic
wastedischarge
2001 13,880 10,960 10,160 5,280 52 484,890
2002 13,850 10,570 9,900 5,080 51 494,820
2003 13,980 11,010 10,010 5,130 51 494,880
2004 14,460 11,360 10,130 5,190 51 494,940
2005 14,510 11,590 10,060 5,200 52 484,860
2007 14,650 11,030 9,940 5,020 51 494,920
2008 13,450 10,890 9,980 5,020 50 504,960
2009 11,210 8,430 9,120 4,440 49 514,680
2006 14,450 11,200 10,050 5,080 51 494,980
Industrial wasteDomestic waste
Year
Utilizationamount
1990 1995 2000 2001
1,440 2,210 4,940 5,350
26 25 50 53
2002
5,420
55
2003
5,750
58
2004
6,110
60
2005
6,280
62
2006
7,210
72
2007
7,220
73
2008
7,580
2009
7,180
76 79
(thousand tons)
Utilizationrate(%)
Please see the PWMI Web site for detailed data on the production, discharge, reuse, and disposal of plastic products.
8/3/2019 Plastic Japonez Reciclare Pina La 100%
http://slidepdf.com/reader/full/plastic-japonez-reciclare-pina-la-100 8/9
9
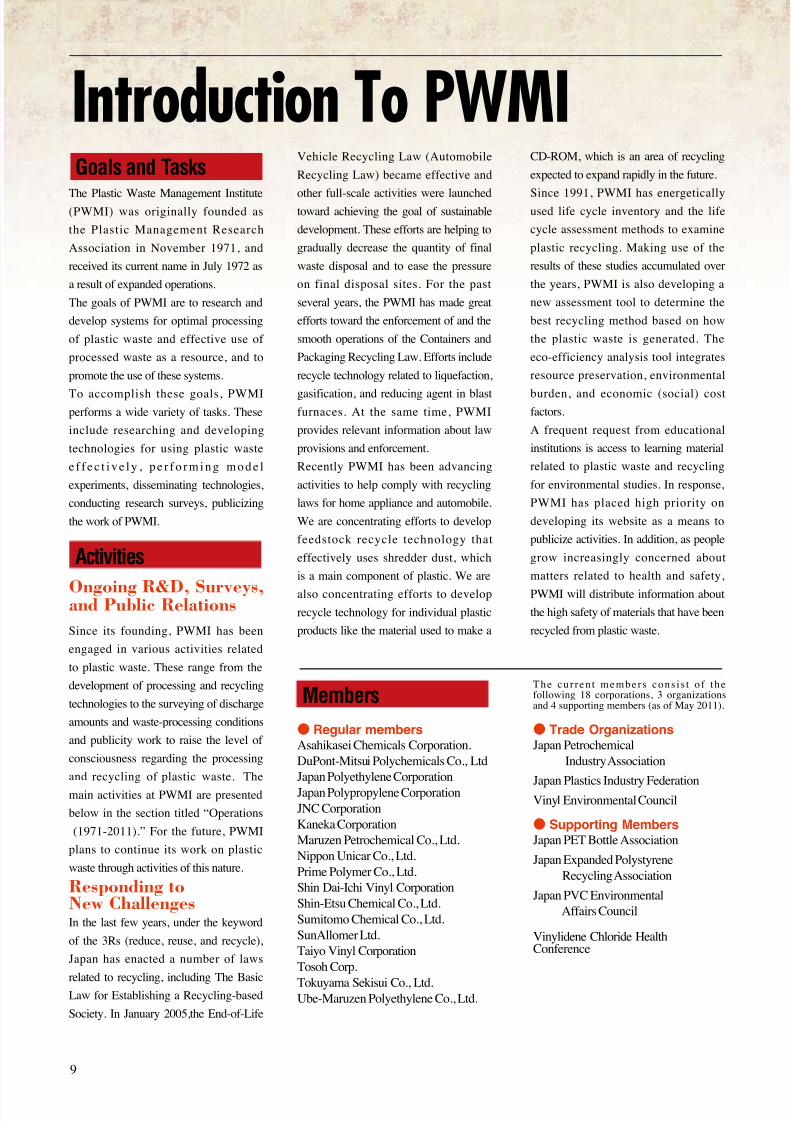
Goals and Tasks
Introduction To PWMI
● Regular membersAsahikasei Chemicals Corporation.
DuPont-Mitsui Polychemicals Co., Ltd
Japan Polyethylene Corporation
Japan Polypropylene Corporation
JNC Corporation
Kaneka Corporation
Maruzen Petrochemical Co., Ltd.
Nippon Unicar Co., Ltd.
Prime Polymer Co., Ltd.
Shin Dai-Ichi Vinyl Corporation
Shin-Etsu Chemical Co., Ltd.
Sumitomo Chemical Co., Ltd.
SunAllomer Ltd.
Taiyo Vinyl Corporation
Tosoh Corp.
Tokuyama Sekisui Co., Ltd.Ube-Maruzen Polyethylene Co., Ltd.
The Plastic Waste Management Institute(PWMI) was originally founded as
the Plastic Management Research
Association in November 1971, and
received its current name in July 1972 as
a result of expanded operations.
The goals of PWMI are to research and
develop systems for optimal processing
of plastic waste and effective use of
processed waste as a resource, and to
promote the use of these systems.
To accomplish these goals, PWMI
performs a wide variety of tasks. These
include researching and developing
technologies for using plastic waste
e f f ec t i ve l y , pe r f o r m i ng m ode l
experiments, disseminating technologies,
conducting research surveys, publicizing
the work of PWMI.
Since its founding, PWMI has been
engaged in various activities related
to plastic waste. These range from the
development of processing and recycling
technologies to the surveying of discharge
amounts and waste-processing conditions
and publicity work to raise the level of
consciousness regarding the processing
and recycling of plastic waste. The
main activities at PWMI are presented
below in the section titled “Operations
(1971-2011).” For the future, PWMI
plans to continue its work on plastic
waste through activities of this nature.
In the last few years, under the keyword
of the 3Rs (reduce, reuse, and recycle),
Japan has enacted a number of laws
related to recycling, including The BasicLaw for Establishing a Recycling-based
Society. In January 2005,the End-of-Life
Vehicle Recycling Law (Automobile
Recycling Law) became effective and
other full-scale activities were launchedtoward achieving the goal of sustainable
development. These efforts are helping to
gradually decrease the quantity of final
waste disposal and to ease the pressure
on final disposal sites. For the past
several years, the PWMI has made great
efforts toward the enforcement of and the
smooth operations of the Containers and
Packaging Recycling Law. Efforts include
recycle technology related to liquefaction,
gasification, and reducing agent in blast
furnaces. At the same time, PWMI
provides relevant information about law
provisions and enforcement.
Recently PWMI has been advancing
activities to help comply with recycling
laws for home appliance and automobile.
We are concentrating efforts to develop
feedstock recycle technology that
effectively uses shredder dust, which
is a main component of plastic. We are
also concentrating efforts to develop
recycle technology for individual plastic
products like the material used to make a
CD-ROM, which is an area of recycling
expected to expand rapidly in the future.
Since 1991, PWMI has energeticallyused life cycle inventory and the life
cycle assessment methods to examine
plastic recycling. Making use of the
results of these studies accumulated over
the years, PWMI is also developing a
new assessment tool to determine the
best recycling method based on how
the plastic waste is generated. The
eco-efficiency analysis tool integrates
resource preservation, environmental
burden, and economic (social) cost
factors.
A frequent request from educational
institutions is access to learning material
related to plastic waste and recycling
for environmental studies. In response,
PWMI has placed high priority on
developing its website as a means to
publicize activities. In addition, as people
grow increasingly concerned about
matters related to health and safety,
PWMI will distribute information about
the high safety of materials that have been
recycled from plastic waste.
● Trade OrganizationsJapan Petrochemical
Industry Association
Japan Plastics Industry FederationVinyl Environmental Council
● Supporting MembersJapan PET Bottle Association
Japan Expanded Polystyrene
Recycling Association
Japan PVC Environmental
Affairs Council
Vinylidene Chloride HealthConference
The cur ren t members cons i s t o f thefollowing 18 corporations, 3 organizationsand 4 supporting members (as of May 2011).
Activities
Members
Ongoing R&D, Surveys,and Public Relations
Responding toNew Challenges
8/3/2019 Plastic Japonez Reciclare Pina La 100%
http://slidepdf.com/reader/full/plastic-japonez-reciclare-pina-la-100 9/9
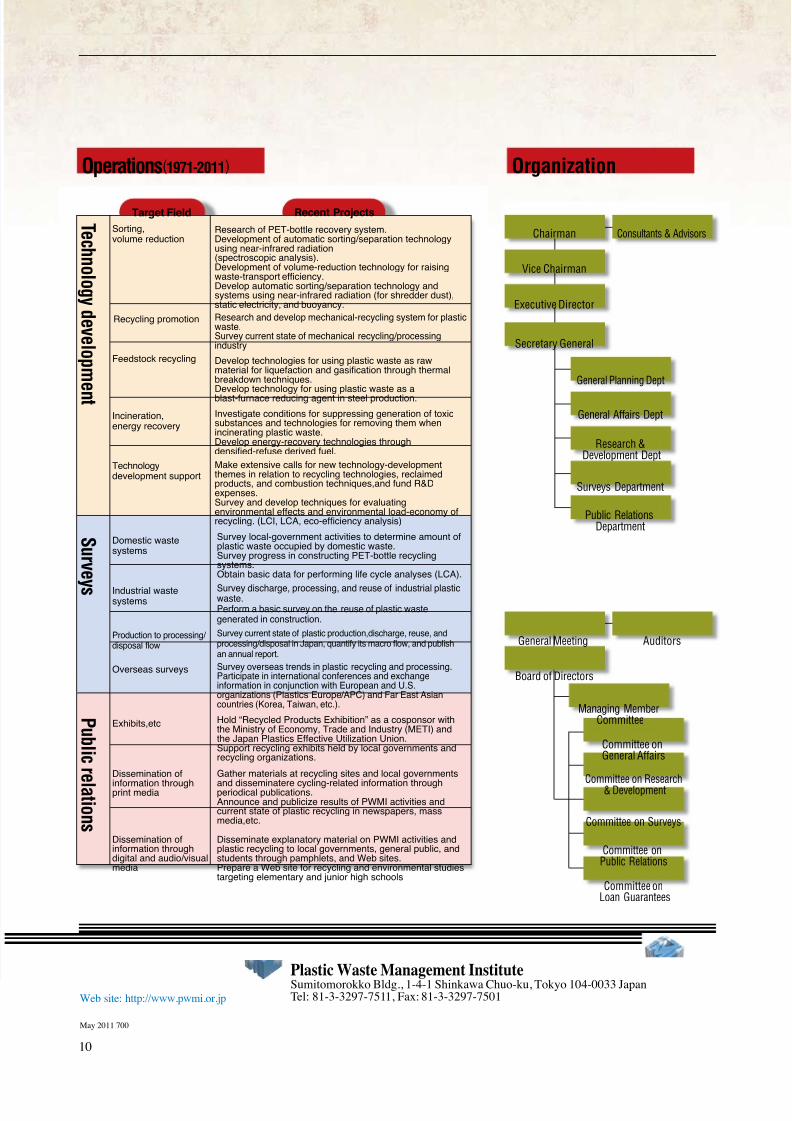
Target Field Recent Projects
Dissemination ofinformation throughdigital and audio/visualmedia
Disseminate explanatory material on PWMI activities andplastic recycling to local governments, general public, andstudents through pamphlets, and Web sites.Prepare a Web site for recycling and environmental studiestargeting elementary and junior high schools
Gather materials at recycling sites and local governments
and disseminatere cycling-related information throughperiodical publications.Announce and publicize results of PWMI activities andcurrent state of plastic recycling in newspapers, massmedia,etc.
Hold “Recycled Products Exhibition” as a cosponsor withthe Ministry of Economy, Trade and Industry (METI) andthe Japan Plastics Effective Utilization Union.Support recycling exhibits held by local governments andrecycling organizations.
Survey overseas trends in plastic recycling and processing.Participate in international conferences and exchangeinformation in conjunction with European and U.S.organizations (Plastics Europe/APC) and Far East Asiancountries (Korea, Taiwan, etc.).
Survey current state of plastic production,discharge, reuse, andprocessing/disposal in Japan, quantify its macro flow, and publishan annual report.
Survey discharge, processing, and reuse of industrial plasticwaste.Perform a basic survey on the reuse of plastic wastegenerated in construction.
Survey local-government activities to determine amount ofplastic waste occupied by domestic waste.Survey progress in constructing PET-bottle recyclingsystems.Obtain basic data for performing life cycle analyses (LCA).
Investigate conditions for suppressing generation of toxicsubstances and technologies for removing them whenincinerating plastic waste.Develop energy-recovery technologies throughdensified-refuse derived fuel.
Make extensive calls for new technology-developmentthemes in relation to recycling technologies, reclaimedproducts, and combustion techniques,and fund R&Dexpenses.Survey and develop techniques for evaluatingenvironmental effects and environmental load-economy ofrecycling. (LCI, LCA, eco-efficiency analysis)
Develop technologies for using plastic waste as rawmaterial for liquefaction and gasification through thermalbreakdown techniques.
Develop technology for using plastic waste as ablast-furnace reducing agent in steel production.
Research and develop mechanical-recycling system for plasticwaste.Survey current state of mechanical recycling/processingindustry
Research of PET-bottle recovery system.Development of automatic sorting/separation technologyusing near-infrared radiation(spectroscopic analysis).Development of volume-reduction technology for raisingwaste-transport efficiency.Develop automatic sorting/separation technology andsystems using near-infrared radiation (for shredder dust),static electricity, and buoyancy.
Dissemination of
information throughprint media
Exhibits,etc
Overseas surveys
Production to processing/ disposal flow
Industrial wastesystems
Incineration,energy recovery
Technologydevelopment support
Domestic wastesystems
Recycling promotion
Feedstock recycling
Sorting,volume reduction
T e c h n o l o g y d e v e l o p m
e n t
P u b l i c r
e l a t i o n s
S u r v e
y s
10
Plastic Waste Management InstituteSumitomorokko Bldg., 1-4-1 Shinkawa Chuo-ku, Tokyo 104-0033 JapanTel: 81-3-3297-7511, Fax: 81-3-3297-7501Web site: http://www.pwmi.or.jp
May 2011 700
OrganizationOperations(1971-2011)
Chairman
AuditorsGeneral Meeting
Board of Directors
Committee onGeneral Affairs
Committee on Research& Development
Committee on Surveys
Committee onPublic Relations
Committee onLoan Guarantees
Managing MemberCommittee
Vice Chairman
Executive Director
Secretary General
General Planning Dept
General Affairs Dept
Surveys Department
Public RelationsDepartment
Research &Development Dept
Consultants & Advisors