Liviu-Cristian Mihailescu - Europapublications.jrc.ec.europa.eu/repository/bitstream... ·...
240
Neutron (n,xnγ) cross-section measurements for 52 Cr, 209 Bi and 206,207,208 Pb from threshold up to 20 MeV Liviu-Cristian Mihailescu Institute for Reference Materials and Measurements 2006 EUR 22343 EN
Transcript of Liviu-Cristian Mihailescu - Europapublications.jrc.ec.europa.eu/repository/bitstream... ·...

Neutron (n,xnγγγγ) cross-section measurements for
52Cr,
209Bi and
206,207,208Pb from threshold
up to 20 MeV
Liviu-Cristian Mihailescu
Institute for Reference Materials and Measurements
2006
EUR 22343 EN

The mission of IRMM is to promote a common and reliable European measurement system in support of EU policies.
European Commission Directorate-General Joint Research Centre Institute for Reference Materials and Measurements Contact information Arjan Plompen Address: Retieseweg 111, B-2440 Geel, Belgium E-mail: [email protected] Tel.: +32-14-571 381 Fax: +32-14-571 376 http://www.irmm.jrc.be http://www.jrc.cec.eu.int Legal Notice Neither the European Commission nor any person acting on behalf of the Commission is responsible for the use which might be made of this publication. A great deal of additional information on the European Union is available on the Internet. It can be accessed through the Europa server http://europa.eu EUR 22343 EN ISBN 92-79-02885-5 ISSN 1018-5593 Luxembourg: Office for Official Publications of the European Communities © European Communities, 2006 Reproduction is authorised provided the source is acknowledged Printed in Belgium


University of Bucharest
Faculty of Physics
Neutron (n,xnγ) cross-section measurements
for 52Cr,209Bi and 206,207,208Pb from thresholdup to 20 MeV
by
Liviu-Cristian Mihailescu
Thesis submitted for the degree of Doctor of Science
Promotor:
Prof. Dr. D. Bucurescu
Academic year 2005 - 2006


.
Neutron (n,xnγ) cross-section measurements
for 52Cr,209Bi and 206,207,208Pb from thresholdup to 20 MeV
by
Liviu-Cristian Mihailescu
This thesis is based on the research performed under the dailysupervision of Dr. A. J. M. Plompen
This investigation is part of the research program of the Joint ResearchCentre of the European Comission and has been carried out at the
Institute for Reference Materials and Measurements (IRMM) in Geel,Belgium

2

Contents
List of Figures x
List of Tables 1
1 Introduction 31.1 The aim of this work . . . . . . . . . . . . . . . . . . . . . . . . . . . 31.2 Neutron inelastic scattering, (n,2n) and (n,3n) cross-sections . . . . . 41.3 Motivation of the measurements . . . . . . . . . . . . . . . . . . . . . 5
1.3.1 Waste transmutation in ADS . . . . . . . . . . . . . . . . . . 61.3.2 Benchmark for the nuclear codes . . . . . . . . . . . . . . . . 7
1.4 Theoretical predictions of the inelastic, (n,2n) and (n,3n) reactioncross-sections and nuclear codes . . . . . . . . . . . . . . . . . . . . . 8
1.5 Structure of this work . . . . . . . . . . . . . . . . . . . . . . . . . . 10
2 Measurements of the (n,xnγ) cross-sections with large volume HPGedetectors 132.1 The current standard measurement techniques . . . . . . . . . . . . . 13
2.1.1 The (n,n’)-technique . . . . . . . . . . . . . . . . . . . . . . . 142.1.2 The (n,xnγ)-technique . . . . . . . . . . . . . . . . . . . . . . 14
2.2 Characteristics of the time-of-flight measurements . . . . . . . . . . . 182.3 Cross-sections measurement by γ-ray spectroscopy with HPGe detectors 19
2.3.1 Properties of HPGe detectors . . . . . . . . . . . . . . . . . . 192.3.2 Gamma ray angular distribution . . . . . . . . . . . . . . . . . 262.3.3 Angle integration - Gauss quadrature . . . . . . . . . . . . . . 29
2.4 Neutron beam properties at GELINA . . . . . . . . . . . . . . . . . . 32
3 Experimental setup for the (n,xnγ) cross-section measurements atGELINA 373.1 Experimental setup . . . . . . . . . . . . . . . . . . . . . . . . . . . . 38
3.1.1 HPGe detectors . . . . . . . . . . . . . . . . . . . . . . . . . . 383.1.2 Fission chamber . . . . . . . . . . . . . . . . . . . . . . . . . . 383.1.3 Samples . . . . . . . . . . . . . . . . . . . . . . . . . . . . . . 40
3.2 Data acquisition system with conventional electronics . . . . . . . . . 413.2.1 The electronics . . . . . . . . . . . . . . . . . . . . . . . . . . 413.2.2 The pulse amplitude channel . . . . . . . . . . . . . . . . . . . 43
i
ii
3.2.3 The time-of-flight channel . . . . . . . . . . . . . . . . . . . . 453.2.4 Gamma flash rejection . . . . . . . . . . . . . . . . . . . . . . 473.2.5 HPGe absolute peak efficiency measurement . . . . . . . . . . 48
3.3 Data analysis . . . . . . . . . . . . . . . . . . . . . . . . . . . . . . . 493.3.1 Differential gamma production cross-section calculation . . . . 503.3.2 Sorting the HPGe data . . . . . . . . . . . . . . . . . . . . . . 503.3.3 HPGe efficiency corrections . . . . . . . . . . . . . . . . . . . 513.3.4 Neutron fluence . . . . . . . . . . . . . . . . . . . . . . . . . . 543.3.5 Grouping the time-of-flight bins . . . . . . . . . . . . . . . . . 543.3.6 Multiple scattering and neutron flux attenuation . . . . . . . . 553.3.7 Measurement uncertainties . . . . . . . . . . . . . . . . . . . . 56
3.4 Conclusions . . . . . . . . . . . . . . . . . . . . . . . . . . . . . . . . 57
4 Data acquisition system with a fast digitizer 594.1 The goal of a new acquisition system . . . . . . . . . . . . . . . . . . 604.2 Working principle of a fast digitizer . . . . . . . . . . . . . . . . . . . 604.3 Digital algorithms for signal analysis . . . . . . . . . . . . . . . . . . 62
4.3.1 Auxiliary algorithms . . . . . . . . . . . . . . . . . . . . . . . 624.3.2 Timing algorithms . . . . . . . . . . . . . . . . . . . . . . . . 664.3.3 Pulse amplitude algorithm - trapezoid filter . . . . . . . . . . 69
4.4 Results of the tested algorithms . . . . . . . . . . . . . . . . . . . . . 724.4.1 Start-stop experimental setup for testing different algorithms . 724.4.2 Results of the timing algorithms . . . . . . . . . . . . . . . . . 734.4.3 Results of the amplitude algorithm . . . . . . . . . . . . . . . 774.4.4 Maximum counting rate . . . . . . . . . . . . . . . . . . . . . 80
4.5 Electronic scheme for the t.o.f. measurement with the digitizer . . . . 814.6 Results of the (n,xnγ) cross-section measurement with the digitizer . 82
4.6.1 Absolute efficiency calibration of the fast digitizer . . . . . . . 824.6.2 Amplitude and t.o.f. spectra . . . . . . . . . . . . . . . . . . . 854.6.3 Differential gamma production cross-section . . . . . . . . . . 85
4.7 Conclusions . . . . . . . . . . . . . . . . . . . . . . . . . . . . . . . . 87
5 Results and discussion 895.1 52Cr neutron inelastic scattering and (n,2n) cross-sections . . . . . . 89
5.1.1 Introduction . . . . . . . . . . . . . . . . . . . . . . . . . . . . 895.1.2 Gamma production cross-sections . . . . . . . . . . . . . . . . 905.1.3 Total inelastic and level cross-sections . . . . . . . . . . . . . . 995.1.4 Conclusions . . . . . . . . . . . . . . . . . . . . . . . . . . . . 103
5.2 209Bi neutron inelastic scattering and (n,2n) cross-sections . . . . . . 1055.2.1 Introduction . . . . . . . . . . . . . . . . . . . . . . . . . . . . 1055.2.2 Gamma production cross-sections . . . . . . . . . . . . . . . . 1055.2.3 Total inelastic and level cross-section . . . . . . . . . . . . . . 1235.2.4 Conclusions . . . . . . . . . . . . . . . . . . . . . . . . . . . . 129
5.3 206Pb neutron inelastic scattering and (n,2n) cross-sections . . . . . . 1305.3.1 Introduction . . . . . . . . . . . . . . . . . . . . . . . . . . . . 130

iii
5.3.2 Gamma production cross-sections . . . . . . . . . . . . . . . . 1305.3.3 Total inelastic and level cross-sections . . . . . . . . . . . . . . 1425.3.4 Conclusions . . . . . . . . . . . . . . . . . . . . . . . . . . . . 147
5.4 207Pb neutron inelastic scattering and (n,2n) cross-sections . . . . . . 1495.4.1 Introduction . . . . . . . . . . . . . . . . . . . . . . . . . . . . 1495.4.2 Gamma production cross-sections . . . . . . . . . . . . . . . . 1525.4.3 Total inelastic and level cross-sections . . . . . . . . . . . . . . 1625.4.4 Conclusions . . . . . . . . . . . . . . . . . . . . . . . . . . . . 165
5.5 208Pb neutron inelastic scattering, (n,2n) and (n,3n) cross-sections . 1685.5.1 Introduction . . . . . . . . . . . . . . . . . . . . . . . . . . . . 1685.5.2 Gamma production cross-sections . . . . . . . . . . . . . . . . 1705.5.3 Total inelastic and level cross-sections . . . . . . . . . . . . . . 1835.5.4 Conclusions . . . . . . . . . . . . . . . . . . . . . . . . . . . . 188
6 Conclusions 191
Bibliography 194
Acknowledgements 208
Summary 209
Rezumat 214

iv
List of Figures
1.1 Schematic representation of the neutron inelastic and (n,2n) reactions. 4
2.1 Simplified level scheme of 52Cr . . . . . . . . . . . . . . . . . . . . . . 15
2.2 Schematic representation of the band structure in a semiconductor . . 21
2.3 Schematic representation of an HPGe detector . . . . . . . . . . . . . 22
2.4 Shapes for a coaxial semiconductor detector . . . . . . . . . . . . . . 23
2.5 Schematic representation of a preamplifier . . . . . . . . . . . . . . . 24
2.6 Calculated and experimental signals at the preamplifier output of alarge volume HPGe detector. . . . . . . . . . . . . . . . . . . . . . . . 26
2.7 Schematic representation of the inelastic scattering . . . . . . . . . . 27
2.8 Typical angular distribution shapes . . . . . . . . . . . . . . . . . . . 29
2.9 Even order Legendre polynomials. . . . . . . . . . . . . . . . . . . . . 31
2.10 Neutron fluence measured at 200 m flight path length. . . . . . . . . 32
2.11 Beam collimation for the Flight Path 3. . . . . . . . . . . . . . . . . . 33
2.12 Amplitude and t.o.f. spectra of the scattered gamma-flash on thesample. . . . . . . . . . . . . . . . . . . . . . . . . . . . . . . . . . . . 35
3.1 Detectors setup at the 200 m flight path station. . . . . . . . . . . . . 39
3.2 The electronic scheme of the conventional acquisition system. . . . . . 42
3.3 Amplitude spectrum of an HPGe detector for 52Cr(n,n’γ)52Cr reaction. 44
3.4 Amplitude spectrum for the (n,2n) and (n,3n) reactions on 208Pbsample. . . . . . . . . . . . . . . . . . . . . . . . . . . . . . . . . . . . 44
3.5 The time resolution spectra of the large volume HPGe detectors withconventional electronics. . . . . . . . . . . . . . . . . . . . . . . . . . 45
3.6 The dependence of the time resolution spectra on the CFD threshold 46
3.7 Comparison of the efficiency measurement between the two operationmodes of the MMPM: free mode and coincidence mode. . . . . . . . . 49
3.8 Comparison between the measured and the MCNP calculated valuesof the detector efficiency. . . . . . . . . . . . . . . . . . . . . . . . . . 52
3.9 The ratio between the measured acquisition system efficiency and theMCNP calculation. . . . . . . . . . . . . . . . . . . . . . . . . . . . . 52
3.10 Example of the HPGe detector absolute peak efficiencies for 208Pbsample. . . . . . . . . . . . . . . . . . . . . . . . . . . . . . . . . . . . 53
3.11 The fission chamber amplitude spectrum. . . . . . . . . . . . . . . . . 55
3.12 The neutron flux attenuation and multiple scattering coefficient. . . . 56
v
vi
4.1 The HPGe preamplifier output recorded with the fast digitizer . . . . 614.2 Analog shaping circuits . . . . . . . . . . . . . . . . . . . . . . . . . . 644.3 Representation of the LET and ELET timing methods. . . . . . . . . 674.4 Representation of the CFD timing methods. . . . . . . . . . . . . . . 684.5 Pulse shaping procedures: cusp-like, triangular and trapezoidal shaping 704.6 The output signal of the trapezoid algorithm. . . . . . . . . . . . . . 714.7 Start-stop experimental setup for testing different signal processing
algorithms. . . . . . . . . . . . . . . . . . . . . . . . . . . . . . . . . 724.8 Results of LET algorithm . . . . . . . . . . . . . . . . . . . . . . . . 744.9 Results of the ELET algorithm . . . . . . . . . . . . . . . . . . . . . 754.10 The dependence of the resolution of the CFD algorithm on TFA pa-
rameters differentiation and integration time. . . . . . . . . . . . . . . 754.11 The dependence of the CFD algorithm resolution on the fraction f
and delay. . . . . . . . . . . . . . . . . . . . . . . . . . . . . . . . . . 764.12 The comparison of the time resolution with the digitizer and conven-
tional electronics . . . . . . . . . . . . . . . . . . . . . . . . . . . . . 764.13 Results of the trapezoid algorithm . . . . . . . . . . . . . . . . . . . . 784.14 Comparison of the 60Co amplitude spectra with the digitizer and with
the conventional electronics. . . . . . . . . . . . . . . . . . . . . . . . 784.15 Rate tests for the Acqiris DC440 digitizer. . . . . . . . . . . . . . . . 804.16 The t.o.f. setup based on the fast digitizer Acqiris DC440. . . . . . . 814.17 Efficiency measurement with the fast digitizer . . . . . . . . . . . . . 834.18 The ratio between the measured detector efficiencies with the digitizer
and the simulated efficiencies with the MCNP . . . . . . . . . . . . . 834.19 Detection efficiency comparison between the digitizer and the con-
ventional acquisition system. . . . . . . . . . . . . . . . . . . . . . . . 844.20 Integral amplitude and t.o.f. spectra for the 208Pb measurement with
the digitizer . . . . . . . . . . . . . . . . . . . . . . . . . . . . . . . . 854.21 Differential gamma production cross-sections obtained with the fast
digitizer for 208Pb. . . . . . . . . . . . . . . . . . . . . . . . . . . . . 864.22 High resolution differential gamma production cross-sections obtained
with the fast digitizer for 206Pb. . . . . . . . . . . . . . . . . . . . . . 86
5.1 Differential gamma production cross-section for the 1434.07 keV tran-sition from 52Cr at 110o and 150o. . . . . . . . . . . . . . . . . . . . . 90
5.2 Resonance structures in the differential gamma production cross-section of the 1434.07 keV transition of 52Cr. . . . . . . . . . . . . . . 91
5.3 Smooth curve for the integral gamma production cross-section for the1434.07 keV transition in 52Cr. . . . . . . . . . . . . . . . . . . . . . . 91
5.4 Full energy resolution for the integral gamma production cross-sectionfor the 1434.07 keV transition in 52Cr. . . . . . . . . . . . . . . . . . 92
5.5 Differential gamma production cross-section for the 935.54 keV tran-sition in 52Cr at 110o and 150o. . . . . . . . . . . . . . . . . . . . . . 93
5.6 Integral gamma production cross-section for the 935.54 keV transitionin 52Cr. . . . . . . . . . . . . . . . . . . . . . . . . . . . . . . . . . . 94
vii
5.7 Differential gamma production cross-section for the 1530.67 keV tran-sition in 52Cr at 110o and 150o. . . . . . . . . . . . . . . . . . . . . . 94
5.8 Integral gamma production cross-section for the 1530.67 keV and1333.65 keV transitions in 52Cr. . . . . . . . . . . . . . . . . . . . . . 95
5.9 Integral gamma production cross-section for transition that decayfrom higher excited levels of 52Cr. . . . . . . . . . . . . . . . . . . . . 96
5.10 The peaks from 52Cr(n,2n)51Cr HPGe yield integrated over neutronenergies between 12 MeV and 20 MeV . . . . . . . . . . . . . . . . . 98
5.11 52Cr(n,2n)51Cr gamma production cross-section . . . . . . . . . . . . 98
5.12 Total uncertainty for the gamma production cross-section of the 749 keVtransition from the 52Cr(n,2n)51Cr reaction. . . . . . . . . . . . . . . 99
5.13 Total inelastic cross-section of 52Cr. . . . . . . . . . . . . . . . . . . . 100
5.14 Cross-section of the 1434.09 keV level and its corresponding totaluncertainty. . . . . . . . . . . . . . . . . . . . . . . . . . . . . . . . . 101
5.15 Cross-section of the 2369.63 keV and 2646.9 keV levels. . . . . . . . . 101
5.16 Cross-section of the higher energy levels. . . . . . . . . . . . . . . . . 102
5.17 The γ-ray spectrum of an HPGe detector with the 209Bi sample. . . . 106
5.18 Simplified level scheme of 209Bi . . . . . . . . . . . . . . . . . . . . . 107
5.19 Differential gamma production cross-section for the 896.28 keV tran-sition in 209Bi. . . . . . . . . . . . . . . . . . . . . . . . . . . . . . . . 108
5.20 Integral gamma production cross-section for the 896.28 keV transitionin 209Bi. . . . . . . . . . . . . . . . . . . . . . . . . . . . . . . . . . . 109
5.21 High resolution integral gamma production cross-section for the 896 keVtransition in 209Bi. . . . . . . . . . . . . . . . . . . . . . . . . . . . . 109
5.22 Differential gamma production cross-section for the 1608.53 keV tran-sition in 209Bi . . . . . . . . . . . . . . . . . . . . . . . . . . . . . . . 110
5.23 Integral gamma production cross-section for the 1608.53 keV transi-tion in 209Bi . . . . . . . . . . . . . . . . . . . . . . . . . . . . . . . . 111
5.24 Differential gamma production cross-section for the 1608.53 keV tran-sition in 209Bi . . . . . . . . . . . . . . . . . . . . . . . . . . . . . . . 112
5.25 Integral gamma production cross-section for the 1546.51 keV and2492.9 keV transition in 209Bi . . . . . . . . . . . . . . . . . . . . . . 112
5.26 Integral gamma production cross-section for the transitions from higherlying levels in 209Bi -1- . . . . . . . . . . . . . . . . . . . . . . . . . . 113
5.27 Integral gamma production cross-section for the transitions from higherlying levels in 209Bi -2- . . . . . . . . . . . . . . . . . . . . . . . . . . 114
5.28 Integral gamma production cross-section for the transitions from higherlying levels in 209Bi -3- . . . . . . . . . . . . . . . . . . . . . . . . . . 115
5.29 Integral gamma production cross-section for the transitions from higherlying levels in 209Bi -4- . . . . . . . . . . . . . . . . . . . . . . . . . . 116
5.30 Integral gamma production cross-section for the transitions from higherlying levels in 209Bi -5- . . . . . . . . . . . . . . . . . . . . . . . . . . 117
5.31 Simplified level scheme of 208Bi . . . . . . . . . . . . . . . . . . . . . 120
5.32 The (n,2n) γ-ray spectrum of an HPGe detector with the 209Bi sample.121
viii
5.33 Integral gamma production cross-section for the transitions from the209Bi(n,2n)208Bi reaction. . . . . . . . . . . . . . . . . . . . . . . . . . 122
5.34 Total inelastic gamma production cross-section of 209Bi . . . . . . . . 123
5.35 High resolution data for the total inelastic gamma production cross-section of 209Bi . . . . . . . . . . . . . . . . . . . . . . . . . . . . . . 124
5.36 Cross-section of 896.29 keV excited level in 209Bi. . . . . . . . . . . . 125
5.37 Cross-section of levels with higher excited energy in 209Bi -1- . . . . . 127
5.38 Cross-section of levels with higher excited energy in 209Bi -1- . . . . . 128
5.39 Simplified level scheme of 206Pb . . . . . . . . . . . . . . . . . . . . . 131
5.40 The γ-ray spectrum of a HPGe detector with the 206Pb sample. . . . 132
5.41 Differential gamma production cross-section for the 803.06 keV tran-sition in 206Pb. . . . . . . . . . . . . . . . . . . . . . . . . . . . . . . 133
5.42 Full resolution gamma production cross-section for the 803.06 keVtransition in 206Pb. . . . . . . . . . . . . . . . . . . . . . . . . . . . . 133
5.43 Integral gamma production cross-section for the 803.06 keV transitionin 206Pb. . . . . . . . . . . . . . . . . . . . . . . . . . . . . . . . . . . 134
5.44 Differential gamma production cross-section for the 537.47 keV tran-sition in 206Pb. . . . . . . . . . . . . . . . . . . . . . . . . . . . . . . 135
5.45 Integral gamma production cross-section for the 537.47 keV transitionin 206Pb. . . . . . . . . . . . . . . . . . . . . . . . . . . . . . . . . . . 136
5.46 Integral gamma production cross-section for the transitions from higherlying levels in 206Pb -1- . . . . . . . . . . . . . . . . . . . . . . . . . . 137
5.47 Integral gamma production cross-section for the transitions from higherlying levels in 206Pb -2- . . . . . . . . . . . . . . . . . . . . . . . . . . 138
5.48 Integral gamma production cross-section for the transitions from higherlying levels in 206Pb -3- . . . . . . . . . . . . . . . . . . . . . . . . . . 139
5.49 γ-ray spectrum with the 206Pb sample integrated over neutron ener-gies above 8.1 MeV. . . . . . . . . . . . . . . . . . . . . . . . . . . . . 141
5.50 Integral production cross-section for the γ-rays from the 206Pb(n,2n)205Pbreaction. . . . . . . . . . . . . . . . . . . . . . . . . . . . . . . . . . . 142
5.51 Total neutron inelastic cross-section for 206Pb - smooth data. . . . . . 142
5.52 Total neutron inelastic cross-section for 206Pb - full resolution. . . . . 143
5.53 The cross-section of the 803.06 keV level in 206Pb. . . . . . . . . . . . 144
5.54 The cross-section of the excited levels above 1.3 MeV in 206Pb -1-. . . 145
5.55 The cross-section of the excited levels above 1.3 MeV in 206Pb -2-. . . 146
5.56 Simplified evaluated level scheme of 207Pb . . . . . . . . . . . . . . . 150
5.57 803 keV γ-ray yield from the 207Pb sample . . . . . . . . . . . . . . . 151
5.58 The γ-ray spectrum of an HPGe detector with the 207Pb sample. . . . 153
5.59 Differential gamma production cross-section for the 569.7 keV tran-sition in 207Pb. . . . . . . . . . . . . . . . . . . . . . . . . . . . . . . 153
5.60 Full resolution gamma production cross-section for the 569.7 keVtransition in 207Pb. . . . . . . . . . . . . . . . . . . . . . . . . . . . . 154
5.61 Integral gamma production cross-section for the 569.7 keV transitionin 207Pb. . . . . . . . . . . . . . . . . . . . . . . . . . . . . . . . . . . 154

ix
5.62 Differential gamma production cross-section for the 897.78 keV tran-sition in 207Pb. . . . . . . . . . . . . . . . . . . . . . . . . . . . . . . 155
5.63 Integral gamma production cross-section for the 897.78 keV transitionin 207Pb. . . . . . . . . . . . . . . . . . . . . . . . . . . . . . . . . . . 156
5.64 Integral gamma production cross-section for the transitions from higherlying levels in 207Pb -1- . . . . . . . . . . . . . . . . . . . . . . . . . . 157
5.65 Integral gamma production cross-section for the transitions from higherlying levels in 207Pb -2- . . . . . . . . . . . . . . . . . . . . . . . . . . 158
5.66 γ-rays spectrum for the 207Pb measurement integrated over neutronenergies above 8.1 MeV. . . . . . . . . . . . . . . . . . . . . . . . . . 160
5.67 Integral production cross-section of the γ-rays from the 207Pb(n,2n)206Pbreaction. . . . . . . . . . . . . . . . . . . . . . . . . . . . . . . . . . . 161
5.68 Total neutron inelastic cross-section for 207Pb - smooth data. . . . . . 1635.69 Total neutron inelastic cross-section for 207Pb - full resolution. . . . . 1635.70 The cross-section of the 569.7 keV level in 207Pb. . . . . . . . . . . . 1645.71 The cross-section of the excited levels above 570 keV in 207Pb -1-. . . 1665.72 Simplified evaluated level scheme of 208Pb . . . . . . . . . . . . . . . 1695.73 Background spectrum with the 208Pb sample in position and no beam.1705.74 The prompt γ-ray spectrum of an HPGe detector with the 208Pb sample.1715.75 Differential gamma production cross-section for the 2614.5 keV tran-
sition in 208Pb. . . . . . . . . . . . . . . . . . . . . . . . . . . . . . . 1725.76 Full resolution gamma production cross-section for the 2614.5 keV
transition in 208Pb. . . . . . . . . . . . . . . . . . . . . . . . . . . . . 1735.77 Integral gamma production cross-section for the 2614.5 keV transition
in 208Pb. . . . . . . . . . . . . . . . . . . . . . . . . . . . . . . . . . . 1735.78 Differential gamma production cross-section for the 583.19 keV tran-
sition in 208Pb. . . . . . . . . . . . . . . . . . . . . . . . . . . . . . . 1755.79 Integral gamma production cross-section for the 583.19 keV and 860.56 keV
transitions in 208Pb. . . . . . . . . . . . . . . . . . . . . . . . . . . . . 1755.80 Integral gamma production cross-section for the transitions from higher
lying levels in 208Pb -1- . . . . . . . . . . . . . . . . . . . . . . . . . . 1775.81 Integral gamma production cross-section for the transitions from higher
lying levels in 208Pb -2- . . . . . . . . . . . . . . . . . . . . . . . . . . 1785.82 Integral gamma production cross-section for the transitions from higher
lying levels in 208Pb -3- . . . . . . . . . . . . . . . . . . . . . . . . . . 1795.83 Integral gamma production cross-section for the transitions from higher
lying levels in 208Pb -4- . . . . . . . . . . . . . . . . . . . . . . . . . . 1805.84 γ-ray spectrum with the 208Pb sample integrated over neutron ener-
gies above 7.4 MeV. . . . . . . . . . . . . . . . . . . . . . . . . . . . . 1815.85 Integral cross-section of the γ-rays from the (n,2n) and (n,3n) reac-
tions on 208Pb. . . . . . . . . . . . . . . . . . . . . . . . . . . . . . . 1825.86 Total neutron inelastic cross-section for 208Pb. . . . . . . . . . . . . . 1845.87 The cross-section of the 2614.5 keV level in 208Pb. . . . . . . . . . . . 1855.88 The cross-section of the excited levels above 2614 keV in 208Pb -1-. . . 1865.89 The cross-section of the excited levels above 2614 keV in 208Pb -2-. . . 187

x
List of Tables
2.1 The roots and weights for integration of gamma-ray angular distrib-utions with the Gauss quadrature. . . . . . . . . . . . . . . . . . . . . 31
3.1 HPGe detectors used during the 5 runs with different samples . . . . 393.2 Samples dimensions and isotopic composition . . . . . . . . . . . . . 40
4.1 RMSnoise values with and without the detector coupled to the digitizerinput. . . . . . . . . . . . . . . . . . . . . . . . . . . . . . . . . . . . 63
4.2 HPGe detector amplitudes for different full scale range of the digitizer. 79
5.1 Branching ratios for levels in 209Bi nucleus. . . . . . . . . . . . . . . . 1195.2 Branching ratios for levels in 206Pb nucleus. . . . . . . . . . . . . . . 1405.3 Corrections for the isotopic composition of 207Pb sample . . . . . . . 1495.4 Branching ratios for levels in 207Pb nucleus. . . . . . . . . . . . . . . 1595.5 Corrections for the isotopic composition of 208Pb sample results . . . 1685.6 Branching ratios for levels in 208Pb nucleus. . . . . . . . . . . . . . . 180
6.1 The number of observed γ-ray in every studied reaction. . . . . . . . 192
1

2

Chapter 1
Introduction
1.1 The aim of this work
The need for energy in the future motivates a major part of the research that isdone in nuclear physics. Detailed calculations are needed for the design of the futuregeneration of nuclear reactors (e.g. Accelerator Driven Systems (ADS)) in order toincrease the safety of such devices and to reduce the construction costs. Reliablenuclear data are needed to increase the confidence in the reactor calculations. Suchnuclear data can be produced either directly from the experiments or indirectlywith nuclear codes. The latter one has the advantage to predict the nuclear dataat energies and for nuclei that are not easily accessed by the experiments. But, inorder to achieve a reliable prediction power, the nuclear codes need to be validatedby experimental results. Moreover, the present nuclear codes are able to predictonly average cross-sections, while the experiments show fine resonance structures inthe cross-sections of different reactions.
The goal of the present work can be divided in two parts. Firstly, one aimed tomeasure very precisely the cross-sections of the neutron inelastic scattering on fivedifferent isotopes: 52Cr, 209Bi and 206,207,208Pb. In addition to the neutron inelasticscattering, the (n,2n) cross-sections were measured for all five nuclei and the (n,3n)cross-section was measured for 208Pb. The energy range of interest for this setof experiments was from the inelastic threshold up to 20 MeV. The precision ofthe present experiments consists of unprecedented resolution in the energy of theincident neutron and in a total uncertainty of about 5 % for the main quantitiesthat were measured. Such precision of the data is needed for the applications. Toobtain this precision of the data, long data acquisition runs were expected.
Secondly, in order to increase the efficiency of the data acquisition, it was pro-posed to investigate the possibility to use a fast digitizer for the data acquisition inthe (n,xnγ) cross-sections measurements. This investigation went in parallel withthe (n,xnγ) cross-sections measurements with the conventional electronics. Follow-ing the feasibility tests, a new data acquisition system based on a fast digitizer wascreated and it can be used at GELINA for further measurements.
3
4 Introduction
Z,A Z,A+1 Z,A Z,A-1A
Ex
Sn
SnSnn
Sn
Sn+Tn
n
n’
n’’
n’
n’’
Exmax(Z,A+1)
Exmax(Z,A)
Exmax(Z,A-1)
γγγγ
γγγγ
γγγγ
γγγγ
γγγγ
γγγγn’’
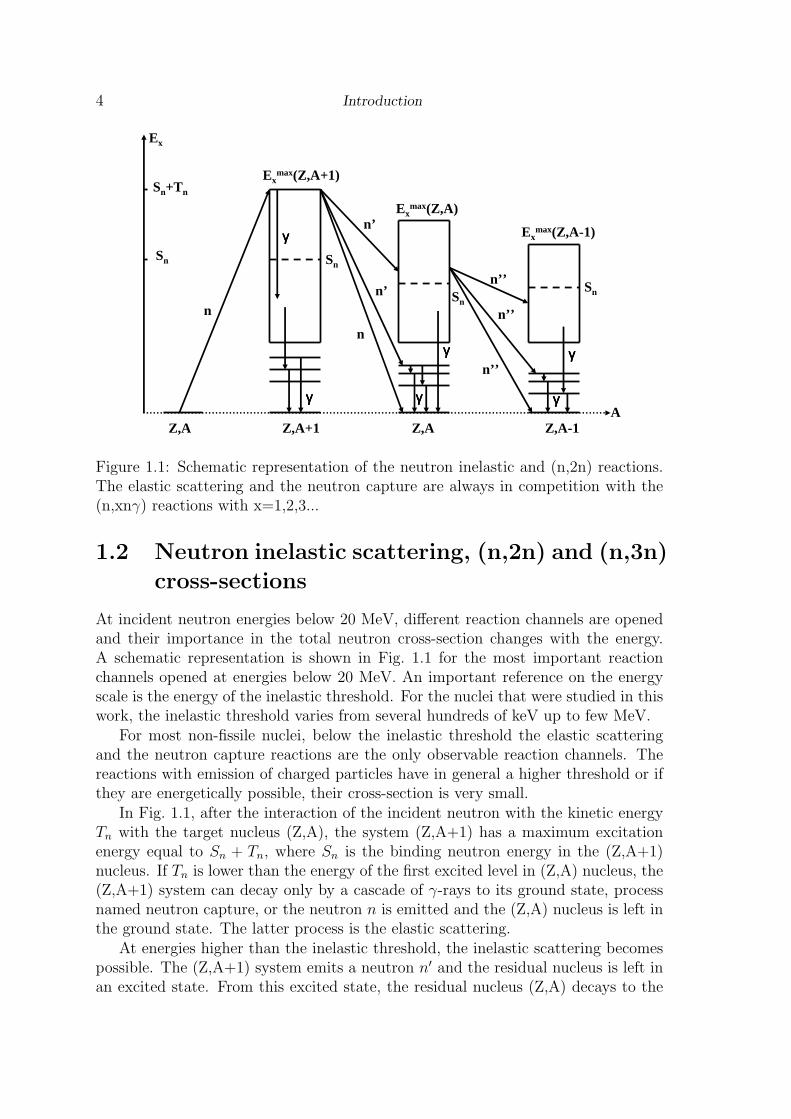
Figure 1.1: Schematic representation of the neutron inelastic and (n,2n) reactions.The elastic scattering and the neutron capture are always in competition with the(n,xnγ) reactions with x=1,2,3...
1.2 Neutron inelastic scattering, (n,2n) and (n,3n)
cross-sections
At incident neutron energies below 20 MeV, different reaction channels are openedand their importance in the total neutron cross-section changes with the energy.A schematic representation is shown in Fig. 1.1 for the most important reactionchannels opened at energies below 20 MeV. An important reference on the energyscale is the energy of the inelastic threshold. For the nuclei that were studied in thiswork, the inelastic threshold varies from several hundreds of keV up to few MeV.
For most non-fissile nuclei, below the inelastic threshold the elastic scatteringand the neutron capture reactions are the only observable reaction channels. Thereactions with emission of charged particles have in general a higher threshold or ifthey are energetically possible, their cross-section is very small.
In Fig. 1.1, after the interaction of the incident neutron with the kinetic energyTn with the target nucleus (Z,A), the system (Z,A+1) has a maximum excitationenergy equal to Sn + Tn, where Sn is the binding neutron energy in the (Z,A+1)nucleus. If Tn is lower than the energy of the first excited level in (Z,A) nucleus, the(Z,A+1) system can decay only by a cascade of γ-rays to its ground state, processnamed neutron capture, or the neutron n is emitted and the (Z,A) nucleus is left inthe ground state. The latter process is the elastic scattering.
At energies higher than the inelastic threshold, the inelastic scattering becomespossible. The (Z,A+1) system emits a neutron n′ and the residual nucleus is left inan excited state. From this excited state, the residual nucleus (Z,A) decays to the

February 2006 L.C.Mihailescu 5
ground state either directly through a single γ-ray, or through a cascade of γ-rays.
If the incident neutron energy exceeds the threshold of the (n,2n) reaction, theemission of the n′ neutron could be followed by the emission of a second neutronn′′ and the nucleus (Z,A-1) is produced. Differently to the inelastic scattering, theresidual nucleus (Z,A-1) can be left directly in the ground state after the emission ofthe two neutrons in the (n,2n) reaction. With the increase of the incident neutronenergy, more neutrons can be emitted.
In the other reaction channels that are open at energies below 20 MeV chargedparticles are emitted. In most of the cases, because of the Coulomb barrier, thesereactions with emission of charged particle have small cross-section compared withthe reactions described above.
The cross-sections of the reactions studied in this work (neutron inelastic, (n,2n)and (n,3n)) can be measured in two different ways: either the outgoing neutrons orthe γ-rays are detected. The latter were detected in the experiments described inthis work and the method will be named (n,xnγ)-technique. The main quantitiesthat are measured in such experiment are defined in the following.
The basic measured quantity in these experiments is the production cross-sectionof the γ-rays emitted by the residual nucleus. This is the probability that an inci-dent neutron interacts with a target nucleus and a given γ-ray is emitted. Thesecan be easily generalized to the other (n,xnγ) reactions with x=2,3.... The totalinelastic cross-section represents the probability that an incident neutron interactsinelastically with a target nucleus without any condition on the energy of the emit-ted γ-ray. In the inelastic scattering, the level cross-section is the probability thatthe residual nucleus is left in a given excited state directly after the emission of theneutron.
1.3 Motivation of the measurements
Despite the large number of experiments performed in the past, there is still a lotto be improved for the neutron cross-section data at energies below 20 MeV andespecially for the cross-sections of the (n,xnγ) reactions with x=1,2,3.
The existing experimental cross-sections data for (n,xnγ) (x=1,2,3) reaction on52Cr, 209Bi, 206Pb, 207Pb and 208Pb are in majority of the cases point data and inmany cases they contradict with each other. Moreover, the total uncertainty ofthe existing data did no meet the requirements of the applications. From previousmeasurements (ex. Ref. [99]) resonance structures were observed in the neutroninelastic scattering cross-sections at energies just above the inelastic threshold. Suchresonance structures can have an impact to the precise reactor calculations. Toimprove the cross-sections data for the 52Cr, 209Bi, 206Pb, 207Pb and 208Pb isotopes,a new set of measurements were needed that should cover the full energy range ofinterest, from the inelastic threshold up to 20 MeV with a very good neutron energyresolution.
The (n,xnγ) reactions represent an important energy loss mechanism. Comparedwith the elastic scattering, at least an energy equal to the excitation energy of the
6 Introduction
first excited level is lost in only one inelastic scattering. Much more energy islost in the (n,2n) and (n,3n) reactions. Moreover, in the (n,xnγ) reactions withx≥2 more neutrons are produced. Usually for materials like Cr, Bi and Pb, theinelastic process represents about 30% of the total neutron cross-section. Withthe increase of the energy of the incident neutron the (n,xnγ) reactions with x≥2enter in competition with the inelastic scattering and at the maximum they havecomparable cross-sections. Because of this, precise cross-sections for the (n,xnγ)reactions are needed for calculations of neutron propagations in applications. Thenew generation of nuclear reactors and in particular the Accelerator Driven Systemsused for waste transmutation are the immediate application where precise neutrondata are needed. Other application where such data may be used are the spallationtargets of different research facilities, the dosimetry calculations for the space crafts,the fusion reactors, production of isotopes for medicine or even in the prediction ofthe single upsets events in the electronic devices. From these applications, only theAccelerator Driven Systems will be described in the following. The use of precisenuclear data for benchmarking of the nuclear codes will be detailed as well.
1.3.1 Waste transmutation in ADS
The disposal of radioactive wastes resulting from industrial nuclear energy produc-tion has still to find a fully satisfactory solution, especially in terms of environmentaland social acceptability. One solution is to reduce the volume and the radio-toxicityof the waste before the final storage in deep geological repositories.
The volume and the radio-toxicity of the waste can be reduced both in criticalreactors and sub-critical accelerator driven system (ADS). Critical reactors, however,loaded with fuel containing large amounts of minor actinides pose safety problemscaused by unfavorable reactivity coefficients and small delayed neutron fraction.
The main characteristics of ADS are the sub-criticality and the fact that it allowsto reach maximum transmutation rates while operating in a safe manner. The ADSis a combination of a sub-critical core and an external neutron source which may be alinear accelerator or a cyclotron. The external neutrons are produced in a spallationreaction of the accelerated particles on a target with a high atomic number. Manyof the present designs for the ADS consider protons to be accelerated at energiesof the order of about 1 GeV. For a lead target one proton of an energy of 1 GeVproduces about 30 highly energetic neutrons.
Two are the main conditions that the accelerator that drives the ADS has tofulfill: beam powers in the MWatt range and an energetic efficiency of about 50 %,which means that the beam power represents about half of the consumed power. Forthe spallation target, the Pb-Bi eutectic is one of the most studied solutions. Suchtarget has the advantage of high Z number, implicitly producing a large numberof neutrons and has a low melting point of about 125oC. At these temperatures,vast experience exists already from the sodium cooled reactors. The Pb-Bi eutecticmixture can be used also for the cooling system, through natural convection.
The recent study of Aliberti [43] stressed the impact of the nuclear data uncer-tainties on the reactor parameters uncertainties in the particular case of the ADS.
February 2006 L.C.Mihailescu 7
With the actual reaction cross-sections databases the estimated uncertainties for theADS parameters (e.g. keff ) are fairly significant and higher than the correspondingvalues obtained for standard critical cores. Cross-sections measurement for bothfuel components (e.g. minor actinide) and structure materials are needed especiallybelow 20 MeV.
In terms of nuclear reactions, the required data for the design calculation of theADS refers to the elastic scattering, neutron capture, (n,xnγ) and (n,f). The preci-sion of (n,xnγ) cross sections influences the calculations for the neutron propagationin the reactor and the calculations for the shielding design and radioprotection.
In the reactor calculations certain limits on the uncertainty of different para-meters are defined as an objective. Such target uncertainties for important reactorquantities (ex. keff) have been converted to target uncertainties for, amongst others,inelastic scattering cross sections by sensitivity analyses [43–46], resulting in require-ments that vary between 5 and 20% according to isotope abundance and inelasticthreshold. To achieve this type of accuracy, additional efforts are required.
1.3.2 Benchmark for the nuclear codes
Various nuclear codes were developed to describe the physics behind the interactionof different incident particles with the atomic nucleus. The nuclear codes can beseen first as a nuclear physics tool and secondly as tool for producing nuclear data.
As a tool for nuclear physics, different models were implemented in the nuclearcodes for the reaction mechanisms and for the structure of the nucleus. The cross-sections obtained with such codes are first compared with the experimental results.From the comparison of the two types of results, calculated and experimental, onecan improve the values for the parameters of the models implemented in the code.Reversely, if the nuclear code reaches a certain precision the calculation can be usedto give an indication on the reliability of new experiments.
The nuclear codes can be used for the prediction of the reaction cross-sectionwhere the experimental data are missing. Such predictions can be made either forthe nuclei that are difficult to be studied experimentally or for energies and processesthat are not easy to achieve. The nuclear codes may produce reaction cross-sectionson the entire energy range of interest for the applications, from thermal neutronsup to hundreds of MeV. An advantage of the nuclear codes is that the cross-sectionof all the reaction channels may be obtained in one calculation.
Reliability of the nuclear model calculations is limited by the considerable free-dom in the choice of the parameters as for example the parameters of the opticalmodel, the level densities and pre-equilibrium reactions [47–50]. Furthermore, lowenergy cross sections exhibit fluctuations as a consequence of the underlying nuclearresonances, whose energy spacing and widths are inherently stochastic. Nuclearmodels only handle such fluctuations on average, whereas transport calculationsbenefit from knowing the actual structure [51,52]. Clearly, new measurement effortsare inevitable in order to make substantial progress.

8 Introduction
1.4 Theoretical predictions of the inelastic, (n,2n)
and (n,3n) reaction cross-sections and nuclear
codes
The reaction mechanisms used in the description of the interaction between theincident neutron (or any other incident particle in general) and the atomic nucleusmay be classified in three categories according to the interaction time. The firsttype is the direct reaction in which the interaction time between the neutron andthe nucleus is very short and one or two collisions take place inside the nucleus. Theother extreme is the compound mechanism in which the incident neutron spendssufficient time inside the nucleus to allow the statistical equilibrium to be established.Many interactions take place between the incident neutron and the nucleons insidethe nucleus. The third reaction mechanism is the pre-equilibrium, which is anintermediate step between the direct and the compound nucleus mechanisms. Inthe pre-equilibrium reactions, several interactions take place between the neutronand the nucleus, but the statistical equilibrium is not yet reached.
In absence of fission and of any reaction with emission of charged particles,below the inelastic threshold, the only other opened reaction channels are the elasticscattering and the neutron capture. The neutron capture reaction is completelydescribed in the frame of the compound nucleus mechanism. The elastic scatteringhas a major direct component (shape elastic scattering) and a small componentdescribed by the compound nucleus mechanism (compound elastic scattering). Inthe reaction models, the cross-section of the shape elastic scattering is deduced fromthe optical model. The reaction cross-section, which is the difference between thetotal and the shape elastic cross-section, is shared between the neutron capture andthe compound elastic scattering.
The inelastic scattering reaction channels open above the inelastic threshold.At energies below the continuum, at about 4 MeV, the inelastic scattering has acompound nucleus component and a direct component. The compound interactionrises rapidly just above the threshold and then decreases with the increase of theincident energy. The cross-section from direct interaction increases slowly with theincrease of the energy.
At energies where the continuum starts, the pre-equilibrium interaction has tobe considered in the calculations for a better description of the experimental cross-sections. Even if the direct and the pre-equilibrium interactions have a higher con-tribution to the total cross-section with the increase of the neutron energy, thecompound mechanism is still the dominant one below 20 MeV.
These reaction mechanisms were implemented in different nuclear codes in orderto reproduce as well as possible the experimental data. In this work, the resultsof the present measurements are compared with existing experimental data, withtheoretical cross-sections and with evaluated data. The theoretical cross-sectionswere obtained with the Talys code [6] with the default input parameters of theversion 0.57. The results of these calculations were provided by the authors of thecode. The purpose of this comparison was only to illustrate how well the calculations
February 2006 L.C.Mihailescu 9
of the present days can describe the experimental data. No investigation was done inthis work for the impact of different code parameters on the calculated cross-sections.Such investigations for the large amount of experimental cross-section data that arepresented in this work could be very complex and time consuming.
Talys [6] is a state-of-art code that includes some of the most recent evalua-tions of the parameters for the nuclear models. It can be used for projectiles asneutron, proton, deuteron, triton, 3He, alpha and γ-ray and for target nuclei withthe mass number between 12 and 339. The energy of the incident particle can bebetween 1 keV and 250 MeV. The code is continuously updated and improved byits authors [6].
A short description of the nuclear reaction models that are used to described the(n,xnγ) reactions will be given in the following.
Optical model
One of the first ingredients used in the cross-sections calculation is the optical modelpotential. The optical model describes the complex interaction between the projec-tile and the target in a more simple way, by means of a phenomenological potential.This model divides the reaction flux into a shape elastic interaction and a partdescribing all the non-elastic reaction channels.
The basic observables predicted by the optical model are the elastic cross-sectionsand the reaction cross-sections. Other observable predicted by the optical model arethe angular distribution of the elastically scattered projectile and the transmissioncoefficients and the distorted wave functions that are used for the further steps ofthe cross-section calculations.
The optical model potential has two components, a real one and an imaginaryone. Every of these two components have a term that describes the volume in-teraction, the surface interaction and the spin-orbit interaction. To describe theseinteractions the optical model uses parameters as the well depths, the nuclear radiusand the diffuseness. An additional term that accounts for the Coulomb interaction isneeded for the description of the interaction of the charged projectile with a nucleus.All these parameters of the optical model potential depend on the incident energy,on the projectile type and on the target. Global and local sets of such parametersexist along the whole nuclear chart. In the Talys code, the local set of optical modelparameters is used when such set is available [6].
Direct reactions
The direct reactions are described by models like the Distorted Wave Born Approxi-mation (DWBA) for the near-spherical nuclei and coupled channels for the deformednuclei. For the coupled channels formalism, the ground state and several inelasticstates are included in the coupling scheme. Various collective models (symmetric ro-tational model, harmonic rotational model, vibration-rotational model, asymmetricrotational model) are used to describe the structure of the deformed nuclei.
10 Introduction
Compound reactions
In the compound nucleus model, the projectile and the target form a compound sys-tem that reaches the statistical equilibrium. The compound nucleus has maximumexcitation energy and a range of values for the spin and parity. From this stateof statistical equilibrium the compound nucleus decays. The compound nucleusreaction cross-section is proportional with the transmission factors through the nu-clear surface. A width fluctuation correction factor is considered for the correlationthat exists between the incident and the outgoing waves. Above few MeV, wheremany reaction channels are opened, the width fluctuation correction factor can beneglected.
Pre-equilibrium
The pre-equilibrium reactions are described by means of the exciton model. In thismodel, the nuclear state is characterized by the total energy and the total numberof particles and holes above and respectively below the Fermi surface. The particle-hole pairs are called excitons. In the exciton model, the way of sharing the excitationenergy between different particle-hole configurations have an equal probability. Thenumber of excitons changes in time as a result of two-body intranuclear collisions.Once an exciton is formed, it is subject to a particle emission. Further interactionscan change the number of excitons either by creation of another particle-hole pairor by annihilation of the particle-hole pair. In the pre-equilibrium reactions, theemitted particles have some memory of the incident energy and direction, which isnot the case for the compound nucleus model. In the Talys code the two-componentexciton model is used in which the protons and the neutrons are considered asdistinct particles. A more simple case is the one-component exciton model thatassumes no difference between the protons and the neutrons [6].
Level densities
In the statistical models for predicting cross-sections, nuclear level densities are usedat excitation energies where discrete level information is not available or incomplete.The default level density model in Talys is the Gilbert and Cameron model. In thismodel, the excitation energy range is divided in a low energy part from zero to amatching energy and high energy part from the matching energy to infinity. For thelow excitation energy, the number of discrete levels increases exponentially accordingto the constant temperature law. For higher energies, the level density is describedby the Fermi gas model with the Ignatyuk correction for the shell effects.
1.5 Structure of this work
The introduction chapter of this thesis describes the measured quantities and shortlymotivates the work done for this project. In this chapter a short description is givenfor the reaction mechanisms and for the models used in the theoretical calculationthat served as a comparison for the experimental results from this work.

February 2006 L.C.Mihailescu 11
The second chapter presents the techniques currently used for the measurementsof the (n,xnγ) cross-sections (x=1,2,3). More details were given for the (n,xnγ)-technique that was used in the present set of experiments. The general characteris-tics of γ-ray spectroscopy and of the time-of-flight measurements with germaniumdetectors are given in the same chapter.
Chapter 3 describes the experimental setup used for the cross-section measure-ments. Prior to this project the setup was used for the measurements of 58Ni in-elastic cross-sections. For the measurements presented in this work, the setup wascontinuously changed and upgraded in order to gain detection efficiency. The dataacquisition with conventional electronics and the details regarding the data analysisare given here.
In parallel with the cross-section measurements it was investigated the possibil-ity to replace the data acquisition system with the conventional electronics with aninnovative data acquisition based on a fast digitizer. The feasibility tests for theuse of a fast digitizer for time-of-flight measurements at GELINA with large vol-ume HPGe detectors were presented in Chapter 4. This chapter contains also thecomparison of the acquisition system based on the conventional electronics and theacquisition system with the fast digitizer.
Chapter 5 contains the results for the cross-section measurements of the fivenuclei that were investigated here: 52Cr, 209Bi, 206Pb, 207Pb and 208Pb. This chapteris structured in 5 relatively independent sections, one for each nucleus. Conclusionswere given for every section.
Chapter 6 presents the final conclusions of this thesis.

12 Introduction

Chapter 2
Measurements of the (n,xnγ)cross-sections with large volumeHPGe detectors
2.1 The current standard measurement techniques
The measurement of the neutron inelastic cross-sections below 20 MeV neutronenergy may be done using two different techniques: the (n,n’) technique and the(n,n’γ)-technique. The last will be named in the following (n,xnγ) because thetechnique may be easily extended to the measurement of (n,xn) cross-sections withx=2,3,... [152].
The first technique is based on the detection of the outgoing neutrons with aneutron sensitive detector. The incident neutron beam is usually mono-energeticand the primary measured quantities are the level cross-sections.
The second technique, (n,xnγ), is based on the detection of the emitted γ-raysby the residual nucleus from the (n,xn) reaction. The (n,xnγ)-technique can alsobe used with a white neutron source and the primary measured quantities are thegamma production cross-sections. For inelastic scattering (x=1), based on the levelscheme of the studied nucleus, the level cross-sections and the total inelastic cross-sections can be constructed.
The two techniques provide some complementary information. First of all, theangular distribution of the emitted neutrons and to some degree the secondary neu-tron energy distribution can only be determined with the (n,n’)-technique. Thecomparison of the level cross-section obtained in the two techniques may give infor-mation about the γ-ray feeding from higher excitation energies to that particularlevel. In the set of experiments presented in this work the (n,xnγ)-technique wasused. A general description of the two techniques will be given in the following, withmore emphasis on the (n,xnγ)-technique.
13
14 Measurements of the (n,xnγ) cross-sections with large volume HPGe detectors
2.1.1 The (n,n’)-technique
The (n,n’)-technique is used with a quasi-monoenergetic incident neutron beam.The inelastic scattered neutrons are detected with neutron sensitive detectors (e.g.plastic scintillators, liquid scintillators, Li glass detectors) placed at given angleswith respect to the direction of the incident beam. The scattered neutron energy isdetermined by the time-of-flight method. The double differential (angle and energy)cross-section of individual levels are measured. When the energy resolution of thespectrometer is larger than the energy spacing between excited levels the methodprovides only the cross-section of a group of levels. The total inelastic cross-sectioncan be constructed as a sum of the level cross-sections up to the energy of the highestobserved excited level.
The (n,n’)-technique has the advantage that it allows the measurement of thelevel cross-section for isomer excited levels and for the 0+ excited levels. It hasalso some disadvantages. To obtain the excitation functions, the measurement hasto be repeated for different incident neutron energies when a quasi-monoenergeticbeam is used. Two problems are common to this technique. The first one is thatdetailed information is needed for the angular distribution of the outgoing neutronsto perform the angle integration. Secondly at low energies the response functionof the detector is difficult to be determined. Some neutron detectors have a poorsensitivity below energies of about 800 keV and extrapolations below this thresholdare needed for the integral yield. The determination of the response function of thedetector needs special attention. Usually this is done with calibration sources. Thebackground from the scattered neutrons around the setup has to be treated withspecial care because this may reduce the detection sensitivity.
Some examples for the use of the (n,n’)-technique are given in Refs. [40,41].
2.1.2 The (n,xnγ)-technique
In the (n,xnγ)-technique the prompt γ-rays emitted by the residual nucleus are de-tected. The first experiments that applied this technique used scintillators, mainlyNaI detectors, for the gamma-ray detection. These detectors have a poor energyresolution and the identification of the gamma rays in complex spectra was difficult.The development of the semiconductor detectors, first Ge(Li) and then HPGe (HighPurity Germanium) detectors, improved significantly the performances of such ex-periments. With HPGe detectors γ-ray peaks separated by about 2 keV may beresolved, allowing a very good identification of the transitions of the residual nu-cleus. With such detectors γ-rays and implicitly decaying levels from relatively highexcitation energy (up to 4-5 MeV) can be identified. Moreover, in addition to theneutron inelastic cross-section measurement (x=1), the technique can be used easilyfor the (n,xn) cross-section measurement with x≥2. It has to be mentioned that thetechnique can be use for capture measurements (x=0) as well, but for lower neu-tron energies. By γ-ray identification it is possible to identify the (n,xn) reactionchannels (x≥1) for incident energies above threshold.
The (n,xnγ)-technique may be used both with quasi-monoenergetic beams [56,

February 2006 L.C.Mihailescu 15
2337
.4 M
1+E2
100
3771
.7 [E
2] 2
6
52Cr
1434
.1 E
2 10
0935.
5 E2
100
1212
.8 E
2 10
0
398.
1 1.
76
1333
.7 E
2 10
0
1530
.67
M1+
E2 10
0
2965
.0 E
2 0.
9
346.
0 E2
1.09
744.
2 E2
100
1727
.5 M
1+E2
3161
.8 E
2 10
647.
5 M
1(+E
2) 1
00
766.
0
1045
.7 1
7
1981
.1 8
.5
704.
6 M
1+E2
100
2038
.0 2
8
200.
6 1.
80
502.
1 5.
0
848.
2 78
.9
1246
.3 1
00
0+
2+
4+
0+
4+
2+
6+2+
4+
3+
5+
2+
stable
1434.1
2369.6
2646.9
2767.8
2964.8
3113.9
3161.7
3415.3
3472.3
3615.9
3771.7
0.7ps
1.1ps
1.9ps
0.4ps
41.4ps
0.3ps
7.2ps
2.6ps
10.9fs
0.07ps
Figure 2.1: Simplified level scheme of 52Cr. Observed transitions are highlighted.
147] and with white neutron beams [58,59,99,152]. In this work the white neutronbeam from GELINA was used. The advantage of a white neutron beam over a quasi-monoenergetic one is that the excitation functions are measured simultaneouslyfor all neutron energies, in only one experiment. In the ideal case, the excitationfunction may appear continuous.
The γ-ray detector is placed at a given angle with respect to the incident neutronbeam direction. Differential gamma production cross-sections are obtained as pri-mary quantities. For the γ-ray angular integration, knowledge of the γ-ray angulardistribution from additional experiments is necessary if the measurement is doneonly at one angle. For the particular case of two detection angles a special γ-rayangular integration procedure was used in the present work (see Sec. 2.3.3 for de-tails). Following the angular integration the (n,xnγ) technique gives the gamma-rayproduction cross sections σn′γ(Li → Lj) of observed transitions (Li is the ith excitedlevel and i=0 is the ground state — g.s.).
For inelastic scattering, besides the gamma-ray production cross sections, impor-tant quantities are the total inelastic cross section σn′ and the level cross sectionsσn′,Li
. The latter are the cross sections for leaving the target nucleus in the ex-cited state Li, immediately following scattering but before gamma-decay. The totalinelastic cross-section may be written as a sum of all level cross-sections:
σn′(E) =
Ex(Li)≤Ein∑i=1
σn′,Li(E), (2.1)
where E is the energy of the incident neutron in the center of mass. Always in

16 Measurements of the (n,xnγ) cross-sections with large volume HPGe detectors
the experiment there is a maximum excitation energy up to which excited levelsare observed. Because of this, above this maximum energy Eq. 2.1 becomes only alower limit for the total inelastic cross-section. As an example, for 52Cr (see Fig. 2.1)the maximum observed excited level was 3.77 MeV. Since for each excited level oneγ-ray is observed, the sum in Eq. 2.1 could be performed over all excited levels up to3.77 MeV. Above 3.77 MeV energy of the incident neutrons, the total inelastic cross-section calculated with Eq. 2.1 is a lower limit for the total inelastic cross-section asmentioned above.
Gamma-ray production cross sections are linked to the cross section that leadsto a particular excited level, including the contribution of higher excited levels thatpopulate the level following de-excitation. Let’s call this the level population crosssection (or level production cross section) σp
n′,Li. This level population cross-section
may be written as:
σpn′,Li
=σn′γ(Li → Lki
)
pγ(Li → Lki)
(2.2)
where ki is the level populated by the γ-ray that was observed following the decayof the initial level Li. pγ(Li → Lki
) is the gamma-ray emission probability for thetransition from level Li to Lki
. The level population cross section may be determinedas soon as one of the emitted gamma-rays is measured and its emission probabilityis known (e.g. from the Nuclear Data Sheets [53, 131]).
The total inelastic scattering cross section is the sum of the cross-sections carriedby all transitions that decay directly to the ground state. If the direct transitionto the ground state is weak and cannot be observed, any other strong transitionfrom that particular level may be used in the construction of total inelastic scatter-ing cross section, taking into account the appropriate branching ratio. With theseconsiderations the total inelastic scattering cross section may be written as:
σn′(E) =
Ex(Li)≤E∑i=1
p(Li → g.s.) σpn′,Li
(E)
=
Ex(Li)≤E∑i=1
σn′,γ(E, Li → Lki)p(Li → g.s.)
pγ(Li → Lki)
(2.3)
where p(Li → Lj) is the transition probability from level Li to level Lj. The lastexpression is the practical one for the application of this technique. Obviously, thenature of this expression is such that the transition of the first level to the groundstate serves as the basis. The direct transitions of higher lying levels to the groundstate become effective when the incident energy exceeds the excitation energy of alevel.
As an example, for 52Cr the total inelastic cross-section was constructed usingthe gamma-production cross-section of only the following transitions (see Fig. 2.1):1434 keV, 1530 keV, 1727 keV and 2337 keV. The last three transitions were usedinstead of 2965 keV, 3161 keV and respectively 3771 keV transitions that decaydirectly to the ground state but have a low intensity. Above about 3.77 MeV neutron

February 2006 L.C.Mihailescu 17
energy, the so constructed inelastic cross-section is only a lower limit to its exactvalue.
Finally, by similar reasoning a level cross section is given by
σn′,Li(E) = σp
n′,Li(E)−
Ex(Lj)≤E∑j>i
p(Lj → Li) σpn′,j(E) (2.4)
where, as before, each σpn′,j is determined from a measurement of the most suitable
gamma-ray depopulating the level Lj. The above expression is only sensitive toincomplete knowledge of the level scheme. An alternative expression
σn′,Li(E) = σp
n′,Li(E)−
Ex(Lj)≤E∑j>i
σγ(E,Lj → Lki)
p(Lj → Li)
pγ(Lj → Lki)
(2.5)
requires the gamma-production cross sections for all transitions feeding the level Li
and is therefore more sensitive to unobserved transitions, whether weak, obscuredby background or entirely converted.
For example, using Eq. 2.4, the level cross-section of the second excited level of52Cr, 2369 keV (Fig. 2.1), was constructed using the gamma production cross-sectionof the 935 keV transition as the basis and from this was subtracted the weightedsum of the gamma production cross-section of the following transitions: 1333 keV,744 keV, 647 keV, 1246 keV.
In summary, for an optimal application of the (n,nxγ)-technique, one must iden-tify and measure at least one gamma-ray per excited level. These gamma-raysappear among possibly many weaker gamma-rays, so that gamma-ray energy reso-lution must be as high as possible. Of course background should be minimal andpeak efficiency should be as high as possible.
The method can only be applied fully for the sequence of levels starting fromthe first excited level up to the highest excited level for which decay information iscomplete and for which it is sure that no levels were omitted with lower excitationenergy. The nature of the expression 2.3 is such that incomplete information ormissed transitions that decay directly from higher levels to the ground state resultin a lower bound to the total inelastic cross section.
This method of constructing the total inelastic cross-section should work betterfor the even-even nuclei where almost all excited levels decay to the ground statethrough the first excited level. In the inelastic scattering process the residual nu-cleus is formed with relatively high angular momenta and in consequence the directtransitions from the highly excited states to the 0+ ground state are strongly inhib-ited [152]. All these highly excited states decay preferentially through a cascade oftransitions. For these nuclei the Eq. 2.3 is a very good approximation for the exactvalue of total inelastic cross-section. From the nuclei that were studied in this workthis remark will apply to 52Cr, 206Pb and 208Pb. In contrast, the same conditions forEq. 2.4 and Eq. 2.5 lead to upper bounds for the level inelastic cross section abovethe highest observed excited level. For the level cross-sections this method is very
18 Measurements of the (n,xnγ) cross-sections with large volume HPGe detectors
sensible to any missing transition. The resulting upper bounds for the level inelasticcross-section may differ significantly from the exact values.
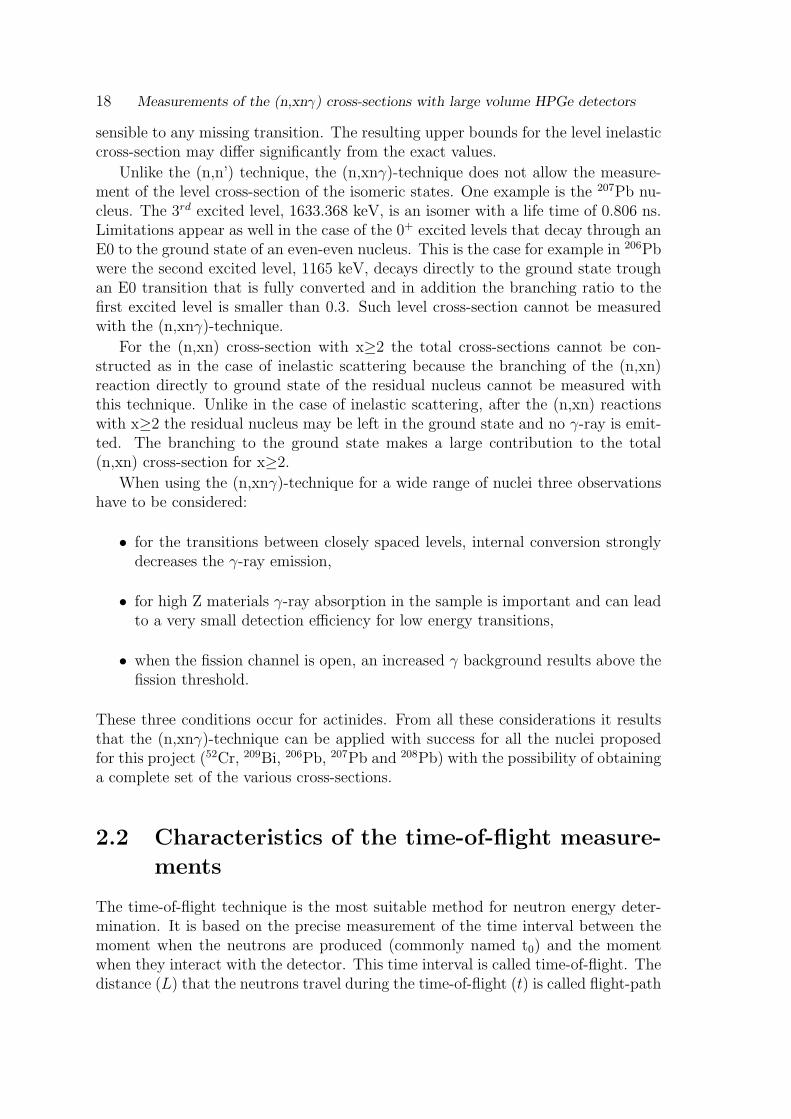
Unlike the (n,n’) technique, the (n,xnγ)-technique does not allow the measure-ment of the level cross-section of the isomeric states. One example is the 207Pb nu-cleus. The 3rd excited level, 1633.368 keV, is an isomer with a life time of 0.806 ns.Limitations appear as well in the case of the 0+ excited levels that decay through anE0 to the ground state of an even-even nucleus. This is the case for example in 206Pbwere the second excited level, 1165 keV, decays directly to the ground state troughan E0 transition that is fully converted and in addition the branching ratio to thefirst excited level is smaller than 0.3. Such level cross-section cannot be measuredwith the (n,xnγ)-technique.
For the (n,xn) cross-section with x≥2 the total cross-sections cannot be con-structed as in the case of inelastic scattering because the branching of the (n,xn)reaction directly to ground state of the residual nucleus cannot be measured withthis technique. Unlike in the case of inelastic scattering, after the (n,xn) reactionswith x≥2 the residual nucleus may be left in the ground state and no γ-ray is emit-ted. The branching to the ground state makes a large contribution to the total(n,xn) cross-section for x≥2.
When using the (n,xnγ)-technique for a wide range of nuclei three observationshave to be considered:
• for the transitions between closely spaced levels, internal conversion stronglydecreases the γ-ray emission,
• for high Z materials γ-ray absorption in the sample is important and can leadto a very small detection efficiency for low energy transitions,
• when the fission channel is open, an increased γ background results above thefission threshold.
These three conditions occur for actinides. From all these considerations it resultsthat the (n,xnγ)-technique can be applied with success for all the nuclei proposedfor this project (52Cr, 209Bi, 206Pb, 207Pb and 208Pb) with the possibility of obtaininga complete set of the various cross-sections.
2.2 Characteristics of the time-of-flight measure-
ments
The time-of-flight technique is the most suitable method for neutron energy deter-mination. It is based on the precise measurement of the time interval between themoment when the neutrons are produced (commonly named t0) and the momentwhen they interact with the detector. This time interval is called time-of-flight. Thedistance (L) that the neutrons travel during the time-of-flight (t) is called flight-path
February 2006 L.C.Mihailescu 19
length. The relativistic expression for the kinetic energy (E) of the neutron is:
E = m0c2
1√
1− (Lct
)2− 1
, where (2.6)
m0 is the neutron rest mass and c is the speed of light. In the classical approximationthe neutron energy is:
E[keV ] =
(72.3
L[m]
t[ns]
)2
. (2.7)
By derivation of Eq. 2.7 the energy resolution for time-of-flight measurements isobtained:
∆E
E= 2
√(∆t
t
)2
+
(∆L
L
)2
= 2
√E
(∆t
72.3L
)2
+
(∆L
L
)2
. (2.8)
The neutron energy resolution in a time-of-flight method is affected by the followinguncertainty sources:
• the time resolution of the acquisition system (detector and time coder),
• the duration of the neutron burst,
• the dimensions of the neutron source,
• the sample dimensions,
• the neutron multiple scattering in the neutron source and in the sample.
The first two sources influence the time resolution (∆tt) and the last two the
uncertainty of the flight path-length(∆LL
). It results that for a good neutron energyresolution the measurement should be done at a longer flight-path length and withdetectors of a good time resolution. For the neutron source, special efforts were doneto reduce the neutron burst length in order to least affect the time resolution [65].
The time-of-flight measurements are done with pulsed neutron beams and thepulse repetition rate is chosen such that the slow neutrons from one burst do notoverlap with the fast neutrons from the next burst.
2.3 Cross-sections measurement by γ-ray spectroscopy
with HPGe detectors
2.3.1 Properties of HPGe detectors
When applying the (n,xnγ)-technique below 20 MeV neutron energy, the followingthree proprieties of the γ-ray detectors need to be as good as possible:
• the energy resolution. Complex γ-ray spectra need to be resolved.
20 Measurements of the (n,xnγ) cross-sections with large volume HPGe detectors
• the time resolution. The time-of-flight method is used for the neutron energydetermination.
• the detection efficiency. High detection efficiency reduces the acquisition time.Besides the advantages for beam time allocation, shorter acquisition periodsavoid large fluctuations in the setup settings.
The most used detectors in γ-ray spectroscopy are the scintillators (NaI, BaF2,BGO) and the semiconductor diodes (Ge(Li), Si(Li), HPGe). From these detectorsthe best energy resolution is obtained for the germanium detectors. On the otherhand, the time resolution and the detection efficiency are better for the scintillators.A compromise between the three characteristics of the γ-ray detector can be foundin HPGe (High Purity Germanium) detectors with a large volume. Such detectorscan have an energy resolution of about 2 keV at 1.33 MeV and detection efficienciescomparable with a cylindrical NaI crystal of 3 inch diameter and 3 inch height(100% relative efficiency at 1.33 MeV). The only inconvenience of large volumeHPGe detectors is the relatively poor time resolution (several ns) that deteriorateswith the increase of the volume.
With all this in mind it was decided to use large volume HPGe detectors withthe (n,xnγ)-technique at GELINA neutron beam facility. In the following the basicproprieties of large volume HPGe detectors will be explained.
Conduction mechanism in semiconductors
In general for a semiconductor detector the energy resolution is determined by thecrystal structure. The periodic lattice of crystalline materials forms allowed energybands for the electrons. These bands are separated by energy gaps or forbiddenbands. A schematic representation of the band structure of the crystals is given inFig. 2.2. Any electron from the crystal may occupy states in the allowed bands. Thelower band is the valence band and corresponds to the bound electrons. The upperband corresponds to the free electrons and is called conduction band. For pure semi-conductors (called intrinsic) and for insulators, in absence of any thermal motion(temperature of 0 K), the valence band is fully occupied and there is no electronin the conduction band. At this temperature both the intrinsic semiconductors andthe insulators have no electrical conductivity. The size of the forbidden band deter-mines whether the material is classified as semiconductor or insulator (much largerforbidden bands for the insulators). In semiconductors, at temperatures differentfrom 0 K, due to the thermal motion some electrons pass from the valence band inthe conduction band. For every such electron, a hole remains in the valence bandand under the influence of an electric field this will start moving in the oppositedirection compared with the electron. Thus electrons and holes will contribute tothe charge collection.
In an ideal semiconductor detector the free charge carriers are produced onlyfrom the interaction of the radiation with the crystal. Ge detectors are cooled atlow temperature to reduce the number of electron-hole pairs due to the thermalmotion. Moreover it is preferably that one particle that interacts with the crystal
February 2006 L.C.Mihailescu 21
Ele
ctro
n en
ergy
Donor level
Acceptor level
Valence band
Conduction band
Valence band
Conduction band
Eg Eg
a) n-type crystal b) p-type crystal
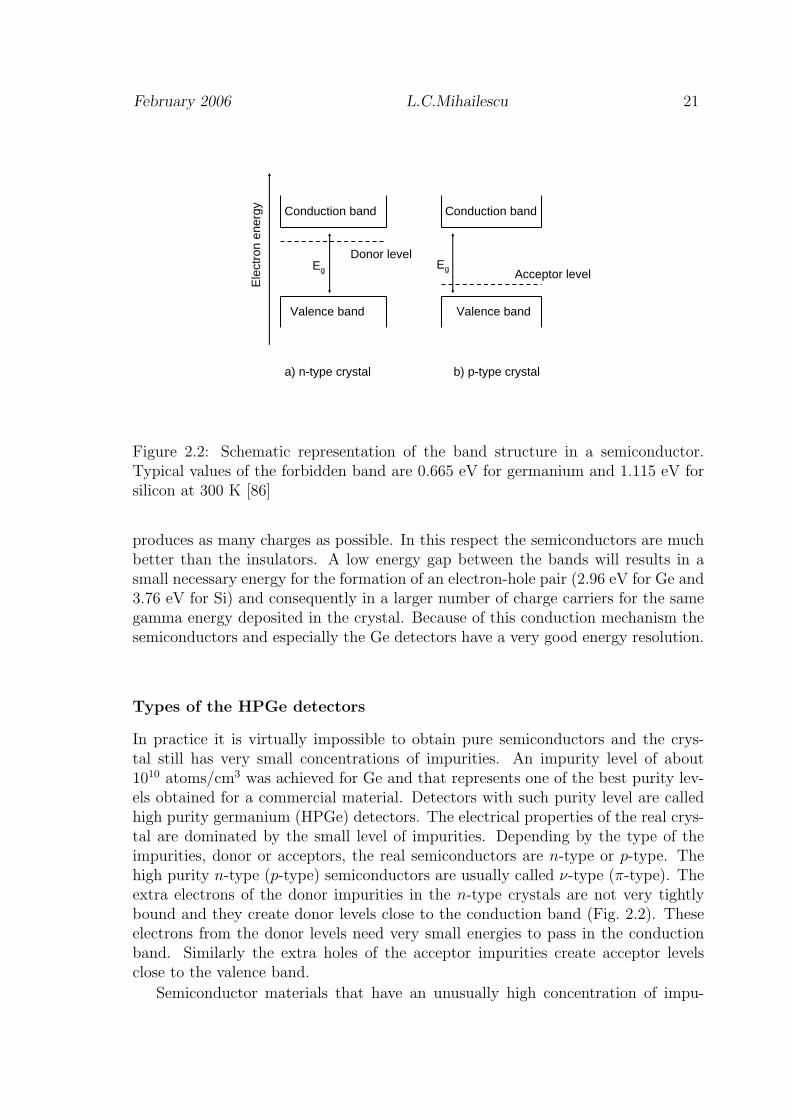
Figure 2.2: Schematic representation of the band structure in a semiconductor.Typical values of the forbidden band are 0.665 eV for germanium and 1.115 eV forsilicon at 300 K [86]
produces as many charges as possible. In this respect the semiconductors are muchbetter than the insulators. A low energy gap between the bands will results in asmall necessary energy for the formation of an electron-hole pair (2.96 eV for Ge and3.76 eV for Si) and consequently in a larger number of charge carriers for the samegamma energy deposited in the crystal. Because of this conduction mechanism thesemiconductors and especially the Ge detectors have a very good energy resolution.
Types of the HPGe detectors
In practice it is virtually impossible to obtain pure semiconductors and the crys-tal still has very small concentrations of impurities. An impurity level of about1010 atoms/cm3 was achieved for Ge and that represents one of the best purity lev-els obtained for a commercial material. Detectors with such purity level are calledhigh purity germanium (HPGe) detectors. The electrical properties of the real crys-tal are dominated by the small level of impurities. Depending by the type of theimpurities, donor or acceptors, the real semiconductors are n-type or p-type. Thehigh purity n-type (p-type) semiconductors are usually called ν-type (π-type). Theextra electrons of the donor impurities in the n-type crystals are not very tightlybound and they create donor levels close to the conduction band (Fig. 2.2). Theseelectrons from the donor levels need very small energies to pass in the conductionband. Similarly the extra holes of the acceptor impurities create acceptor levelsclose to the valence band.
Semiconductor materials that have an unusually high concentration of impu-

22 Measurements of the (n,xnγ) cross-sections with large volume HPGe detectors
p+
+ -
n+
r1
r2
r
ν-type Ge
h
e
Figure 2.3: Schematic representation of a coaxial HPGe detector. The semicon-ductor junction is formed between the p+ contact and the ν-type material. Then+ contact is a blocking contact that do not allow that the charge carriers initiallyremoved by the application of the electric field are not replaced at this contact.
rity are often given a special notation. Thus n+ and p+ designate n- and p-typelayers which have a very high impurity concentration and consequently very highconductivity.
In general the semiconductor detectors use the properties of the junctions be-tween the n- and p-type materials. Around the semiconductor junction a net dif-fusion of the electrons from the n-type to the p-type material takes place. Theaccumulated space charge creates an electric field that diminishes the tendency offurther diffusion. The region over which the charge imbalance exists is called deple-tion region. If the acceptor concentration in the p-type material is higher than thedonor concentration in the n-type material, the holes diffusing in the p-type regiontravel a longer distance before all have recombined with electrons. The depletionregion extends then farther in the n-type side.
Within the depletion region the electric field causes any created electron to beswept toward the n-type material and any hole toward the p-type material.
Thin layers of n+ (p+) materials are often used for the electrical contacts withthe semiconductor because they reduce the leakage current in the detector to a verylow value. The n+ contact (Fig.2.3) do not allow that the charge carriers initiallyremoved by the application of the electric field are not replaced at the oppositeelectrode.
In the case of a ν-type HPGe detector (Fig.2.3) the semiconductor junction isbetween the p+ contact and the ν-type material. When a reverse bias is applied asin Fig. 2.3, the depletion region extends progressively from the p+ contact in theν-type material with the increase of the applied voltage.

February 2006 L.C.Mihailescu 23
True coaxial Closed-ended coaxial Closed-ended coaxial (bulletized)
Figure 2.4: Most common shapes for a coaxial detector. The detectors used in theexperiments described in this paper have bulletized crystals and large volume.
For a constant reverse bias, the depletion voltage of a high purity semiconductorincreases linearly with the decrease of the impurities density ρ [86]. High puritylevel implies high bias voltage and the latter has practical limitations (safety re-quirements) to about 5 kV. In consequence, large volume semiconductor detectorsrequire a high purity level.
Two main shapes are common for the germanium detectors: planar and coaxial.The typical shape of a planar semiconductor detector is a thin disk, with relativelysmall active volume. Planar detectors are suitable for X-ray and low energy gammaray detection. The detection of the more energetic gamma rays requires coaxialdetectors (Fig. 2.4). This is because a larger active volume can be achieved ina coaxial geometry. In the further discussion, for the calculations a ν-type true-coaxial HPGe detector will be considered. This is a simple case for which theelectric field and the charge collection process can be calculated analytically and canbe considered as a starting point for a comparison with more detailed cylindricalshapes (close ended bulletized detector, Fig. 2.4).
The preamplifier
The preamplifier is the first element in the pulse processing chain of the detector. Itis an interface between the detector and the electronics that follow. Three types ofpreamplifiers can be distinguished: voltage-sensitive, current sensitive and charge-sensitive. The voltage-sensitive preamplifier provides an output pulse whose ampli-tude is proportional to the amplitude of the voltage pulse supplied to its input. Theamplitude of the output pulse of the current-sensitive preamplifier is proportionalto the input current.

24 Measurements of the (n,xnγ) cross-sections with large volume HPGe detectors
Cd
i(t) A
+
-V-(t)
V0(t)
C
R
Figure 2.5: Schematic representation of a charge-sensitive preamplifier. The currentdue to the ionization generated by the photon in the Ge crystal is i(t). Cd is thedetectors capacitance. The charge is integrated over the feedback capacitance C,which is discharged through the feedback resistor R. Vo(t) is the output voltage.
For the use with semiconductor detectors a charge-sensitive detector is moresuitable. The schematic representation of such preamplifier is given in Fig. 2.5.
The charge-sensitive preamplifier has four main functions:
• integrates the deposited charge over the capacitance C. The output voltageis proportional with the total integrated charge in the pulse provided to theinput, as long the duration of the pulse is short compared with time constantRC. The decay time of the pulse is made quite large (50 or 100 µs) to allowthe full charge collection before the pulse decay becomes significant.
• preserves the linearity of the input pulse. Ideally, the rise time of the pulseproduced from the preamplifier is determined only by the charge collectiontime in the detector and is independent of the capacitance of the detectoror preamplifier input. The minimal distortion of the pulse is an importantcharacteristic for the use with fast digitizer.
• has a low noise despite the high detector capacitance. The noise is madesmaller by increasing the resistance value, R, but longer time constant leadsto a very long tail on the output pulses. The noise is strongly dependenton the capacitance from the preamplifier input. The input capacitance arisesfrom both the detector capacitance and from the connecting cables betweenthe detector and the preamplifier. The preamplifier is therefore kept close tothe detector to minimize the cable length. Because it has also small outputimpedance, the preamplifier allows a connection through long cables with thefollowing pulse processing module, without introducing additional noise.
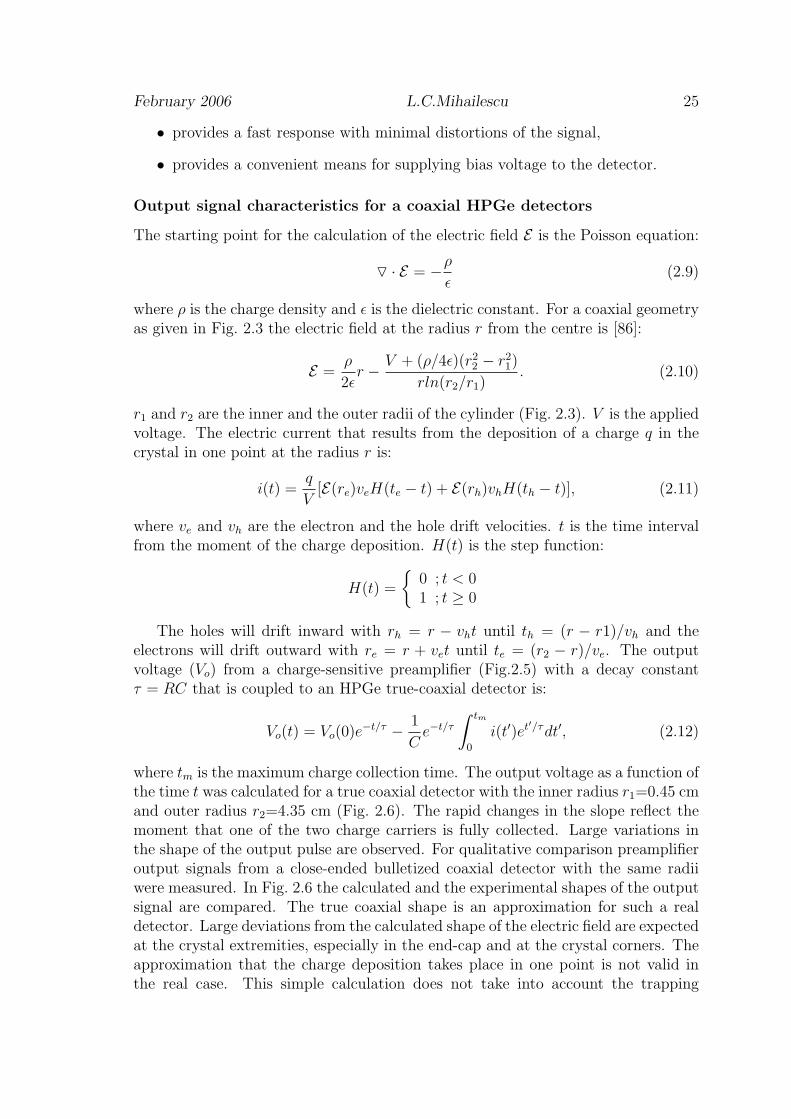
February 2006 L.C.Mihailescu 25
• provides a fast response with minimal distortions of the signal,
• provides a convenient means for supplying bias voltage to the detector.
Output signal characteristics for a coaxial HPGe detectors
The starting point for the calculation of the electric field E is the Poisson equation:
O · E = −ρ
ε(2.9)
where ρ is the charge density and ε is the dielectric constant. For a coaxial geometryas given in Fig. 2.3 the electric field at the radius r from the centre is [86]:
E =ρ
2εr − V + (ρ/4ε)(r2
2 − r21)
rln(r2/r1). (2.10)
r1 and r2 are the inner and the outer radii of the cylinder (Fig. 2.3). V is the appliedvoltage. The electric current that results from the deposition of a charge q in thecrystal in one point at the radius r is:
i(t) =q
V[E(re)veH(te − t) + E(rh)vhH(th − t)], (2.11)
where ve and vh are the electron and the hole drift velocities. t is the time intervalfrom the moment of the charge deposition. H(t) is the step function:
H(t) =
0 ; t < 01 ; t ≥ 0
The holes will drift inward with rh = r − vht until th = (r − r1)/vh and theelectrons will drift outward with re = r + vet until te = (r2 − r)/ve. The outputvoltage (Vo) from a charge-sensitive preamplifier (Fig.2.5) with a decay constantτ = RC that is coupled to an HPGe true-coaxial detector is:
Vo(t) = Vo(0)e−t/τ − 1
Ce−t/τ
∫ tm
0
i(t′)et′/τdt′, (2.12)
where tm is the maximum charge collection time. The output voltage as a function ofthe time t was calculated for a true coaxial detector with the inner radius r1=0.45 cmand outer radius r2=4.35 cm (Fig. 2.6). The rapid changes in the slope reflect themoment that one of the two charge carriers is fully collected. Large variations inthe shape of the output pulse are observed. For qualitative comparison preamplifieroutput signals from a close-ended bulletized coaxial detector with the same radiiwere measured. In Fig. 2.6 the calculated and the experimental shapes of the outputsignal are compared. The true coaxial shape is an approximation for such a realdetector. Large deviations from the calculated shape of the electric field are expectedat the crystal extremities, especially in the end-cap and at the crystal corners. Theapproximation that the charge deposition takes place in one point is not valid inthe real case. This simple calculation does not take into account the trapping
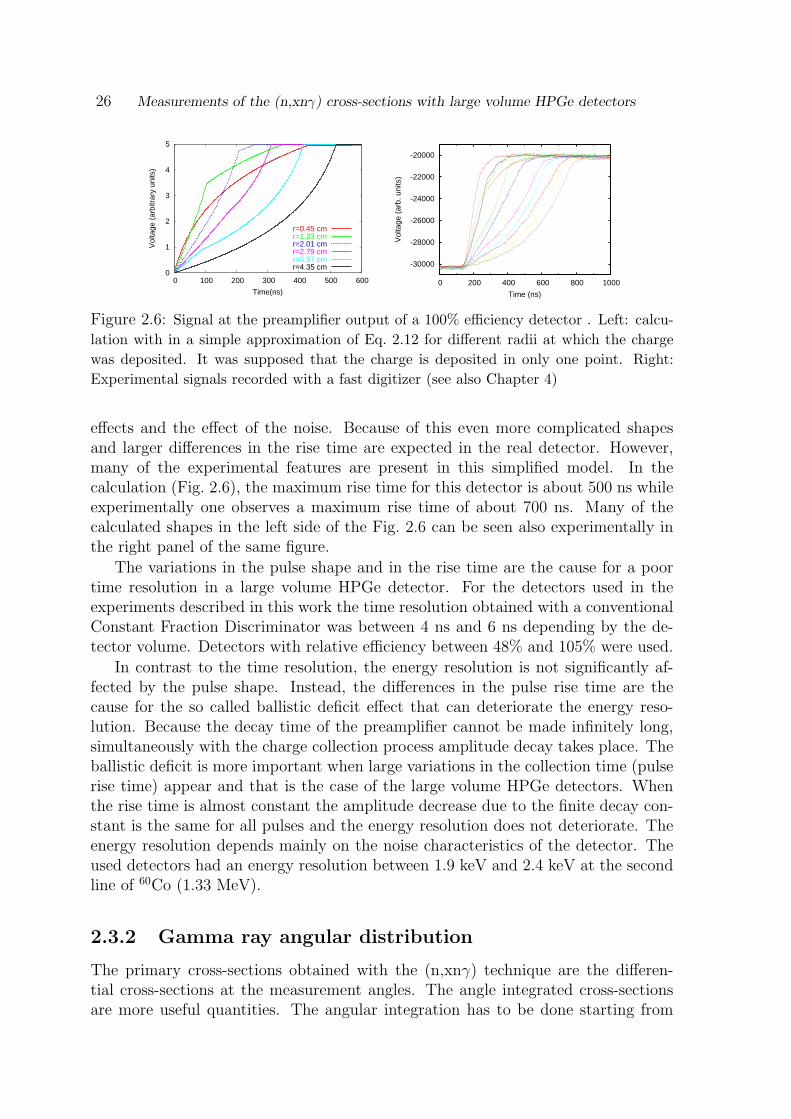
26 Measurements of the (n,xnγ) cross-sections with large volume HPGe detectors
0
1
2
3
4
5
0 100 200 300 400 500 600
Vol
tage
(ar
bitr
ary
units
)
Time(ns)
r=0.45 cmr=1.23 cmr=2.01 cmr=2.79 cmr=3.57 cmr=4.35 cm -30000
-28000
-26000
-24000
-22000
-20000
0 200 400 600 800 1000
Vol
tage
(ar
b. u
nits
)
Time (ns)
Figure 2.6: Signal at the preamplifier output of a 100% efficiency detector . Left: calcu-lation with in a simple approximation of Eq. 2.12 for different radii at which the chargewas deposited. It was supposed that the charge is deposited in only one point. Right:Experimental signals recorded with a fast digitizer (see also Chapter 4)
effects and the effect of the noise. Because of this even more complicated shapesand larger differences in the rise time are expected in the real detector. However,many of the experimental features are present in this simplified model. In thecalculation (Fig. 2.6), the maximum rise time for this detector is about 500 ns whileexperimentally one observes a maximum rise time of about 700 ns. Many of thecalculated shapes in the left side of the Fig. 2.6 can be seen also experimentally inthe right panel of the same figure.
The variations in the pulse shape and in the rise time are the cause for a poortime resolution in a large volume HPGe detector. For the detectors used in theexperiments described in this work the time resolution obtained with a conventionalConstant Fraction Discriminator was between 4 ns and 6 ns depending by the de-tector volume. Detectors with relative efficiency between 48% and 105% were used.
In contrast to the time resolution, the energy resolution is not significantly af-fected by the pulse shape. Instead, the differences in the pulse rise time are thecause for the so called ballistic deficit effect that can deteriorate the energy reso-lution. Because the decay time of the preamplifier cannot be made infinitely long,simultaneously with the charge collection process amplitude decay takes place. Theballistic deficit is more important when large variations in the collection time (pulserise time) appear and that is the case of the large volume HPGe detectors. Whenthe rise time is almost constant the amplitude decrease due to the finite decay con-stant is the same for all pulses and the energy resolution does not deteriorate. Theenergy resolution depends mainly on the noise characteristics of the detector. Theused detectors had an energy resolution between 1.9 keV and 2.4 keV at the secondline of 60Co (1.33 MeV).
2.3.2 Gamma ray angular distribution
The primary cross-sections obtained with the (n,xnγ) technique are the differen-tial cross-sections at the measurement angles. The angle integrated cross-sectionsare more useful quantities. The angular integration has to be done starting from
February 2006 L.C.Mihailescu 27
targetJ0 0
J3 3
J2 2
J1 1
j 1 l1 s1
j 2 l2 s2
n
n’
CN
L,L’
residual nucleus
L1,L1’J
Figure 2.7: Spin and angular momenta representation of the neutron inelastic scat-tering reaction. Two γ-rays are emitted in cascade by the residual nucleus. J andπ represent the spin and the parity of different energy levels in the target nucleus,compound nucleus (CN) and in the residual nucleus.
measured differential cross-sections at fixed angles and in consequence informationabout the γ-ray angular distribution is necessary.
The general expression for the gamma-ray differential cross-section in situationswith cylindrical symmetry for transitions between states of well defined spin andparity are given as a finite sum of the even order Legendre polynomials [70,71]:
dσ
dΩγ
(θγ) =∑
k
a2kP2k(cos θγ) (2.13)
with k=0,1,2,... and θγ is the γ-ray emission angle relatively to the direction of theincident beam. The (n,xnγ) reaction has cylindrical symmetry, with the incidentbeam direction as the symmetry axis. The dependence by the φ angle is isotropic.The maximum k value is given by the total momentum coupling conditions (seebelow). An immediate propriety that results from Eq. 2.13 is the symmetry around90o. The symmetry of γ-ray angular distribution around 900 does not depend by thereaction mechanism (compound nucleus, direct or pre-equilibrium) in contrast withthe outgoing neutron angular distribution that is symmetric only for a compoundnucleus mechanism (in the center of mass).
With the (n,nxnγ) technique the γ-ray angular distribution can be determinedmeasuring at different angles θγ. Contrary, the (n,xnγ) technique does not provideany information about the angular distribution of the outgoing neutrons.
The weighting coefficients a2k can be decomposed in a product of angular momen-tum-dependent and energy-dependent terms. The latter are just the transmissioncoefficients, contained in the penetrability term τ in the next equations. For theparticular case of the (n,n’γ) reactions when only one γ-ray is emitted (see theschematic representation in Fig. 2.7). The differential gamma-ray cross-section canbe written according to Ref. [42] as:
dσ
dΩγ
=λ2
8
∑N ′C ′W ′M(δ)τP2k(cos θγ) (2.14)
where
N ′ ≡ (−)J0+J3−j2+ 12(2J1 + 1)2(2j1 + 1)(2J2 + 1)
2J0 + 1,
28 Measurements of the (n,xnγ) cross-sections with large volume HPGe detectors
C ′ ≡ 〈(2k)0|j1j11
2− 1
2〉 ,
W ′ ≡ W (J1J1j1j1; (2k)J0)W (J1J1J2J2; (2k)j2) ,
M(δ) ≡ (1 + δ2)6−1[M(LL) + 2δM(LL′) + δ2M(LL′), with
M(LL′) ≡√
(2L + 1)(2L′ + 1)〈(2k)0|LL′1− 1〉W (J2J2LL′; (2k)J3).
τ ≡ Tl1(E1)Tl2(E2)/∑
ljE
Tl(E) .
δ is the mixing ratio and τ is the Hauser-Feshbach penetrability factor that containsthe energy dependence. C ′ is the Clebsh Gordon coefficient and P2k is the Legendrepolynomial of order 2k. The Racah coefficients W from Eq. 2.15 vanish unless k isrestricted to the values
0 ≤ k ≤ j1 , J1 , J2 , L′ (2.15)
When the idealized differential cross-section presented in Eq. 2.14 is compared withthe experimental results few additional observations has to be made.
In a calculation a cut off in the angular momenta l is done. In Ref. [42] it wasfound that an angular momentum lmax = 4 is enough to describe the γ-ray angulardistributions few MeV above the inelastic threshold. Higher angular momenta donot change significantly the shape and the amplitude of the angular distributions.
When a cascade of unobserved transitions feeds the measured transition, anadditional attenuation coefficient has to be considered. The effect of the cascade isusually to diminish the anisotropy of the distribution.
At this point it is necessary to make the distinction between the differentialcross-section dσ
dΩ(θ) and the angular distribution W (θ) that is normalized to the a0
coefficient:
W (θ) =
[Ji],L∑
k=0
c2kP2k(cos θγ), (2.16)
with c0 = 1. Based on Eq. 2.13 and Eq. 2.14 it is possible to make some generalpredictions regarding the behavior of the (n,n’γ) angular distributions for someparticular transitions. The most simple case is when the initial level of the γ-decayhas the spin and the parity 0+. For such cases the angular distribution is limited tothe k=0 and is isotropic.
At neutron energies sufficiently close to the threshold other particular cases canbe considered for the even-even nuclei. Near the threshold only the s-wave outgoingneutrons contribute to the (n,n’) cross-sections. In this approximation the angulardistributions were tabulated in Ref. [42]. Three cases are presented below andthe corresponding plots are given in Fig. 2.8. These angular distributions give thestrongest angular anisotropy.
• Jπ2 = 2+, Lπ = E2, Jπ
3 = 0+. For l2 = 0 it results that the possible values
for J1 are 32
+or 5
2
+and l1 = 2 (Fig. 2.7). Near the threshold the following
angular distribution results:
W (θγ) = 1 + 0.5428P2(cos θγ)− 0.3428P4(cos θγ). (2.17)
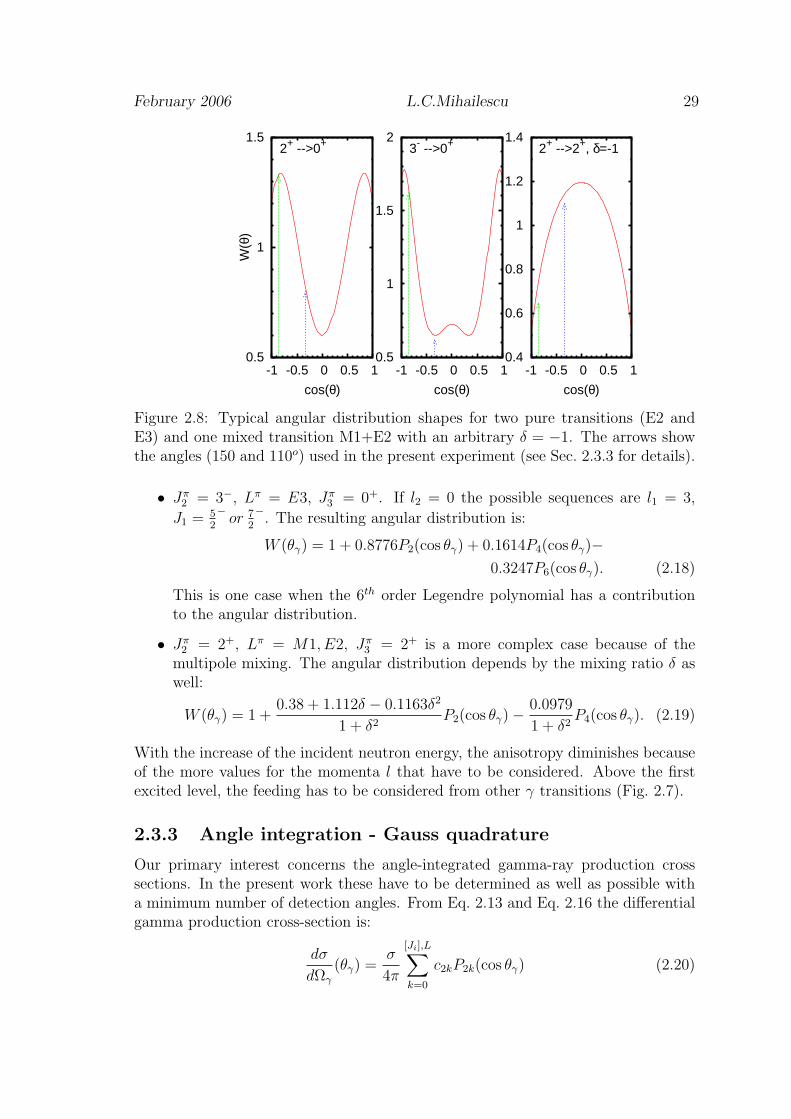
February 2006 L.C.Mihailescu 29
0.5
1
1.5
-1 -0.5 0 0.5 1
W(θ
)
cos(θ)
2+ -->0+
0.5
1
1.5
2
-1 -0.5 0 0.5 1
cos(θ)
3- -->0+
0.4
0.6
0.8
1
1.2
1.4
-1 -0.5 0 0.5 1
cos(θ)
2+ -->2+, δ=-1
Figure 2.8: Typical angular distribution shapes for two pure transitions (E2 andE3) and one mixed transition M1+E2 with an arbitrary δ = −1. The arrows showthe angles (150 and 110o) used in the present experiment (see Sec. 2.3.3 for details).
• Jπ2 = 3−, Lπ = E3, Jπ
3 = 0+. If l2 = 0 the possible sequences are l1 = 3,
J1 = 52
−or 7
2
−. The resulting angular distribution is:
W (θγ) = 1 + 0.8776P2(cos θγ) + 0.1614P4(cos θγ)−0.3247P6(cos θγ). (2.18)
This is one case when the 6th order Legendre polynomial has a contributionto the angular distribution.
• Jπ2 = 2+, Lπ = M1, E2, Jπ
3 = 2+ is a more complex case because of themultipole mixing. The angular distribution depends by the mixing ratio δ aswell:
W (θγ) = 1 +0.38 + 1.112δ − 0.1163δ2
1 + δ2P2(cos θγ)− 0.0979
1 + δ2P4(cos θγ). (2.19)
With the increase of the incident neutron energy, the anisotropy diminishes becauseof the more values for the momenta l that have to be considered. Above the firstexcited level, the feeding has to be considered from other γ transitions (Fig. 2.7).
2.3.3 Angle integration - Gauss quadrature
Our primary interest concerns the angle-integrated gamma-ray production crosssections. In the present work these have to be determined as well as possible witha minimum number of detection angles. From Eq. 2.13 and Eq. 2.16 the differentialgamma production cross-section is:
dσ
dΩγ
(θγ) =σ
4π
[Ji],L∑
k=0
c2kP2k(cos θγ) (2.20)
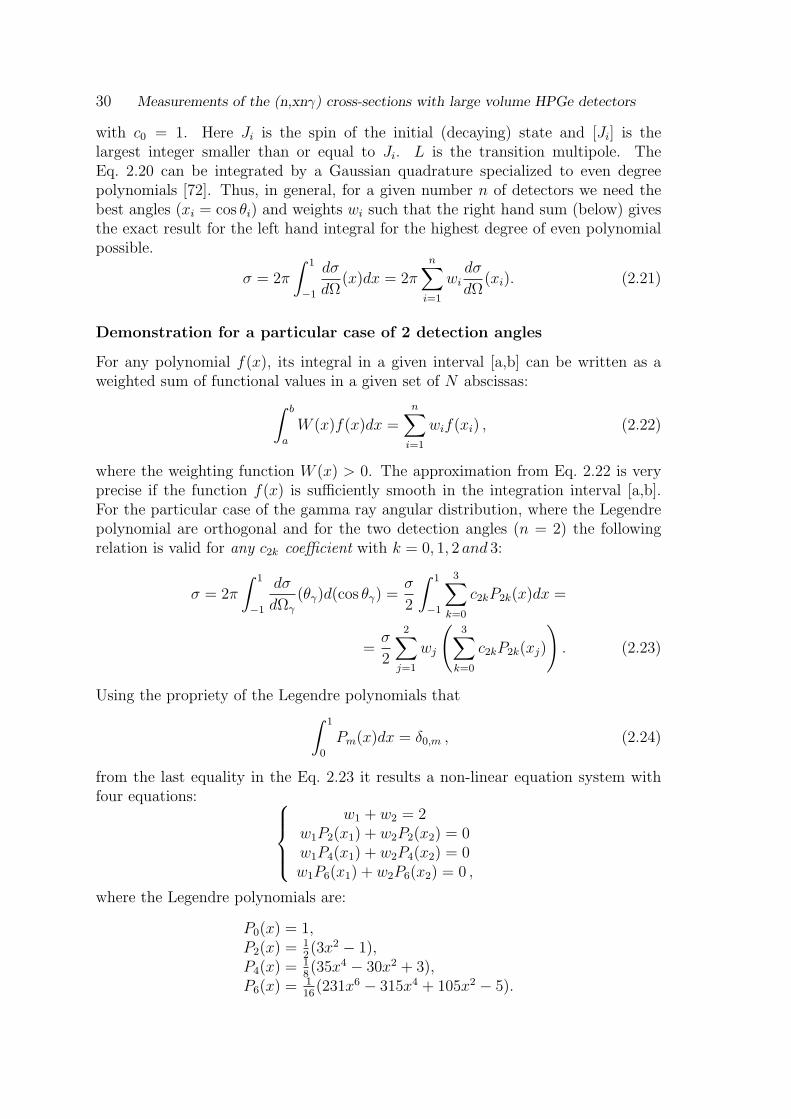
30 Measurements of the (n,xnγ) cross-sections with large volume HPGe detectors
with c0 = 1. Here Ji is the spin of the initial (decaying) state and [Ji] is thelargest integer smaller than or equal to Ji. L is the transition multipole. TheEq. 2.20 can be integrated by a Gaussian quadrature specialized to even degreepolynomials [72]. Thus, in general, for a given number n of detectors we need thebest angles (xi = cos θi) and weights wi such that the right hand sum (below) givesthe exact result for the left hand integral for the highest degree of even polynomialpossible.
σ = 2π
∫ 1
−1
dσ
dΩ(x)dx = 2π
n∑i=1
widσ
dΩ(xi). (2.21)
Demonstration for a particular case of 2 detection angles
For any polynomial f(x), its integral in a given interval [a,b] can be written as aweighted sum of functional values in a given set of N abscissas:
∫ b
a
W (x)f(x)dx =n∑
i=1
wif(xi) , (2.22)
where the weighting function W (x) > 0. The approximation from Eq. 2.22 is veryprecise if the function f(x) is sufficiently smooth in the integration interval [a,b].For the particular case of the gamma ray angular distribution, where the Legendrepolynomial are orthogonal and for the two detection angles (n = 2) the followingrelation is valid for any c2k coefficient with k = 0, 1, 2 and 3:
σ = 2π
∫ 1
−1
dσ
dΩγ
(θγ)d(cos θγ) =σ
2
∫ 1
−1
3∑
k=0
c2kP2k(x)dx =
=σ
2
2∑j=1
wj
(3∑
k=0
c2kP2k(xj)
). (2.23)
Using the propriety of the Legendre polynomials that
∫ 1
0
Pm(x)dx = δ0,m , (2.24)
from the last equality in the Eq. 2.23 it results a non-linear equation system withfour equations:
w1 + w2 = 2w1P2(x1) + w2P2(x2) = 0w1P4(x1) + w2P4(x2) = 0w1P6(x1) + w2P6(x2) = 0 ,
where the Legendre polynomials are:
P0(x) = 1,P2(x) = 1
2(3x2 − 1),
P4(x) = 18(35x4 − 30x2 + 3),
P6(x) = 116
(231x6 − 315x4 + 105x2 − 5).
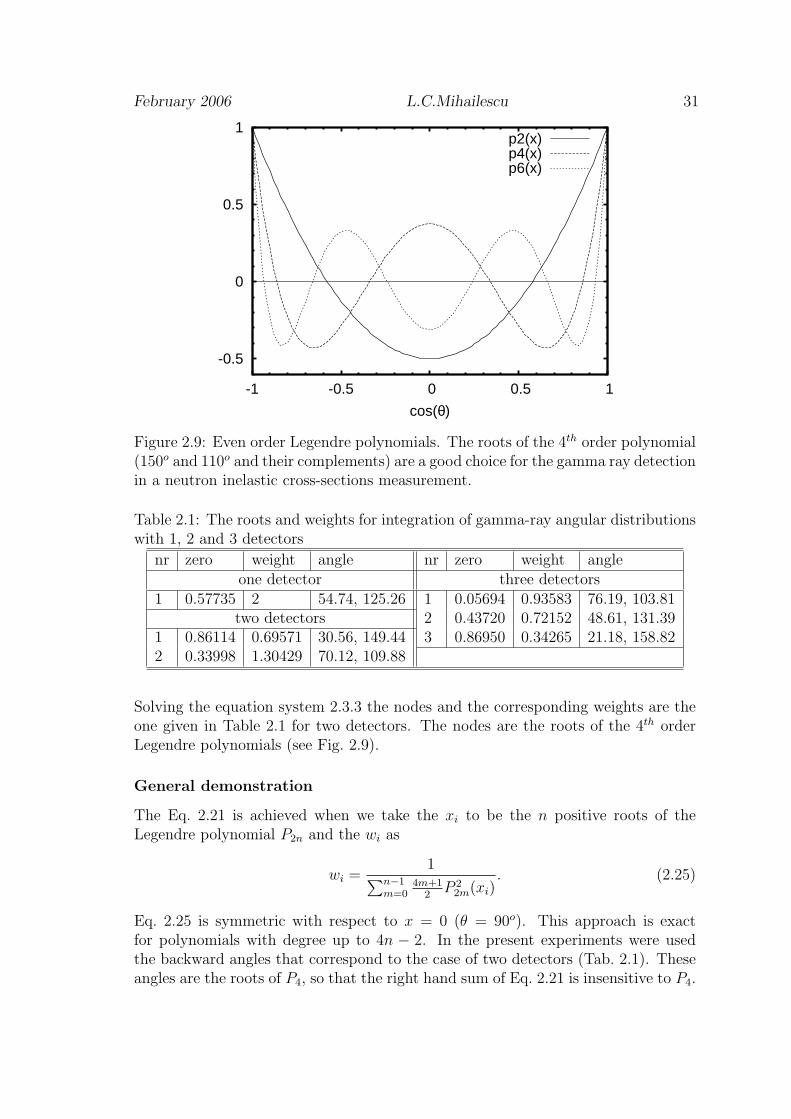
February 2006 L.C.Mihailescu 31
-0.5
0
0.5
1
-1 -0.5 0 0.5 1
cos(θ)
p2(x)p4(x)p6(x)
Figure 2.9: Even order Legendre polynomials. The roots of the 4th order polynomial(150o and 110o and their complements) are a good choice for the gamma ray detectionin a neutron inelastic cross-sections measurement.
Table 2.1: The roots and weights for integration of gamma-ray angular distributionswith 1, 2 and 3 detectors
nr zero weight angle nr zero weight angleone detector three detectors
1 0.57735 2 54.74, 125.26 1 0.05694 0.93583 76.19, 103.81two detectors 2 0.43720 0.72152 48.61, 131.39
1 0.86114 0.69571 30.56, 149.44 3 0.86950 0.34265 21.18, 158.822 0.33998 1.30429 70.12, 109.88
Solving the equation system 2.3.3 the nodes and the corresponding weights are theone given in Table 2.1 for two detectors. The nodes are the roots of the 4th orderLegendre polynomials (see Fig. 2.9).
General demonstration
The Eq. 2.21 is achieved when we take the xi to be the n positive roots of theLegendre polynomial P2n and the wi as
wi =1∑n−1
m=04m+1
2P 2
2m(xi). (2.25)
Eq. 2.25 is symmetric with respect to x = 0 (θ = 90o). This approach is exactfor polynomials with degree up to 4n − 2. In the present experiments were usedthe backward angles that correspond to the case of two detectors (Tab. 2.1). Theseangles are the roots of P4, so that the right hand sum of Eq. 2.21 is insensitive to P4.
32 Measurements of the (n,xnγ) cross-sections with large volume HPGe detectors
0
2
4
6
8
10
12
2 4 6 8 10 12 14 16 18 20
Flu
ence
(10
5 cm
-2)/
bin
of 8
ns to
f
En (MeV)
Figure 2.10: Neutron fluence measured during the 52Cr experiment with the 235Ufission chamber.
Furthermore one verifies that w1P2(x1) = −w2P2(x2) and w1P6(x1) = −w2P6(x2)so that the sum is insensitive to P2 and P6 as well. On the contrary, w1P0(x1) +w2P0(x2) = w1 + w2 = 2, as required.
Most authors, aware of the need to account for the angular distribution, haveused an angle of 125 degrees, the one detector case of table 2.1. It may be notedthat for the most common transitions L ≤ 2 and only for E3 there is a non-zerocontribution from the 6th order Legendre polynomial. Our two point approach isexact for all transitions from the first excited level to the ground state in even-evennuclei and in general takes much better care of more complex distributions.
Finally, the two angles may of course also be used to extract information aboutthe angular distribution. For instance, with f = (4π/σ)dσ/dΩ we can extractc2 ≈ 1.065(f(x1) − f(x2)). The presented integration method is rather insensitiveto the finite opening angle of the detectors as long the angular distribution is arelatively smooth function. Moreover the angular distribution coefficients may bestrongly affected by the detectors size.
2.4 Neutron beam properties at GELINA
GELINA is a multi-user neutron source that allows simultaneously measurements at12 different flight-path stations with lengths between 10 m and 400 m. The presentmeasurements were done at the 200 m stations of flight-path 3. For this flight-paththe neutron beam direction is perpendicular to the direction of the incident electronbeam.
The pulsed white neutron source GELINA produces neutrons in bursts of lessthan 1 ns full width at half maximum with a repetition rate of up to 800 per second.The neutron producing target is a rotating uranium disk that is bombarded by an
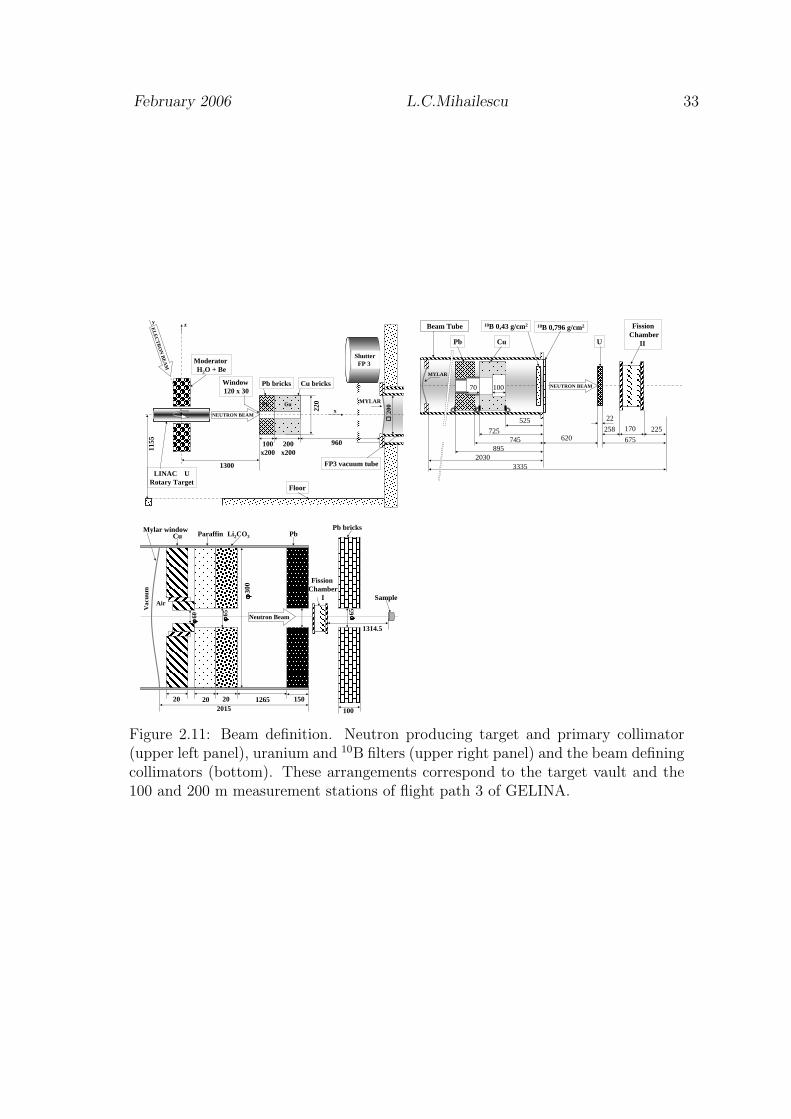
February 2006 L.C.Mihailescu 33
MYLAR
960200x200
100 x200
∅∅ ∅∅20
0CuPb
220
1300
Cu bricksPb bricksWindow 120 x 30
ShutterFP 3
LINAC URotary Target
1155
Floor
FP3 vacuum tube
Moderator H2O + Be
z
x
y
EL
EC
TR
ON
BE
AM
NEUTRON BEAM
Beam Tube
3335
170
CuPb
FissionChamber
II
2030
525
725745
895
22
620258 225
675
10B 0,796 g/cm210B 0,43 g/cm2
U
MYLAR
10070 NEUTRON BEAM
Cu Paraffin Li2CO3
Vac
uum
PbPb bricks
Fission Chamber
I Sample
Neutron Beamφφ φφ6 5
φφφφ30
0
φφ φφ60 φφφφ
65
201520 15020 20 1265
100
1314.5
Air
Mylar window
Figure 2.11: Beam definition. Neutron producing target and primary collimator(upper left panel), uranium and 10B filters (upper right panel) and the beam definingcollimators (bottom). These arrangements correspond to the target vault and the100 and 200 m measurement stations of flight path 3 of GELINA.
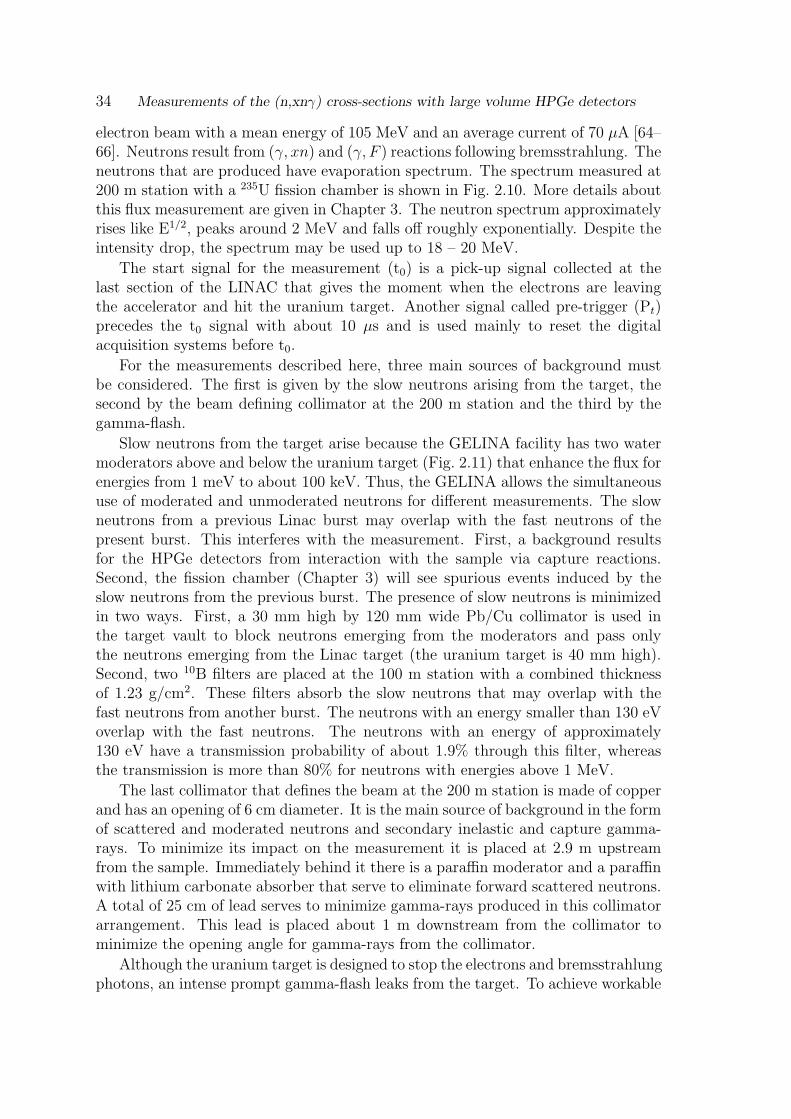
34 Measurements of the (n,xnγ) cross-sections with large volume HPGe detectors
electron beam with a mean energy of 105 MeV and an average current of 70 µA [64–66]. Neutrons result from (γ, xn) and (γ, F ) reactions following bremsstrahlung. Theneutrons that are produced have evaporation spectrum. The spectrum measured at200 m station with a 235U fission chamber is shown in Fig. 2.10. More details aboutthis flux measurement are given in Chapter 3. The neutron spectrum approximatelyrises like E1/2, peaks around 2 MeV and falls off roughly exponentially. Despite theintensity drop, the spectrum may be used up to 18 – 20 MeV.
The start signal for the measurement (t0) is a pick-up signal collected at thelast section of the LINAC that gives the moment when the electrons are leavingthe accelerator and hit the uranium target. Another signal called pre-trigger (Pt)precedes the t0 signal with about 10 µs and is used mainly to reset the digitalacquisition systems before t0.
For the measurements described here, three main sources of background mustbe considered. The first is given by the slow neutrons arising from the target, thesecond by the beam defining collimator at the 200 m station and the third by thegamma-flash.
Slow neutrons from the target arise because the GELINA facility has two watermoderators above and below the uranium target (Fig. 2.11) that enhance the flux forenergies from 1 meV to about 100 keV. Thus, the GELINA allows the simultaneoususe of moderated and unmoderated neutrons for different measurements. The slowneutrons from a previous Linac burst may overlap with the fast neutrons of thepresent burst. This interferes with the measurement. First, a background resultsfor the HPGe detectors from interaction with the sample via capture reactions.Second, the fission chamber (Chapter 3) will see spurious events induced by theslow neutrons from the previous burst. The presence of slow neutrons is minimizedin two ways. First, a 30 mm high by 120 mm wide Pb/Cu collimator is used inthe target vault to block neutrons emerging from the moderators and pass onlythe neutrons emerging from the Linac target (the uranium target is 40 mm high).Second, two 10B filters are placed at the 100 m station with a combined thicknessof 1.23 g/cm2. These filters absorb the slow neutrons that may overlap with thefast neutrons from another burst. The neutrons with an energy smaller than 130 eVoverlap with the fast neutrons. The neutrons with an energy of approximately130 eV have a transmission probability of about 1.9% through this filter, whereasthe transmission is more than 80% for neutrons with energies above 1 MeV.
The last collimator that defines the beam at the 200 m station is made of copperand has an opening of 6 cm diameter. It is the main source of background in the formof scattered and moderated neutrons and secondary inelastic and capture gamma-rays. To minimize its impact on the measurement it is placed at 2.9 m upstreamfrom the sample. Immediately behind it there is a paraffin moderator and a paraffinwith lithium carbonate absorber that serve to eliminate forward scattered neutrons.A total of 25 cm of lead serves to minimize gamma-rays produced in this collimatorarrangement. This lead is placed about 1 m downstream from the collimator tominimize the opening angle for gamma-rays from the collimator.
Although the uranium target is designed to stop the electrons and bremsstrahlungphotons, an intense prompt gamma-flash leaks from the target. To achieve workable
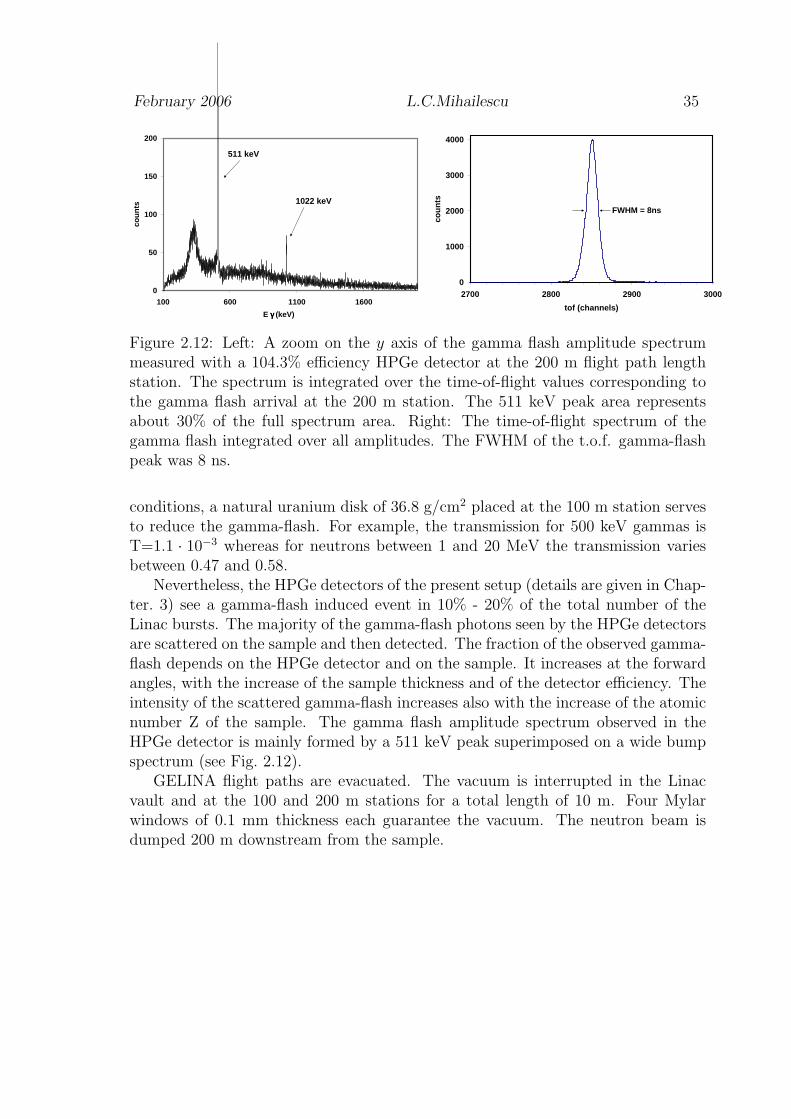
February 2006 L.C.Mihailescu 35
0
50
100
150
200
100 600 1100 1600
E γ γ γ γ (keV)
cou
nts
511 keV
1022 keV
0
1000
2000
3000
4000
2700 2800 2900 3000
tof (channels)
cou
nts
FWHM = 8ns
Figure 2.12: Left: A zoom on the y axis of the gamma flash amplitude spectrummeasured with a 104.3% efficiency HPGe detector at the 200 m flight path lengthstation. The spectrum is integrated over the time-of-flight values corresponding tothe gamma flash arrival at the 200 m station. The 511 keV peak area representsabout 30% of the full spectrum area. Right: The time-of-flight spectrum of thegamma flash integrated over all amplitudes. The FWHM of the t.o.f. gamma-flashpeak was 8 ns.
conditions, a natural uranium disk of 36.8 g/cm2 placed at the 100 m station servesto reduce the gamma-flash. For example, the transmission for 500 keV gammas isT=1.1 · 10−3 whereas for neutrons between 1 and 20 MeV the transmission variesbetween 0.47 and 0.58.
Nevertheless, the HPGe detectors of the present setup (details are given in Chap-ter. 3) see a gamma-flash induced event in 10% - 20% of the total number of theLinac bursts. The majority of the gamma-flash photons seen by the HPGe detectorsare scattered on the sample and then detected. The fraction of the observed gamma-flash depends on the HPGe detector and on the sample. It increases at the forwardangles, with the increase of the sample thickness and of the detector efficiency. Theintensity of the scattered gamma-flash increases also with the increase of the atomicnumber Z of the sample. The gamma flash amplitude spectrum observed in theHPGe detector is mainly formed by a 511 keV peak superimposed on a wide bumpspectrum (see Fig. 2.12).
GELINA flight paths are evacuated. The vacuum is interrupted in the Linacvault and at the 100 and 200 m stations for a total length of 10 m. Four Mylarwindows of 0.1 mm thickness each guarantee the vacuum. The neutron beam isdumped 200 m downstream from the sample.

36 Measurements of the (n,xnγ) cross-sections with large volume HPGe detectors

Chapter 3
Experimental setup for the(n,xnγ) cross-sectionmeasurements at GELINA
A new experimental setup was developed for the measurement of the (n,xnγ) cross-sections with x=1,2 and 3 at GELINA. The setup uses the (n,xnγ)-technique de-scribed in Sec.2.1.2 and large volume HPGe detectors. The neutron flux is monitoredwith a multi-layer 235U fission chamber that recorded simultaneously with the HPGedetectors. Conventional electronics was used for both the HPGe detectors and thefission chamber. Enriched samples were used to simplify as much as possible theγ-ray spectra and to enable (n,2n) measurements. Relatively thick samples are nec-essary with the present detection efficiency (thicknesses between 2.2 g/cm2 and 5.9g/cm2 were used) to have a small statistical uncertainty. In the setup developmentone aimed to accomplish the following requirements:
• – (n,xnγ) cross-sections measurement continuously for the full energy rangefrom the threshold up to 18-20 MeV in only one run using the pulsed whiteneutron beam from GELINA.
• – an unprecedented neutron energy resolution. This could be achieved using a200 m flight-path length and an 8 ns time-of-flight resolution. From these itresults a neutron energy resolution of 1.1 keV at 1 MeV (36 keV at 10 MeV).Such resolution was obtained for the strong γ-rays and for the total inelasticcross-section.
• – a total uncertainty of about 5% for the gamma production cross-section ofthe main transitions was obtained below about 10 MeV neutron energy. Abovethis energy the total uncertainty was kept below 15-20%. The main source ofuncertainty was the statistics of the measurement.
• – very good energy resolution for the γ-ray detectors to allow the γ-ray sep-aration in complex spectra. The best choice for this problem is the HPGedetectors.
37

38 Experimental setup for the (n,xnγ) cross-section measurements at GELINA
• – good detection efficiency. Large volume HPGe detectors were used. Duringthe measurement of different nuclei new detectors were added to improve thedetection efficiency.
• – cross-sections normalization to a well known standard cross-section. Themeasurement were normalized to the 235U neutron induced fission cross-section.
• – good beam collimation. Special attention was given to the construction ofthe beam collimators (see Sec.2.4) to have a well defined beam.
• – negligible acquisition dead time. Avoiding the acquisition dead time simplifiesthe data analysis and reduces the total uncertainty.
Continuous improvements, especially to the detection efficiency and the elec-tronic scheme, were brought to the setup during the measurement of different nuclei.In chronological order, the setup was used with success for the measurement of thefollowing nuclei: 58Ni (not part of this thesis), 52Cr, 209Bi, 207Pb, 208Pb and 206Pb.
In the next two sections a detailed description of how the goals of the experi-mental setup were achieved will be presented. The third section will be focused onthe data analysis procedure, while the last section is dedicated to the conclusions.
3.1 Experimental setup
3.1.1 HPGe detectors
The γ-rays produced in the (n,xnγ) reactions on the sample were detected withlarge-volume coaxial HPGe detectors. The samples are placed at 198.551 m fromthe GELINA target center. The HPGe detectors were placed as close as possible tothe sample, but out of the neutron beam of 6.1 cm diameter. The angles between thecrystal axis and the incident beam were 150 degrees and 110 degrees. These angleswere carefully checked with laser beams. The choice of these particular angles is ex-plained by the γ-ray angular integration procedure that was used (Gauss-quadratureat two angles – Sec.2.3.3). The reason to place the germanium detectors at back-ward angles was to reduce the intensity of the detected gamma flash scattered onthe sample (see Sec.2.4 and Sec.3.2.4). The arrangement of the HPGe detectorsand of the fission chamber is given in Fig.3.1 for the 208Pb run. An identical setupwas used for 206Pb. Table.3.1 gives the HPGe detectors characteristics used in theexperimental setup from the 52Cr run until the run with 206Pb. All detectors havea coaxial bulletized crystal (Fig.2.4).
3.1.2 Fission chamber
The neutron flux was measured with a multilayer 235U fission chamber. The fissionchamber is placed about 1.3 m upstream from the sample at 197.214 m from theGELINA target center (Fig.3.1). The chamber consists of 8 deposits of 70.00 mm
February 2006 L.C.Mihailescu 39
142.
0
Pb208 Sample Ø 69.9
Mylar
1592
φφφφ 80
Fission
Chamber
Pb wall
1314.5
cryostat
HPGe 2
HPGe 2
1100
cryostat
HPGe 3
HP
Ge3
φφφφ 61 Vac
uum
NEUTRON BEAM
cryostat
HPGe 1
HPG
e 1
1100
1500
136.5146.5
cryostat
HPGe 4
HPGe 4 146.
5
1500
Figure 3.1: Configuration of the detectors in GELINA flight path number 3 at the200 m measurement station. The germanium detectors are placed at 1500 and at 1100
with respect to the beam axis. The fission chamber for the fluence normalizationwas placed behind the lead shielding to reduce the γ-ray background around theHPGe detectors.
Table 3.1: The HPGe detectors used during the 5 runs with different samples. Therelative efficiency, ε, is given at 1.33 MeV energy. The distance is measured fromthe sample position to the detector window. Only for the detectors with berylliumwindow an additional copper absorber of 0.4 mm thickness was glued on the frontend.
nuclide angle name serial no. ε(%) distance (mm) window52Cr 110 HPGe 2 b092018 48.6 119 Al
150 HPGe 1 b093061 75.9 154 Al209Bi 110 HPGe 2 b092018 48.6 114 Al
150 HPGe 1 b093061 75.9 151 Al207Pb 110 HPGe 1 b093061 75.9 139 Al
150 HPGe 2 b04036 104.3 146 Al125 HPGe 3 44-N31866A 105 125 Be
208Pb 110 HPGe 1 b093061 75.9 136.5 Aland 110 HPGe 3 44-N31866A 105 142.0 Be
150 HPGe 2 b04036 104.3 146.5 Al206Pb 150 HPGe 4 44-N31867A 98 146.5 Be
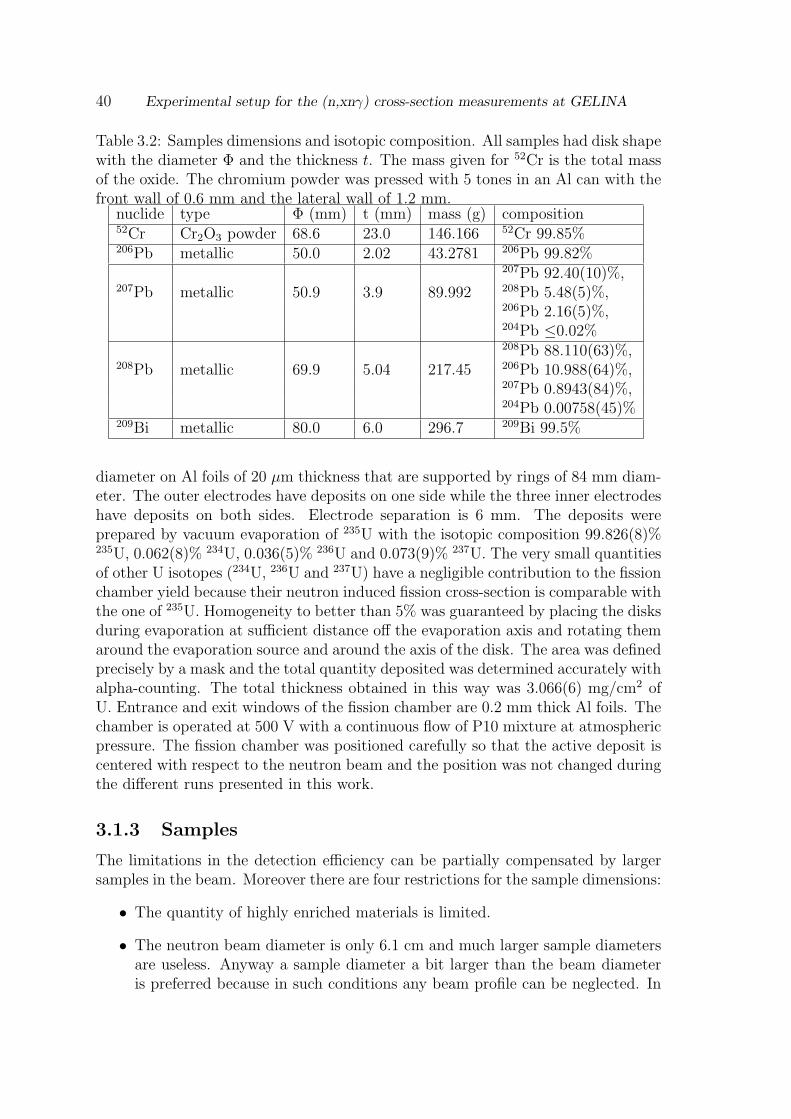
40 Experimental setup for the (n,xnγ) cross-section measurements at GELINA
Table 3.2: Samples dimensions and isotopic composition. All samples had disk shapewith the diameter Φ and the thickness t. The mass given for 52Cr is the total massof the oxide. The chromium powder was pressed with 5 tones in an Al can with thefront wall of 0.6 mm and the lateral wall of 1.2 mm.
nuclide type Φ (mm) t (mm) mass (g) composition52Cr Cr2O3 powder 68.6 23.0 146.166 52Cr 99.85%206Pb metallic 50.0 2.02 43.2781 206Pb 99.82%
207Pb 92.40(10)%,207Pb metallic 50.9 3.9 89.992 208Pb 5.48(5)%,
206Pb 2.16(5)%,204Pb ≤0.02%208Pb 88.110(63)%,
208Pb metallic 69.9 5.04 217.45 206Pb 10.988(64)%,207Pb 0.8943(84)%,204Pb 0.00758(45)%
209Bi metallic 80.0 6.0 296.7 209Bi 99.5%
diameter on Al foils of 20 µm thickness that are supported by rings of 84 mm diam-eter. The outer electrodes have deposits on one side while the three inner electrodeshave deposits on both sides. Electrode separation is 6 mm. The deposits wereprepared by vacuum evaporation of 235U with the isotopic composition 99.826(8)%235U, 0.062(8)% 234U, 0.036(5)% 236U and 0.073(9)% 237U. The very small quantitiesof other U isotopes (234U, 236U and 237U) have a negligible contribution to the fissionchamber yield because their neutron induced fission cross-section is comparable withthe one of 235U. Homogeneity to better than 5% was guaranteed by placing the disksduring evaporation at sufficient distance off the evaporation axis and rotating themaround the evaporation source and around the axis of the disk. The area was definedprecisely by a mask and the total quantity deposited was determined accurately withalpha-counting. The total thickness obtained in this way was 3.066(6) mg/cm2 ofU. Entrance and exit windows of the fission chamber are 0.2 mm thick Al foils. Thechamber is operated at 500 V with a continuous flow of P10 mixture at atmosphericpressure. The fission chamber was positioned carefully so that the active deposit iscentered with respect to the neutron beam and the position was not changed duringthe different runs presented in this work.
3.1.3 Samples
The limitations in the detection efficiency can be partially compensated by largersamples in the beam. Moreover there are four restrictions for the sample dimensions:
• The quantity of highly enriched materials is limited.
• The neutron beam diameter is only 6.1 cm and much larger sample diametersare useless. Anyway a sample diameter a bit larger than the beam diameteris preferred because in such conditions any beam profile can be neglected. In
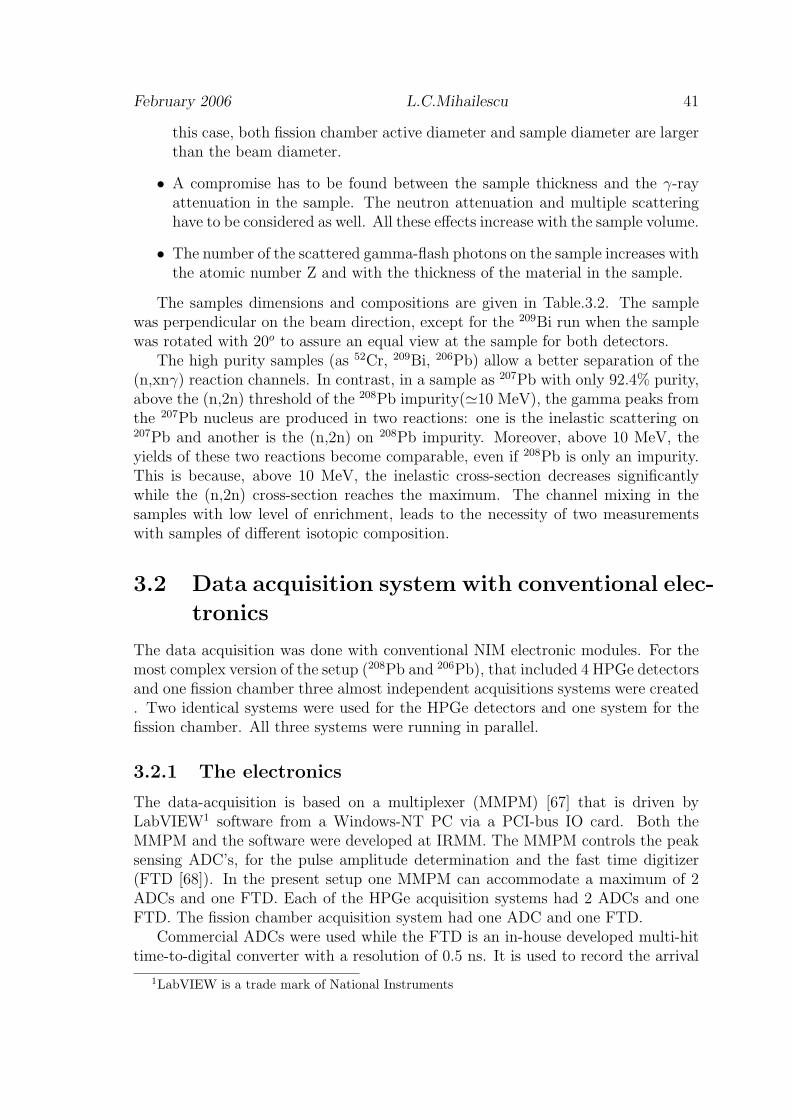
February 2006 L.C.Mihailescu 41
this case, both fission chamber active diameter and sample diameter are largerthan the beam diameter.
• A compromise has to be found between the sample thickness and the γ-rayattenuation in the sample. The neutron attenuation and multiple scatteringhave to be considered as well. All these effects increase with the sample volume.
• The number of the scattered gamma-flash photons on the sample increases withthe atomic number Z and with the thickness of the material in the sample.
The samples dimensions and compositions are given in Table.3.2. The samplewas perpendicular on the beam direction, except for the 209Bi run when the samplewas rotated with 20o to assure an equal view at the sample for both detectors.
The high purity samples (as 52Cr, 209Bi, 206Pb) allow a better separation of the(n,xnγ) reaction channels. In contrast, in a sample as 207Pb with only 92.4% purity,above the (n,2n) threshold of the 208Pb impurity('10 MeV), the gamma peaks fromthe 207Pb nucleus are produced in two reactions: one is the inelastic scattering on207Pb and another is the (n,2n) on 208Pb impurity. Moreover, above 10 MeV, theyields of these two reactions become comparable, even if 208Pb is only an impurity.This is because, above 10 MeV, the inelastic cross-section decreases significantlywhile the (n,2n) cross-section reaches the maximum. The channel mixing in thesamples with low level of enrichment, leads to the necessity of two measurementswith samples of different isotopic composition.
3.2 Data acquisition system with conventional elec-
tronics
The data acquisition was done with conventional NIM electronic modules. For themost complex version of the setup (208Pb and 206Pb), that included 4 HPGe detectorsand one fission chamber three almost independent acquisitions systems were created. Two identical systems were used for the HPGe detectors and one system for thefission chamber. All three systems were running in parallel.
3.2.1 The electronics
The data-acquisition is based on a multiplexer (MMPM) [67] that is driven byLabVIEW1 software from a Windows-NT PC via a PCI-bus IO card. Both theMMPM and the software were developed at IRMM. The MMPM controls the peaksensing ADC’s, for the pulse amplitude determination and the fast time digitizer(FTD [68]). In the present setup one MMPM can accommodate a maximum of 2ADCs and one FTD. Each of the HPGe acquisition systems had 2 ADCs and oneFTD. The fission chamber acquisition system had one ADC and one FTD.
Commercial ADCs were used while the FTD is an in-house developed multi-hittime-to-digital converter with a resolution of 0.5 ns. It is used to record the arrival
1LabVIEW is a trade mark of National Instruments
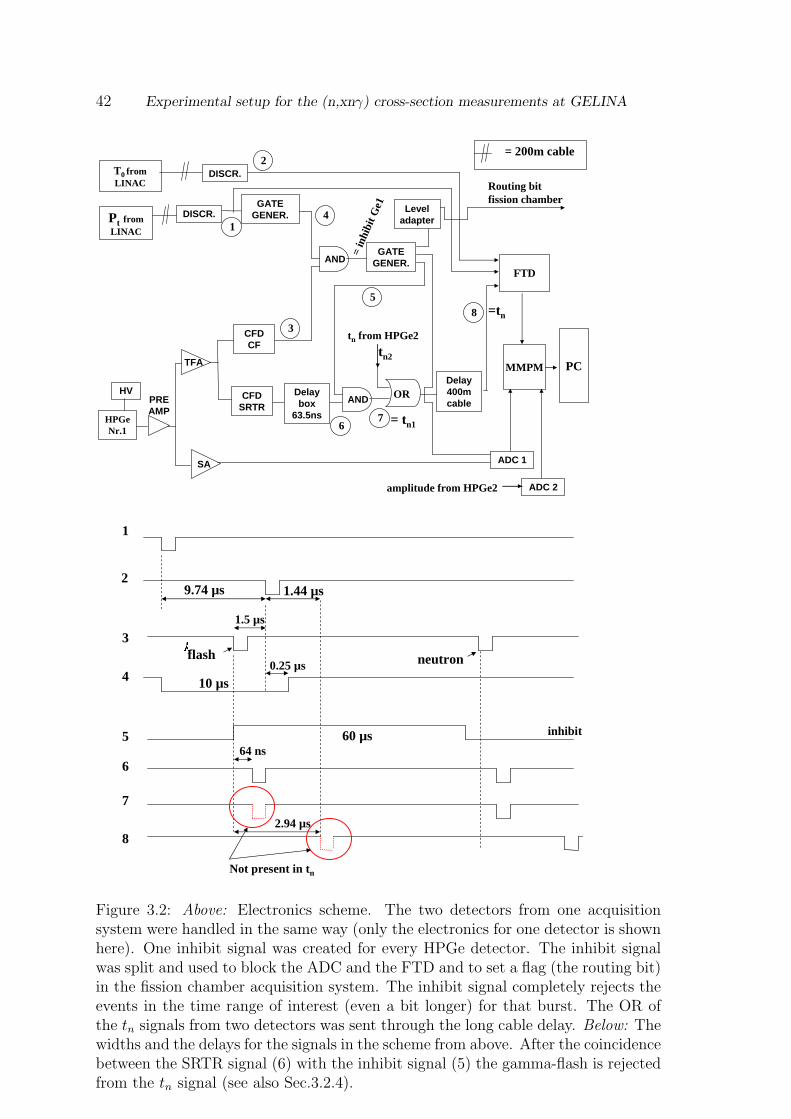
42 Experimental setup for the (n,xnγ) cross-section measurements at GELINA
HPGe Nr.1
AND
ADC 1
PC
FTD
MMPM
=tn
Pt from LINAC
GATE GENER.
T0 from LINAC
DISCR.
GATE GENER.
HVPRE AMP
SA
CFD SRTR
TFA
Delay box
63.5ns
AND ORDelay 400m cable
= tn1
tn2
Level adapter
Routing bit fission chamber
tn from HPGe2
= in
hibi
t Ge1
DISCR.
CFD CF
1
2
4
3
5
76
8
= 200m cable
ADC 2amplitude from HPGe2
9.74 µs 1.44 µs
10 µs
60 µs
1
2
3
4
5
6
7
8
64 ns
2.94 µs
Not present in tn
1.5 µs
0.25 µs
inhibit
flash neutron
Figure 3.2: Above: Electronics scheme. The two detectors from one acquisitionsystem were handled in the same way (only the electronics for one detector is shownhere). One inhibit signal was created for every HPGe detector. The inhibit signalwas split and used to block the ADC and the FTD and to set a flag (the routing bit)in the fission chamber acquisition system. The inhibit signal completely rejects theevents in the time range of interest (even a bit longer) for that burst. The OR ofthe tn signals from two detectors was sent through the long cable delay. Below: Thewidths and the delays for the signals in the scheme from above. After the coincidencebetween the SRTR signal (6) with the inhibit signal (5) the gamma-flash is rejectedfrom the tn signal (see also Sec.3.2.4).
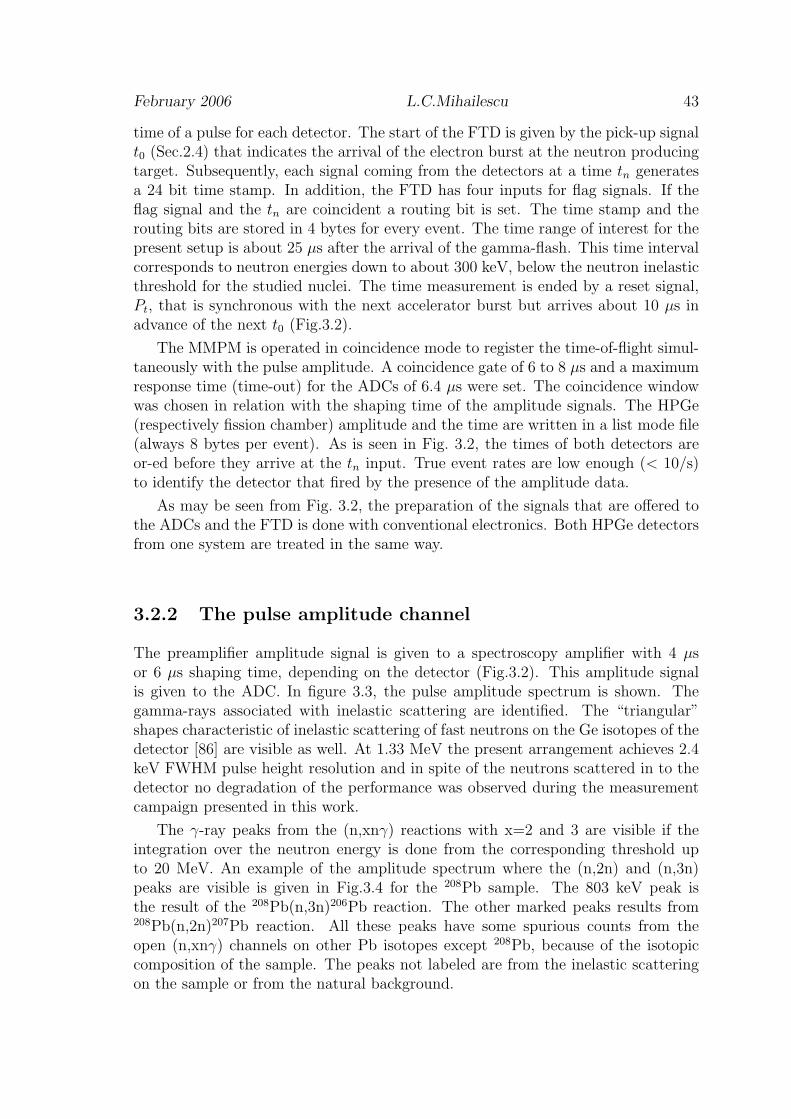
February 2006 L.C.Mihailescu 43
time of a pulse for each detector. The start of the FTD is given by the pick-up signalt0 (Sec.2.4) that indicates the arrival of the electron burst at the neutron producingtarget. Subsequently, each signal coming from the detectors at a time tn generatesa 24 bit time stamp. In addition, the FTD has four inputs for flag signals. If theflag signal and the tn are coincident a routing bit is set. The time stamp and therouting bits are stored in 4 bytes for every event. The time range of interest for thepresent setup is about 25 µs after the arrival of the gamma-flash. This time intervalcorresponds to neutron energies down to about 300 keV, below the neutron inelasticthreshold for the studied nuclei. The time measurement is ended by a reset signal,Pt, that is synchronous with the next accelerator burst but arrives about 10 µs inadvance of the next t0 (Fig.3.2).
The MMPM is operated in coincidence mode to register the time-of-flight simul-taneously with the pulse amplitude. A coincidence gate of 6 to 8 µs and a maximumresponse time (time-out) for the ADCs of 6.4 µs were set. The coincidence windowwas chosen in relation with the shaping time of the amplitude signals. The HPGe(respectively fission chamber) amplitude and the time are written in a list mode file(always 8 bytes per event). As is seen in Fig. 3.2, the times of both detectors areor-ed before they arrive at the tn input. True event rates are low enough (< 10/s)to identify the detector that fired by the presence of the amplitude data.
As may be seen from Fig. 3.2, the preparation of the signals that are offered tothe ADCs and the FTD is done with conventional electronics. Both HPGe detectorsfrom one system are treated in the same way.
3.2.2 The pulse amplitude channel
The preamplifier amplitude signal is given to a spectroscopy amplifier with 4 µsor 6 µs shaping time, depending on the detector (Fig.3.2). This amplitude signalis given to the ADC. In figure 3.3, the pulse amplitude spectrum is shown. Thegamma-rays associated with inelastic scattering are identified. The “triangular”shapes characteristic of inelastic scattering of fast neutrons on the Ge isotopes of thedetector [86] are visible as well. At 1.33 MeV the present arrangement achieves 2.4keV FWHM pulse height resolution and in spite of the neutrons scattered in to thedetector no degradation of the performance was observed during the measurementcampaign presented in this work.
The γ-ray peaks from the (n,xnγ) reactions with x=2 and 3 are visible if theintegration over the neutron energy is done from the corresponding threshold upto 20 MeV. An example of the amplitude spectrum where the (n,2n) and (n,3n)peaks are visible is given in Fig.3.4 for the 208Pb sample. The 803 keV peak isthe result of the 208Pb(n,3n)206Pb reaction. The other marked peaks results from208Pb(n,2n)207Pb reaction. All these peaks have some spurious counts from theopen (n,xnγ) channels on other Pb isotopes except 208Pb, because of the isotopiccomposition of the sample. The peaks not labeled are from the inelastic scatteringon the sample or from the natural background.

44 Experimental setup for the (n,xnγ) cross-section measurements at GELINA
3500 4000 4500 5000 5500 6000 6500 7000 7500 80000
2000
4000
6000 500 1000 1500 2000 2500 30000
40000
80000
120000
160000
2038
.0KeV
Cou
nts
Channel
52Cr(n,n' γγγγ)52Cr
2337
.44KeV
647.4
7KeV
1727
.53KeV
1530
.67KeV
1333
.65KeV
935K
eV
1434
.1 KeV
Cou
nts
Figure 3.3: Amplitude spectrum obtained for the 52Cr(n,n’γ)52Cr reaction. Thespectrum was integrated over the neutron energies from the inelastic threshold upto 20 MeV. Using the enriched 52Cr2O3 sample (Table. 3.2) the amplitude spectrumwas very much simplified.
0
100
200
300
400
500
600
0 500 1000 1500 2000 2500 3000
Cou
nts
Eγ (keV)
<-- 5
69 ke
V
<-- 8
97 ke
V
<-- 1
593
keV
<-- 1
770
keV
<-- 2
092
keV
<-- 8
03 ke
V (n,3
n)
Figure 3.4: Amplitude spectrum obtained for the 208Pb sample (Table. 3.2) withintegration over the neutron energy from 8 MeV up to 20 MeV.
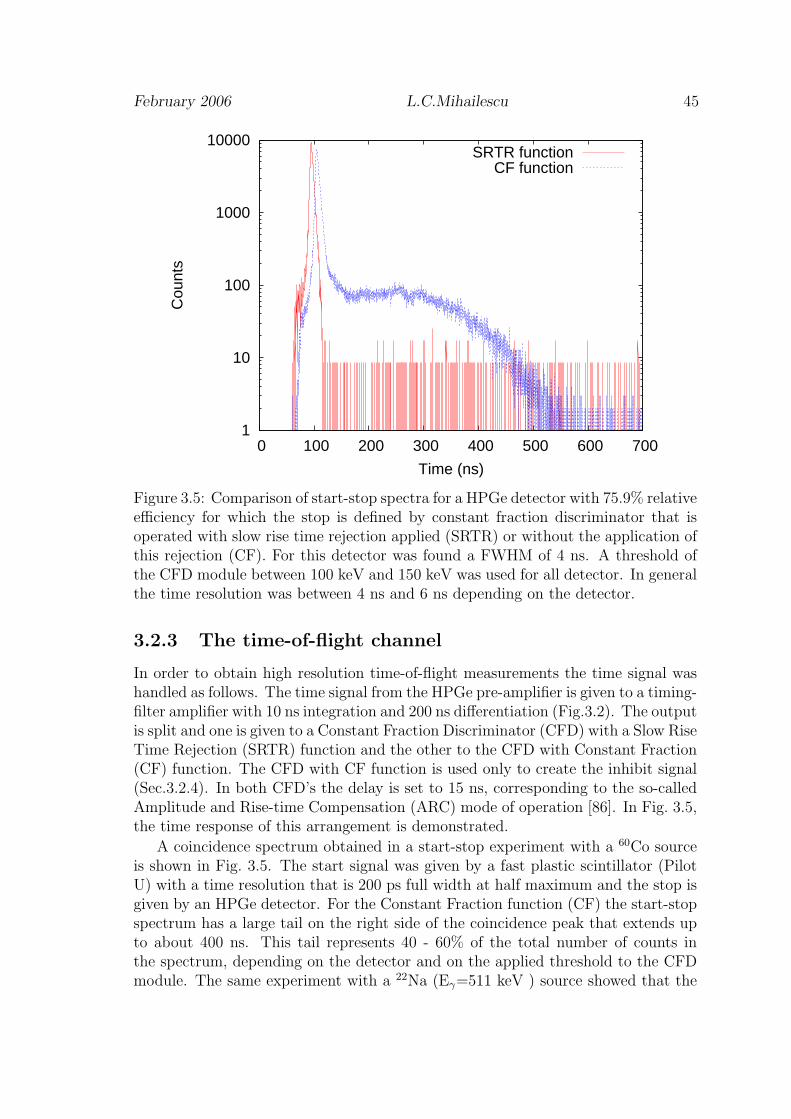
February 2006 L.C.Mihailescu 45
1
10
100
1000
10000
0 100 200 300 400 500 600 700
Cou
nts
Time (ns)
SRTR functionCF function
Figure 3.5: Comparison of start-stop spectra for a HPGe detector with 75.9% relativeefficiency for which the stop is defined by constant fraction discriminator that isoperated with slow rise time rejection applied (SRTR) or without the application ofthis rejection (CF). For this detector was found a FWHM of 4 ns. A threshold ofthe CFD module between 100 keV and 150 keV was used for all detector. In generalthe time resolution was between 4 ns and 6 ns depending on the detector.
3.2.3 The time-of-flight channel
In order to obtain high resolution time-of-flight measurements the time signal washandled as follows. The time signal from the HPGe pre-amplifier is given to a timing-filter amplifier with 10 ns integration and 200 ns differentiation (Fig.3.2). The outputis split and one is given to a Constant Fraction Discriminator (CFD) with a Slow RiseTime Rejection (SRTR) function and the other to the CFD with Constant Fraction(CF) function. The CFD with CF function is used only to create the inhibit signal(Sec.3.2.4). In both CFD’s the delay is set to 15 ns, corresponding to the so-calledAmplitude and Rise-time Compensation (ARC) mode of operation [86]. In Fig. 3.5,the time response of this arrangement is demonstrated.
A coincidence spectrum obtained in a start-stop experiment with a 60Co sourceis shown in Fig. 3.5. The start signal was given by a fast plastic scintillator (PilotU) with a time resolution that is 200 ps full width at half maximum and the stop isgiven by an HPGe detector. For the Constant Fraction function (CF) the start-stopspectrum has a large tail on the right side of the coincidence peak that extends upto about 400 ns. This tail represents 40 - 60% of the total number of counts inthe spectrum, depending on the detector and on the applied threshold to the CFDmodule. The same experiment with a 22Na (Eγ=511 keV ) source showed that the

46 Experimental setup for the (n,xnγ) cross-section measurements at GELINA
0
200
400
600
800
0 20 40 60 80 100
Cou
nts
Time (ns)
FWHM=8.5 nsFWHM=6.5 nsFWHM=5.0 ns
50 keV150 keV300 keV
1
10
100
1000
0 100 200 300 400 500 600
Cou
nts
Time (ns)
FWHM=8.5 ns 50 keVFWHM=6.0 ns 150 keVFWHM=5.0 ns 300 keV
Figure 3.6: The dependence of the time resolution spectra of a 104.3% relativeefficiency detector on the CFD threshold with the two functions: Left: SRTR andRight: CF. The CFD threshold was increased from 50 keV to 300 keV. The timeresolution of the spectra (FWHM) was kept almost the same for a given thresholdwhen changed from the SRTR to the CF function.
fraction of counts in the tail increases. On the contrary, the tail is almost completelyeliminated when the SRTR option is used, leaving a single peak with the same fullwidth at half maximum.
The dependence on the CFD threshold of the time resolution spectra with theSRTR and with the CF functions is given in Fig. 3.6. Increasing the CFD thresholdfrom 50 keV to 300 keV, the FWHM of the time spectra decreases from 8.5 ns to 5 nsfor a detector of 104.3% relative efficiency. For a very low CFD threshold (50 keV)a small tail appears on the left side of the spectra in both cases, SRTR and CF.This effect appears only for a very low threshold, close to the noise amplitude. Thissuggests again that the signals that give a poor time resolution are the signals withlow amplitude. Moreover, the tails in the time spectra are larger for the detectorswith larger volume of the crystal since the length of the tail corresponds to thecharge collection time. This confirms the expectation that the differences in theshapes of the preamplifier output signals become larger with the increase of thedetector volume.
As may be deduced from the tests with the sources, this excellent time-of-flightresponse using the SRTR option results in a strongly energy dependent efficiencythat drops much more rapidly than usual below 500 keV (Fig.3.10). In the presentcases studied the main transitions are above 500 keV, so this loss of efficiency canbe accepted.
The origin of this behavior lies in the requirement that inside a constant fractiondiscriminator are a zero crossing detector and a leading edge detector. The firstsignal from either one of the two, arms the CFD. The last signal determines thetime. For low amplitude events or for slow rise times the leading edge detectormay trigger after the zero crossing detector so that the circuit produces a pulsewith the time defined by the leading edge detector. The latter has a time spreadthat is strongly pulse amplitude dependent and may range up to the maximum

February 2006 L.C.Mihailescu 47
rise time (650 ns). This results in the behavior shown in Fig. 3.5. For the presentmeasurements, all data were taken with the SRTR option selected and with a CFDthreshold between 100 keV and 150 keV.
3.2.4 Gamma flash rejection
The gamma flash (Sec.2.4) causes an event by gammas which are scattered on thesample and then detected by HPGe detector. As already indicated, this happensfor a substantial fraction of the total number of Linac bursts (10-20% in everydetector), depending on the atomic number Z and on the thickness of the sample.The detection of the gamma-flash can introduce a dead time in the acquisitionsystem in the case of a pile-up with a neutron induced event. In the present setupthe detectors themselves are not saturated and can resolve the pile-ups. The FTD isworking in the multihit mode and can separate the pile-ups with the gamma-flash.
The MMPM has a coincidence window of 8 µs and a maximum allowed con-version time for the ADCs (time-out) of 6.4 µs (see Sec.3.2.1). These give in total14.4 µs dead time due only to the MMPM because in the coincidence mode, oncean event is detected, the acquisition is blocked until all the connected ADCs finishthe conversion. Another source of dead time appears in the spectroscopic amplifiersthat are not able to resolve pulses that come closer than 4-6 µs (the shaping time)to each other. The dead time due to the spectroscopic amplifier is smaller thanthe dead time of the MMPM and is already included in the latest, having the samecause, the pile-up. The MMPM dead time is negligible for low counting rates.
In the present setup the time range of interest for the measurement is only about25 µs after the t0. The average neutron induced counting rate is very small, about6 counts/s per detector, in the time range of interest. This means that for everydetector there is less than one neutron induced event in one burst, which means anaverage of 7.5·10−3 neutrons in every burst. Due to the fact the prompt events aredetected within the first 25 µs after the t0, the instantaneous counting rate aftert0 has to be also considered. This is about 0.4 neutrons/burst considering that theevent are uniformly distributed within the first 25 µs after the t0. At these countingrates the probability to have two neutron induced events in one burst is very small.
The only problem to be solved is the pile-up of the neutron induced event withthe gamma-flash events. The dead time in the MMPM becomes effective only whenone gamma-flash and at least one neutron induced event are detected simultaneouslyin one burst. Then the MMPM is busy for 14.4 µs recording the gamma flash andany neutron induced event that comes in this time interval is lost. The time-of-flightof 14.4 µs, at 200 m flight path length, corresponds to about 1 MeV neutron energy.This means that any neutron with the energy larger than 1 MeV may be affectedby the pile-up with a gamma flash induced event.
To avoid such a pile-up problem, which implies the difficulty to quantify a vari-able dead time, one decided to eliminate all bursts for which a gamma-flash inducedevent was detected. For this purpose an inhibit signal was created. Different im-provements were brought to the construction of the inhibit signal during the mea-surement campaign. Here is presented the last version of the scheme (Fig.3.2).
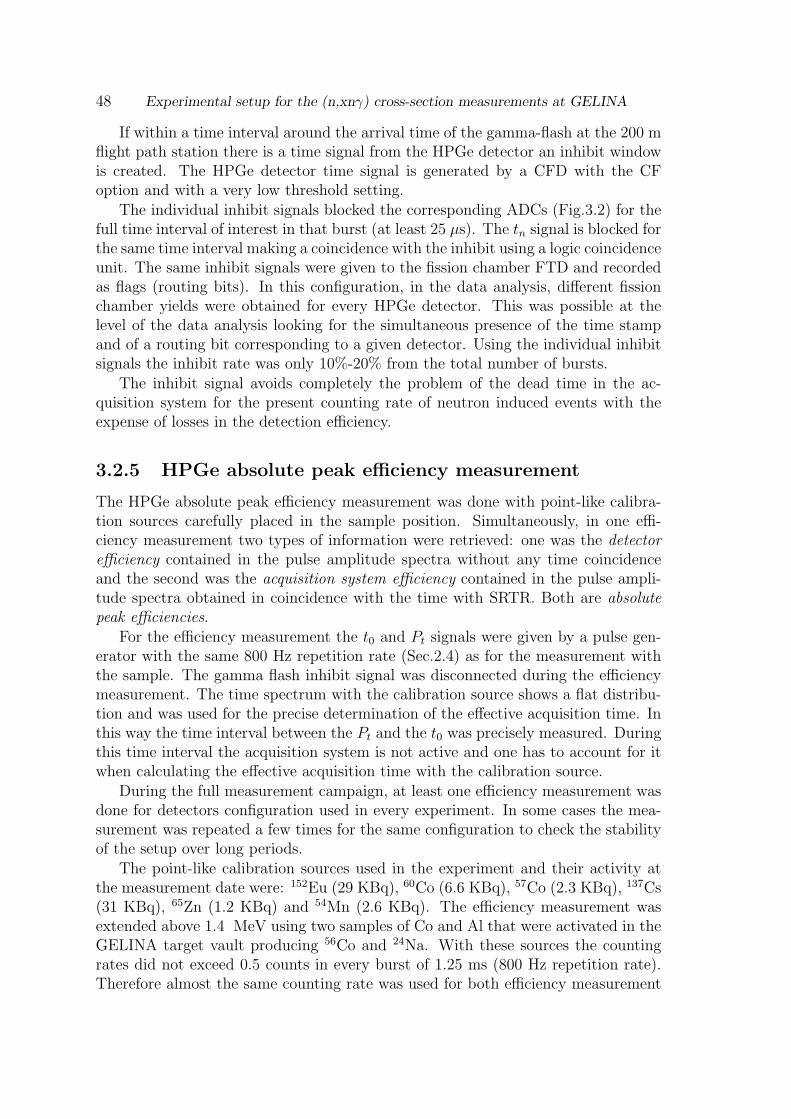
48 Experimental setup for the (n,xnγ) cross-section measurements at GELINA
If within a time interval around the arrival time of the gamma-flash at the 200 mflight path station there is a time signal from the HPGe detector an inhibit windowis created. The HPGe detector time signal is generated by a CFD with the CFoption and with a very low threshold setting.
The individual inhibit signals blocked the corresponding ADCs (Fig.3.2) for thefull time interval of interest in that burst (at least 25 µs). The tn signal is blocked forthe same time interval making a coincidence with the inhibit using a logic coincidenceunit. The same inhibit signals were given to the fission chamber FTD and recordedas flags (routing bits). In this configuration, in the data analysis, different fissionchamber yields were obtained for every HPGe detector. This was possible at thelevel of the data analysis looking for the simultaneous presence of the time stampand of a routing bit corresponding to a given detector. Using the individual inhibitsignals the inhibit rate was only 10%-20% from the total number of bursts.
The inhibit signal avoids completely the problem of the dead time in the ac-quisition system for the present counting rate of neutron induced events with theexpense of losses in the detection efficiency.
3.2.5 HPGe absolute peak efficiency measurement
The HPGe absolute peak efficiency measurement was done with point-like calibra-tion sources carefully placed in the sample position. Simultaneously, in one effi-ciency measurement two types of information were retrieved: one was the detectorefficiency contained in the pulse amplitude spectra without any time coincidenceand the second was the acquisition system efficiency contained in the pulse ampli-tude spectra obtained in coincidence with the time with SRTR. Both are absolutepeak efficiencies.
For the efficiency measurement the t0 and Pt signals were given by a pulse gen-erator with the same 800 Hz repetition rate (Sec.2.4) as for the measurement withthe sample. The gamma flash inhibit signal was disconnected during the efficiencymeasurement. The time spectrum with the calibration source shows a flat distribu-tion and was used for the precise determination of the effective acquisition time. Inthis way the time interval between the Pt and the t0 was precisely measured. Duringthis time interval the acquisition system is not active and one has to account for itwhen calculating the effective acquisition time with the calibration source.
During the full measurement campaign, at least one efficiency measurement wasdone for detectors configuration used in every experiment. In some cases the mea-surement was repeated a few times for the same configuration to check the stabilityof the setup over long periods.
The point-like calibration sources used in the experiment and their activity atthe measurement date were: 152Eu (29 KBq), 60Co (6.6 KBq), 57Co (2.3 KBq), 137Cs(31 KBq), 65Zn (1.2 KBq) and 54Mn (2.6 KBq). The efficiency measurement wasextended above 1.4 MeV using two samples of Co and Al that were activated in theGELINA target vault producing 56Co and 24Na. With these sources the countingrates did not exceed 0.5 counts in every burst of 1.25 ms (800 Hz repetition rate).Therefore almost the same counting rate was used for both efficiency measurement

February 2006 L.C.Mihailescu 49
0.97
0.98
0.99
1
1.01
1.02
1.03
0 500 1000 1500
ε fre
e / ε
coin
cide
nce
Eγ (keV)
HPGe1 - 208Pb
Figure 3.7: Comparison of the detector efficiency measurement with two differentsettings of the MMPM (Sec.3.2.1) : free mode and coincidence mode. There is nosignificant difference between the two operation modes for the detector efficiency.
and experiment with the neutron beam and the sample.
Fig.3.7 shows the ratio between the detector efficiency measured in two differentoperation modes of the MMPM: free and coincidence mode. The free mode operationdoes not use any coincidence window or time-out (Sec.3.2.1) that may introduceadditional dead time. The fact that within the errors the efficiency ratio in thetwo cases equals one confirms the absence of the dead time in the coincidence modeoperation of the setup during the efficiency measurement.
3.3 Data analysis
From the sorting of the list-mode file data recorded by the acquisition systems thenet peak area of the γ-ray transition of interest is obtained as a function of neutronenergy. The differential gamma production cross-sections at the two measurementangles 110o and 150o are obtained after the appropriate normalization of the netpeak area. The goal of the data analysis is to obtain the integral gamma productioncross-section as a function of neutron energy. For the particular case of the inelasticscattering (x=1), the total inelastic and the level cross-section can be constructedas well. The main steps followed in the data analysis and the applied correctionsare described in the following.

50 Experimental setup for the (n,xnγ) cross-section measurements at GELINA
3.3.1 Differential gamma production cross-section calcula-tion
Let us consider a generalized version of the experimental setup described in thischapter. The differential gamma production cross-section is symmetric with respectto the azimuth angle φ (φ ∈ [0 : 2π]). At the same angle θi (θ ∈ [0 : π]) but differentφ a number Nθi
of detectors can be accommodated. In such a case the differentialgamma production cross-section at the angle θi is given by the following relation:
dσ
dΩ(θi, Ek) =
1
4π
tUts
As
AU
D2beam
D2sample
εFCσU(Ek)
cms(Ek)
∑j=Nθi
j=0Yj(Ek)
εjYFCj(Ek)1
ε(Yj(Ek))∑j=Nθi
j=01
δ(Yj(Ek))
, (3.1)
For the last version of the setup (Table. 3.1) described in the present chapter, twodetection angles were used, θ1=110o and θ2=150o and Nθ1 = Nθ2 = 2. k labels thetime-of-flight bin. Thus, the above expression is applied to each k time-of-flight binwith its corresponding neutron energy Ek.
Yj(Ek) is the net peak yield for the gamma-ray of interest for HPGe detector jat time bin k and δ(Yj(Ek)) is its relative uncertainty. Due to the way of applyingthe inhibit signal to the fission chamber, the fission chamber yield YFCj(Ek), isdetector dependent. εj is the absolute peak efficiency of HPGe detector j for theγ-ray of interest. εFC is the fission chamber efficiency. tU and ts are the mass arealdensities of 235U for the fission chamber and for the sample. AU and As are therespective atomic mass numbers. σU(Ek) is the 235U(n,F) standard cross section forthe energy bin k obtained from [69]. cms(Ek) is a correction factor for the neutronbeam attenuation and multiple scattering. Finally, Dbeam is the beam diameter andDsample is the effective diameter of the sample that intersects the beam. For thesamples with a diameter greater than the beam diameter the convention is usedthat
Dbeam
Dsample
= 1. (3.2)
Writing the differential gamma production cross-section as in Eq.3.1 allowed abetter treatment of the quadratic propagation of the uncertainty. As resulted fromSec. 2.3.3, the integral gamma production cross-section can be calculated with thefollowing relation:
σ(Ek) = 2π[w1dσ
dΩ(110, Ek) + w2
dσ
dΩ(150, Ek)], (3.3)
where the weights are w1 and w2 are given in Table 2.1.Based on the level scheme of the nucleus, from the integral gamma-production
cross-sections, the total inelastic and the level inelastic cross-sections are constructedas described in Sec.2.1.2.
3.3.2 Sorting the HPGe data
The data were recorded in list mode for 500 to 1000 hours per isotope in runs of afew days that were each subdivided in cycles of 2 hours. The cycles during which the

February 2006 L.C.Mihailescu 51
accelerator did not work continuously were identified and excluded from the sortingprocess. The list mode data were sorted by newly developed C++ codes that weretailored to the experiment. For each run the data was sorted in two-dimensionalmatrices (2500 time channels - 8192 amplitude channels). The time bins of 0.5 nsfrom the binary file were grouped in bins of 8 ns to obtain reasonable statistics perbin and to have a bin width larger than the time resolution of the HPGe detectors.The time axis of the matrices was chosen to include neutrons from the inelasticthreshold up to 20 MeV. To compensate for the variations in the offset of the γ-ray energy calibration, these matrices were shifted such that the main transition isalways in the same channel before they were summed together in one matrix foreach detector.
Regions of interest for gamma-rays of sufficient intensity were determined fromthe amplitude projection (e.g. Fig. 3.3) of the matrix. Similarly, from such a figurethe regions of interest for the background determination were fixed as well. Formost cases a linear fit of the background was sufficient, but for some gamma-rays aquadratic fit was required. Peak areas and background subtraction were extractedfor each time-channel of 8 ns. The validity of this approach was verified by checkingthe neutron-energy dependence of the amplitude projections in coarse energy bins.
The offset calibration of the time histograms was done relative to the positionof the peak of the gamma-flash. The gamma flash position in the spectrum waschecked periodically and no significant shifts were observed. In order to observe thegamma flash the inhibit signal was removed for a short time at the beginning andat the end of each run.
3.3.3 HPGe efficiency corrections
As seen from Sec.3.2.5, the HPGe efficiency measurement was done with point-likecalibration sources while the samples used in the measurements had a finite size(Sec.3.1.3). This suggests that a correction for the extended volume source has tobe done. Moreover, the γ-ray attenuation in the sample has to be considered. Thesetwo corrections were done simultaneously by means of MCNP calculations [73]. TheMCNP-4C version of the code was used. The calculation was done in two steps:
• The experimental setup was carefully described in the MCNP input. Detaileddescriptions of the HPGe detectors (dimensions of the crystals, of the contactsand of the crystal holders) were used. The monoenergetic point-like γ-raysource was placed in the position of the sample center. Different input fileswere created to cover the energy range of interest, from 250 keV up to 5 MeV,changing only the γ-ray energy. The results of these MCNP calculations werecompared with the experimental detector efficiency (Sec.3.2.5). Small adjust-ments were done for the HPGe detectors geometry especially adding thin deadlayers on the crystal and the calculation was repeated until a good agreementwith the measurement was obtained. In Fig.3.8 two examples of the compar-ison between the point-like source MCNP calculation and the measurementare shown. The calculations matched the measurement within 5% to 15%,
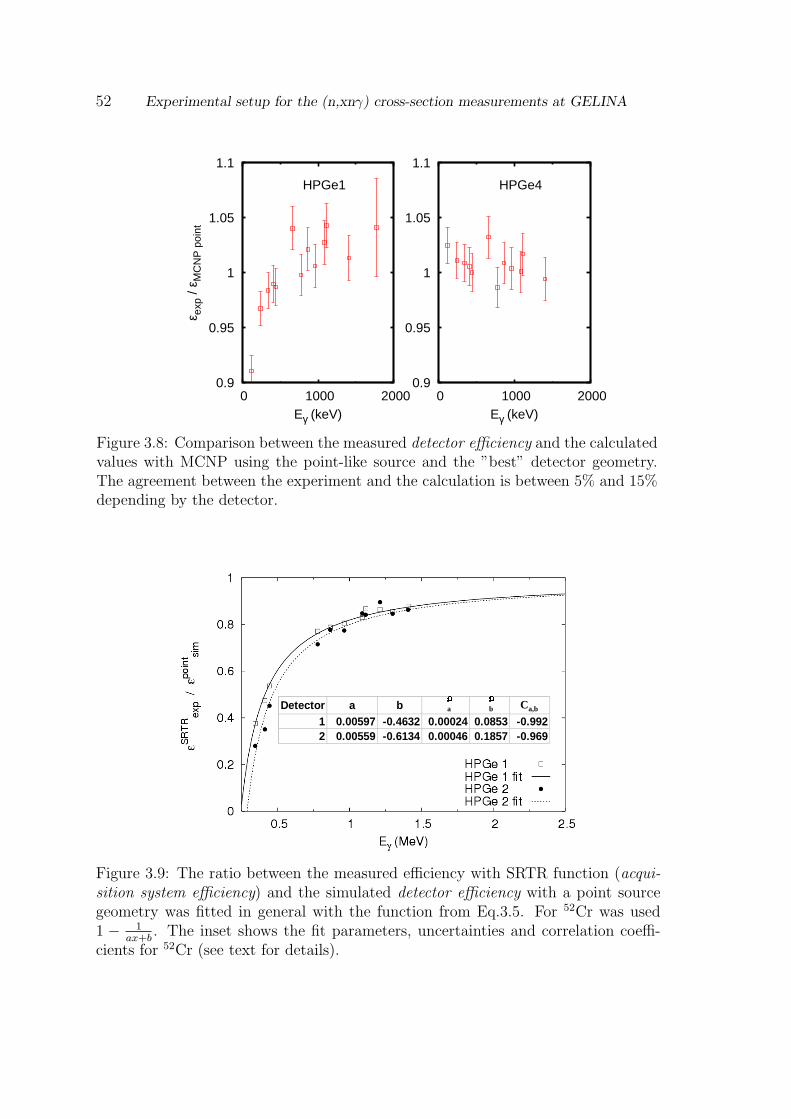
52 Experimental setup for the (n,xnγ) cross-section measurements at GELINA
0.9
0.95
1
1.05
1.1
0 1000 2000
ε exp
/ ε M
CN
P p
oint
Eγ (keV)
HPGe1
0.9
0.95
1
1.05
1.1
0 1000 2000Eγ (keV)
HPGe4
Figure 3.8: Comparison between the measured detector efficiency and the calculatedvalues with MCNP using the point-like source and the ”best” detector geometry.The agreement between the experiment and the calculation is between 5% and 15%depending by the detector.
Detector a b1 0.00597 -0.4632 0.00024 0.0853 -0.9922 0.00559 -0.6134 0.00046 0.1857 -0.969
a
b Ca,b
Figure 3.9: The ratio between the measured efficiency with SRTR function (acqui-sition system efficiency) and the simulated detector efficiency with a point sourcegeometry was fitted in general with the function from Eq.3.5. For 52Cr was used1 − 1
ax+b. The inset shows the fit parameters, uncertainties and correlation coeffi-
cients for 52Cr (see text for details).
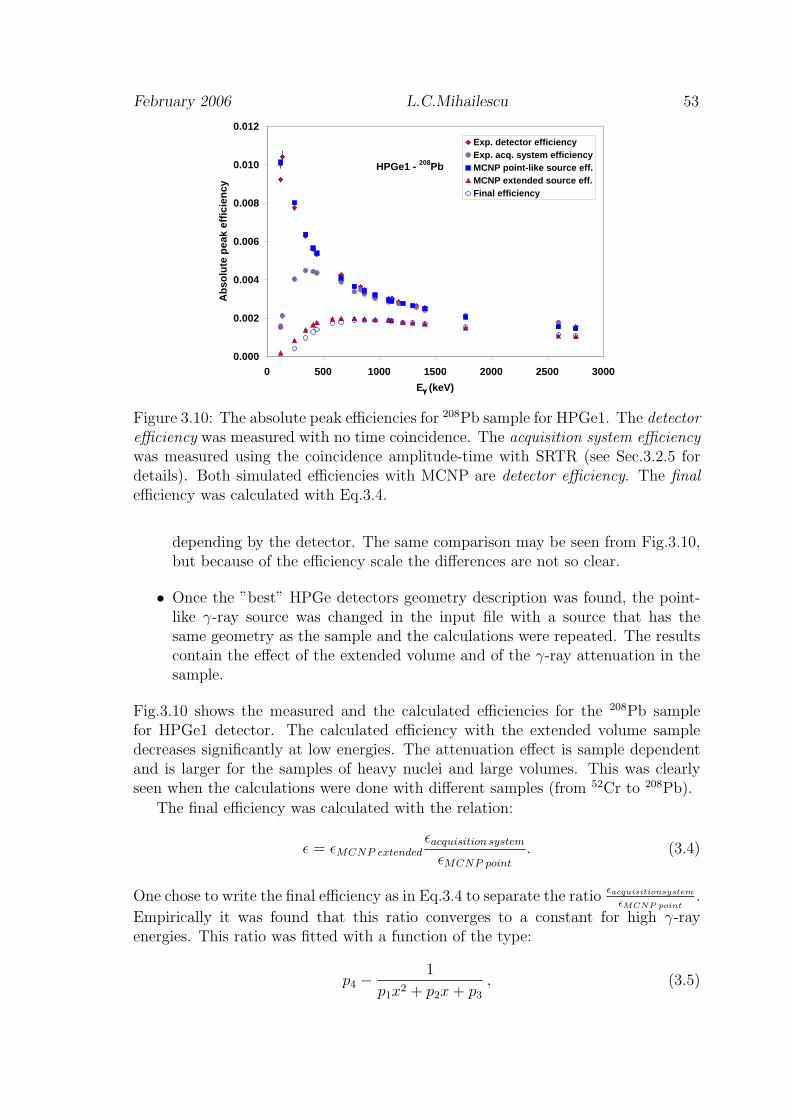
February 2006 L.C.Mihailescu 53
HPGe1 - 208Pb
0.000
0.002
0.004
0.006
0.008
0.010
0.012
0 500 1000 1500 2000 2500 3000
Eγγγγ (keV)
Ab
solu
te p
eak
effi
cien
cy
Exp. detector efficiencyExp. acq. system efficiencyMCNP point-like source eff.MCNP extended source eff.Final efficiency
Figure 3.10: The absolute peak efficiencies for 208Pb sample for HPGe1. The detectorefficiency was measured with no time coincidence. The acquisition system efficiencywas measured using the coincidence amplitude-time with SRTR (see Sec.3.2.5 fordetails). Both simulated efficiencies with MCNP are detector efficiency. The finalefficiency was calculated with Eq.3.4.
depending by the detector. The same comparison may be seen from Fig.3.10,but because of the efficiency scale the differences are not so clear.
• Once the ”best” HPGe detectors geometry description was found, the point-like γ-ray source was changed in the input file with a source that has thesame geometry as the sample and the calculations were repeated. The resultscontain the effect of the extended volume and of the γ-ray attenuation in thesample.
Fig.3.10 shows the measured and the calculated efficiencies for the 208Pb samplefor HPGe1 detector. The calculated efficiency with the extended volume sampledecreases significantly at low energies. The attenuation effect is sample dependentand is larger for the samples of heavy nuclei and large volumes. This was clearlyseen when the calculations were done with different samples (from 52Cr to 208Pb).
The final efficiency was calculated with the relation:
ε = εMCNP extendedεacquisition system
εMCNP point
. (3.4)
One chose to write the final efficiency as in Eq.3.4 to separate the ratioεacquisitionsystem
εMCNP point.
Empirically it was found that this ratio converges to a constant for high γ-rayenergies. This ratio was fitted with a function of the type:
p4 − 1
p1x2 + p2x + p3
, (3.5)

54 Experimental setup for the (n,xnγ) cross-section measurements at GELINA
where pi (i=1,2,3,4) are the parameters of the fit. In this way the global trend of theratio
εacquisitionsystem
εMCNP pointwas described better and the errors of the individual points were
reduced. Such a fit served for the efficiency interpolation below the highest energyused in the measurement (1.4 MeV) and for the extrapolation above this energy.
Eq.3.4 includes simultaneously the following three effects:
• the finite size and the γ-ray attenuation of the sample,
• the decrease in the efficiency due to the application of the SRTR function onthe CFD’s,
• the difference between the MCNP point-like source calculation and the mea-sured detector efficiencies (Fig.3.8).
3.3.4 Neutron fluence
The fission chamber data were treated similarly with cycles in one-to-one corre-spondence with the gamma-ray measurements and stored in a matrix of time versusamplitude. The time axis of this matrix was rebinned to account for the differencein flight path length (1.3 m) between the sample and the fission chamber.
The amplitude spectrum for the full time-range of interest is shown in Fig.3.11.The peak at low amplitude is due to the α decay of 235U and the rest of the spectrumis due to neutron induced fission. The region between channels 850 and 8192 containsneutron induced events only. This pulse amplitude region was used to determineYFC(Ek) for each time channel k of 8 ns (see also Fig.2.10). In this way the numberof neutron induced events was underestimated. This is taken care of by the fissionchamber efficiency in Eq. 3.1. which was determined by the following expression(see also Fig. 3.11).
εFC =spectrum area from channel 850 to 8192
area extrapolated triangle + spectrum area from channel 850 to 8192
It was found that εFC = 0.984 ± 1.6%. To reduce statistical fluctuations, the FCyield YFC was smoothed with a moving average window of 31 channels of 8 ns.
3.3.5 Grouping the time-of-flight bins
The 8 ns time-of-flight resolution is usually appropriate for the strong γ-ray transi-tions at low neutron energies. Above 10 MeV, even for the main transition of thestudied nuclide the statistics in 8 ns bins may become poor. In consequence, for someγ-ray transitions a grouping of several t.o.f. bins in one is necessary. The groupingof the t.o.f. bins (neutron energy bins) must be done differently on different energyregions. For correct uncertainty propagation the t.o.f. bins are grouped at the levelof the detector yield. In Eq.3.1 the time-of-flight bins, k, must be grouped for alldetectors, HPGe and fission chamber, in the same way.

February 2006 L.C.Mihailescu 55
400 600 800 1000 1200 14000
50
100
150
200
250
0 2000 4000 6000 80000
50
100
150
200
250 fc spectrum linear extrapolation neutron
induced events
y=-28.45 + 0.061 *x
850
cou
nts
channel
cou
nts
channel
Figure 3.11: Left: fission chamber amplitude histogram sliced from the 2D matrix,with the time-of-flight from channel 1 up to 1500, which means neutrons from be-low inelastic threshold up to about 20 MeV. Right: expanded spectrum and theextrapolation of the neutron induced events.
The grouping of n time-of-flight consecutive bins in one is done according to theequation:
Y ′j (Ek′) =
k=j+n∑
k=j
Y (Ek), (3.6)
where the Y ′j (Ek′) is the yield in the resulted energy (time) bin with the limits
Ej,Ej+n.
3.3.6 Multiple scattering and neutron flux attenuation
For a precise measurement of the incident neutron flux that interacts with a finitesize sample, two effects need to be accounted for. The first is the neutron attenuationin all materials after the fission chamber. This material includes the external wallof the fission chamber, the air, the sample container (if the case) and the sampleitself. The neutrons may be removed from the beam through different reactions (e.g.capture or reaction with emission of charge particles and no neutrons as (n,p),(n,α)).The second is the multiple scattering in the sample. This means that the neutron hasa first interaction in the sample, loses some energy and than produces the (n,xnγ)reaction of interest. The first interaction may be elastic scattering of even another(n,xnγ) reaction, in which more than one neutron may cause this effect.
The two effects were determined simultaneously using the Monte Carlo codeMCNP [73]. The geometry of the experimental setup was described in the input fileof the code. The reaction rate in the sample for the full geometry is compared tothe reaction rate when the materials in the beam following the fission chamber areabsent (Fig. 3.12). The measured gamma-production cross-sections were introduced
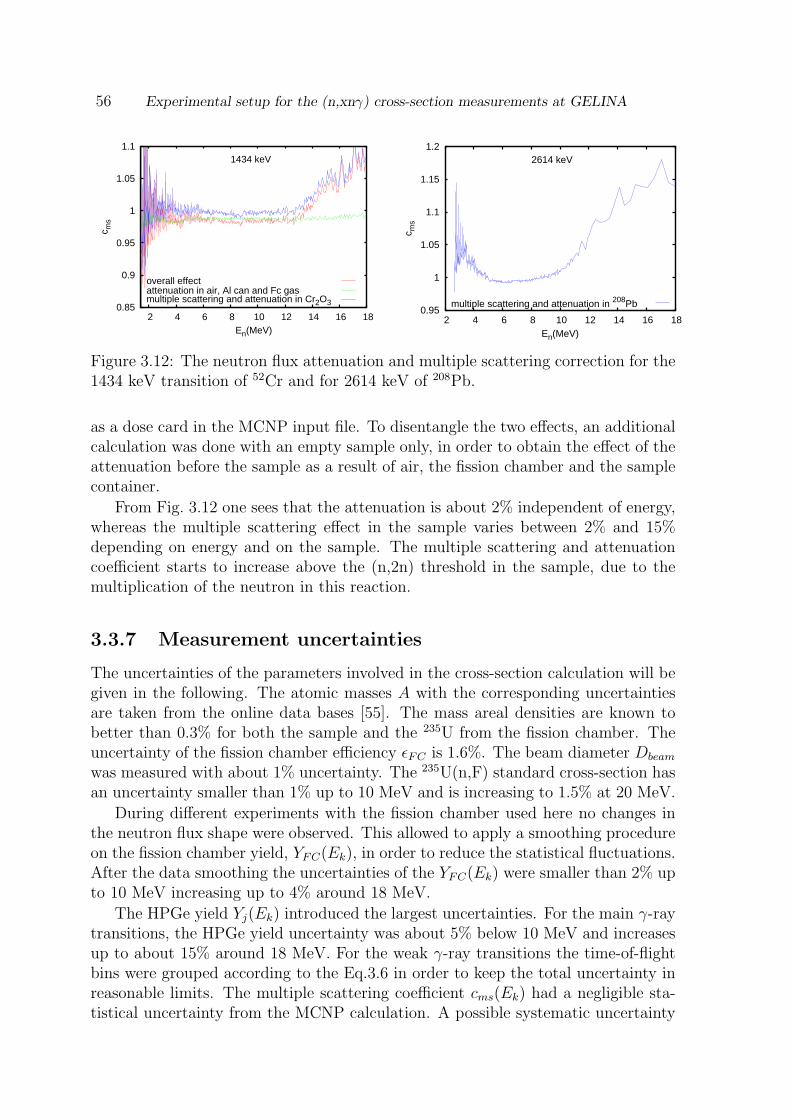
56 Experimental setup for the (n,xnγ) cross-section measurements at GELINA
0.85
0.9
0.95
1
1.05
1.1
2 4 6 8 10 12 14 16 18
c ms
En(MeV)
1434 keV
overall effectattenuation in air, Al can and Fc gasmultiple scattering and attenuation in Cr2O3
0.95
1
1.05
1.1
1.15
1.2
2 4 6 8 10 12 14 16 18
c ms
En(MeV)
2614 keV
multiple scattering and attenuation in 208Pb
Figure 3.12: The neutron flux attenuation and multiple scattering correction for the1434 keV transition of 52Cr and for 2614 keV of 208Pb.
as a dose card in the MCNP input file. To disentangle the two effects, an additionalcalculation was done with an empty sample only, in order to obtain the effect of theattenuation before the sample as a result of air, the fission chamber and the samplecontainer.
From Fig. 3.12 one sees that the attenuation is about 2% independent of energy,whereas the multiple scattering effect in the sample varies between 2% and 15%depending on energy and on the sample. The multiple scattering and attenuationcoefficient starts to increase above the (n,2n) threshold in the sample, due to themultiplication of the neutron in this reaction.
3.3.7 Measurement uncertainties
The uncertainties of the parameters involved in the cross-section calculation will begiven in the following. The atomic masses A with the corresponding uncertaintiesare taken from the online data bases [55]. The mass areal densities are known tobetter than 0.3% for both the sample and the 235U from the fission chamber. Theuncertainty of the fission chamber efficiency εFC is 1.6%. The beam diameter Dbeam
was measured with about 1% uncertainty. The 235U(n,F) standard cross-section hasan uncertainty smaller than 1% up to 10 MeV and is increasing to 1.5% at 20 MeV.
During different experiments with the fission chamber used here no changes inthe neutron flux shape were observed. This allowed to apply a smoothing procedureon the fission chamber yield, YFC(Ek), in order to reduce the statistical fluctuations.After the data smoothing the uncertainties of the YFC(Ek) were smaller than 2% upto 10 MeV increasing up to 4% around 18 MeV.
The HPGe yield Yj(Ek) introduced the largest uncertainties. For the main γ-raytransitions, the HPGe yield uncertainty was about 5% below 10 MeV and increasesup to about 15% around 18 MeV. For the weak γ-ray transitions the time-of-flightbins were grouped according to the Eq.3.6 in order to keep the total uncertainty inreasonable limits. The multiple scattering coefficient cms(Ek) had a negligible sta-tistical uncertainty from the MCNP calculation. A possible systematic uncertainty

February 2006 L.C.Mihailescu 57
that may come from the procedure used for the simulation was not evaluated.
The uncertainty of HPGe detectors efficiency, εi was less than 3% for almost allgamma rays below 1.4 MeV. Above 1.4 MeV the efficiency uncertainty increases upto 4-5%. The major experimental component in this uncertainty was the error on thecalibration source activity, 1.5%, the rest was coming from the applied corrections.The statistical uncertainties from the efficiency measurement and from the MCNPsimulations were less than 1%. The self-attenuation of the gamma ray and the effectof the finite extension of the sample are based completely on the MCNP simulations.Special effort was done to reduce any systematic error of these MCNP simulationsdescribing as realistic as possible the geometry of the detectors and of the sample(see also [1]).
3.4 Conclusions
A new high resolution spectrometer was built at the GELINA facility for the mea-surement of gamma-ray production cross sections in the (n,xnγ) reactions (x=1,2and 3) on the full energy range from the thresholds up to about 20 MeV. A neutronenergy resolution of 1.1 keV at 1 MeV (36 keV at 10 MeV) and a total uncertaintyof about 5% below 10 MeV (up to 15-20% at 20 MeV) was achieved for the mainγ-ray transitions.
The (n,n’γ)-technique was used with large volume HPGe detectors. Based onthe level scheme of the nucleus, the total inelastic and the level inelastic cross-sections can be constructed up to about 4 MeV neutron energy (corresponding tothe maximum excitation energy of an observed excited level). Above this energy thetotal inelastic cross-section constructed with the same procedure is only a lower limitfor the exact value (Sec.2.1.2). This limit for the total inelastic cross-section maybe very close to the real cross section, when there is no significant direct decay tothe ground state, especially in the even-even nuclei. The cross-section normalizationwas done relatively to the standard 235U fission cross-section.
The present setup is more suitable for the nuclei that emit γ-ray with energiesabove 500 keV and with low conversion coefficients. Any full converted transition(e.g. E0) and any isomer levels are not accessible with the present setup. Using then,n’γ technique the γ-ray angular distribution may be measured, but no informationabout the outgoing neutron angular distribution may be obtained.
Finally, one should mention that in the present experimental setup there is animportant efficiency loss first due to the SRTR mode of operation (especially below500 keV) and secondly due to the pile-up between the neutron induced events withan event from the GELINA gamma-flash. The latter represents 10 to 20% for everydetector. One solution of both these problems is the use of fast digitizers ∗ for thedata acquisition. An alternative for the conventional acquisition system presentedin this chapter will be presented in Chapter 4 where a completely independent
∗Difference should be made between the fast digitizer described in the Chapter 4 and the fasttime digitizer, FTD, (multi-hit time-to-digital converter) used with the conventional acquisitionsystem (Sec.3.2.1)

58 Experimental setup for the (n,xnγ) cross-section measurements at GELINA
acquisition system based on a fast digitizer will be described.

Chapter 4
Data acquisition system with afast digitizer
The experimental setup described in the previous chapter was successfully used for(n,xnγ) cross-section measurements. The major inconvenience of this experimentalsetup is the long time interval needed to achieve the described unprecedented per-formances. With four HPGe detectors about 500 hours of effective acquisition timeare still needed. During such long acquisition periods changes in the setup settingsmay occur due to fluctuations in the ambient temperature or failure of differentelectronic modules.
Because of this, an increase in the detection efficiency, resulting in a smaller ac-quisition time, is desired. There are two solutions to increase the detection efficiency:to increase the number of detectors and to reduce the losses in the data acquisitionsystem. The first solution is relatively expensive and the number of detectors wasalready increased from two (52Cr measurement) to four. To gain another factor oftwo in the detection efficiency implies adding another 4 detectors.
The losses in the acquisition system can be reduced using a new acquisition sys-tem based on a fast digitizer. A DC440 fast digitizer from AcqirisTM was used. Thischapter will describe the tests that were done for the evaluation of the performancesof such a fast digitizer with large volume HPGe detectors. The main parametersthat were monitored during the tests were the time and amplitude resolutions andthe highest counting rate at which the dead time is still negligible. As a first stepof the fast digitizer testing, data were taken with a start-stop experimental setupbetween a large volume HPGe detector and a plastic scintillator (Sec. 4.4.1). Theresults of applying different pulse processing algorithms on the same data set takenwith the start-stop setup were compared. The pulse processing algorithm that gavethe best results was implemented for an online data acquisition and then used for thecross-section measurements. The electronic scheme for the data acquisition systembased on the fast digitizer will be given in Sec. 4.5.
The results obtained with the data acquisition based on the fast digitizer aregiven in Sec. 4.6. This section contains the final comparison between the differen-tial gamma-production cross-sections measured in parallel with the two completelyindependent acquisition systems: conventional electronics and fast digitizer. The
59

60 Data acquisition system with a fast digitizer
last section of this chapter is dedicated to the conclusions on the data acquisitionsystem with the fast digitizer.
4.1 The goal of a new acquisition system
In the data acquisition system based on the conventional electronics presented inSec. 3.2 detected events are rejected in two ways:
• using the inhibit signal for the suppression of the gamma flash induced eventand
• using the SRTR function of the CFD to obtain a good time resolution for thelarge volume HPGe detectors.
The SRTR function and the rejection of the gamma flash events were explained indetail in Sec. 2.2 and respectively Sec. 3.2.4. Only a summary of the problems willbe recalled here.
The neutron bursts in which a gamma-flash induced event was detected wererejected to avoid a variable dead time in the acquisition system. When working incoincidence mode, the MMPM of the conventional acquisition system is not able toresolve two events that come separated in time by less than 14.4 µs (8 µs coincidencewindow and 6.4 µs the conversion time of the ADC). In addition to this limitation,the spectrosopic amplifier gives a poor energy resolution in the case when two eventsare separated by less than about 18 µs, if the shaping time is 6 µs. At the averagecounting rates of this setup (6 neutron induced events per second) this two limi-tations affect only the neutron bursts that have a pile-up between a gamma flashand a neutron induced event. Solving the problem of these pile-ups increases thedetection efficiency with 10-20% per detector, depending on the detector efficiencyand on the detection angle.
Up to 40-60% detection efficiency is gained especially at low energies if the useof the SRTR function of the CFD is avoided without any deterioration of the timeresolution. This represents the amount of rejected events from the tail of the timeresolution spectrum with the CF function (see Fig. 3.5).
A solution for these two problems is a new data acquisition system based on afast digitizer. The goal for the use of the fast digitizer was to gain detection efficiencyas mentioned above and to have at least the same performance as the conventionalacquisition system. An additional advantage of a fast digitizer is the simplicity ofthe experimental setup, because the number of used electronic modules is reducedsignificantly.
4.2 Working principle of a fast digitizer
A fast digitizer is a flash analog-to-digital converter that records samples of theinput signal with a high repetition rate and transfers them for signal processing.Two properties define the performances of a fast digitizer: the number of bits for
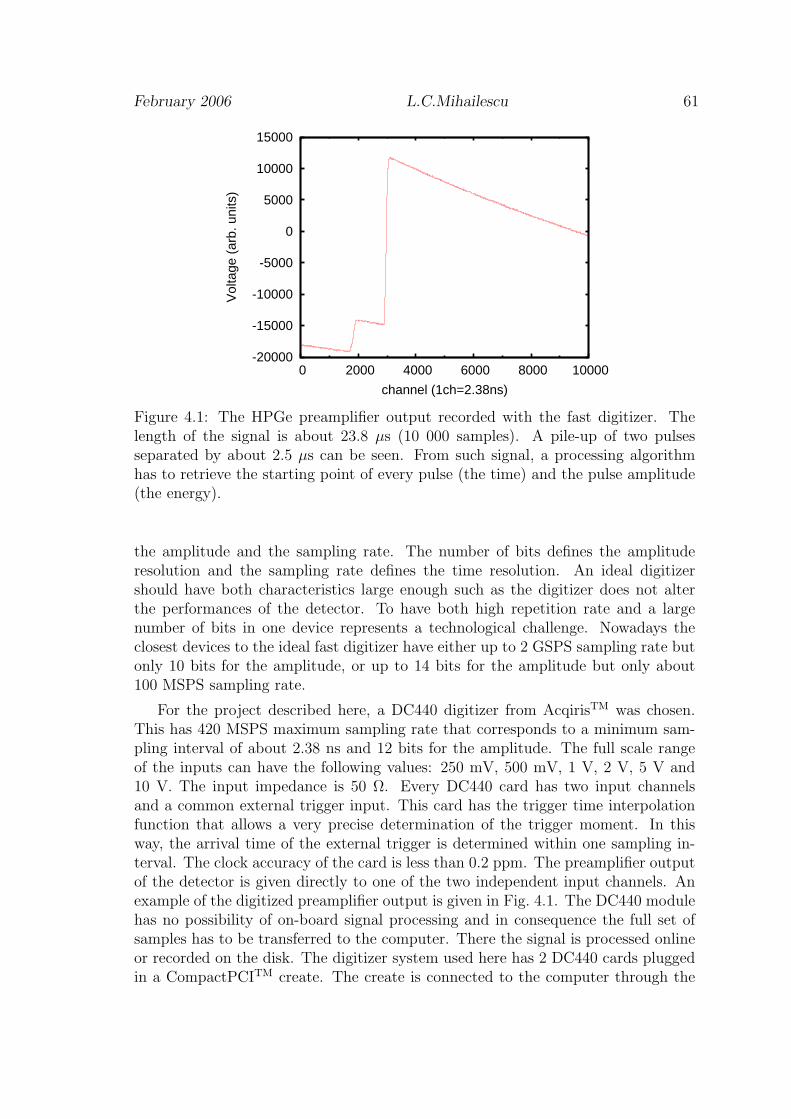
February 2006 L.C.Mihailescu 61
-20000
-15000
-10000
-5000
0
5000
10000
15000
0 2000 4000 6000 8000 10000
Vol
tage
(ar
b. u
nits
)
channel (1ch=2.38ns)
Figure 4.1: The HPGe preamplifier output recorded with the fast digitizer. Thelength of the signal is about 23.8 µs (10 000 samples). A pile-up of two pulsesseparated by about 2.5 µs can be seen. From such signal, a processing algorithmhas to retrieve the starting point of every pulse (the time) and the pulse amplitude(the energy).
the amplitude and the sampling rate. The number of bits defines the amplituderesolution and the sampling rate defines the time resolution. An ideal digitizershould have both characteristics large enough such as the digitizer does not alterthe performances of the detector. To have both high repetition rate and a largenumber of bits in one device represents a technological challenge. Nowadays theclosest devices to the ideal fast digitizer have either up to 2 GSPS sampling rate butonly 10 bits for the amplitude, or up to 14 bits for the amplitude but only about100 MSPS sampling rate.
For the project described here, a DC440 digitizer from AcqirisTM was chosen.This has 420 MSPS maximum sampling rate that corresponds to a minimum sam-pling interval of about 2.38 ns and 12 bits for the amplitude. The full scale rangeof the inputs can have the following values: 250 mV, 500 mV, 1 V, 2 V, 5 V and10 V. The input impedance is 50 Ω. Every DC440 card has two input channelsand a common external trigger input. This card has the trigger time interpolationfunction that allows a very precise determination of the trigger moment. In thisway, the arrival time of the external trigger is determined within one sampling in-terval. The clock accuracy of the card is less than 0.2 ppm. The preamplifier outputof the detector is given directly to one of the two independent input channels. Anexample of the digitized preamplifier output is given in Fig. 4.1. The DC440 modulehas no possibility of on-board signal processing and in consequence the full set ofsamples has to be transferred to the computer. There the signal is processed onlineor recorded on the disk. The digitizer system used here has 2 DC440 cards pluggedin a CompactPCITM create. The create is connected to the computer through the

62 Data acquisition system with a fast digitizer
PCI bus.
An important limitation of the DC440 module is the transfer speed through thePCI bus (up to 100 MB/s). As it will be seen in the following sections, for themeasurements at the 200 m flight path station, about 10 000 samples are needed tocover the neutron energy range of interest (400 keV up to 20 MeV). In the worstcase when both cards have a trigger simultaneously, 40 000 samples have to betransferred. The transfer of these data can be done in slightly less than 1.25 mswhich is the time interval between two consecutive neutron bursts. Moreover, theaverage counting rate is 6 neutron induced events per second and so no dead timeshould appear.
4.3 Digital algorithms for signal analysis
In this section the digital signal processing algorithms that were tested with theDC440 fast digitizer are described. These signal processing algorithms can be di-vided in timing algorithms that will give the starting time of the pulses and theamplitude algorithms that return the pulse amplitude, which is proportional withthe deposited energy in the detector. In addition to these, some auxiliary algorithmswill be introduced at the beginning of this section. These algorithms were used forthe investigation of the noise and for pulse detection in a signal. A Timing FilterAmplifier (TFA) algorithm was used prior to the application of any timing algo-rithm to obtain an adequate pulse shape. Three timing algorithms will be discussedhere, all three having well known analogs in conventional electronics ( [82, 84, 89].For the amplitude, only the trapezoid algorithm, that is specific to the digital signalprocessing, will be presented. Their recursive formulae and their parameters will begiven.
4.3.1 Auxiliary algorithms
Signal noise analysis
The signal noise means the white noise in which every frequency component has thesame amplitude. This noise has two sources. First, there is the noise introducedby the fast digitizer itself and this is clearly visible when nothing is connected tothe input. Secondly there is the noise of the detector. When the output of thedetector preamplifier is connected to the digitizer, the resulting noise band affectsthe amplitude resolution of the digitizer. This means that from the total numberof bits available (12 in this case) some bits are used only to digitize the noise. Inconsequence every digitizer is characterized by the effective number of bits (ENOB)that is the difference between the total number of bits and the number of bits usedfor the noise digitization.
For the estimation of the noise intensity two conditions were tested. First, signalswere recorded when nothing was coupled to the input (the baseline of the digitizer)and secondly the preamplifier output of the HPGe detector was connected.
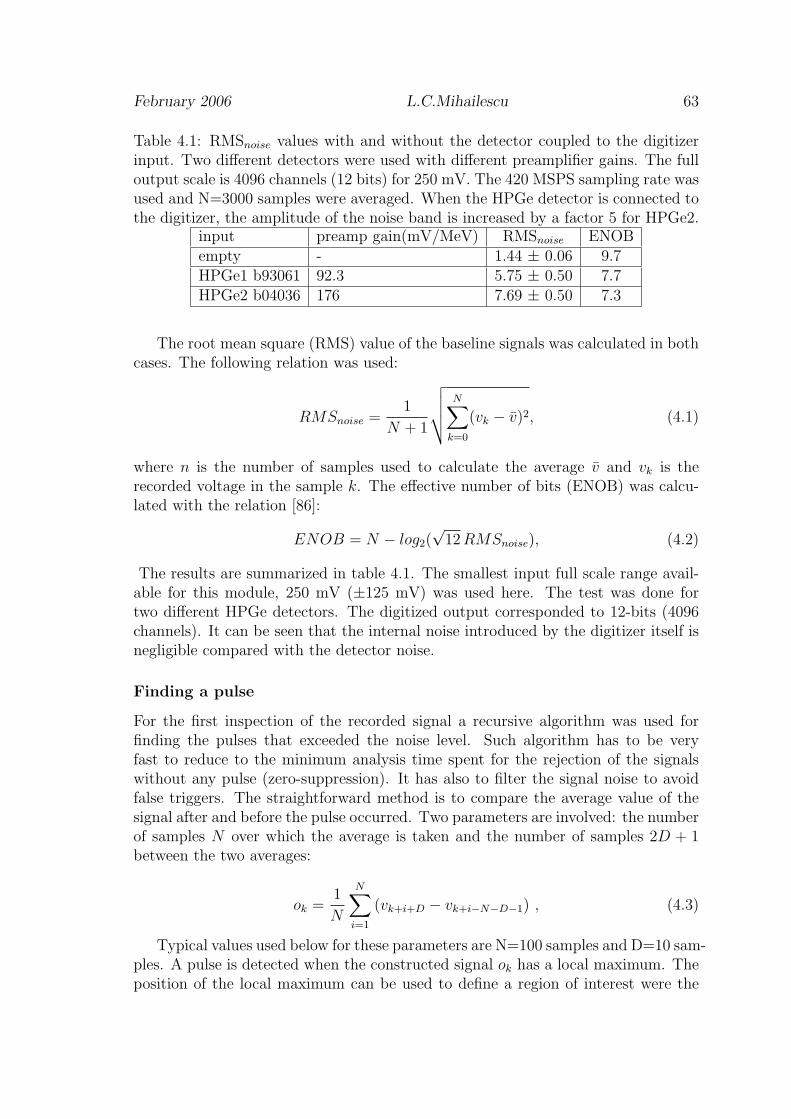
February 2006 L.C.Mihailescu 63
Table 4.1: RMSnoise values with and without the detector coupled to the digitizerinput. Two different detectors were used with different preamplifier gains. The fulloutput scale is 4096 channels (12 bits) for 250 mV. The 420 MSPS sampling rate wasused and N=3000 samples were averaged. When the HPGe detector is connected tothe digitizer, the amplitude of the noise band is increased by a factor 5 for HPGe2.
input preamp gain(mV/MeV) RMSnoise ENOBempty - 1.44 ± 0.06 9.7HPGe1 b93061 92.3 5.75 ± 0.50 7.7HPGe2 b04036 176 7.69 ± 0.50 7.3
The root mean square (RMS) value of the baseline signals was calculated in bothcases. The following relation was used:
RMSnoise =1
N + 1
√√√√N∑
k=0
(vk − v)2, (4.1)
where n is the number of samples used to calculate the average v and vk is therecorded voltage in the sample k. The effective number of bits (ENOB) was calcu-lated with the relation [86]:
ENOB = N − log2(√
12 RMSnoise), (4.2)
The results are summarized in table 4.1. The smallest input full scale range avail-able for this module, 250 mV (±125 mV) was used here. The test was done fortwo different HPGe detectors. The digitized output corresponded to 12-bits (4096channels). It can be seen that the internal noise introduced by the digitizer itself isnegligible compared with the detector noise.
Finding a pulse
For the first inspection of the recorded signal a recursive algorithm was used forfinding the pulses that exceeded the noise level. Such algorithm has to be veryfast to reduce to the minimum analysis time spent for the rejection of the signalswithout any pulse (zero-suppression). It has also to filter the signal noise to avoidfalse triggers. The straightforward method is to compare the average value of thesignal after and before the pulse occurred. Two parameters are involved: the numberof samples N over which the average is taken and the number of samples 2D + 1between the two averages:
ok =1
N
N∑i=1
(vk+i+D − vk+i−N−D−1) , (4.3)
Typical values used below for these parameters are N=100 samples and D=10 sam-ples. A pulse is detected when the constructed signal ok has a local maximum. Theposition of the local maximum can be used to define a region of interest were the
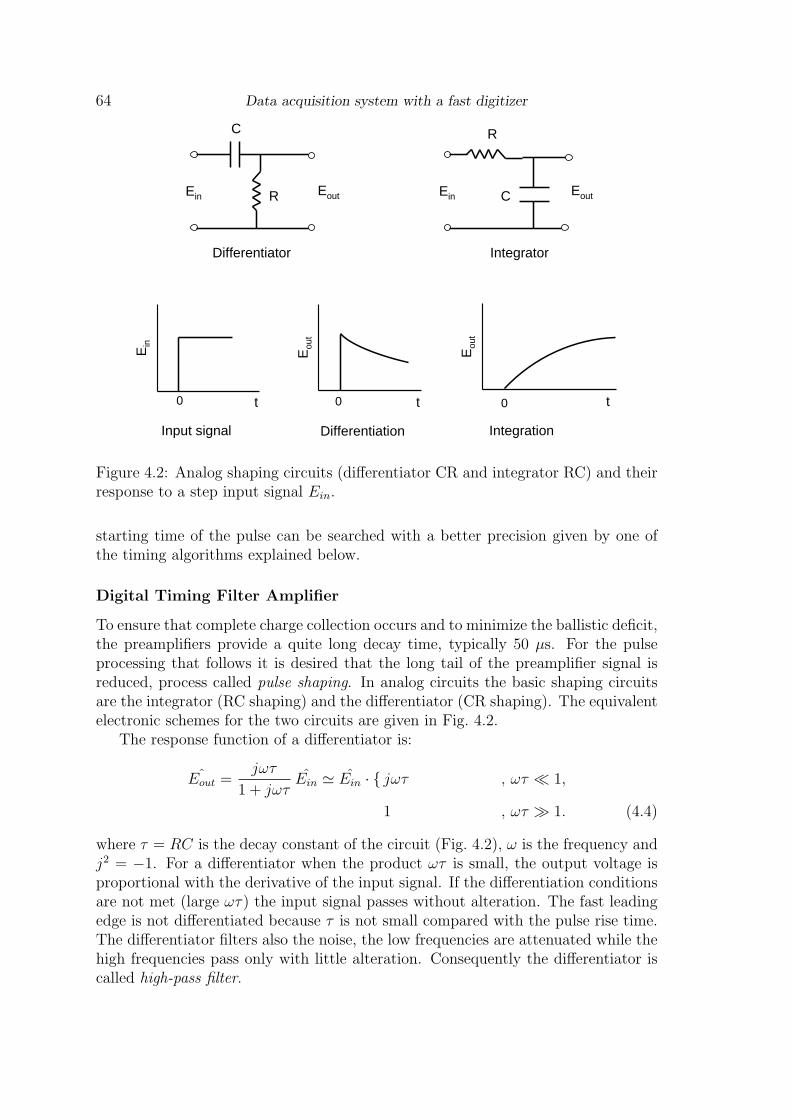
64 Data acquisition system with a fast digitizer
EoutEin
Differentiator
C
R EoutEin
Integrator
R
C
0 t
Ein
Input signal
0 t
Eou
t
Differentiation
Eou
t
0 t
Integration
Figure 4.2: Analog shaping circuits (differentiator CR and integrator RC) and theirresponse to a step input signal Ein.
starting time of the pulse can be searched with a better precision given by one ofthe timing algorithms explained below.
Digital Timing Filter Amplifier
To ensure that complete charge collection occurs and to minimize the ballistic deficit,the preamplifiers provide a quite long decay time, typically 50 µs. For the pulseprocessing that follows it is desired that the long tail of the preamplifier signal isreduced, process called pulse shaping. In analog circuits the basic shaping circuitsare the integrator (RC shaping) and the differentiator (CR shaping). The equivalentelectronic schemes for the two circuits are given in Fig. 4.2.
The response function of a differentiator is:
ˆEout =jωτ
1 + jωτEin ' Ein · jωτ , ωτ ¿ 1,
1 , ωτ À 1. (4.4)
where τ = RC is the decay constant of the circuit (Fig. 4.2), ω is the frequency andj2 = −1. For a differentiator when the product ωτ is small, the output voltage isproportional with the derivative of the input signal. If the differentiation conditionsare not met (large ωτ) the input signal passes without alteration. The fast leadingedge is not differentiated because τ is not small compared with the pulse rise time.The differentiator filters also the noise, the low frequencies are attenuated while thehigh frequencies pass only with little alteration. Consequently the differentiator iscalled high-pass filter.
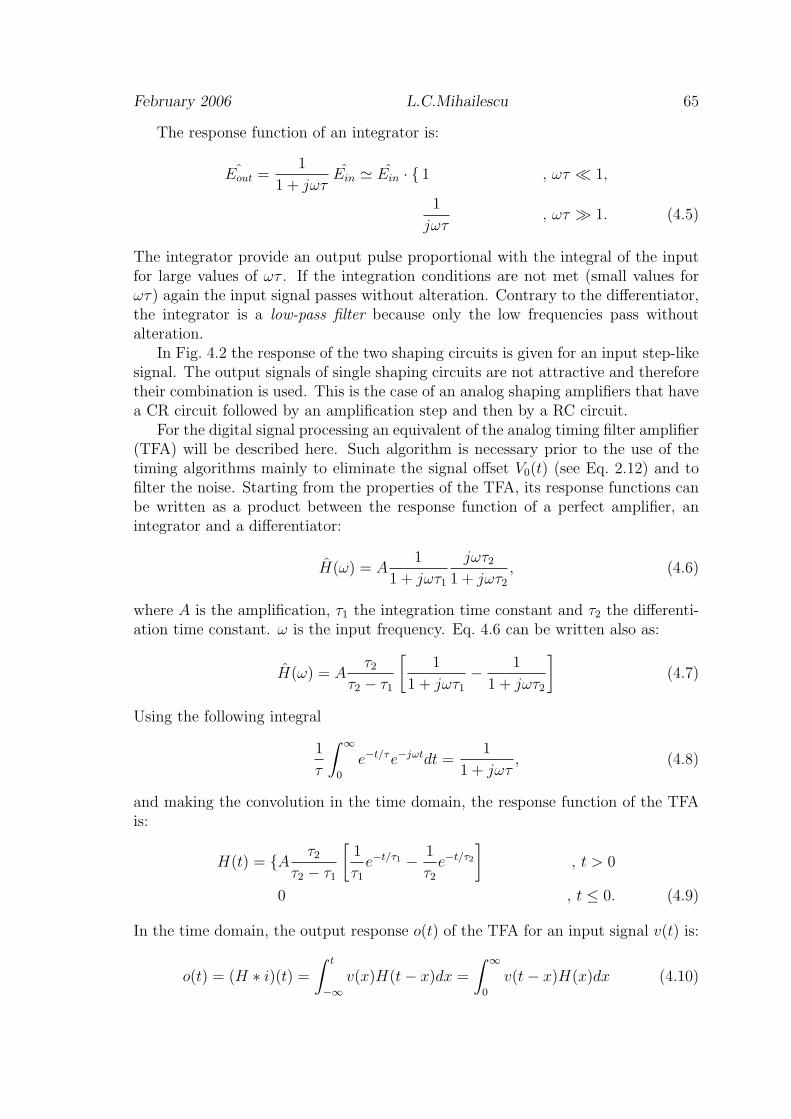
February 2006 L.C.Mihailescu 65
The response function of an integrator is:
ˆEout =1
1 + jωτEin ' Ein · 1 , ωτ ¿ 1,
1
jωτ, ωτ À 1. (4.5)
The integrator provide an output pulse proportional with the integral of the inputfor large values of ωτ . If the integration conditions are not met (small values forωτ) again the input signal passes without alteration. Contrary to the differentiator,the integrator is a low-pass filter because only the low frequencies pass withoutalteration.
In Fig. 4.2 the response of the two shaping circuits is given for an input step-likesignal. The output signals of single shaping circuits are not attractive and thereforetheir combination is used. This is the case of an analog shaping amplifiers that havea CR circuit followed by an amplification step and then by a RC circuit.
For the digital signal processing an equivalent of the analog timing filter amplifier(TFA) will be described here. Such algorithm is necessary prior to the use of thetiming algorithms mainly to eliminate the signal offset V0(t) (see Eq. 2.12) and tofilter the noise. Starting from the properties of the TFA, its response functions canbe written as a product between the response function of a perfect amplifier, anintegrator and a differentiator:
H(ω) = A1
1 + jωτ1
jωτ2
1 + jωτ2
, (4.6)
where A is the amplification, τ1 the integration time constant and τ2 the differenti-ation time constant. ω is the input frequency. Eq. 4.6 can be written also as:
H(ω) = Aτ2
τ2 − τ1
[1
1 + jωτ1
− 1
1 + jωτ2
](4.7)
Using the following integral
1
τ
∫ ∞
0
e−t/τe−jωtdt =1
1 + jωτ, (4.8)
and making the convolution in the time domain, the response function of the TFAis:
H(t) = A τ2
τ2 − τ1
[1
τ1
e−t/τ1 − 1
τ2
e−t/τ2
], t > 0
0 , t ≤ 0. (4.9)
In the time domain, the output response o(t) of the TFA for an input signal v(t) is:
o(t) = (H ∗ i)(t) =
∫ t
−∞v(x)H(t− x)dx =
∫ ∞
0
v(t− x)H(x)dx (4.10)
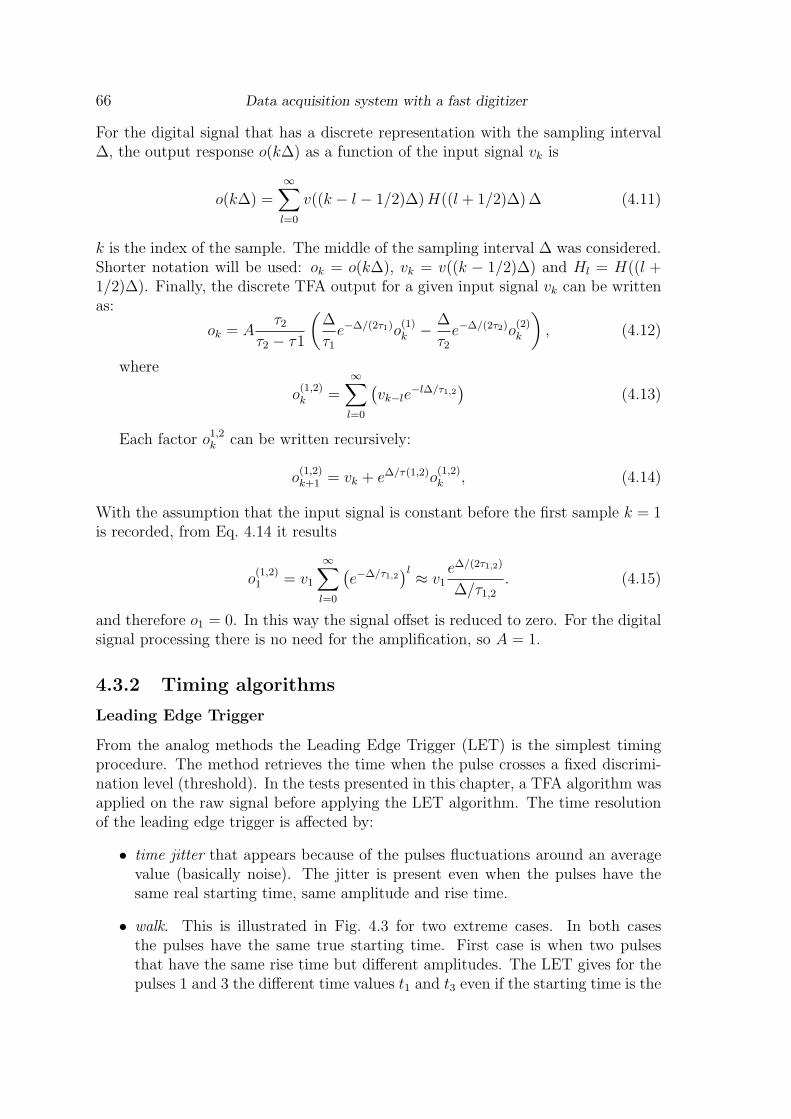
66 Data acquisition system with a fast digitizer
For the digital signal that has a discrete representation with the sampling interval∆, the output response o(k∆) as a function of the input signal vk is
o(k∆) =∞∑
l=0
v((k − l − 1/2)∆) H((l + 1/2)∆) ∆ (4.11)
k is the index of the sample. The middle of the sampling interval ∆ was considered.Shorter notation will be used: ok = o(k∆), vk = v((k − 1/2)∆) and Hl = H((l +1/2)∆). Finally, the discrete TFA output for a given input signal vk can be writtenas:
ok = Aτ2
τ2 − τ1
(∆
τ1
e−∆/(2τ1)o(1)k − ∆
τ2
e−∆/(2τ2)o(2)k
), (4.12)
where
o(1,2)k =
∞∑
l=0
(vk−le
−l∆/τ1,2)
(4.13)
Each factor o1,2k can be written recursively:
o(1,2)k+1 = vk + e∆/τ(1,2)o
(1,2)k , (4.14)
With the assumption that the input signal is constant before the first sample k = 1is recorded, from Eq. 4.14 it results
o(1,2)1 = v1
∞∑
l=0
(e−∆/τ1,2
)l ≈ v1e∆/(2τ1,2)
∆/τ1,2
. (4.15)
and therefore o1 = 0. In this way the signal offset is reduced to zero. For the digitalsignal processing there is no need for the amplification, so A = 1.
4.3.2 Timing algorithms
Leading Edge Trigger
From the analog methods the Leading Edge Trigger (LET) is the simplest timingprocedure. The method retrieves the time when the pulse crosses a fixed discrimi-nation level (threshold). In the tests presented in this chapter, a TFA algorithm wasapplied on the raw signal before applying the LET algorithm. The time resolutionof the leading edge trigger is affected by:
• time jitter that appears because of the pulses fluctuations around an averagevalue (basically noise). The jitter is present even when the pulses have thesame real starting time, same amplitude and rise time.
• walk. This is illustrated in Fig. 4.3 for two extreme cases. In both casesthe pulses have the same true starting time. First case is when two pulsesthat have the same rise time but different amplitudes. The LET gives for thepulses 1 and 3 the different time values t1 and t3 even if the starting time is the

February 2006 L.C.Mihailescu 67
time timet1 t2 t3
Am
plit
ud
e
Am
plit
ud
e
t1 t2tt
1
2
3 l1
l2
l2=m l1
a) LET b) ELET
rise time walk
Figure 4.3: Schematic representation of two time pick-off methods: Leading EdgeTrigger (LET) and Extrapolated Leading Edge Trigger (ELET). Generic pulses withlinear rising edge were used. The rise time walk is illustrated for the leading edgetrigger. The ELET method is almost walk-free. Both methods are affected by thepulse jitter.
same. The second extreme case is when the pulses have the same amplitudeand different rise time (e.g. pulses 1 and 2). The LET gives the again differentvalues for the time, t1 and t2.
The leading edge trigger is working relatively well with pulses that have smalldynamic range (constant rise time and almost the same amplitude). This is not thecase of the large volume HPGe detectors where the pulse shape has large variations.To minimize the effect of the walk, the discrimination level (threshold) of the leadingedge trigger has to be very low.
For a discrete signal the crossing time (t) of the leading edge threshold can befound even within one sampling interval. The equation used for the interpolation is:
t = k +l − vk
vk+1 − vk
, (4.16)
where the vk is the signal amplitude and l is the value of the threshold. k is thesample index for which vk ≤ l < vk+1 .
Extrapolated Leading Edge Trigger
A procedure that is rather insensitive to the walk effect is the Extrapolated LeadingEdge Trigger (ELET). This method is based on the approximation that the pulseshave a linear shape in the first part of the rising edge. As long as this approximationis valid, the walk effect is negligible. In the tests presented in this chapter, a TFAalgorithm was applied on the raw signal before applying the LET algorithm.
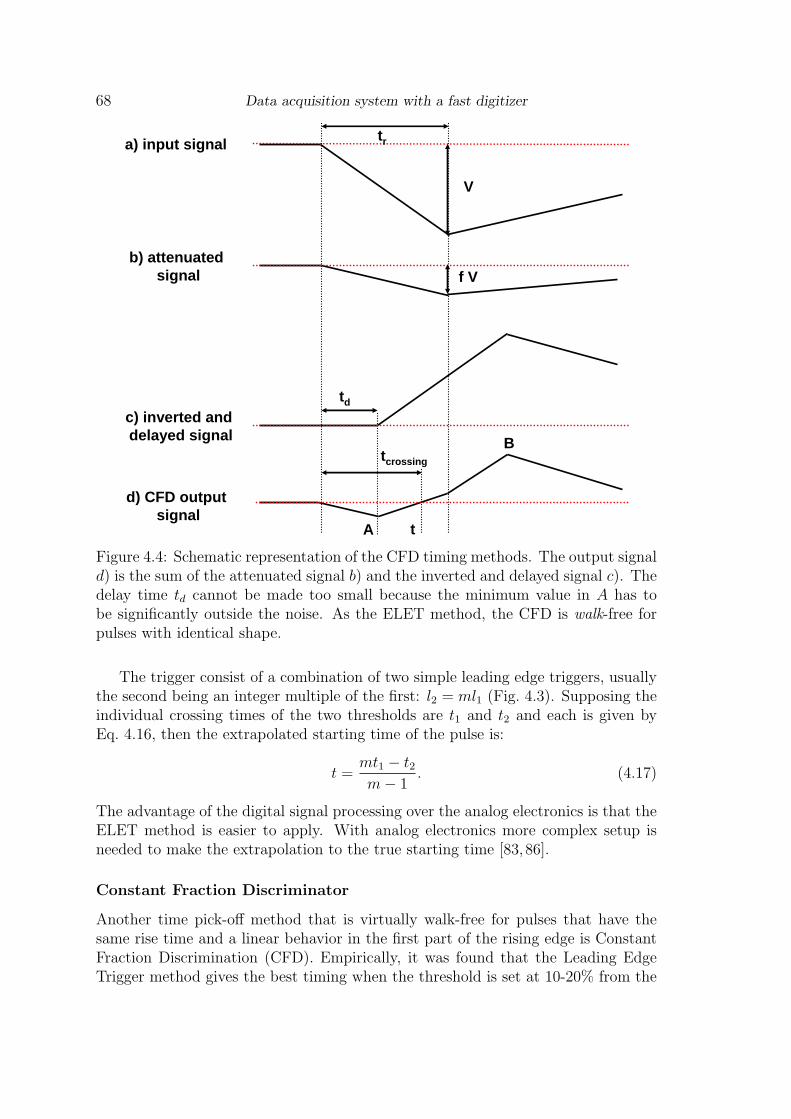
68 Data acquisition system with a fast digitizer
a) input signal
b) attenuated signal
c) inverted and delayed signal
d) CFD output signal
tr
td
V
f V
tcrossing
A t
B
Figure 4.4: Schematic representation of the CFD timing methods. The output signald) is the sum of the attenuated signal b) and the inverted and delayed signal c). Thedelay time td cannot be made too small because the minimum value in A has tobe significantly outside the noise. As the ELET method, the CFD is walk-free forpulses with identical shape.
The trigger consist of a combination of two simple leading edge triggers, usuallythe second being an integer multiple of the first: l2 = ml1 (Fig. 4.3). Supposing theindividual crossing times of the two thresholds are t1 and t2 and each is given byEq. 4.16, then the extrapolated starting time of the pulse is:
t =mt1 − t2m− 1
. (4.17)
The advantage of the digital signal processing over the analog electronics is that theELET method is easier to apply. With analog electronics more complex setup isneeded to make the extrapolation to the true starting time [83,86].
Constant Fraction Discriminator
Another time pick-off method that is virtually walk-free for pulses that have thesame rise time and a linear behavior in the first part of the rising edge is ConstantFraction Discrimination (CFD). Empirically, it was found that the Leading EdgeTrigger method gives the best timing when the threshold is set at 10-20% from the

February 2006 L.C.Mihailescu 69
pulse amplitude. This observation led to the development of the CFD. The constantfraction discriminator gives the time when the pulse reaches a certain fraction f fromthe amplitude. The steps involved in the construction of a CFD signal are shown inFig. 4.4.
The same input signal, a, is processed in two different ways. In the first case theinitial signal is attenuated. In the second case the signal a is inverted and delayedwith the delay td. The CFD output signal, d, is the sum of the signals b and c.The time is given by the crossing of the zero level and is independent on the pulseamplitude as long the pulses have the same shape.
A particular case of the general CFD method is the so called Amplitude and RiseTime Compensation (ARC) timing [86]. The ARC method uses by definition veryshort delays td such that the timing is given in the region where the rising edge ofthe pulse is still linear and the changes in the shape at longer time are avoided. Thedelay has to be long enough so that the initial part of the output signal is allowedto significantly exceed the noise level.
In the digital algorithm implemented in this work no difference will be madebetween the CFD and ARC methods. In the tests presented in this chapter, a TFAalgorithm was applied on the raw signal before applying the CFD algorithm. For adiscrete signal the recurrence to construct the output signal of the CFD is:
ok = fvk−d − vk, where k ≥ d. (4.18)
d is the delay in sampling intervals and f is the attenuation constant. vk is thediscrete signal produced with the TFA algorithm.
The advantage of a digital processing is that the zero crossing of the CFD output(see Fig. 4.4) can be searched backward, starting from the extreme point B, that iseasily identified.
4.3.3 Pulse amplitude algorithm - trapezoid filter
Besides the starting time of the pulse, another pulse characteristic that has to bedetermined in common nuclear measurements is the amplitude. In conventionalelectronics the key element for pulse amplitude determination is the spectroscopicamplifier. This provides simultaneously the proper pulse amplification to matchthe requirements of the ADC that follows and the pulse shaping, reducing the longtail from the preamplifier. The most common shaping for the pulse amplitude is theGaussian (CR-(RC)n) shaping. Compared with the CR-RC shaping from a TFA, theGaussian shaping provides a better signal-to-noise ratio. In the literature differentother shaping procedures that give better amplitude resolution than the Gaussianshaping are mentioned: cusp-like, triangular and trapezoidal shaping (Fig. 4.5).These alternative shaping methods are more difficult to be implemented in theconventional electronics compared with the Gaussian shaping. Their advantagescan be easily used in digital signal processing where the shaping parameters are theparameters of the analyzing software.
In choosing the most appropriate shaping method, a compromise between threegeneral concepts has to be found: signal-to-noise ratio, pile-up of the pulses and

70 Data acquisition system with a fast digitizer
cusp-like shaping
triangular shaping
trapezoidal shaping
Figure 4.5: Tree pulse shaping procedures that give a better amplitude resolutioncompared with the Gaussian shaping: cusp-like, triangular and trapezoidal shaping.
ballistic deficit. The best signal-to-noise ratio is given by the cusp-like shapingfollowed by the triangular shaping. To overcome the ballistic deficit a shaping withthe flat-top comparable with the maximum rise time is needed. The trapezoidalshaping meets simultaneously good signal-to-noise ratio and good compensation forthe ballistic deficit [88].
The basic function of the trapezoid algorithm is to convert the exponentiallydecaying signal from the preamplifier into a trapezoidal signal. This implies theconvolution of the preamplifier signal (input signal v for the digitizer) with differenttime dependent functions. Several proposals for such methods can be found in theliterature ( [85,87]), but the differences between them is only the order in which theconvolutions are done. The algorithm described here was optimized also for a highspeed calculation.
In the algorithm used here, two steps can be distinguishes in the constructionof the trapezoidal output signal. First the preamplifier signal is corrected for thefinite decay time τ and converted into a step function. The trapezoid shape isthen obtained applying the pulse finding algorithm described in Sec. 4.3.1. Thedemonstration of the recursive formulae used in the present work is given in thefollowing. The starting point for this algorithm is the preamplifier output of a Gedetector given by the Eq. 2.12. In the discrete time scale the same equation can bewritten as:
vk = v0 − 1
ce
e−k∆τ
k∑j=−∞
i
([j − 1
2
]∆
)e−
(j+12 )∆
τ , (4.19)
where vk is the discrete representation of the preamplifier output voltage (digitizerinput signal) for the sample k. ∆ is the sampling interval and i is the current. Forsimplicity, ik = i((k − 1
2)∆). For two successive samples the following relation is
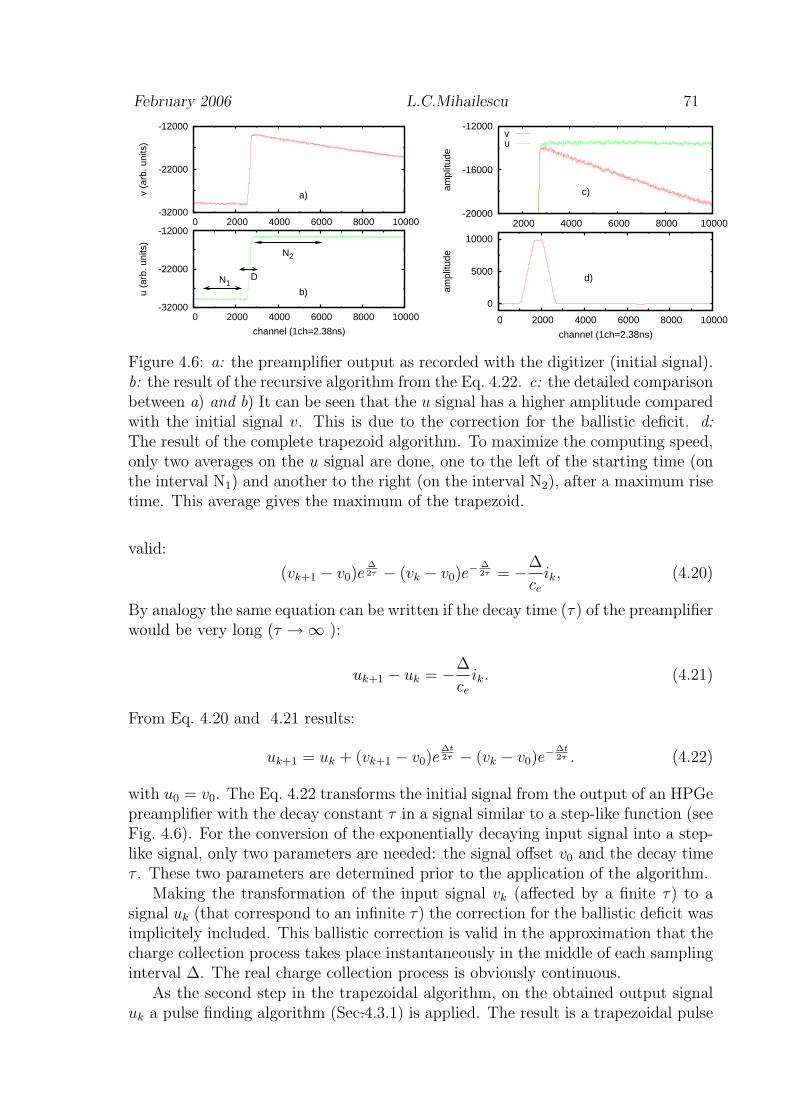
February 2006 L.C.Mihailescu 71
-32000
-22000
-12000
0 2000 4000 6000 8000 10000
u (a
rb. u
nits
)
channel (1ch=2.38ns)
b)N1
N2
D
-32000
-22000
-12000
0 2000 4000 6000 8000 10000
v (a
rb. u
nits
)
a)
0
5000
10000
0 2000 4000 6000 8000 10000
ampl
itude
channel (1ch=2.38ns)
d)
-20000
-16000
-12000
2000 4000 6000 8000 10000
ampl
itude
c)
vu
Figure 4.6: a: the preamplifier output as recorded with the digitizer (initial signal).b: the result of the recursive algorithm from the Eq. 4.22. c: the detailed comparisonbetween a) and b) It can be seen that the u signal has a higher amplitude comparedwith the initial signal v. This is due to the correction for the ballistic deficit. d:The result of the complete trapezoid algorithm. To maximize the computing speed,only two averages on the u signal are done, one to the left of the starting time (onthe interval N1) and another to the right (on the interval N2), after a maximum risetime. This average gives the maximum of the trapezoid.
valid:
(vk+1 − v0)e∆2τ − (vk − v0)e
− ∆2τ = −∆
ce
ik, (4.20)
By analogy the same equation can be written if the decay time (τ) of the preamplifierwould be very long (τ →∞ ):
uk+1 − uk = −∆
ce
ik. (4.21)
From Eq. 4.20 and 4.21 results:
uk+1 = uk + (vk+1 − v0)e∆t2τ − (vk − v0)e
−∆t2τ . (4.22)
with u0 = v0. The Eq. 4.22 transforms the initial signal from the output of an HPGepreamplifier with the decay constant τ in a signal similar to a step-like function (seeFig. 4.6). For the conversion of the exponentially decaying input signal into a step-like signal, only two parameters are needed: the signal offset v0 and the decay timeτ . These two parameters are determined prior to the application of the algorithm.
Making the transformation of the input signal vk (affected by a finite τ) to asignal uk (that correspond to an infinite τ) the correction for the ballistic deficit wasimplicitely included. This ballistic correction is valid in the approximation that thecharge collection process takes place instantaneously in the middle of each samplinginterval ∆. The real charge collection process is obviously continuous.
As the second step in the trapezoidal algorithm, on the obtained output signaluk a pulse finding algorithm (Sec.4.3.1) is applied. The result is a trapezoidal pulse
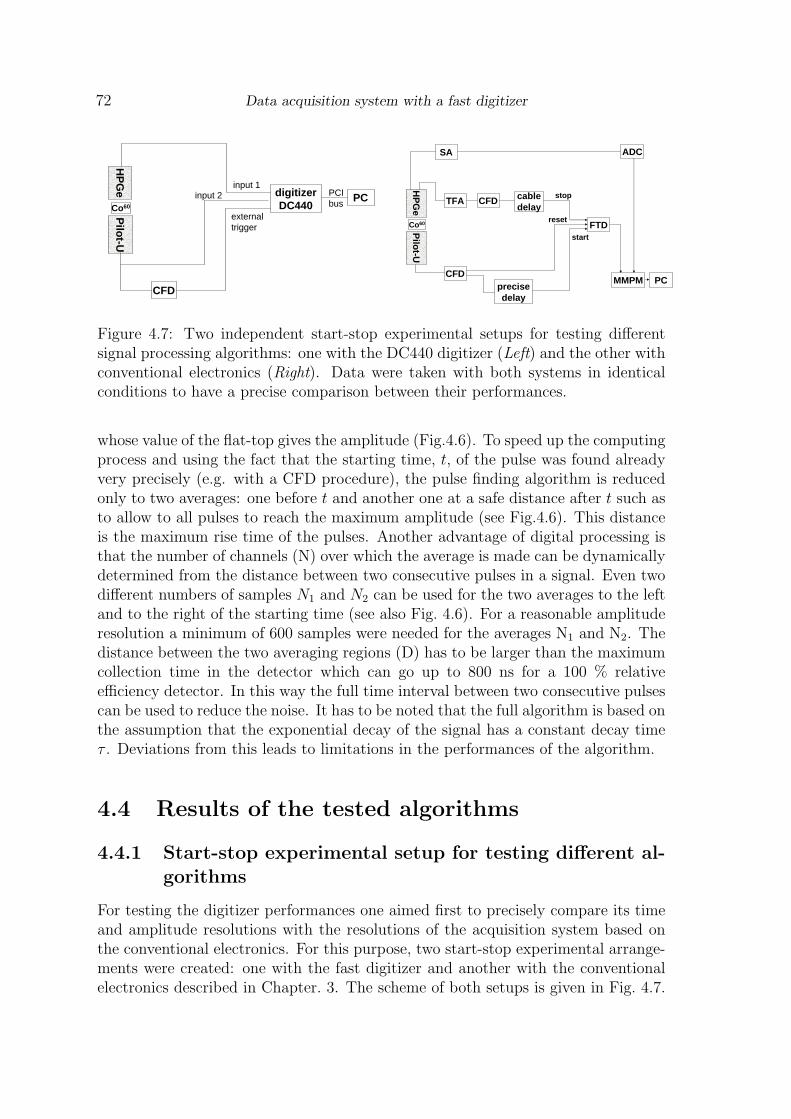
72 Data acquisition system with a fast digitizer
HP
Ge
CFD
Pilo
t-U
PCCo60
digitizerDC440
externaltrigger
input 1input 2 PCI
bus CFD
HP
Ge
CFD
TFA
Pilo
t-U
FTD
ADC
PCMMPM
Co60
cabledelay
SA
precisedelay
stop
reset
start
Figure 4.7: Two independent start-stop experimental setups for testing differentsignal processing algorithms: one with the DC440 digitizer (Left) and the other withconventional electronics (Right). Data were taken with both systems in identicalconditions to have a precise comparison between their performances.
whose value of the flat-top gives the amplitude (Fig.4.6). To speed up the computingprocess and using the fact that the starting time, t, of the pulse was found alreadyvery precisely (e.g. with a CFD procedure), the pulse finding algorithm is reducedonly to two averages: one before t and another one at a safe distance after t such asto allow to all pulses to reach the maximum amplitude (see Fig.4.6). This distanceis the maximum rise time of the pulses. Another advantage of digital processing isthat the number of channels (N) over which the average is made can be dynamicallydetermined from the distance between two consecutive pulses in a signal. Even twodifferent numbers of samples N1 and N2 can be used for the two averages to the leftand to the right of the starting time (see also Fig. 4.6). For a reasonable amplituderesolution a minimum of 600 samples were needed for the averages N1 and N2. Thedistance between the two averaging regions (D) has to be larger than the maximumcollection time in the detector which can go up to 800 ns for a 100 % relativeefficiency detector. In this way the full time interval between two consecutive pulsescan be used to reduce the noise. It has to be noted that the full algorithm is based onthe assumption that the exponential decay of the signal has a constant decay timeτ . Deviations from this leads to limitations in the performances of the algorithm.
4.4 Results of the tested algorithms
4.4.1 Start-stop experimental setup for testing different al-gorithms
For testing the digitizer performances one aimed first to precisely compare its timeand amplitude resolutions with the resolutions of the acquisition system based onthe conventional electronics. For this purpose, two start-stop experimental arrange-ments were created: one with the fast digitizer and another with the conventionalelectronics described in Chapter. 3. The scheme of both setups is given in Fig. 4.7.
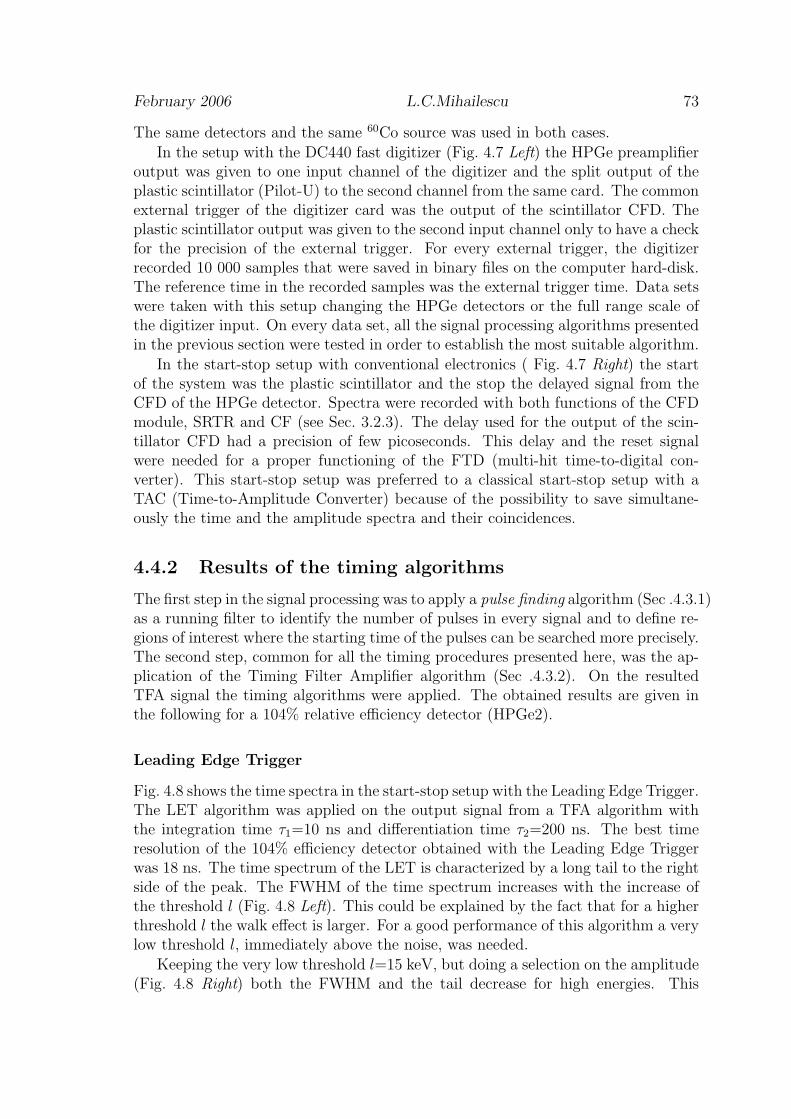
February 2006 L.C.Mihailescu 73
The same detectors and the same 60Co source was used in both cases.In the setup with the DC440 fast digitizer (Fig. 4.7 Left) the HPGe preamplifier
output was given to one input channel of the digitizer and the split output of theplastic scintillator (Pilot-U) to the second channel from the same card. The commonexternal trigger of the digitizer card was the output of the scintillator CFD. Theplastic scintillator output was given to the second input channel only to have a checkfor the precision of the external trigger. For every external trigger, the digitizerrecorded 10 000 samples that were saved in binary files on the computer hard-disk.The reference time in the recorded samples was the external trigger time. Data setswere taken with this setup changing the HPGe detectors or the full range scale ofthe digitizer input. On every data set, all the signal processing algorithms presentedin the previous section were tested in order to establish the most suitable algorithm.
In the start-stop setup with conventional electronics ( Fig. 4.7 Right) the startof the system was the plastic scintillator and the stop the delayed signal from theCFD of the HPGe detector. Spectra were recorded with both functions of the CFDmodule, SRTR and CF (see Sec. 3.2.3). The delay used for the output of the scin-tillator CFD had a precision of few picoseconds. This delay and the reset signalwere needed for a proper functioning of the FTD (multi-hit time-to-digital con-verter). This start-stop setup was preferred to a classical start-stop setup with aTAC (Time-to-Amplitude Converter) because of the possibility to save simultane-ously the time and the amplitude spectra and their coincidences.
4.4.2 Results of the timing algorithms
The first step in the signal processing was to apply a pulse finding algorithm (Sec .4.3.1)as a running filter to identify the number of pulses in every signal and to define re-gions of interest where the starting time of the pulses can be searched more precisely.The second step, common for all the timing procedures presented here, was the ap-plication of the Timing Filter Amplifier algorithm (Sec .4.3.2). On the resultedTFA signal the timing algorithms were applied. The obtained results are given inthe following for a 104% relative efficiency detector (HPGe2).
Leading Edge Trigger
Fig. 4.8 shows the time spectra in the start-stop setup with the Leading Edge Trigger.The LET algorithm was applied on the output signal from a TFA algorithm withthe integration time τ1=10 ns and differentiation time τ2=200 ns. The best timeresolution of the 104% efficiency detector obtained with the Leading Edge Triggerwas 18 ns. The time spectrum of the LET is characterized by a long tail to the rightside of the peak. The FWHM of the time spectrum increases with the increase ofthe threshold l (Fig. 4.8 Left). This could be explained by the fact that for a higherthreshold l the walk effect is larger. For a good performance of this algorithm a verylow threshold l, immediately above the noise, was needed.
Keeping the very low threshold l=15 keV, but doing a selection on the amplitude(Fig. 4.8 Right) both the FWHM and the tail decrease for high energies. This

74 Data acquisition system with a fast digitizer
0
200
400
600
0 100 200 300 400 500
Cou
nts
Time (ns)
l=15 keVl=30 keVl=90 keV
l=180 keV
0
200
400
600
0 100 200 300 400
Cou
nts
Time (ns)
Eγ > 50 keVEγ > 150 keVEγ > 300 keVEγ > 500 keVEγ > 1 MeV
Figure 4.8: Results of LET algorithm. For the time spectra shown here the FWHMvaried between 18 ns and 24 ns. Left: The threshold l was varied from immediatelyabove the noise (l=15 keV) up to 90 keV. Right: The threshold l=15 keV was fixedand the pulse amplitude Eγ were selected. For higher pulse amplitude the peak taildecreases.
suggests that the high energy pulses have smaller variations in the rising edge.
Extrapolated Leading Edge Trigger
The Extrapolated Leading Edge Trigger (ELET) algorithm gives very good resultsas long the rising edge of the pulse is linear. The ELET algorithm was applied onthe output signal from a TFA algorithm with the integration time τ1=10 ns anddifferentiation time τ2=200 ns. Two input parameters were varied for the ELETalgorithm: the threshold l and the factor m that defines the second threshold. Asit was expected from the tests with the LET, a very low threshold l produced thebest results. For a fixed l=15 keV, the FWHM of the time spectrum decreases whenthe m is increased (Fig. 4.9 Left). This suggests that a larger difference betweenthe two thresholds is needed to minimize the noise fluctuations of the signal (thetime jitter). If the factor m is further increased, the tail on the left side of the peakincreases because changes in the pulse shape appears. Fig. 4.9 Right shows that forthe same l=15 keV and m=2, when the pulse amplitudes were selected the timeresolution improved (smaller FWHM and smaller tails) for the high energy pulses.It results that the approximation of the rising edge linearity is more appropriate forhigh energy pulses.
Constant Fraction Trigger
When the CFD algorithm was applied two parameters were considered: the fractionf and the delay td. In addition, the parameters of the TFA algorithm (the integrationtime τ1, the differentiation time τ2) were varied. The dependence on the TFAamplifier parameters is given in Fig. 4.10. The CFD parameters were kept constant:delay=31 ns and f=0.25. The time resolution deteriorates when the integrationtime τ1 is increased (Fig. 4.10 Left). For large values of the integration time the

February 2006 L.C.Mihailescu 75
0
200
400
600
800
1000
1200
0 10 20 30 40 50 60
Cou
nts
Time (ns)
l=15 keV; m=2l=15 keV; m=3l=15 keV; m=4
0
200
400
600
800
1000
0 20 40 60 80 100
Cou
nts
Time (ns)
Eγ > 50 keVEγ >150 keVEγ >300 keVEγ >500 keVEγ >1 MeV
Figure 4.9: Results of using the ELET with a 104% relative efficiency detector.The FWHM of the ELET spectra was between 10 ns and 13 ns depending by thechosen parameters. Left: The threshold l was constant (as low as possible) andthe factor m was varied. Further increase of m do not change significantly thetime resolution spectrum. Right: The pulse amplitudes were selected for constantthreshold l=15 keV and m=2.
5.5
6
6.5
7
0 10 20 30 40 50 60
FW
HM
(ns
)
τ1 (ns)
τ2 = 100 nsτ2 = 200 ns τ2 = 500 ns
5.5
6
6.5
7
0 100 200 300 400 500
FW
HM
(ns
)
τ2 (ns)
τ1 = 10 ns
Figure 4.10: The dependence of the resolution of the CFD algorithm on TFAparameters differentiation and integration time. The CFD parameters were fixed:delay=31 ns and f=0.25. Left: The FWHM of the time spectrum increases whenthe TFA integration time is increased. Right: The time resolution remains almostconstant for the variation of the differentiation time between 10 ns and 500 ns.
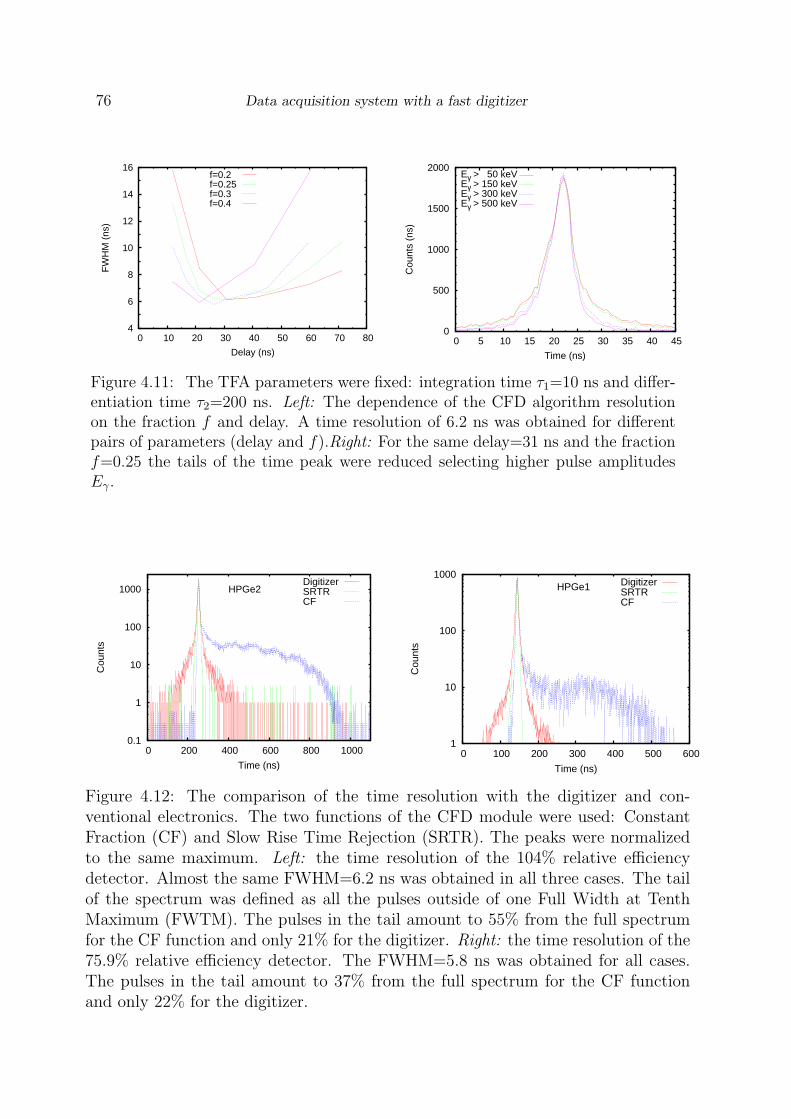
76 Data acquisition system with a fast digitizer
4
6
8
10
12
14
16
0 10 20 30 40 50 60 70 80
FW
HM
(ns
)
Delay (ns)
f=0.2 f=0.25 f=0.3 f=0.4
0
500
1000
1500
2000
0 5 10 15 20 25 30 35 40 45
Cou
nts
(ns)
Time (ns)
Eγ > 50 keVEγ > 150 keVEγ > 300 keVEγ > 500 keV
Figure 4.11: The TFA parameters were fixed: integration time τ1=10 ns and differ-entiation time τ2=200 ns. Left: The dependence of the CFD algorithm resolutionon the fraction f and delay. A time resolution of 6.2 ns was obtained for differentpairs of parameters (delay and f).Right: For the same delay=31 ns and the fractionf=0.25 the tails of the time peak were reduced selecting higher pulse amplitudesEγ.
0.1
1
10
100
1000
0 200 400 600 800 1000
Cou
nts
Time (ns)
HPGe2DigitizerSRTRCF
1
10
100
1000
0 100 200 300 400 500 600
Cou
nts
Time (ns)
HPGe1 DigitizerSRTRCF
Figure 4.12: The comparison of the time resolution with the digitizer and con-ventional electronics. The two functions of the CFD module were used: ConstantFraction (CF) and Slow Rise Time Rejection (SRTR). The peaks were normalizedto the same maximum. Left: the time resolution of the 104% relative efficiencydetector. Almost the same FWHM=6.2 ns was obtained in all three cases. The tailof the spectrum was defined as all the pulses outside of one Full Width at TenthMaximum (FWTM). The pulses in the tail amount to 55% from the full spectrumfor the CF function and only 21% for the digitizer. Right: the time resolution of the75.9% relative efficiency detector. The FWHM=5.8 ns was obtained for all cases.The pulses in the tail amount to 37% from the full spectrum for the CF functionand only 22% for the digitizer.

February 2006 L.C.Mihailescu 77
signal is averaged over a longer time interval reducing the noise but simultaneouslydecreasing the slope of the rising edge of the pulse. Contrary, the time resolution isless dependent on the changes of the differentiation time τ2 (Fig. 4.10 Right).
Fig. 4.11 Left shows the dependence of the time resolution on the fraction f andthe delay used in the CFD algorithm. The parameters of the TFA algorithm werefixed: τ1=10 ns and τ2=200 ns. A time resolution of about 6.2 ns was observed,comparable with the value obtained with the conventional electronics. This resultedfor different pairs of the two parameters, fraction and delay. When a delay of31 ns and a fraction f=0.25 were used with a selection on the pulse amplitude(Fig. 4.11 Right) it was observed that the tail of the time spectrum decreased forhigh energy pulses. As for the case of the conventional electronics (Sec. 3.2.3) thetime resolution is strongly dependent on the pulse amplitude.
Fig. 4.12 gives the comparison between the time resolution obtained with thedigitizer and with the conventional electronics for two different detectors: 104% Leftand 75.9% Right. Energies Eγ ≥ 150 keV were selected in all these cases, bothfor the digitizer and for the conventional module. The fast digitizer gives the sameFWHM as the conventional electronics for both detectors. Moreover the FWTM isalmost the same for all three spectra. The difference is in the peak tail. The CFspectrum has a large tail that extends up to 400 ns for the smaller volume detectorand up to 800 ns for the larger detector. The SRTR spectrum has no tail becauseall events in the tail are simply rejected at the expense of lower detection efficiency.The fast digitizer preserves the detection efficiency of the CF function and the tailis significantly reduced to about 21%.
4.4.3 Results of the amplitude algorithm
Prior to the application of the trapezoid algorithm (Sec. 4.3.3) it is necessary todetermine the decay time, τ , of the preamplifier and the signal offset, v0. The decaytime τ was determined from a least square fit of the decaying part of the pulse.The fit was done once for every detector, for a large number of pulses to assure asmall statistical error. A Gaussian distribution was obtained for the decay time τ .The centroid of the distribution was taken. For the 104% relative efficiency detectorτ=47.8 µs.
The signal offset v0 (Sec. 4.3.3) was determined from the signals that have onlyone pulse and a horizontal behavior before the starting time of the pulse. The offsetwas determined as the signal average over the horizontal region before the pulse.The average was done over a sufficiently high number of samples to reduce the noiseinfluence (3 000 samples in this case). Again a Gaussian distribution for the offsetvalues was obtained when different signals were used for the determination. Thedistribution centroid was taken. During long acquisition periods small changes ofthe offset v0 were observed for some detectors and periodical checks were needed.
Once the signal offset and the decay time τ were determined, the only parameterthat can be varied in trapezoid algorithm (Sec. 4.3.3) is the number of samplesN used for the average over the uk signal. The dependence on the N = N1 =N2 of the energy resolution (FWHM) at the second line of the 60Co spectrum is

78 Data acquisition system with a fast digitizer
2
2.2
2.4
2.6
2.8
3
3.2
3.4
0 1 2 3 4 5
FW
HM
(ke
V)
N (µs)
0
100
200
300
400
1326 1328 1330 1332 1334 1336
Cou
nts
Eγ (keV)
digitizer - trapezoidconventional system
Figure 4.13: Left: The dependence of the energy resolution with the trapezoidalgorithm on the number of sample N = N1 = N2 used for the average (Sec. 4.3.3).Right: The comparison of the energy resolution with the digitizer and with theconventional electronics. The 1.33 MeV peak of the 60Co spectrum is shown. TheFWHM=2.1 keV for both cases. For an easier comparison the two spectra werenormalized to the same peak maximum and were calibrated in energy. This spectrumwas obtained with N = N1 = N2 = 3.3µs and D = 1.4 µs.
0
100
200
0 200 400 600 800 1000 1200 1400
Cou
nts
digitizer - trapezoid
0
1000
2000
0 200 400 600 800 1000 1200 1400
Cou
nts
Eγ (keV)
conventional system
Figure 4.14: Comparison of the 60Co amplitude spectra with the digitizer and withthe conventional electronics. The Counts scale was expanded at low values for abetter identification of the peaks in both spectra. Different acquisition times anddifferent triggers for the acquisition systems were used for the two spectra.
February 2006 L.C.Mihailescu 79
Table 4.2: HPGe detector amplitude resolution for different full scale range of thedigitizer.
full scale range (mV) full scale range (keV) FWHM (keV) at 1.33MeV250 1513.7 2.13500 3030.5 2.281000 6066.4 2.33
given in Fig.4.13 Left. The energy resolution improves when a larger number ofsamples (larger time interval) is used for the average and saturates around 3 µs(1200 samples). A minimum of about 1 µs is needed to still have a reasonable energyresolution, with a FWHM lower than 2.5 keV. The small oscillations in Fig.4.13 Leftmay come from the presence of a sinusoidal noise with a period of few hundreds ofns. The effect of such a noise disappears when a large number of samples N is usedfor average. A distance (2D +1) = 1.44 µs (600 samples) was used between the twoaverage regions. This distance was chosen to be higher than the maximum rise timeof the pulses. As it can be seen from Fig. 4.12, the maximum rise time of the pulsesin the 104% relative efficiency detector is about 800 ns. From this considerations aminimum of about 2.5µs spacing between two consecutive pulses is needed in thepresent trapezoid algorithm to preserve a reasonable amplitude resolution.
The advantage of determining first the starting time of the pulse and than theamplitude is that a variable number of samples N (and even N1 6= N2, see Sec. 4.3.3)can be used for the average. These numbers N1 and N2 can be determined dynam-ically for every signal after the timing algorithm, as the maximum time intervalbetween two consecutive pulses. For the online data acquisition, a minimum valueof 1 µs was imposed for N1 and N2 to preserve the good amplitude resolution. Thedynamic determination of N can be useful for high counting rates.
Fig. 4.13 Right shows the comparison between the time resolution obtained withthe digitizer and with the conventional system for the same detector. The fast dig-itizer gives the same resolution as the conventional system (FWHM=2.1 keV). Thefull 60Co amplitude spectra obtained with the fast digitizer and with the conven-tional electronics are compared in Fig. 4.14. The following parameters were used forthe digitizer spectrum from this figure: N = N1 = N2 = 3.3µs and D = 1.4 µs. Alldetails of the conventional spectrum were reproduced by the fast digitizer.
In all of the amplitude tests that have been described in this section the min-imum full scale range was used to cover the full amplitude spectrum of 60Co. Forinvestigating the effect of the digitizer’s number of bits on the amplitude resolutionof the detector, three different full scale ranges of the digitizer were used: 250 mV,500 mV and 1 V. The amplitude resolutions obtained with the trapezoid algorithmfor these three full scale ranges are given in Table. 4.2. A slight deterioration ofthe resolution was observed when the full scale range was increased. Reasonableamplitude resolutions were obtained even for the 1 V full scale range. From thiswork it can be concluded that a digitizer with 12 bits amplitude range is sufficientfor used with Ge detectors at γ-ray energies below 10 MeV.

80 Data acquisition system with a fast digitizer
0
200
400
600
800
0 200 400 600 800
tran
sfer
rat
e (H
z)
pulser rate (Hz)
0
0.5
1
0 20 40 60 80 100 120 140
card
1 lo
sses
(%
)
card 1 rate (Hz)
Figure 4.15: Rate tests for the Acqiris DC440 digitizer (2 cards connected to acommon PC). Left: The transfer rate of the digitizer as a function of the frequencyof a pulser connected to the external trigger input. Right: The digitizer externaltrigger was the signal of an 800 Hz pulser validated by the presence of a randomsignal (response of an HPGe detector to a calibration source) that comes with 23.8 µsafter the pulser. Below 20 Hz average rate of such constructed external trigger thedigitizer number of lost valid triggers is negligible.
4.4.4 Maximum counting rate
The fast digitizer samples continuously the signal, storing the data in a circularbuffer. Once an external trigger occurs the acquisition is stopped and the data aretransferred to the PC. The acquisition starts again immediately after the transferprocess is finished. An online data analysis is preferred and this supposes that thetransferred signals are stored temporally in the Random Access Memory (RAM) ofthe PC and analyzed while the digitizer waits for a new external trigger. Only thestarting time of the pulse and the amplitude value are stored on the PC hard-disk.The acquisition and data transfer from the digitizer have a higher priority than theanalysis procedure.
The following test was made for the efficiency of the data transfer as a functionof the acquisition rate was made. A pulser gave the external trigger of the digitizerwith a fixed frequency and the number of the transferred signals was counted for along enough time. The number of external triggers was counted simultaneously withan external counter. Every signal had 10 000 samples (23.8 µs) and both digitizercards triggered simultaneously. The data from 4 input channels were transferred forevery trigger. From Fig. 4.15 it can be seen that the digitizer starts to lose signalswhen the pulser frequency exceeds about 750 Hz. At this frequency the dependenceof the transfer rate as a function of the pulser rate becomes non-linear. This is dueto a possible conflict between the two cards of the digitizer connected to the samePC when the cards trigger simultaneously. To avoid this limitation in the transferrate of the digitizer two solutions are available. The first one is to record less than10 000 samples for every channel. The second solution is to reduce the trigger rateto the rate of the neutron induced events, that in average is 6 s−1 for every detector.

February 2006 L.C.Mihailescu 81
precise delay
Gate & delay
generator
T0 Fan in-fan out
TFA CFD ANDGate & delay
generator
ext trigger
TFA
ORAND
CFD
HPGe1
HV
PA
HPGe2
HV
PA
input channel 1
input channel 2
2
1 4
3
6
5
19 µs
ext. trigger
γ flash event neutron event
18.5 µs
18.5 µs
1
2
3
4
5
6
T0
Figure 4.16: The t.o.f. setup based on the fast digitizer Acqiris DC440. One card ofthe digitizer accommodated two HPGe detectors. Conventional electronic moduleswere still used to reduce the counting rate to the neutron induced counting rate(about 6 counts/s in average). The corresponding timing of the signals is given inthe left panel. The external trigger is the delayed t0 signal
The second solution it was used in the electronic setup for the (n,xnγ) cross-sectionsmeasurement at 200 m flight path station (Sec. 4.5).
In a second test, the external trigger was a signal of a pulser with 800 Hz fre-quency that was validated by the presence of an output signal of an HPGe detectorthat sees a radioactive source. The HPGe detector output has to be within 23.8 µsafter the pulser signal. The distance between the radioactive source and the detectorwas decreased to increase the average rate of the external trigger. The losses in thecard were defined as the difference between the number of signals counted by theexternal counter and the number of signals transferred in the digitizer. Fig. 4.15shows the dependence of the losses in the card versus the external trigger rate. Atexternal trigger rates below 20 Hz the losses are less than 0.1% and that suggest thatthe DC440 fast digitizer can be used in the actual inelastic scattering cross-sectionmeasurement at GELINA, the dead time of a setup based on the digitizer beingnegligible. In conclusion, working with 4 large volume HPGe detectors connectedsimultaneously to this digitizer is possible at 800 Hz repetition rate of the accelera-tor with no dead time as long as the external trigger rate for each card is relativelysmall (about 20 Hz). The dead time should not be neglected at rates greater than100 Hz.
4.5 Electronic scheme for the t.o.f. measurement
with the digitizer
For the measurement of the neutron inelastic scattering cross-section with the dig-itizer, the electronic setup of Fig. 4.16 was used. The purpose of the conventionalelectronic modules was only to reduce the counting rate to the rate of the neutroninduced events, i.e. avoid triggering by the γ-flash. For this, an external trigger wasconstructed to select only the events that are generated within about 19µs after the
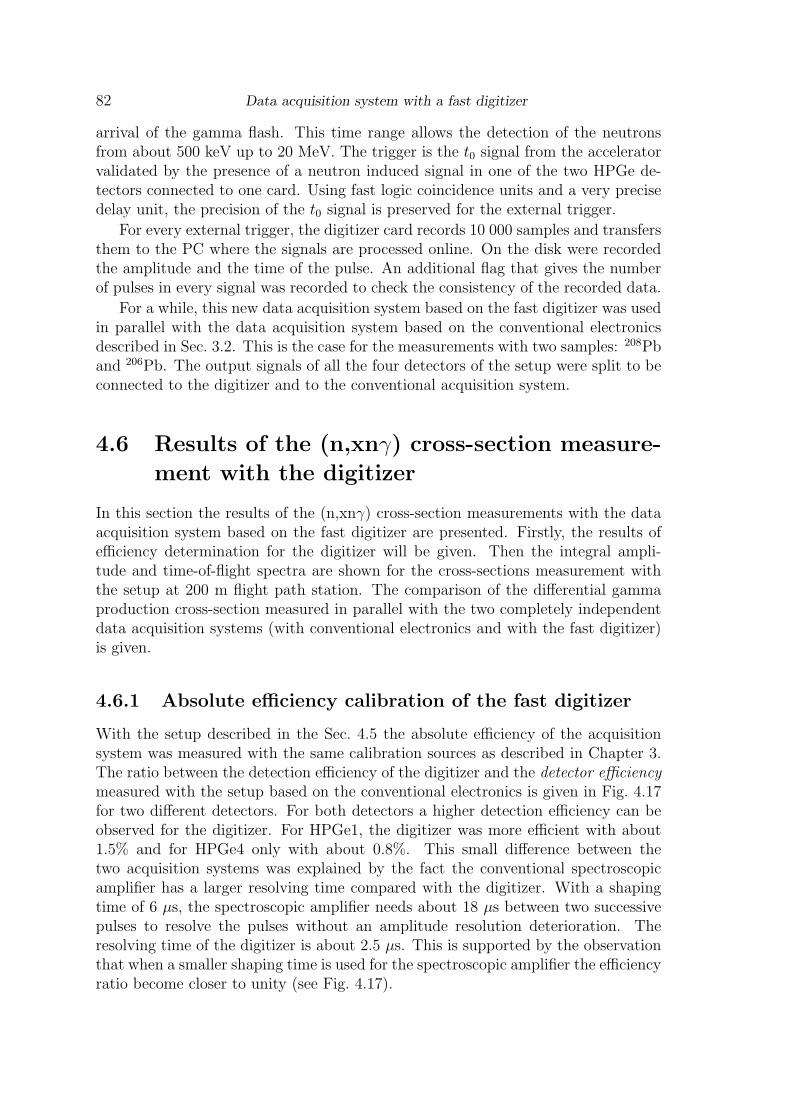
82 Data acquisition system with a fast digitizer
arrival of the gamma flash. This time range allows the detection of the neutronsfrom about 500 keV up to 20 MeV. The trigger is the t0 signal from the acceleratorvalidated by the presence of a neutron induced signal in one of the two HPGe de-tectors connected to one card. Using fast logic coincidence units and a very precisedelay unit, the precision of the t0 signal is preserved for the external trigger.
For every external trigger, the digitizer card records 10 000 samples and transfersthem to the PC where the signals are processed online. On the disk were recordedthe amplitude and the time of the pulse. An additional flag that gives the numberof pulses in every signal was recorded to check the consistency of the recorded data.
For a while, this new data acquisition system based on the fast digitizer was usedin parallel with the data acquisition system based on the conventional electronicsdescribed in Sec. 3.2. This is the case for the measurements with two samples: 208Pband 206Pb. The output signals of all the four detectors of the setup were split to beconnected to the digitizer and to the conventional acquisition system.
4.6 Results of the (n,xnγ) cross-section measure-
ment with the digitizer
In this section the results of the (n,xnγ) cross-section measurements with the dataacquisition system based on the fast digitizer are presented. Firstly, the results ofefficiency determination for the digitizer will be given. Then the integral ampli-tude and time-of-flight spectra are shown for the cross-sections measurement withthe setup at 200 m flight path station. The comparison of the differential gammaproduction cross-section measured in parallel with the two completely independentdata acquisition systems (with conventional electronics and with the fast digitizer)is given.
4.6.1 Absolute efficiency calibration of the fast digitizer
With the setup described in the Sec. 4.5 the absolute efficiency of the acquisitionsystem was measured with the same calibration sources as described in Chapter 3.The ratio between the detection efficiency of the digitizer and the detector efficiencymeasured with the setup based on the conventional electronics is given in Fig. 4.17for two different detectors. For both detectors a higher detection efficiency can beobserved for the digitizer. For HPGe1, the digitizer was more efficient with about1.5% and for HPGe4 only with about 0.8%. This small difference between thetwo acquisition systems was explained by the fact the conventional spectroscopicamplifier has a larger resolving time compared with the digitizer. With a shapingtime of 6 µs, the spectroscopic amplifier needs about 18 µs between two successivepulses to resolve the pulses without an amplitude resolution deterioration. Theresolving time of the digitizer is about 2.5 µs. This is supported by the observationthat when a smaller shaping time is used for the spectroscopic amplifier the efficiencyratio become closer to unity (see Fig. 4.17).
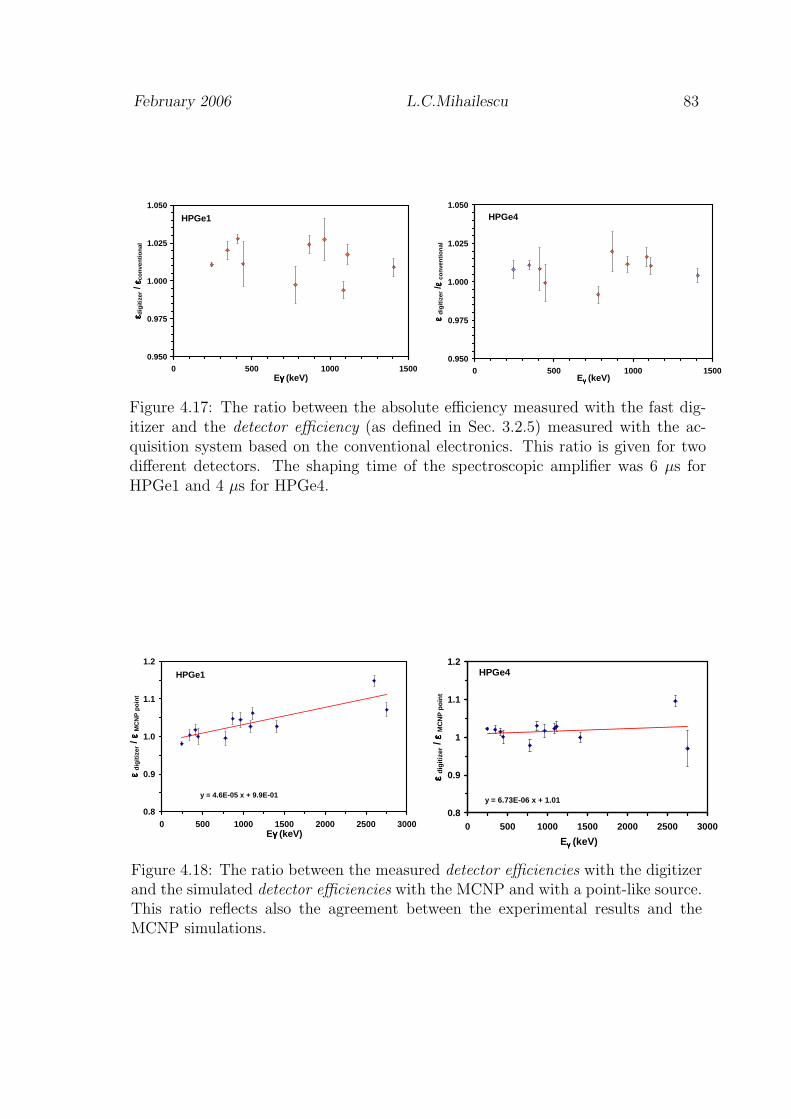
February 2006 L.C.Mihailescu 83
HPGe1
0.950
0.975
1.000
1.025
1.050
0 500 1000 1500Eγγγγ (keV)
εε εε dig
itiz
er /
εε εε co
nve
nti
on
al
HPGe4
0.950
0.975
1.000
1.025
1.050
0 500 1000 1500Eγγγγ (keV)
εε εε d
igit
izer
/ εε εε c
on
ven
tio
nal
Figure 4.17: The ratio between the absolute efficiency measured with the fast dig-itizer and the detector efficiency (as defined in Sec. 3.2.5) measured with the ac-quisition system based on the conventional electronics. This ratio is given for twodifferent detectors. The shaping time of the spectroscopic amplifier was 6 µs forHPGe1 and 4 µs for HPGe4.
y = 4.6E-05 x + 9.9E-01
0.8
0.9
1.0
1.1
1.2
0 500 1000 1500 2000 2500 3000Eγγγγ (keV)
εε εε d
igit
izer
/ εε εε
MC
NP
po
int
HPGe1
y = 6.73E-06 x + 1.01
0.8
0.9
1
1.1
1.2
0 500 1000 1500 2000 2500 3000
Eγγγγ (keV)
εε εε d
igit
izer
/ εε εε
MC
NP
po
int
HPGe4
Figure 4.18: The ratio between the measured detector efficiencies with the digitizerand the simulated detector efficiencies with the MCNP and with a point-like source.This ratio reflects also the agreement between the experimental results and theMCNP simulations.

84 Data acquisition system with a fast digitizer
1.0
2.0
3.0
4.0
200 400 600 800 1000 1200 1400
Eγγγγ (keV)
εε εε d /
εε εε c
0
200
400
600
800
5000 10000 15000 20000
Yie
ld (
coun
ts)
En (keV)
digitizerconventional
Figure 4.19: Left: Detection efficiency comparison between the digitizer and theconventional acquisition system. Right: The yield of the HPGe2 for the 803 keVtransition in the 206Pb measurement. The comparison between the yield obtainedwith the digitizer and with the conventional acquisition system is shown. The ac-quisition time was the same in both cases.
The applied corrections for the efficiency were explained for the conventionalsystem in Chapter 3. For the digitizer the absolute efficiency is only corrected forthe γ-ray self-attenuation and extended volume source effect. No losses due to theuse of the SRTR function appear in the digitizer. The final absolute efficiency forthe cross-sections measurement with the fast digitizer can be written as:
εd = εMCNP extendedεdigitizer
εMCNP point
. (4.23)
The linear fit of the ratioεdigitizer
εMCNP pointwas used to reduce the uncertainties due to
the individual fluctuations. This ratio and the corresponding linear fit are given inFig. 4.18 for the detectors HPGe1 and HPGe4 for the 208Pb measurement. These twodetectors are the extreme cases for the agreement between the measured detectorefficiency with the digitizer and the simulated efficiencies with MCNP with thepoint-like source.
Fig. 4.19 Left shows the ratio between the efficiency of the acquisition systemwith the fast digitizer (εd) and the efficiency of the acquisition system with theconventional electronics (εc). The two efficiencies are calculated with Eq. 4.23 andrespectively Eq. 3.4. These two sets of efficiencies were used for the cross-sectioncalculation with the 206Pb sample and include all the corrections. It can be seenthat the acquisition system based on the fast digitizer has a much higher efficiency,especially at low energies (3 times higher at 350 keV). The difference between thetwo system is reduced to 15% at 1.4 MeV. This difference in efficiency is reflectedin a better statistics for the fast digitizer. In Fig. 4.19 Right the yield of the maingamma peak from the 206Pb nucleus (803 keV) is shown as a function of the neutronenergy for the two acquisition systems. The data were recorded in parallel for thesame time interval. For this γ-ray peak 40% was gained in the efficiency using thefast digitizer.

February 2006 L.C.Mihailescu 85
0
500
1000
0 5 10 15 20
Cou
nts
T.o.f. (µs)
0
50
100
0 1000 2000 3000C
ount
s (1
03 )Eγ (keV)
<-- 2
614
keV
<-- 583 keV
<-- 803 keV
<-- 511 keV
Figure 4.20: Typical examples of the integral amplitude and t.o.f. spectra for the208Pb measurement with the digitizer. Above: Amplitude spectrum Below: T.o.f.spectrum.
4.6.2 Amplitude and t.o.f. spectra
Examples of the integral amplitude and time-of-flight spectra for the 208Pb cross-sections measurement are shown in Fig. 4.20. The amplitude spectrum was inte-grated over the full neutron energy range, from 500 keV up to 25 MeV. The mainγ-ray peaks from the 208Pb nucleus are of 2614 keV and 583 keV. The 803 keV peakis from the 206Pb nucleus and resulted from the (n,xnγ) reactions on different Pbisotopes in the sample.
In the t.o.f. spectrum, the gamma flash peak can be easily distinguished at lowvalues of the t.o.f. spectrum. This peak resulted only from the signals that had apile-up between the gamma-flash induced events and the neutron induced events.In the data acquisition system based on the conventional electronics all these eventswere rejected using the inhibit signal.
4.6.3 Differential gamma production cross-section
In parallel with the data from the conventional acquisition system, the data fromthe acquisition system based on the fast digitizer were analyzed and the differen-tial gamma production cross-sections were compared. Here, only few examples ofthe gamma-production cross-sections are shown. Fig. 4.21 presents the differentialgamma production cross-section for the 2614 keV and 583 keV transitions from208Pb nucleus. The measurement angles were 110o and respectively 150o. The tworesults of completely independent acquisition systems (but same detectors) agreewell within the stated uncertainties. The magnitudes of the uncertainties are givenas generic error bars at 6 MeV and at 15 MeV.
The neutron energy resolution of the two acquisition systems can be compared

86 Data acquisition system with a fast digitizer
0
0.05
0.1
0.15
5000 10000 15000
dσ/d
Ω (
bar
n/sr
)
En (keV)
2614 keV - 208Pb110o
digitizerconventional
0
0.05
0.1
0.15
5000 10000 15000
dσ/d
Ω (
bar
n/sr
)
En (keV)
583 keV - 208Pb150o
digitizerconventional
Figure 4.21: Comparison of the differential gamma production cross-sections ob-tained with the fast digitizer and with the conventional electronics for 208Pb. Bothexcitation functions were smoothed with a running average filter only for an eas-ier comparison. Left: Differential gamma production cross-section at 110o for themain transition of 208Pb nucleus (2614 keV). Right: Differential gamma productioncross-section at 150o for the second transition of 208Pb nucleus (583 keV).
0
0.02
0.04
0.06
0.08
0.1
0.12
800 900 1000
dσ/d
Ω (
barn
/sr)
En (keV)
digitizerconventional
Figure 4.22: High resolution differential gamma production cross-sections obtainedfor the 803 keV transition from 206Pb with the fast digitizer and with the conven-tional acquisition system.
February 2006 L.C.Mihailescu 87
when resonance structures are visible. This is the case for the main transitionof 206Pb (803 keV) at neutron energies immediately above the inelastic threshold.The resonance structures in the differential gamma production cross-section of the803 keV transition are shown in Fig. 4.22 for the two acquisition systems. The datawere recorded in parallel with the same detector (HPGe2) at 150o. The two systemsprovide almost the same result. The small difference in the resonance amplitude maybe the effect of the tail in the time resolution spectrum of the digitizer (see Fig.4.12).This small difference does not outweigh the higher efficiency of the digitizer.
4.7 Conclusions
A new data acquisition system based on a fast digitizer was created to increase thedetection efficiency in the (n,xnγ) cross-section measurements with the experimentalsetup at 200 m flight path station. In a first stage, tests were made to investigate ofthe possibility using a 12-bits and 420 MSPS fast digitizer with large volume HPGedetectors. These tests involved the comparison of time and amplitude resolutionsobtained with the fast digitizer and with the conventional electronics. Differentsignal processing algorithms were tested offline on the same sets of raw signals (asrecorded from the output of the preamplifier) to establish the most suitable one forthe online acquisition. The trapezoid algorithm for the amplitude and the CFDalgorithm for the timing were preferred for the online signal processing. With thefast digitizer the amplitude and time resolutions were identical with the resultsobtained with the conventional electronics. The advantages of the fast digitizer arefirstly the fact that the time spectrum of the digitizer has a much smaller tail thanthe CF function of the CFD module and secondly that the minimum resolving timeof trapezoid algorithm is only 2.5 µs, much smaller than the one of the spectroscopicamplifier.
The results of the tests concluded that the 12-bits and 420 MSPS fast digi-tizer can be used successfully with large volume HPGe detectors for low countingrates as it is the case for the (n,xnγ) setup at the 200 m flight path station atGELINA. Substantially higher counting rates can be accommodated by a fast dig-itizer if an on-board data processing would be possible, e.g. if the digitizer hason-board Field Programmable Gate Array (FPGA) that can be used for a completesignal processing. The on-board signal processing would simplify even further theelectronic scheme given in Sec. 4.5, avoiding the use of any conventional electronicmodule for the external validation.
The differential gamma production cross-sections obtained with the data acqui-sition system based on the fast digitizer and with the data acquisition system basedon the conventional electronics were compared for two sets of measurements, with208Pb and 206Pb samples. The two acquisition systems give the same result for thedifferential gamma production cross-sections and the advantage of the fast digitizeris a higher detection efficiency, that increases from 15% at 1.4 MeV up to 300% at350 keV. The increase in the efficiency of the fast digitizer has two sources:
• the digitizer resolves the pile-up of the neutron induced events with the gamma-
88 Data acquisition system with a fast digitizer
flash induced events. 10%-20% efficiency is gained in this way for every detec-tor.
• the digitizer does not reject the pulses with a slow rise time and has the sameefficiency as the CF function of the conventional CFD module. The tail of thetime resolution spectrum is significantly reduced for the digitizer comparedwith the analog CF module.

Chapter 5
Results and discussion
The present chapter focuses on the results of the cross-sections measurements ofthe five nuclei that were investigated: 52Cr, 209Bi and 206,207,208Pb. The data weretaken with the experimental setup described in Chapter 3. The results shown inthis chapter were obtained only with the data acquisition based on the conventionalelectronics.
For the 207Pb and 208Pb nuclei, the samples were enriched only to 92.40% andrespectively 88.11%. Therefore, corrections for the isotopic composition and mixingof the (n,xnγ) (x=1,2,3) reactions on different isotopes were needed. These correc-tions were done iteratively using the cross-sections measured here. All the othercorrections mentioned in Chapter 3 were applied, unless mentioned otherwise.
5.1 52Cr neutron inelastic scattering and (n,2n)
cross-sections
5.1.1 Introduction
The majority of the experiments that measured the neutron inelastic cross-sectionof 52Cr involved the (n,n’γ)-technique (Refs. [93, 96, 98–102, 145, 147]). The (n,n’)-technique was used in the experiments performed by Olsson et al. [94] at 21 MeVand by Korzh et al. [97] at energies below 3 MeV.
The only measurement that covered the full energy range from the inelasticthreshold up to about 14 MeV was done by Voss et al. [99]. Except this, all themeasurements were done either at low neutron energies, from the inelastic thresholdup to about 4 MeV, or around 14 MeV.
Using Ge(Li) detectors, different experiments measured the cross-sections ofmaximum 12 γ-ray transitions. The best neutron energy resolution was obtainedby Voss et al. [99], 2.2 keV at 1 MeV and 70 keV at 10 MeV. This was the firstwork that showed the presence of the resonance structures in the neutron inelasticcross-sections at low energies. However a systematic difference in normalization wasobserved between the data of Voss et al. and the other data.
In the experiment described in this work, 12 γ-ray transitions from the 52Cr(n,n’γ)52Cr
89
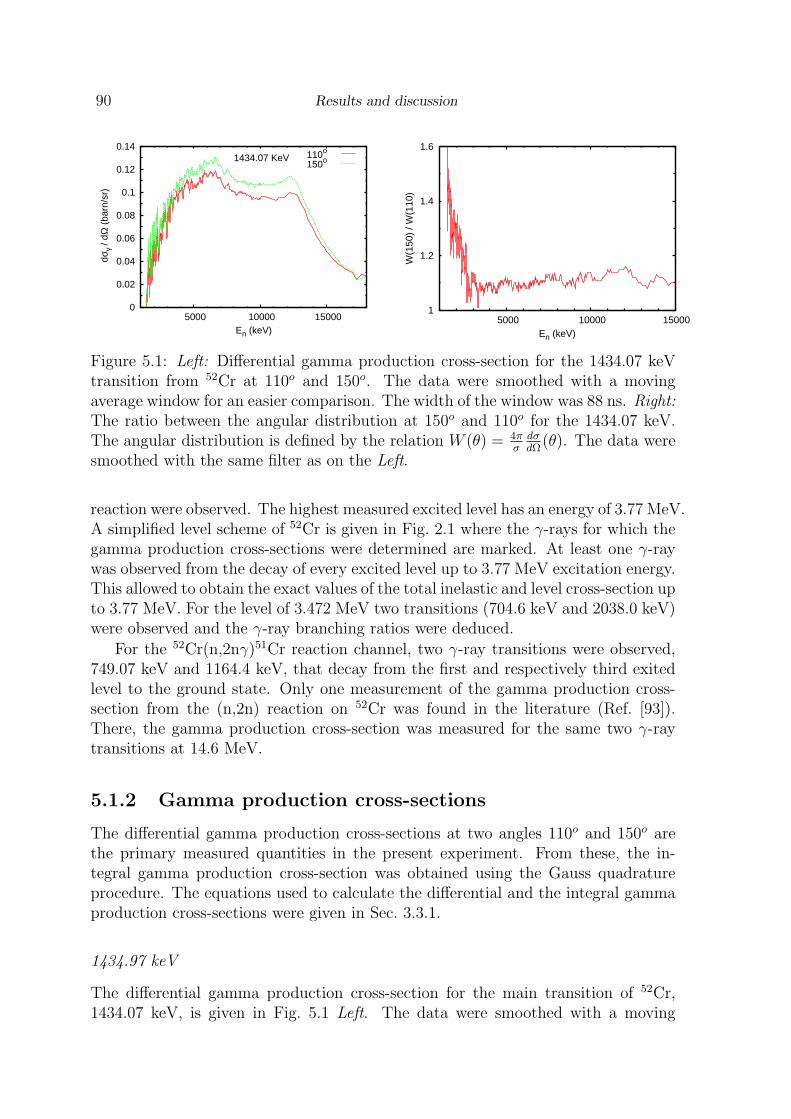
90 Results and discussion
0
0.02
0.04
0.06
0.08
0.1
0.12
0.14
5000 10000 15000
dσ γ
/ dΩ
(ba
rn/s
r)
En (keV)
1434.07 KeV 110o
150o
1
1.2
1.4
1.6
5000 10000 15000
W(1
50)
/ W(1
10)
En (keV)
Figure 5.1: Left: Differential gamma production cross-section for the 1434.07 keVtransition from 52Cr at 110o and 150o. The data were smoothed with a movingaverage window for an easier comparison. The width of the window was 88 ns. Right:The ratio between the angular distribution at 150o and 110o for the 1434.07 keV.The angular distribution is defined by the relation W (θ) = 4π
σdσdΩ
(θ). The data weresmoothed with the same filter as on the Left.
reaction were observed. The highest measured excited level has an energy of 3.77 MeV.A simplified level scheme of 52Cr is given in Fig. 2.1 where the γ-rays for which thegamma production cross-sections were determined are marked. At least one γ-raywas observed from the decay of every excited level up to 3.77 MeV excitation energy.This allowed to obtain the exact values of the total inelastic and level cross-section upto 3.77 MeV. For the level of 3.472 MeV two transitions (704.6 keV and 2038.0 keV)were observed and the γ-ray branching ratios were deduced.
For the 52Cr(n,2nγ)51Cr reaction channel, two γ-ray transitions were observed,749.07 keV and 1164.4 keV, that decay from the first and respectively third exitedlevel to the ground state. Only one measurement of the gamma production cross-section from the (n,2n) reaction on 52Cr was found in the literature (Ref. [93]).There, the gamma production cross-section was measured for the same two γ-raytransitions at 14.6 MeV.
5.1.2 Gamma production cross-sections
The differential gamma production cross-sections at two angles 110o and 150o arethe primary measured quantities in the present experiment. From these, the in-tegral gamma production cross-section was obtained using the Gauss quadratureprocedure. The equations used to calculate the differential and the integral gammaproduction cross-sections were given in Sec. 3.3.1.
1434.97 keV
The differential gamma production cross-section for the main transition of 52Cr,1434.07 keV, is given in Fig. 5.1 Left. The data were smoothed with a moving

February 2006 L.C.Mihailescu 91
0
0.05
0.1
0.15
1450 1550 1650 1750
dσ γ
/ dΩ
(ba
rn/s
r)
En (keV)
110o
150o
Figure 5.2: The differential gamma production cross-section of the 1434.07 keVtransition with the full energy resolution of this experiment at 150o and 110o . Inthis energy interval, a total uncertainty of 6% was obtained for both indicated angles.
0
0.5
1
1.5
5000 10000 15000 20000
σ γ
(bar
n)
En (keV)
1434.07 KeV
This work -smoothTalys - defaultOblozinsky(1992)Yamamoto(1978)Voss(1975)-smoothTessler(1975)Breunlich(1971)
0
0.5
1
1.5
1500 2000 2500 3000 3500 4000
σ γ
(bar
n)
En (keV)
1434.07 KeV
This work -smoothLashuk(1994)Karatzas(1978)
Figure 5.3: Integral gamma production cross-section for the 1434.07 keV transitionin 52Cr. Left: Full energy scale from the threshold up to 18 MeV. Right: A detailedplot at low neutron energies.

92 Results and discussion
0
0.5
1
1.5
σ γ
(bar
n)
1434.07 keVThis workLashuk(1994)Karatzas(1978)
0
0.5
1
1450 1650 1850 2050
σ γ
(bar
n)
En (keV)
Voss(1975)
0
2
4
6
8
10
12
14
5000 10000 15000
Unc
erta
inty
(%
)
En (keV)
Figure 5.4: Left: Integral gamma production cross-section for the 1434.07 keV tran-sition in 52Cr with the full energy resolution. The present data are compared withthe results of Voss et al. [99]. Right: The total uncertainty of the integral gammaproduction cross-section for the 1434.07 keV transition
average window filter only for a better comparison. The width of the window was11 energy bins (88 ns time-of-flight). Fig. 5.1 Right shows the ratio between thedifferential gamma production at 150o and 110o as a function of neutron energy.This ratio is equal to the ratio of the angular distributions W (θ) at the two angles.The value predicted by the Eq. 2.17 for a stretched E2 γ-ray transition from aninitial level 2+ to a level 0+ is 1.61. It can be seen that the value of this ratioimmediately above the threshold is in very good agreement with the theoreticalprediction for an E2 transition. With the increase of the neutron energy the ratioW (150)/W (110) decreases, becoming constant and different from unity at about2.5 MeV neutron energy. This may be a consequence of the fact that at 2.4 MeVthe second excited level starts to be populated and the angular distribution of the1434 keV transition is affected by the feeding from this level.
Fig. 5.2 shows the differential gamma production cross-sections of the 1434.07 keVtransition with the full energy resolution of this experiment. The high neutron en-ergy resolution of the setup allowed the observation of the resonance structures atlow energies above the inelastic threshold.
The integral gamma production cross-section obtained by integrating the differ-ential cross-sections through the Gauss quadrature is given in Fig. 5.3. At 14 MeVthe present results agree well with the other measurements. A significant differencecan be observed in the comparison with the data of Tessler et al. [130] and Vosset al. [99]. These data are lower than the present ones. The normalization of thepresent data is supported by the good agreement with the recent data of Karatzas etal. [96] and Lashuk et al. [130] at low energies (Fig. 5.3 Right and Fig. 5.4 Left). De-spite the difference in the normalization with the Voss results (difference mentionedfirst time in Ref. [96]) the same resonance structures are observed (Fig. 5.4 Left).The net advantage of the present results is a factor 2 gained in the neutron energyresolution, 1.1 keV at 1 MeV for the present results, compared with 2.2 keV in theexperiment of Voss et al.
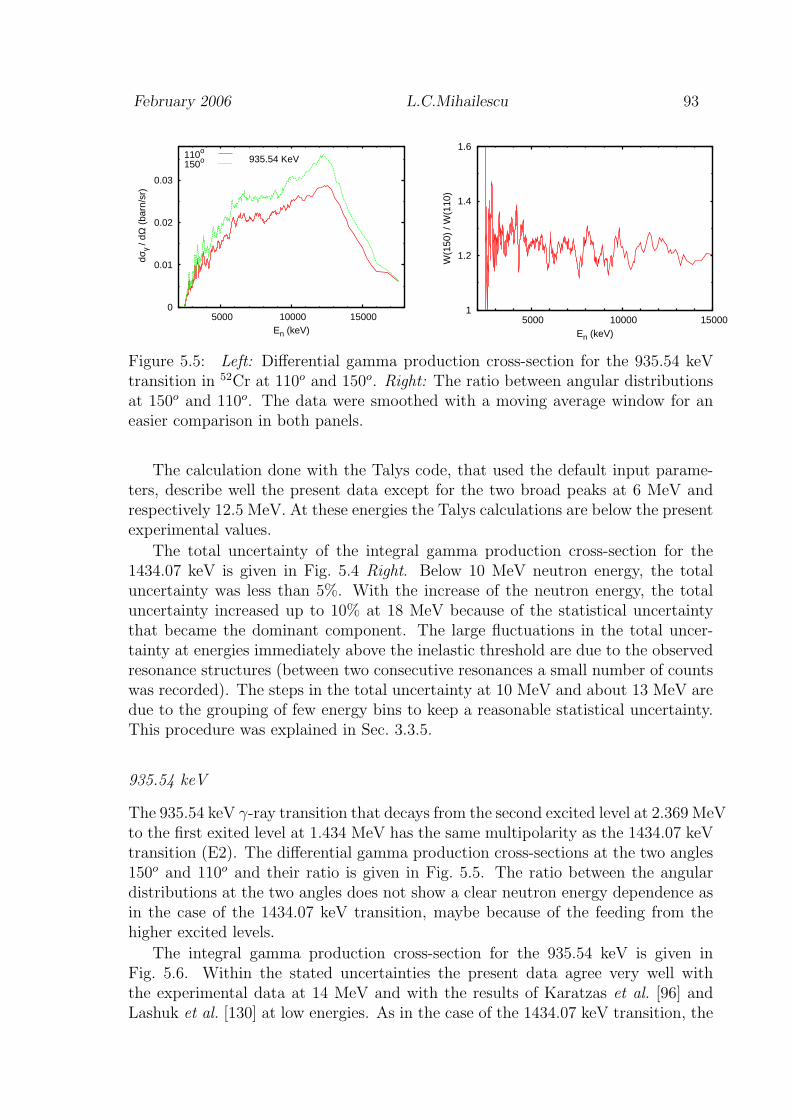
February 2006 L.C.Mihailescu 93
0
0.01
0.02
0.03
5000 10000 15000
dσ γ
/ dΩ
(ba
rn/s
r)
En (keV)
935.54 KeV110o
150o
1
1.2
1.4
1.6
5000 10000 15000
W(1
50)
/ W(1
10)
En (keV)
Figure 5.5: Left: Differential gamma production cross-section for the 935.54 keVtransition in 52Cr at 110o and 150o. Right: The ratio between angular distributionsat 150o and 110o. The data were smoothed with a moving average window for aneasier comparison in both panels.
The calculation done with the Talys code, that used the default input parame-ters, describe well the present data except for the two broad peaks at 6 MeV andrespectively 12.5 MeV. At these energies the Talys calculations are below the presentexperimental values.
The total uncertainty of the integral gamma production cross-section for the1434.07 keV is given in Fig. 5.4 Right. Below 10 MeV neutron energy, the totaluncertainty was less than 5%. With the increase of the neutron energy, the totaluncertainty increased up to 10% at 18 MeV because of the statistical uncertaintythat became the dominant component. The large fluctuations in the total uncer-tainty at energies immediately above the inelastic threshold are due to the observedresonance structures (between two consecutive resonances a small number of countswas recorded). The steps in the total uncertainty at 10 MeV and about 13 MeV aredue to the grouping of few energy bins to keep a reasonable statistical uncertainty.This procedure was explained in Sec. 3.3.5.
935.54 keV
The 935.54 keV γ-ray transition that decays from the second excited level at 2.369 MeVto the first exited level at 1.434 MeV has the same multipolarity as the 1434.07 keVtransition (E2). The differential gamma production cross-sections at the two angles150o and 110o and their ratio is given in Fig. 5.5. The ratio between the angulardistributions at the two angles does not show a clear neutron energy dependence asin the case of the 1434.07 keV transition, maybe because of the feeding from thehigher excited levels.
The integral gamma production cross-section for the 935.54 keV is given inFig. 5.6. Within the stated uncertainties the present data agree very well withthe experimental data at 14 MeV and with the results of Karatzas et al. [96] andLashuk et al. [130] at low energies. As in the case of the 1434.07 keV transition, the

94 Results and discussion
0
0.1
0.2
0.3
0.4
5000 10000 15000
σ γ
(bar
n)
En (keV)
935.54 KeV
This work-smoothTalys - defaultOblozinsky(1992)Yamamoto(1978)Voss(1975)-smoothTessler(1975)
0
0.1
0.2
σ γ
(bar
n)
935.54 KeVThis workLashuk(1994)Karatzas-(1978)
0
0.1
0.2
2300 2800 3300 3800 4300
σ γ
(bar
n)
En (keV)
Voss(1975)
Figure 5.6: Integral gamma production cross-section for the 935.54 keV transitionin 52Cr. Left: Full energy scale from the threshold up to 18 MeV. Right: A detailedplot at low neutron energies.
0
0.005
0.01
0.015
0.02
5000 10000 15000
dσ γ
/ dΩ
(ba
rn/s
r)
En (keV)
1530.67 KeV110o
150o
0.6
0.7
0.8
0.9
1
5000 10000 15000
W(1
50)
/ W(1
10)
En (keV)
Figure 5.7: Left: Differential gamma production cross-section for the 1530.67 keVtransition in 52Cr at 110o and 150o. Right: The ratio between angular distributionsat 150o and 110o. The data were smoothed with a moving average window for aneasier comparison in both panels.
same difference in the amplitude can be observed between the present data and thedata of Voss et al. [99]. Also for this transition, 935.54 keV, some small resonancestructures can be observed below 4 MeV (Fig. 5.6 Right).
The Talys calculation describes reasonably the present experimental integralgamma production cross-section for the 935.54 keV transition on the full energyrange, from the threshold (2.41 keV) up to 18 MeV. The calculation is higher thanthe measured values with about 15% around 8 MeV neutron energy (Fig. 5.6). Thesame difference can be observed at energies above 14 MeV.
1530.67 keV
A different example of γ-ray angular distribution is given in Fig. 5.7 for the 1530.67 keVtransition (M1+E2). This γ-ray results from the decay of the 5th excited level, at
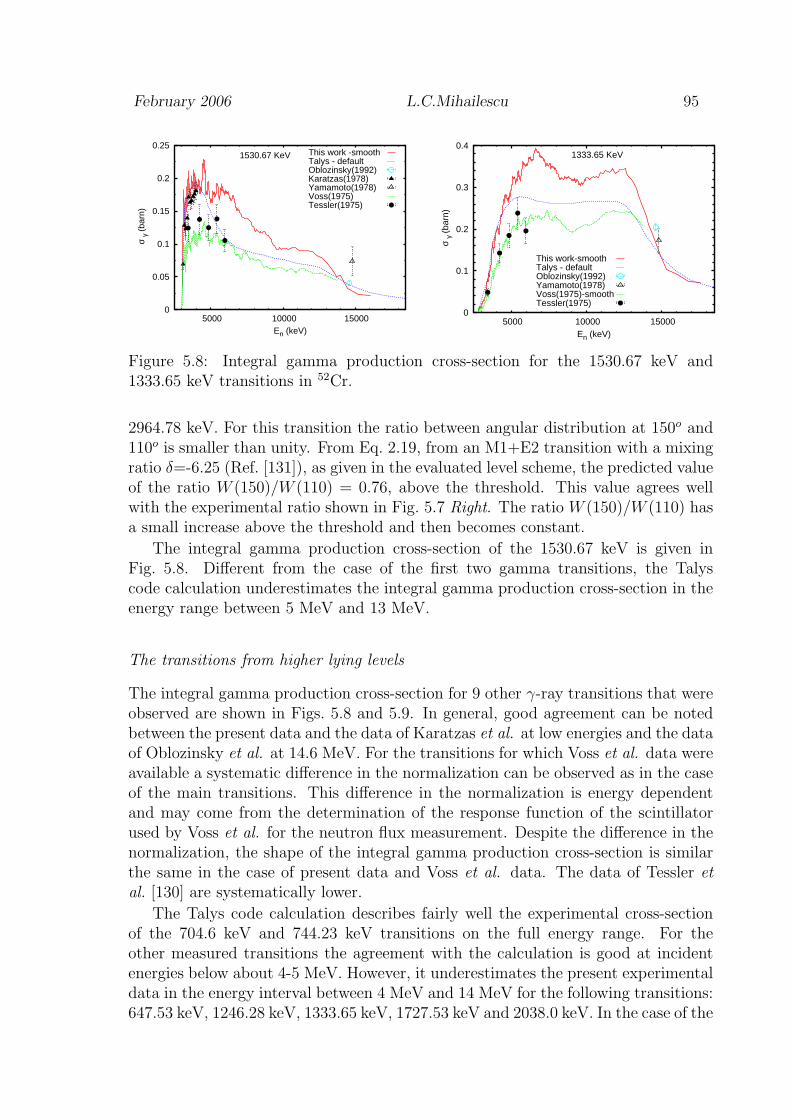
February 2006 L.C.Mihailescu 95
0
0.05
0.1
0.15
0.2
0.25
5000 10000 15000
σ γ
(bar
n)
En (keV)
1530.67 KeV This work -smoothTalys - defaultOblozinsky(1992)Karatzas(1978)Yamamoto(1978)Voss(1975)Tessler(1975)
0
0.1
0.2
0.3
0.4
5000 10000 15000
σ γ
(bar
n)
En (keV)
1333.65 KeV
This work-smoothTalys - defaultOblozinsky(1992)Yamamoto(1978)Voss(1975)-smoothTessler(1975)
Figure 5.8: Integral gamma production cross-section for the 1530.67 keV and1333.65 keV transitions in 52Cr.
2964.78 keV. For this transition the ratio between angular distribution at 150o and110o is smaller than unity. From Eq. 2.19, from an M1+E2 transition with a mixingratio δ=-6.25 (Ref. [131]), as given in the evaluated level scheme, the predicted valueof the ratio W (150)/W (110) = 0.76, above the threshold. This value agrees wellwith the experimental ratio shown in Fig. 5.7 Right. The ratio W (150)/W (110) hasa small increase above the threshold and then becomes constant.
The integral gamma production cross-section of the 1530.67 keV is given inFig. 5.8. Different from the case of the first two gamma transitions, the Talyscode calculation underestimates the integral gamma production cross-section in theenergy range between 5 MeV and 13 MeV.
The transitions from higher lying levels
The integral gamma production cross-section for 9 other γ-ray transitions that wereobserved are shown in Figs. 5.8 and 5.9. In general, good agreement can be notedbetween the present data and the data of Karatzas et al. at low energies and the dataof Oblozinsky et al. at 14.6 MeV. For the transitions for which Voss et al. data wereavailable a systematic difference in the normalization can be observed as in the caseof the main transitions. This difference in the normalization is energy dependentand may come from the determination of the response function of the scintillatorused by Voss et al. for the neutron flux measurement. Despite the difference in thenormalization, the shape of the integral gamma production cross-section is similarthe same in the case of present data and Voss et al. data. The data of Tessler etal. [130] are systematically lower.
The Talys code calculation describes fairly well the experimental cross-sectionof the 704.6 keV and 744.23 keV transitions on the full energy range. For theother measured transitions the agreement with the calculation is good at incidentenergies below about 4-5 MeV. However, it underestimates the present experimentaldata in the energy interval between 4 MeV and 14 MeV for the following transitions:647.53 keV, 1246.28 keV, 1333.65 keV, 1727.53 keV and 2038.0 keV. In the case of the

96 Results and discussion
0
0.02
0.04
0.06
0.08
0.1
5000 10000 15000
σ γ
(bar
n)
En (keV)
1212.80 KeVThis work -smoothTalys - defaultOblozinsky(1992)Karatzas(1978)Tessler(1975)
0
0.05
0.1
0.15
0.2
5000 10000 15000
σ γ
(bar
n)
En (keV)
1727.53 KeV This work -smoothTalys - defaultOblozinsky(1992)Karatzas(1978)Voss(1975)Tessler(1975)
0
0.02
0.04
0.06
0.08
5000 10000 15000
σ γ
(bar
n)
En (keV)
2337.44 KeV This work -smoothTalys - defaultTessler(1975)
0
0.02
0.04
0.06
0.08
0.1
0.12
5000 10000 15000
σ γ
(bar
n)
En (keV)
647.47 KeV
This work -smoothTalys - defaultOblozinsky(1992)Voss(1975)Tessler(1975)
0
0.02
0.04
0.06
0.08
0.1
0.12
5000 10000 15000
σ γ
(bar
n)
En (keV)
704.60 KeV This work -smoothTalys - defaultTalys - correctedOblozinsky(1992)
0
0.02
0.04
0.06
0.08
0.1
5000 10000 15000
σ γ
(bar
n)
En (keV)
744.23 KeVThis work -smoothTalys - defaultOblozinsky(1992)Karatzas(1978)Voss(1975)Tessler(1975)
0
0.01
0.02
0.03
0.04
0.05
5000 10000 15000
σ γ
(bar
n)
En (keV)
2038.00 KeV This work -smoothTalys - defaultTalys - correctedKaratzas(1978)Voss(1975)Tessler(1975)
0
0.02
0.04
0.06
5000 10000 15000
σ γ
(bar
n)
En (keV)
1246.28 KeVThis work -smoothTalys - defaultOblozinsky(1992)Tessler(1975)
Figure 5.9: Integral gamma production cross-section for transition that decay fromhigher excited levels of 52Cr. For the 704.60 keV and 2038.00 keV transitions fromthe level at 3472.24 keV the production cross-sections were corrected for the ob-served difference between the evaluated branching ratio (Ref. [131]) and the mea-sured branching ratio from the present experiment (see the text below).

February 2006 L.C.Mihailescu 97
1212.8 keV and 2337.44 keV the Talys calculations are higher than the experimentalvalues.
Branching ratio for the level at 3472 keV
The excited level of 3472.24 keV was the only level from which two γ-ray transitionswere observed with sufficient statistics to build the gamma production cross-sections.According to the adopted level scheme the transitions by which the level decays are704.6 keV and 2038.0 keV. Within the uncertainties, the thresholds of the gammaproduction cross-section for these two transitions were the same. The ratio betweentheir gamma production cross-sections is constant as a function of the neutron en-ergy, bringing an additional support to the gamma ray identification. The relativegamma intensities found in this experiment are 100% for 704.6 keV and 44.2 ± 12%for 2038.0 keV. This relative intensity for the 2038.0 keV transition is two timeshigher than the adopted value (Ref. [131]). On the other hand Karatzas et al. [96]found a relative intensity of 66, with about 50% higher than the present value. Theeffect of the difference between the measured and the evaluated branching ratio onthe gamma production cross-section is shown in Fig. 5.9. The gamma productioncross-section. With the new measured values for the branching ratios (the ”cor-rected” curve in Fig. 5.9) the calculation describes slightly better the prodcutioncross-section of the 2038.00 keV transition. For the 704.60 keV transition the dif-ference between the measured production cross-section and the Talys calculationbecomes larger around 6 MeV and smaller at energies above 10 MeV.
(n,2n) gamma production cross-sections
The relatively high threshold of the 52Cr(n,2n)51Cr reaction (12.27 MeV) and thelow neutron flux at high energies resulted in poor statistics for the gamma ray peaksfrom the (n,2n) channel. Fig. 5.10 shows the amplitude spectrum of the detector at150o integrated over the neutron energies from just below the (n,2n) threshold upto 20 MeV. This procedure allowed an easier identification of the 51Cr peaks. Onlytwo transitions, 749.06 keV and 1164.4 keV, were observed with enough statisticsto construct the gamma production cross-sections. The transition of 27.8 keV fromthe decay of the second excited level was not observed in this experiment becauseof its very low energy, below the thresholds of the electronics. Another limitationfor this transition is its internal conversion factor of 0.905 [131]. The 603.5 keV and1480.3 keV transitions were too weak to be separated from the background with areasonable statistical error.
The resulting gamma production cross-sections for the two transitions from 51Crare shown in Fig.5.11. The observed reaction threshold for each transition is thesame as the calculated one and this fact confirms the correct identification of thegamma rays. The 52Cr(n,2n)51Cr gamma production cross-section presented herewere not corrected for the neutron attenuation and multiple scattering. For the(n,2n) cross-sections the multiple scattering is expected to be negligible and theattenuation correction with the 52Cr sample is of the order of 1.5 %-2 %. Thetotal uncertainty for the derived (n,2n) gamma production cross-section was around
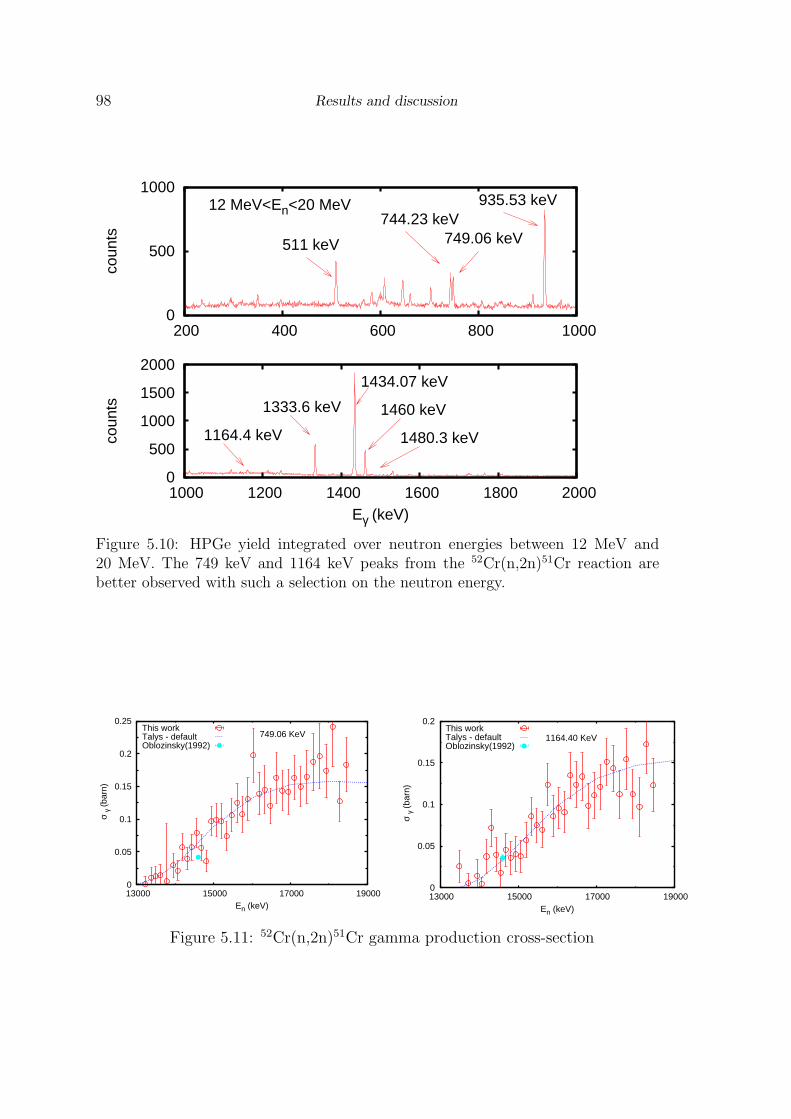
98 Results and discussion
0
500
1000
1500
2000
1000 1200 1400 1600 1800 2000
coun
ts
Eγ (keV)
1164.4 keV
1333.6 keV
1434.07 keV
1460 keV
1480.3 keV
0
500
1000
200 400 600 800 1000
coun
ts
12 MeV<En<20 MeV
511 keV
744.23 keV749.06 keV
935.53 keV
Figure 5.10: HPGe yield integrated over neutron energies between 12 MeV and20 MeV. The 749 keV and 1164 keV peaks from the 52Cr(n,2n)51Cr reaction arebetter observed with such a selection on the neutron energy.
0
0.05
0.1
0.15
0.2
0.25
13000 15000 17000 19000
σ γ
(bar
n)
En (keV)
749.06 KeVThis workTalys - defaultOblozinsky(1992)
0
0.05
0.1
0.15
0.2
13000 15000 17000 19000
σ γ
(bar
n)
En (keV)
1164.40 KeVThis workTalys - defaultOblozinsky(1992)
Figure 5.11: 52Cr(n,2n)51Cr gamma production cross-section

February 2006 L.C.Mihailescu 99
0
20
40
60
80
13000 15000 17000 19000
Unc
erta
inty
(%
)
En (keV)
Figure 5.12: Total uncertainty for the gamma production cross-section of the749 keV transition from the 52Cr(n,2n)51Cr reaction.
25% (Fig. 5.12). Higher values for the total relative uncertainty were obtainedimmediately above the threshold because of the poor statistics. The neutron energyresolution ranged between 120 keV immediately above the threshold and 180 keVat 18 MeV. The present data agree very well with the Talys calculation and withthe measurement of Oblozinsky et al. [93] at 14.6 MeV.
5.1.3 Total inelastic and level cross-sections
Total neutron inelastic cross-section
The total inelastic cross-section was obtained as described in Sec. 2.1.2 using the inte-gral gamma production cross-sections. Up to 3.771 MeV excitation energy, only fourtransitions contribute to the total inelastic cross-section: 1434.07 keV, 1530.67 keV,1727.53 keV and 2337.44 keV (see also Fig. 2.1). According to the adopted levelscheme, the next excited level above 3771 keV that decays directly to the groundstate is at 3951.2 keV. This leads to the conclusion that the total inelastic cross-section shown here (Fig. 5.13) is exact up to about 4.0 MeV neutron energy; abovethis value it has to be considered as a lower limit. In the case of the 52Cr, themajority of the excited levels decay through the first excited level so this limit isvery close to the exact value.
For a better comparison of the total cross-section with the existing data inFig.5.13 Left the present data were smoothed . The inset of Fig.5.13 Left representsthe total uncertainty for the total inelastic cross-section. Because the 1434.07 keVtransition is the dominant component in the construction of the total inelastic cross-sections, the uncertainty of the total inelastic cross-section is very similar to theuncertainty of the 1434.07 keV transition. At the extremities of the energy intervalthe total uncertainty is dominated by the statistical fluctuations. The steps in theuncertainty at 10 MeV and 13 MeV are due to the grouping together of few energybins.

100 Results and discussion
0
0.5
1
1.5
5000 10000 15000
σ (b
arn)
En (keV)
Total InelasticThis work-smoothTalys - defaultSimakov(1993)Van Patter(1962)JEFF 3.1ENDF-BVI
0
5
10
15
20
25
5000 10000 15000
Unc
erta
inty
(%
)
En (keV)
This work
0
0.5
1
1.5
σ (
barn
)
N,INL This work
0
2.5
5
7.5
1450 1550 1650 1750 1850 1950
σ (
barn
)
En (keV)
N,TOT ORELA (2001)
Figure 5.13: Total inelastic cross-section of 52Cr. Left: Comparison with otherexperimental data, with the evaluations of the libraries JEFF 3.1, and ENDF/B-VIand with the Talys calculation. The corresponding total uncertainty is given asinset. Right: Comparison of the full resolution total inelastic cross-section with thetotal neutron cross-section measured at ORELA et al. [105]
The total inelastic cross-section agrees very well with the experimental data ofVan Patter et al. [102] at low energies and that of Simakov et al. [130] at 14 MeV. Theevaluated cross-sections, ENDF/B-VI and JEFF 3.1, are very close to the presentdata except above 14 MeV where the evaluations are slightly higher.
Despite the fact that the Talys calculation underestimates almost all the gammaproduction cross-sections that contribute to the total inelastic cross-section, thelatter is well described in the whole energy range.
In Fig.5.13 Right, the full resolution total inelastic cross-section is comparedwith the total neutron cross-section measured in a transmission experiment atORELA [105]. Despite the poorer resolution of the inelastic measurement com-pared with the transmission measurement, many structures are common to bothdata sets. At the same time one observes clearly that the resonances in the in-elastic cross-section is not a fixed fraction of the resonances in the total neutroncross-section. This is in accord with the random nature of the partial widths.
Level 1434.09 keV
The cross-section of the first excited level is given in Fig. 5.14 together with thecorresponding total uncertainty. As described in Sec. 2.1.2, this cross-section wasobtained subtracting from the gamma production cross-section of the 1434.07 keVtransition the contributions of the following transitions: 935.54 keV, 1212.80 keV,1333.65 keV, 1530.67 keV, 744.23 keV, 647.47 keV, 2038.0 keV, 1246.28 keV and2337.44 keV. From the evaluated level scheme, the next level that decays directlyto the 1434.09 keV level has an energy of 4563.0 keV. From this it results that theconstructed cross-section of the 1434.09 keV level is exact up to about 4.5 MeVneutron energy.
The present cross-section for the 1434.09 keV level agrees very well with the data
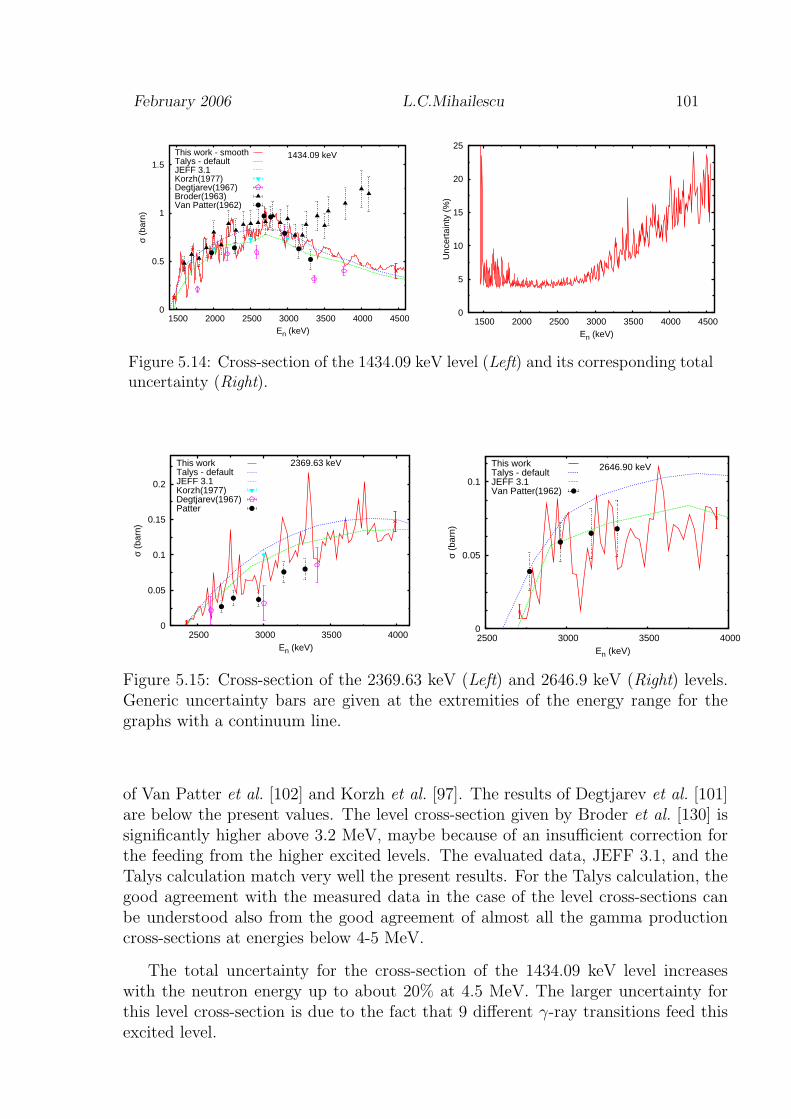
February 2006 L.C.Mihailescu 101
0
0.5
1
1.5
1500 2000 2500 3000 3500 4000 4500
σ (b
arn)
En (keV)
1434.09 keVThis work - smoothTalys - defaultJEFF 3.1Korzh(1977)Degtjarev(1967)Broder(1963)Van Patter(1962)
0
5
10
15
20
25
1500 2000 2500 3000 3500 4000 4500
Unc
erta
inty
(%
)
En (keV)
Figure 5.14: Cross-section of the 1434.09 keV level (Left) and its corresponding totaluncertainty (Right).
0
0.05
0.1
0.15
0.2
2500 3000 3500 4000
σ (b
arn)
En (keV)
2369.63 keVThis workTalys - defaultJEFF 3.1Korzh(1977)Degtjarev(1967)Patter
0
0.05
0.1
2500 3000 3500 4000
σ (b
arn)
En (keV)
2646.90 keVThis workTalys - defaultJEFF 3.1Van Patter(1962)
Figure 5.15: Cross-section of the 2369.63 keV (Left) and 2646.9 keV (Right) levels.Generic uncertainty bars are given at the extremities of the energy range for thegraphs with a continuum line.
of Van Patter et al. [102] and Korzh et al. [97]. The results of Degtjarev et al. [101]are below the present values. The level cross-section given by Broder et al. [130] issignificantly higher above 3.2 MeV, maybe because of an insufficient correction forthe feeding from the higher excited levels. The evaluated data, JEFF 3.1, and theTalys calculation match very well the present results. For the Talys calculation, thegood agreement with the measured data in the case of the level cross-sections canbe understood also from the good agreement of almost all the gamma productioncross-sections at energies below 4-5 MeV.
The total uncertainty for the cross-section of the 1434.09 keV level increaseswith the neutron energy up to about 20% at 4.5 MeV. The larger uncertainty forthis level cross-section is due to the fact that 9 different γ-ray transitions feed thisexcited level.

102 Results and discussion
0
0.05
0.1
0.15
2800 3000 3200 3400 3600 3800 4000
σ (b
arn)
En (keV)
2767.77 keVThis workTalys - defaultJEFF 3.1Van Patter(1962)
0
0.1
0.2
0.3
0.4
3000 3200 3400 3600 3800 4000
σ (b
arn)
En (keV)
2964.78 keV
This workTalys - defaultJEFF 3.1Van Patter(1962)
0
0.002
0.004
0.006
3400 3600 3800 4000
σ (b
arn)
En (keV)
3113.86 keVThis workTalys - defaultJEFF 3.1
0
0.1
0.2
0.3
3200 3400 3600 3800 4000
σ (b
arn)
En (keV)
3161.74 keVThis workTalys - defaultJEFF 3.1Van Patter(1962)
0
0.02
0.04
0.06
3400 3600 3800 4000
σ (b
arn)
En (keV)
3415.31 keVThis workTalys - defaultJEFF 3.1
0
0.02
0.04
0.06
0.08
0.1
0.12
3500 3600 3700 3800 3900 4000
σ (b
arn)
En (keV)
3472.24 keVThis workTalys - defaultJEFF 3.1
0
0.01
0.02
0.03
3500 3600 3700 3800 3900 4000
σ (b
arn)
En (keV)
3615.924 keVThis workTalys - defaultJEFF 3.1
0
0.02
0.04
0.06
0.08
3750 3850 3950
σ (b
arn)
En (keV)
3771.72 keVThis workTalys - default
Figure 5.16: Cross-section of the higher energy levels. Generic uncertainty bars aregiven at the extremities of the energy range for the graphs with a continuum line.
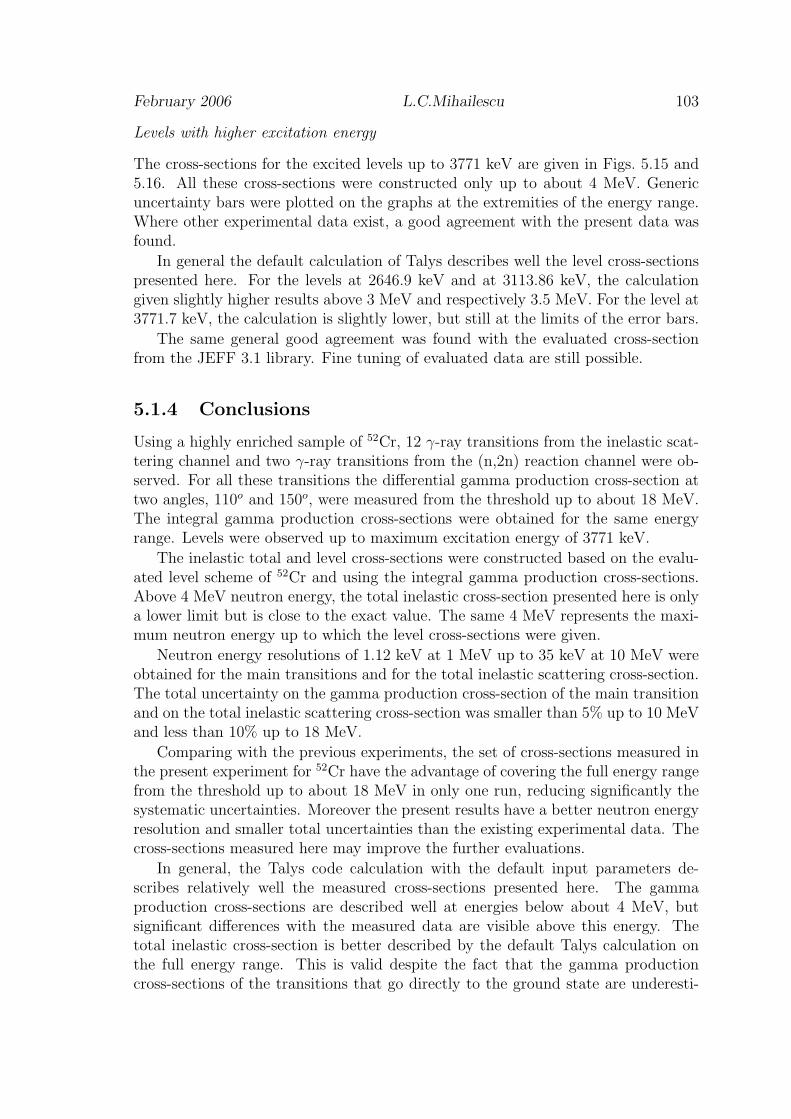
February 2006 L.C.Mihailescu 103
Levels with higher excitation energy
The cross-sections for the excited levels up to 3771 keV are given in Figs. 5.15 and5.16. All these cross-sections were constructed only up to about 4 MeV. Genericuncertainty bars were plotted on the graphs at the extremities of the energy range.Where other experimental data exist, a good agreement with the present data wasfound.
In general the default calculation of Talys describes well the level cross-sectionspresented here. For the levels at 2646.9 keV and at 3113.86 keV, the calculationgiven slightly higher results above 3 MeV and respectively 3.5 MeV. For the level at3771.7 keV, the calculation is slightly lower, but still at the limits of the error bars.
The same general good agreement was found with the evaluated cross-sectionfrom the JEFF 3.1 library. Fine tuning of evaluated data are still possible.
5.1.4 Conclusions
Using a highly enriched sample of 52Cr, 12 γ-ray transitions from the inelastic scat-tering channel and two γ-ray transitions from the (n,2n) reaction channel were ob-served. For all these transitions the differential gamma production cross-section attwo angles, 110o and 150o, were measured from the threshold up to about 18 MeV.The integral gamma production cross-sections were obtained for the same energyrange. Levels were observed up to maximum excitation energy of 3771 keV.
The inelastic total and level cross-sections were constructed based on the evalu-ated level scheme of 52Cr and using the integral gamma production cross-sections.Above 4 MeV neutron energy, the total inelastic cross-section presented here is onlya lower limit but is close to the exact value. The same 4 MeV represents the maxi-mum neutron energy up to which the level cross-sections were given.
Neutron energy resolutions of 1.12 keV at 1 MeV up to 35 keV at 10 MeV wereobtained for the main transitions and for the total inelastic scattering cross-section.The total uncertainty on the gamma production cross-section of the main transitionand on the total inelastic scattering cross-section was smaller than 5% up to 10 MeVand less than 10% up to 18 MeV.
Comparing with the previous experiments, the set of cross-sections measured inthe present experiment for 52Cr have the advantage of covering the full energy rangefrom the threshold up to about 18 MeV in only one run, reducing significantly thesystematic uncertainties. Moreover the present results have a better neutron energyresolution and smaller total uncertainties than the existing experimental data. Thecross-sections measured here may improve the further evaluations.
In general, the Talys code calculation with the default input parameters de-scribes relatively well the measured cross-sections presented here. The gammaproduction cross-sections are described well at energies below about 4 MeV, butsignificant differences with the measured data are visible above this energy. Thetotal inelastic cross-section is better described by the default Talys calculation onthe full energy range. This is valid despite the fact that the gamma productioncross-sections of the transitions that go directly to the ground state are underesti-

104 Results and discussion
mated by the calculation. These γ-rays are 1434.07 keV, 1530.67 keV , 1727.53 keVand 2337.44 keV. Anyway, the calculation gives higher values for the total inelasticcross-section around 9 MeV and above 14 MeV. These differences are higher than thegiven uncertainties. The good agreement of the calculated level cross-section withthe measured values can be understood also from the good agreement of almost allthe gamma production cross-sections at energies below 4-5 MeV.
The large cross-sections data set that was obtained in this experiment for theneutron inelastic scattering and (n,2n) reaction on 52Cr can be used as benchmark forthe nuclear codes and in future evaluations. As it can be seen from the comparisonspresented here, further fine tuning can be done for the Talys code, especially fora better description of the gamma production cross-sections. The evaluated cross-sections can be also improved.
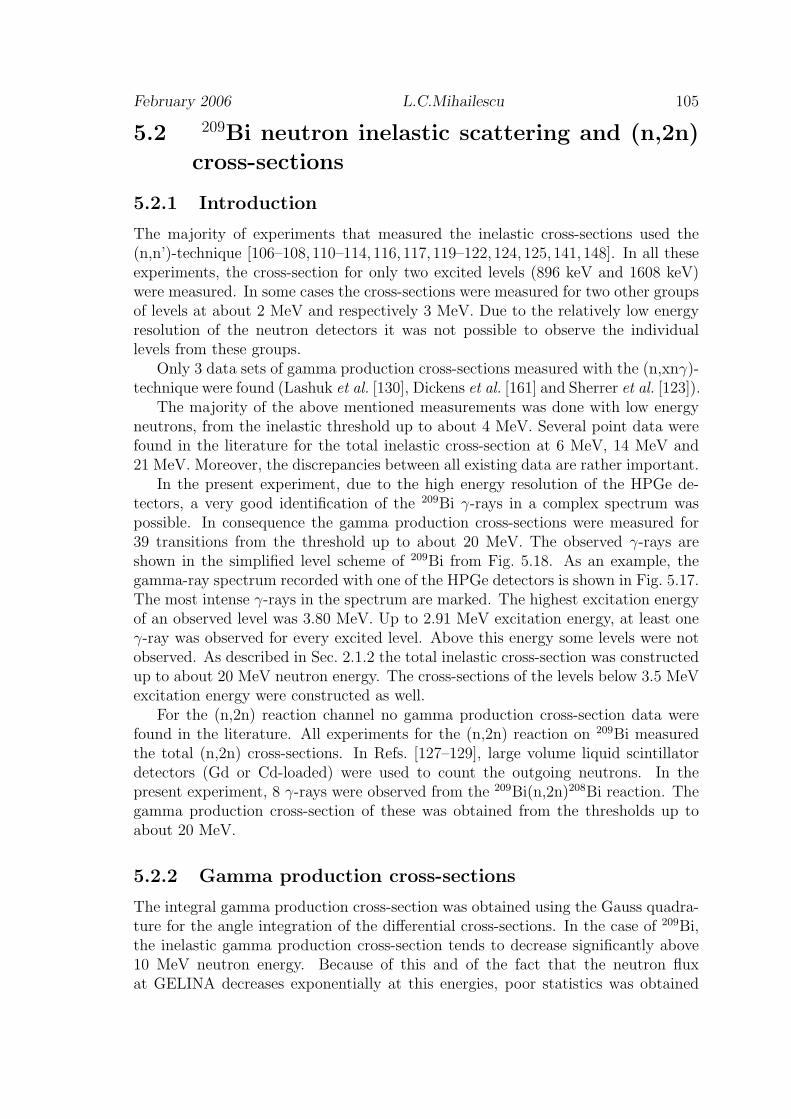
February 2006 L.C.Mihailescu 105
5.2 209Bi neutron inelastic scattering and (n,2n)
cross-sections
5.2.1 Introduction
The majority of experiments that measured the inelastic cross-sections used the(n,n’)-technique [106–108, 110–114, 116, 117, 119–122, 124, 125, 141, 148]. In all theseexperiments, the cross-section for only two excited levels (896 keV and 1608 keV)were measured. In some cases the cross-sections were measured for two other groupsof levels at about 2 MeV and respectively 3 MeV. Due to the relatively low energyresolution of the neutron detectors it was not possible to observe the individuallevels from these groups.
Only 3 data sets of gamma production cross-sections measured with the (n,xnγ)-technique were found (Lashuk et al. [130], Dickens et al. [161] and Sherrer et al. [123]).
The majority of the above mentioned measurements was done with low energyneutrons, from the inelastic threshold up to about 4 MeV. Several point data werefound in the literature for the total inelastic cross-section at 6 MeV, 14 MeV and21 MeV. Moreover, the discrepancies between all existing data are rather important.
In the present experiment, due to the high energy resolution of the HPGe de-tectors, a very good identification of the 209Bi γ-rays in a complex spectrum waspossible. In consequence the gamma production cross-sections were measured for39 transitions from the threshold up to about 20 MeV. The observed γ-rays areshown in the simplified level scheme of 209Bi from Fig. 5.18. As an example, thegamma-ray spectrum recorded with one of the HPGe detectors is shown in Fig. 5.17.The most intense γ-rays in the spectrum are marked. The highest excitation energyof an observed level was 3.80 MeV. Up to 2.91 MeV excitation energy, at least oneγ-ray was observed for every excited level. Above this energy some levels were notobserved. As described in Sec. 2.1.2 the total inelastic cross-section was constructedup to about 20 MeV neutron energy. The cross-sections of the levels below 3.5 MeVexcitation energy were constructed as well.
For the (n,2n) reaction channel no gamma production cross-section data werefound in the literature. All experiments for the (n,2n) reaction on 209Bi measuredthe total (n,2n) cross-sections. In Refs. [127–129], large volume liquid scintillatordetectors (Gd or Cd-loaded) were used to count the outgoing neutrons. In thepresent experiment, 8 γ-rays were observed from the 209Bi(n,2n)208Bi reaction. Thegamma production cross-section of these was obtained from the thresholds up toabout 20 MeV.
5.2.2 Gamma production cross-sections
The integral gamma production cross-section was obtained using the Gauss quadra-ture for the angle integration of the differential cross-sections. In the case of 209Bi,the inelastic gamma production cross-section tends to decrease significantly above10 MeV neutron energy. Because of this and of the fact that the neutron fluxat GELINA decreases exponentially at this energies, poor statistics was obtained
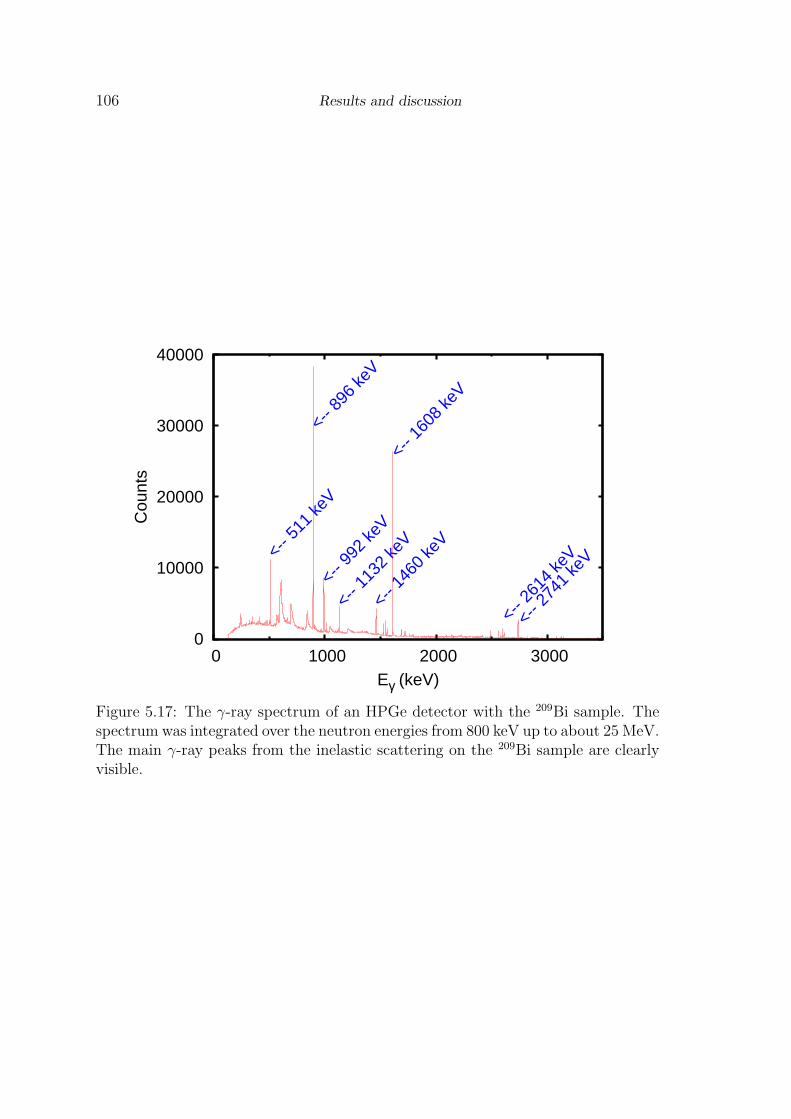
106 Results and discussion
0
10000
20000
30000
40000
0 1000 2000 3000
Cou
nts
Eγ (keV)
<-- 8
96 ke
V
<-- 9
92 ke
V
<-- 1
132
keV
<-- 1
460
keV
<-- 5
11 ke
V
<-- 2
741
keV
<-- 2
614
keV
<-- 1
608
keV
Figure 5.17: The γ-ray spectrum of an HPGe detector with the 209Bi sample. Thespectrum was integrated over the neutron energies from 800 keV up to about 25 MeV.The main γ-ray peaks from the inelastic scattering on the 209Bi sample are clearlyvisible.
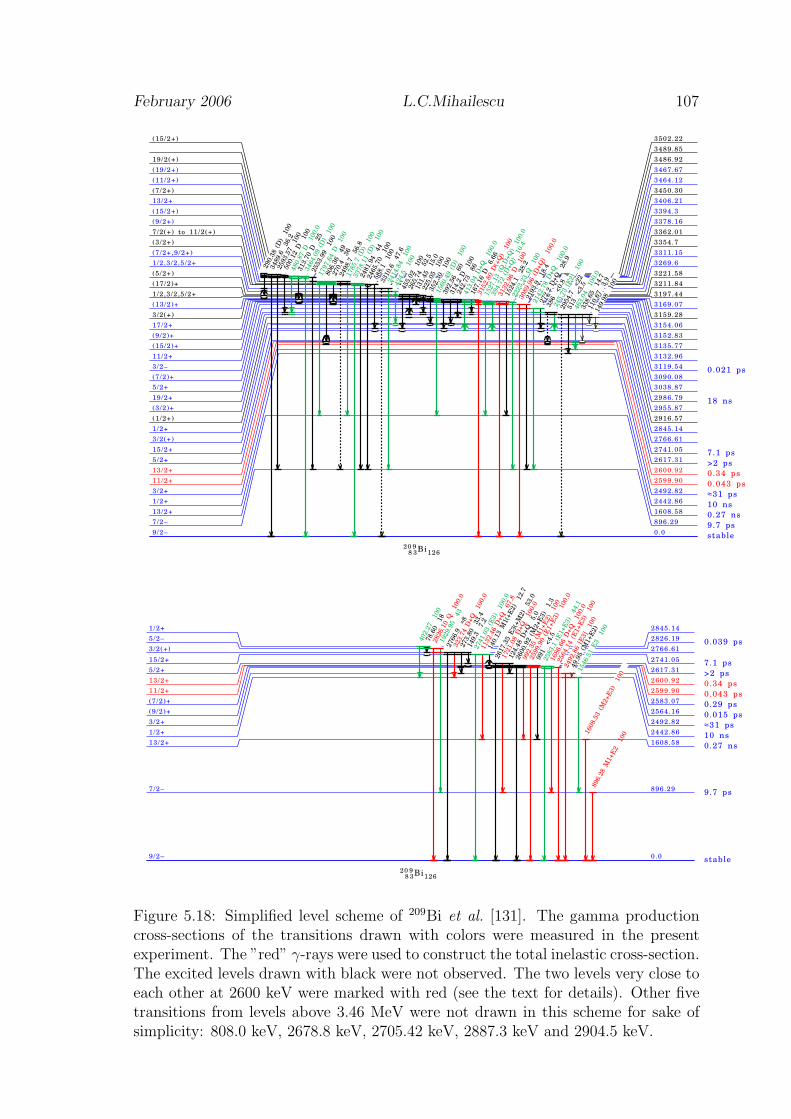
February 2006 L.C.Mihailescu 107
9/2– 0.0 stable
7/2– 896.29 9.7 ps
13/2+ 1608.58 0.27 ns
1/2+ 2442.86 10 ns
3/2+ 2492.82 ≈31 ps
11/2+ 2599.90 0.043 ps
13/2+ 2600.92 0.34 ps
5/2+ 2617.31 >2 ps
15/2+ 2741.05 7.1 ps
3/2(+) 2766.61
1/2+ 2845.14
(1/2+) 2916.57
(3/2)+ 2955.87
19/2+ 2986.79 18 ns
5/2+ 3038.87
(7/2)+ 3090.08
3/2– 3119.54 0.021 ps
11/2+ 3132.96
(15/2)+ 3135.77
(9/2)+ 3152.83
17/2+ 3154.06
3/2(+) 3159.28
(13/2)+ 3169.07
1/2,3/2,5/2+ 3197.44
(17/2)+ 3211.84
(5/2+) 3221.58
1/2,3/2,5/2+ 3269.6
(7/2+,9/2+) 3311.15
(3/2+) 3354.7
7/2(+) to 11/2(+) 3362.01
(9/2+) 3378.16
(15/2+) 3394.3
13/2+ 3406.21
(7/2+) 3450.30
(11/2+) 3464.12
(19/2+) 3467.67
19/2(+) 3486.92
3489.85
(15/2+) 3502.22
149.9
8
100
110.6
7
3.9
338.6
5
14.7
463.0
4
100.0
513
<3.5
2954.7
<22
245.7
3 [
E2]
100
386
<0.8
272.2
D+Q
28.9
2142.7
8 D
+Q
100.0
2193.9
18.4
3089.9
6 (
D+Q
) 1
00.0
2223.2
3 Q
100
1524.1
28.2
3132.9
6 D
100
394.7
2 (
D+Q
) 1
0.4
1527.1
3 (
Q,D
+Q
) 1
00.0
3152.8
0 D
(+Q
) 1
00
167.1
6 D
6.6
6
413.0
4 D
+Q
100.0
242.7
3
86
314.2
D
100
392.5
6
60
1560.4
9 (
D)
100
352.3
0
100
225.0
5
100
131.4
5
15.0
265.7
4
52.5
455.0
2
100
424.5
100
2414.8
4
100
3310.6
47.6
588.1
100
2465.7
0
100
2481.9
4
44
3378.1
1 (
D)
100
1785.7
(D
) 1
00
2498.7
56.8
270.4
36
806.3
6
49
1797.6
4 D
100
2553.9
9
100
3464.0
9 (
D)
100
313.7
0 D
25
480.8
7 D
100.0
500.1
2 D
100
2593.5
7
100
3489.6
36.2
290.3
8 (
D)
100
208
93Bi126
9/2– 0.0 stable
7/2– 896.29 9.7 ps
13/2+ 1608.58 0.27 ns
1/2+ 2442.86 10 ns
3/2+ 2492.82 ≈31 ps
(9/2)+ 2564.16 0.015 ps
(7/2)+ 2583.07 0.29 ps
11/2+ 2599.90 0.043 ps
13/2+ 2600.92 0.34 ps
5/2+ 2617.31 >2 ps
15/2+ 2741.05 7.1 ps
3/2(+) 2766.61
5/2– 2826.19 0.039 ps
1/2+ 2845.14
896.2
8 M
1+E
2
1001
608.5
3 (
M2+E
3)
100
1546.5
1 E
3
100
49.9
5 (
M1+E
2)
2492.8
6 [
E3]
100
2564.1
4 (
E1+E
3)
100
1686.6
6 D
+Q
100.0
2583.1
(E
1+E
3)
44.1
991
<4.5
2599.9
0 (
E1+E
3)
100.0
992.3
5 (
M1+E
2)
100
2600.9
2 (
M2+E
3)
1.3
124.4
8 D
+Q
5.0
1721.0
8 D
+Q
100.0
2617.3
5 E
3(+
M2)
53.0
140.1
3 M
1(+
E2)
12.7
1132.4
6 D
+Q
67.8
2741.0
3 (
E3)
100.0
149.3
7.2
273.8
0
33.4
323.7
4 D
+Q
100.0
2766.9
≈8
1929.9
5
43
2826.1
0 Q
100.0
78.6
0
18
402.2
7
100
208
93Bi126
Figure 5.18: Simplified level scheme of 209Bi et al. [131]. The gamma productioncross-sections of the transitions drawn with colors were measured in the presentexperiment. The ”red” γ-rays were used to construct the total inelastic cross-section.The excited levels drawn with black were not observed. The two levels very close toeach other at 2600 keV were marked with red (see the text for details). Other fivetransitions from levels above 3.46 MeV were not drawn in this scheme for sake ofsimplicity: 808.0 keV, 2678.8 keV, 2705.42 keV, 2887.3 keV and 2904.5 keV.

108 Results and discussion
0
0.02
0.04
0.06
0 5000 10000 15000 20000
dσ γ
/ dΩ
(ba
rn/s
r)
En (keV)
896.28 KeV 110o
150o
0.8
0.9
1
1.1
1.2
0 2000 4000 6000 8000 10000
W(1
50)/
W(1
10)
En (keV)
896.28 KeV
Figure 5.19: Differential gamma production cross-section for the 896.28 keV tran-sition in 209Bi. Left: Smoothed curves from the threshold up to 20 MeV at twoangles, 110 and 150 degrees. Right: The ratio between the angular distributionW (θ) = 4π
σdσdΩ
(θ) at 150 and 110 degrees.
for some γ-ray transitions at energies above 10 MeV. For very weak transitions thegamma production cross-section were measured only below 10 MeV. In the followingwill be presented the results for the gamma production cross-sections of all observedγ-rays.
896.28 keV
The main transition in 209Bi has a mixed multipolarity of M1+ E2 with a mixingratio equal to −0.70 [131]. The differential gamma production cross-section is shownin Fig. 5.19 for the two angles of measurement, 110o and 150o. No significant angledependence was observed for this transition. The dependence of the ratio betweenthe angular distribution W (θ) at 150o and at 110o is shown in Fig. 5.19 Right.
Fig. 5.20 shows the integral gamma production cross-section of the 896.28 keVtransition. Above 9 MeV neutron energy a γ-ray transition of 895.9 keV from thereaction 209Bi(n,2n)208Bi is produced. The two γ-ray peaks cannot be separatedand the cross-section of the inelastic transition may be overestimated above 9 MeV(see also the (n,2n) cross-sections). The green curve in Fig. 5.20 represents the sumof the gamma production cross-sections calculated with Talys for the two transi-tions, 896.28 keV from 209Bi and 895.9 keV from 208Bi. At energies above 9 MeV(the threshold of the 895.9 keV transition), the present measured data are close tothis sum of the calculated cross-sections (green curve). The calculation performedwith the Talys code with the default parameters describes well the measured databelow 2.5 MeV. In the energy range between 2.5 MeV and 9 MeV the calculationunderestimates significantly the measured gamma production cross-section.
The present results are in good agreement with the data of Lashuk et al. [130]up to about 2.5 MeV (see also Fig. 5.21). Above this energy, the Lashuk et al. dataare slightly lower. The data point of Dickens et al. [161] at 5.4 MeV is about 20 %lower.
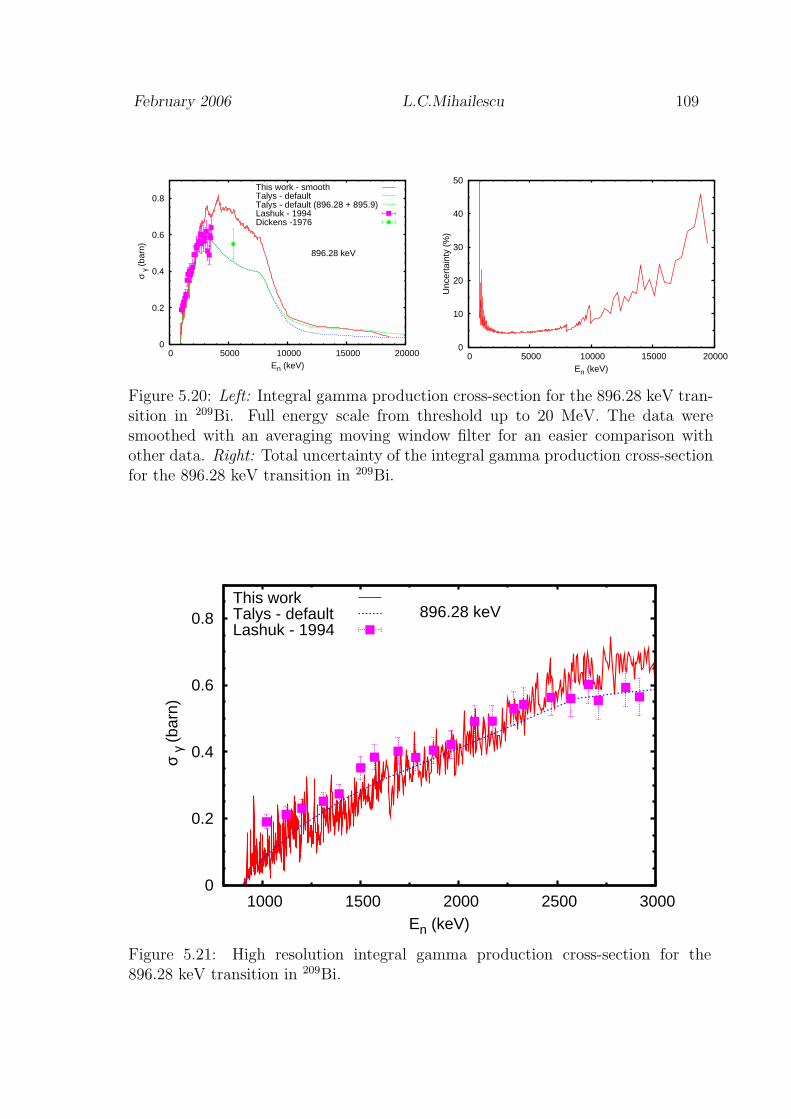
February 2006 L.C.Mihailescu 109
0
0.2
0.4
0.6
0.8
0 5000 10000 15000 20000
σ γ
(bar
n)
En (keV)
896.28 keV
This work - smoothTalys - defaultTalys - default (896.28 + 895.9)Lashuk - 1994Dickens -1976
0
10
20
30
40
50
0 5000 10000 15000 20000
Unc
erta
inty
(%
)
En (keV)
Figure 5.20: Left: Integral gamma production cross-section for the 896.28 keV tran-sition in 209Bi. Full energy scale from threshold up to 20 MeV. The data weresmoothed with an averaging moving window filter for an easier comparison withother data. Right: Total uncertainty of the integral gamma production cross-sectionfor the 896.28 keV transition in 209Bi.
0
0.2
0.4
0.6
0.8
1000 1500 2000 2500 3000
σ γ
(bar
n)
En (keV)
896.28 keVThis workTalys - defaultLashuk - 1994
Figure 5.21: High resolution integral gamma production cross-section for the896.28 keV transition in 209Bi.

110 Results and discussion
0
0.02
0.04
0.06
0.08
0.1
0 5000 10000 15000 20000
dσ γ
/ dΩ
(ba
rn/s
r)
En (keV)
1608.53 KeV110o
150o
1
1.1
1.2
1.3
1.4
1.5
0 2000 4000 6000 8000 10000
W(1
50)/
W(1
10)
En (keV)
1608.53 KeV
Figure 5.22: Differential gamma production cross-section for the 1608.53 keV transi-tion in 209Bi. Left: Smoothed curves from the threshold up to 20 MeV at two angles,110 and 150 degrees. Right: The ratio between the angular distribution W(θ) at150 and 110 degrees.
The gamma production cross-section with the high energy resolution is given inFig. 5.21 for neutron energies up to 3 MeV. Because of the high level density in thecompound nucleus 210Bi, no significant resonance structures were observed in theneutron inelastic cross-section of 209Bi at low energies.
The total uncertainty for the integral gamma production cross-section of themain transition in 209Bi is given in Fig. 5.20 Right. At low energies, because of theslow rise of the cross-section, large uncertainties were obtained. At the extremitiesof the energy range the statistical uncertainty is the major component in the totaluncertainty. Starting from 8 MeV neutron energy, few energy bins were grouped toreduce the statistical uncertainties. This procedure caused the steps in the uncer-tainty plot at 8 MeV and 10 MeV. In this way it was obtained a total uncertaintyof about 5% below 10 MeV and a maximum of 40% at 18 MeV.
1608.53 keV
According to the evaluated level scheme, the second transition in 209Bi, 1608.53 keV,has a mixed multipolarity of M2 + E3 with a mixing ratio δ = 0.33 [131]. In thepresent experiment, significant angle dependence was observed for the differentialgamma production cross-section of this transition (Fig. 5.22). The energy depen-dence of the ratio between the angular distributions W (θ) at 150o and at 110o isshown in Fig. 5.22 Right.
The integral gamma production cross-section of the 1608.53 keV transition com-pared with existing experimental data is given in Fig. 5.23. The measurement ofSherrer et al. [123] at 3.2 MeV is in good agreement with the present results. Below3.0 MeV the data of Lashuk et al. [130] are slightly above the present results. Withthe increase of the neutron energy they become lower than the present data. Noexperimental data were found in the literature for energies higher than 5.4 MeV.
In general, for the 1608.53 keV transition the Talys calculation with the default
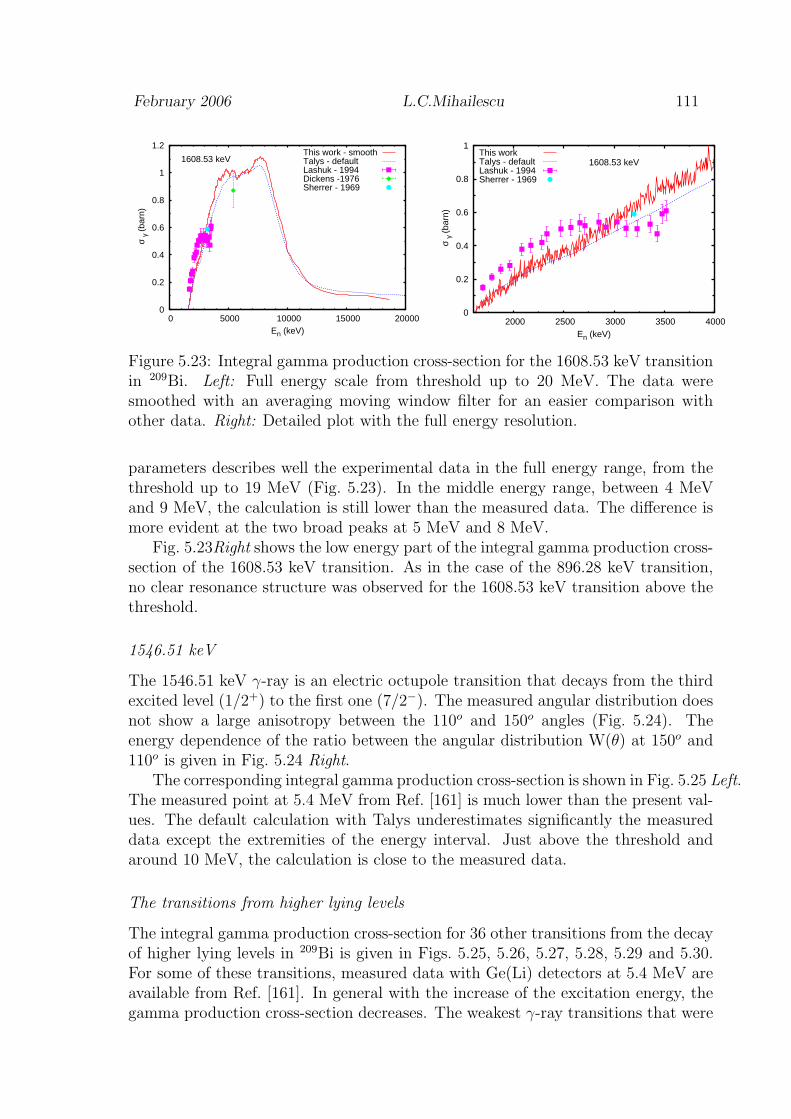
February 2006 L.C.Mihailescu 111
0
0.2
0.4
0.6
0.8
1
1.2
0 5000 10000 15000 20000
σ γ
(bar
n)
En (keV)
1608.53 keVThis work - smoothTalys - defaultLashuk - 1994Dickens -1976Sherrer - 1969
0
0.2
0.4
0.6
0.8
1
2000 2500 3000 3500 4000
σ γ
(bar
n)
En (keV)
1608.53 keVThis workTalys - defaultLashuk - 1994Sherrer - 1969
Figure 5.23: Integral gamma production cross-section for the 1608.53 keV transitionin 209Bi. Left: Full energy scale from threshold up to 20 MeV. The data weresmoothed with an averaging moving window filter for an easier comparison withother data. Right: Detailed plot with the full energy resolution.
parameters describes well the experimental data in the full energy range, from thethreshold up to 19 MeV (Fig. 5.23). In the middle energy range, between 4 MeVand 9 MeV, the calculation is still lower than the measured data. The difference ismore evident at the two broad peaks at 5 MeV and 8 MeV.
Fig. 5.23Right shows the low energy part of the integral gamma production cross-section of the 1608.53 keV transition. As in the case of the 896.28 keV transition,no clear resonance structure was observed for the 1608.53 keV transition above thethreshold.
1546.51 keV
The 1546.51 keV γ-ray is an electric octupole transition that decays from the thirdexcited level (1/2+) to the first one (7/2−). The measured angular distribution doesnot show a large anisotropy between the 110o and 150o angles (Fig. 5.24). Theenergy dependence of the ratio between the angular distribution W(θ) at 150o and110o is given in Fig. 5.24 Right.
The corresponding integral gamma production cross-section is shown in Fig. 5.25 Left.The measured point at 5.4 MeV from Ref. [161] is much lower than the present val-ues. The default calculation with Talys underestimates significantly the measureddata except the extremities of the energy interval. Just above the threshold andaround 10 MeV, the calculation is close to the measured data.
The transitions from higher lying levels
The integral gamma production cross-section for 36 other transitions from the decayof higher lying levels in 209Bi is given in Figs. 5.25, 5.26, 5.27, 5.28, 5.29 and 5.30.For some of these transitions, measured data with Ge(Li) detectors at 5.4 MeV areavailable from Ref. [161]. In general with the increase of the excitation energy, thegamma production cross-section decreases. The weakest γ-ray transitions that were
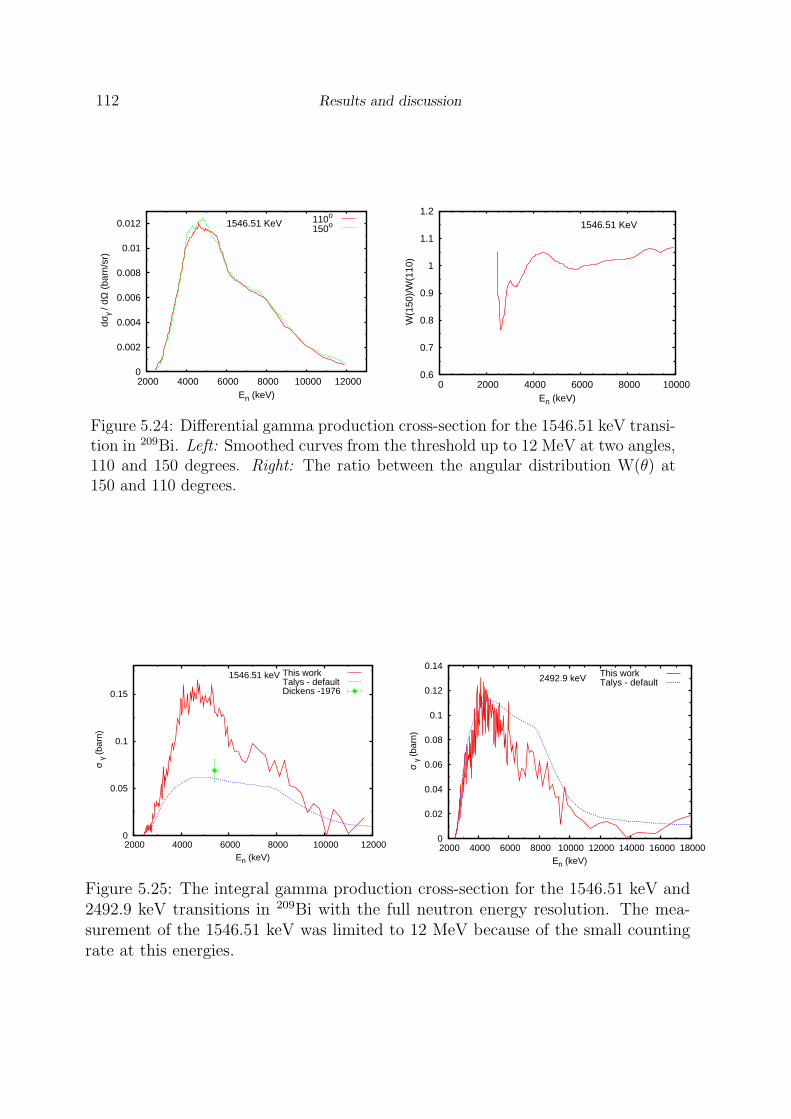
112 Results and discussion
0
0.002
0.004
0.006
0.008
0.01
0.012
2000 4000 6000 8000 10000 12000
dσ γ
/ dΩ
(ba
rn/s
r)
En (keV)
1546.51 KeV 110o
150o
0.6
0.7
0.8
0.9
1
1.1
1.2
0 2000 4000 6000 8000 10000
W(1
50)/
W(1
10)
En (keV)
1546.51 KeV
Figure 5.24: Differential gamma production cross-section for the 1546.51 keV transi-tion in 209Bi. Left: Smoothed curves from the threshold up to 12 MeV at two angles,110 and 150 degrees. Right: The ratio between the angular distribution W(θ) at150 and 110 degrees.
0
0.05
0.1
0.15
2000 4000 6000 8000 10000 12000
σ γ
(bar
n)
En (keV)
1546.51 keV This workTalys - defaultDickens -1976
0
0.02
0.04
0.06
0.08
0.1
0.12
0.14
2000 4000 6000 8000 10000 12000 14000 16000 18000
σ γ
(bar
n)
En (keV)
2492.9 keV This workTalys - default
Figure 5.25: The integral gamma production cross-section for the 1546.51 keV and2492.9 keV transitions in 209Bi with the full neutron energy resolution. The mea-surement of the 1546.51 keV was limited to 12 MeV because of the small countingrate at this energies.
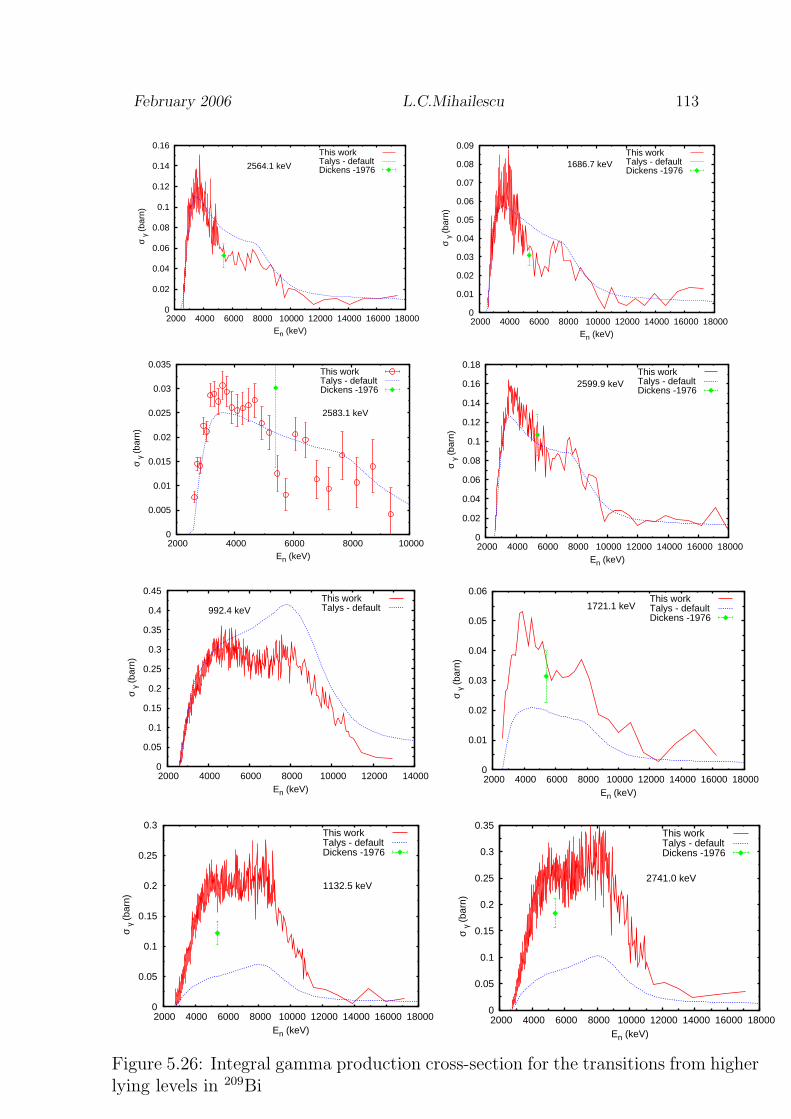
February 2006 L.C.Mihailescu 113
0
0.02
0.04
0.06
0.08
0.1
0.12
0.14
0.16
2000 4000 6000 8000 10000 12000 14000 16000 18000
σ γ
(bar
n)
En (keV)
2564.1 keV
This workTalys - defaultDickens -1976
0
0.01
0.02
0.03
0.04
0.05
0.06
0.07
0.08
0.09
2000 4000 6000 8000 10000 12000 14000 16000 18000
σ γ
(bar
n)
En (keV)
1686.7 keVThis workTalys - defaultDickens -1976
0
0.005
0.01
0.015
0.02
0.025
0.03
0.035
2000 4000 6000 8000 10000
σ γ
(bar
n)
En (keV)
2583.1 keV
This workTalys - defaultDickens -1976
0
0.02
0.04
0.06
0.08
0.1
0.12
0.14
0.16
0.18
2000 4000 6000 8000 10000 12000 14000 16000 18000
σ γ
(bar
n)
En (keV)
2599.9 keVThis workTalys - defaultDickens -1976
0
0.05
0.1
0.15
0.2
0.25
0.3
0.35
0.4
0.45
2000 4000 6000 8000 10000 12000 14000
σ γ
(bar
n)
En (keV)
992.4 keVThis workTalys - default
0
0.01
0.02
0.03
0.04
0.05
0.06
2000 4000 6000 8000 10000 12000 14000 16000 18000
σ γ
(bar
n)
En (keV)
1721.1 keVThis workTalys - defaultDickens -1976
0
0.05
0.1
0.15
0.2
0.25
0.3
2000 4000 6000 8000 10000 12000 14000 16000 18000
σ γ
(bar
n)
En (keV)
1132.5 keV
This workTalys - defaultDickens -1976
0
0.05
0.1
0.15
0.2
0.25
0.3
0.35
2000 4000 6000 8000 10000 12000 14000 16000 18000
σ γ
(bar
n)
En (keV)
2741.0 keV
This workTalys - defaultDickens -1976
Figure 5.26: Integral gamma production cross-section for the transitions from higherlying levels in 209Bi

114 Results and discussion
0
0.02
0.04
0.06
2000 4000 6000 8000 10000 12000
σ γ
(bar
n)
En (keV)
323.7 keV
This workTalys - default
0
0.005
0.01
0.015
0.02
0.025
2000 4000 6000 8000 10000
σ γ
(bar
n)
En (keV)
1930.0 keV
This workTalys - default
0
0.01
0.02
0.03
0.04
0.05
2000 4000 6000 8000 10000
σ γ
(bar
n)
En (keV)
2826.1 keV
This workTalys - defaultDickens -1976
0
0.01
0.02
0.03
0.04
2000 4000 6000 8000 10000
σ γ
(bar
n)
En (keV)
402.3 keV
This workTalys - default
0
0.005
0.01
0.015
0.02
0.025
0.03
2000 4000 6000 8000 10000 12000
σ γ
(bar
n)
En (keV)
463.0 keVThis workTalys - default
0
0.1
0.2
0.3
0.4
2000 4000 6000 8000 10000 12000
σ γ
(bar
n)
En (keV)
245.7 keVThis workTalys - default
0
0.005
0.01
0.015
0.02
0.025
0.03
2000 4000 6000 8000 10000
σ γ
(bar
n)
En (keV)
2142.8 keV
This workTalys - defaultDickens -1976
0
0.01
0.02
0.03
0.04
0.05
0.06
2000 4000 6000 8000 10000 12000 14000 16000 18000
σ γ
(bar
n)
En (keV)
3089.9 keVThis workTalys - defaultDickens -1976
Figure 5.27: Integral gamma production cross-section for the transitions from higherlying levels in 209Bi

February 2006 L.C.Mihailescu 115
0
0.005
0.01
0.015
0.02
0.025
0.03
2000 4000 6000 8000 10000
σ γ
(bar
n)
En (keV)
2223.2 keVThis workTalys - default
0
0.01
0.02
0.03
0.04
0.05
0.06
0.07
0.08
0.09
2000 4000 6000 8000 10000 12000 14000 16000 18000
σ γ
(bar
n)
En (keV)
3132.9 keVThis workTalys - defaultDickens -1976
0
0.01
0.02
0.03
2000 4000 6000 8000 10000 12000
σ γ
(bar
n)
En (keV)
394.7 keVThis work
0
0.02
0.04
0.06
0.08
0.1
0.12
0.14
0.16
0.18
2000 4000 6000 8000 10000 12000 14000
σ γ
(bar
n)
En (keV)
1527.1 keV
This work
0
0.01
0.02
0.03
0.04
0.05
0.06
0.07
2000 4000 6000 8000 10000 12000 14000 16000 18000
σ γ
(bar
n)
En (keV)
3152.8 keV
This work
0
0.02
0.04
0.06
0.08
0.1
0.12
2000 4000 6000 8000 10000 12000 14000 16000 18000
σ γ
(bar
n)
En (keV)
413.0 keVThis work
0
0.02
0.04
0.06
0.08
0.1
2000 4000 6000 8000 10000 12000 14000 16000 18000
σ γ
(bar
n)
En (keV)
1560.5 keVThis work
0
0.005
0.01
0.015
0.02
0.025
0.03
2000 4000 6000 8000 10000
σ γ
(bar
n)
En (keV)
424.5 keVThis work
Figure 5.28: Integral gamma production cross-section for the transitions from higherlying levels in 209Bi
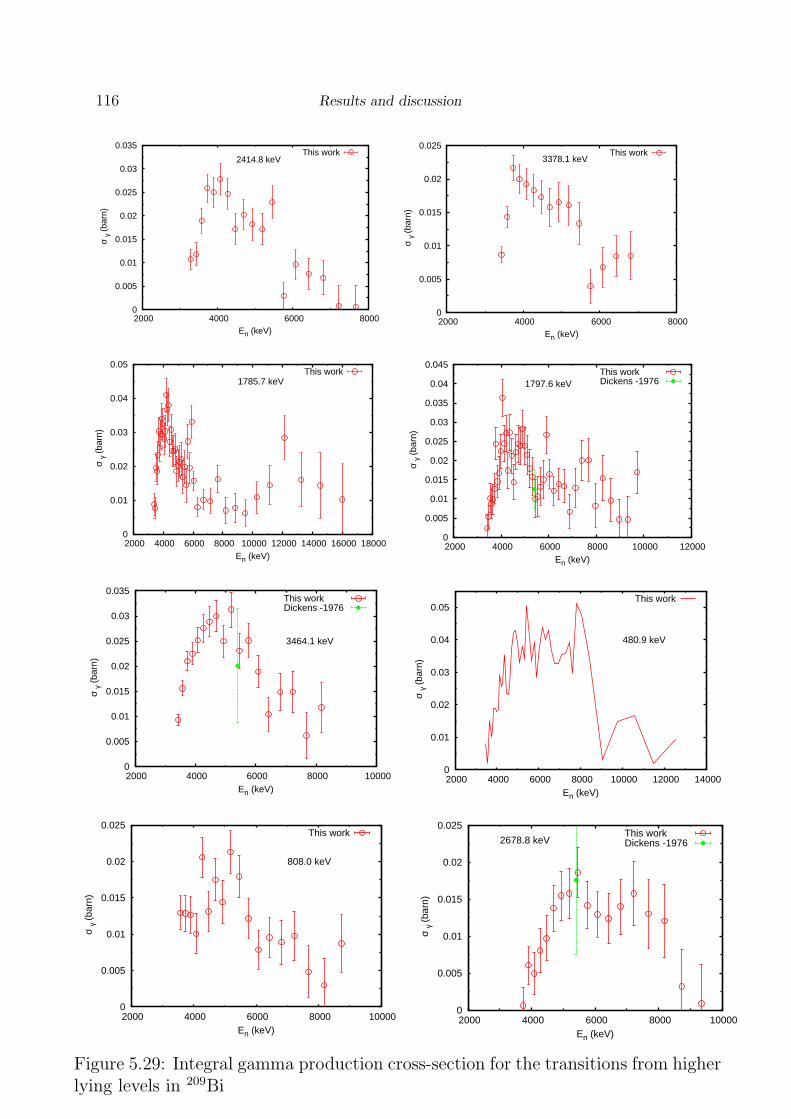
116 Results and discussion
0
0.005
0.01
0.015
0.02
0.025
0.03
0.035
2000 4000 6000 8000
σ γ
(bar
n)
En (keV)
2414.8 keVThis work
0
0.005
0.01
0.015
0.02
0.025
2000 4000 6000 8000
σ γ
(bar
n)
En (keV)
3378.1 keVThis work
0
0.01
0.02
0.03
0.04
0.05
2000 4000 6000 8000 10000 12000 14000 16000 18000
σ γ
(bar
n)
En (keV)
1785.7 keVThis work
0
0.005
0.01
0.015
0.02
0.025
0.03
0.035
0.04
0.045
2000 4000 6000 8000 10000 12000
σ γ
(bar
n)
En (keV)
1797.6 keVThis workDickens -1976
0
0.005
0.01
0.015
0.02
0.025
0.03
0.035
2000 4000 6000 8000 10000
σ γ
(bar
n)
En (keV)
3464.1 keV
This workDickens -1976
0
0.01
0.02
0.03
0.04
0.05
2000 4000 6000 8000 10000 12000 14000
σ γ
(bar
n)
En (keV)
480.9 keV
This work
0
0.005
0.01
0.015
0.02
0.025
2000 4000 6000 8000 10000
σ γ
(bar
n)
En (keV)
808.0 keV
This work
0
0.005
0.01
0.015
0.02
0.025
2000 4000 6000 8000 10000
σ γ
(bar
n)
En (keV)
2678.8 keVThis workDickens -1976
Figure 5.29: Integral gamma production cross-section for the transitions from higherlying levels in 209Bi
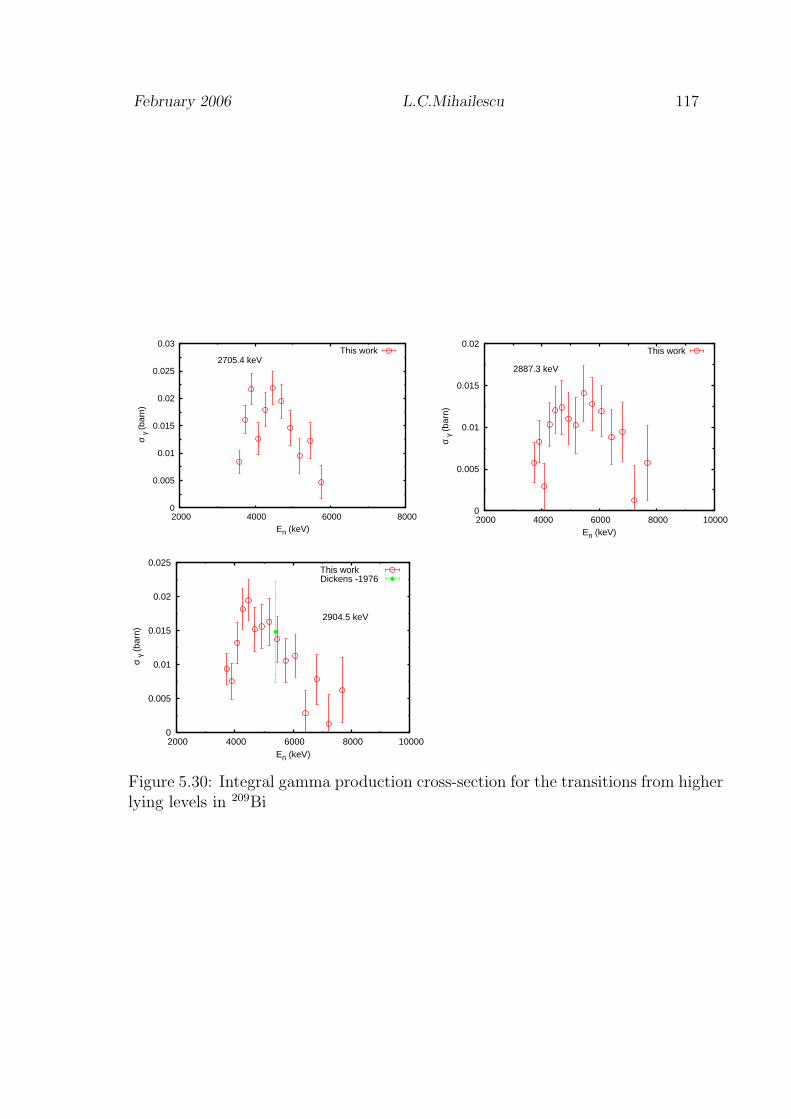
February 2006 L.C.Mihailescu 117
0
0.005
0.01
0.015
0.02
0.025
0.03
2000 4000 6000 8000
σ γ
(bar
n)
En (keV)
2705.4 keVThis work
0
0.005
0.01
0.015
0.02
2000 4000 6000 8000 10000
σ γ
(bar
n)
En (keV)
2887.3 keV
This work
0
0.005
0.01
0.015
0.02
0.025
2000 4000 6000 8000 10000
σ γ
(bar
n)
En (keV)
2904.5 keV
This workDickens -1976
Figure 5.30: Integral gamma production cross-section for the transitions from higherlying levels in 209Bi
118 Results and discussion
observed have energies of 1930.95 keV and 2887.3 keV. These γ-rays have a maximumcross-section of about 15 mb around 4 MeV. Low neutron energy resolution was usedin order to achieve a total uncertainty of about 30%. Because of their small cross-sections these transitions were measured only up to 8 MeV. For these transitionspoint-like data were used in the graphs. The most intense transitions from the higherlying levels have the energies of 992.4 keV and 2741.0 keV. In the maximum, thesetransitions reach a cross-section of about 300 mb, almost a factor three less thanthe cross-section of the 1608.53 keV transition.
In the present measurement some difficulties arose for the transitions from thevery close lying levels at 2599.90 keV and at 2600.92 keV (see Fig. 5.18). The level at2599.90 keV decays through a γ-ray of 2599.90 keV to the ground state and througha 991 keV γ-ray to the level at 1608.58 keV. From the evaluated level scheme, theintensity of the 991 keV transition is smaller than 4.5% from the intensity of the2599.90 keV transition. The level at 2600.92 keV decays through the transitionsof 992.35 keV and 2600.92 keV. The latter one is only 1.3% from the intensity ofthe 992.35 keV transition. Because of the small branching ratios of the 991 keVand 2600.92 keV transitions, it was assumed that in the present measurement theobserved peaks in the γ-ray spectra are due to the transitions at 992.35 keV andrespectively 2599.90 keV. In conclusion, the gamma-production cross-sections givenin Fig. 5.26 for the 992.35 keV and 2599.90 keV transitions contain negligible con-tributions from the 2600.92 keV and respectively the 991 keV transitions.
Gamma production cross-sections calculated with the Talys code were availablefor the transitions that decay from levels up to 3.13 MeV excitation energy. Ingeneral, the Talys calculation provides good description of the experimental dataat low energies, below about 4 MeV. This general good agreement for the gammaproduction cross-section at low energies is reflected in a reasonable description ofthe level cross-section (see below).
On the full energy range, the Talys calculation with the default parameters de-scribes reasonable the measured data for transitions as 2492.9 keV, 2564.1 keV,1686.7 keV, 2583.1 keV, 2599.9 keV, 2826.1 keV, 1929.95 keV and 2223.2 keV. Inthe case of the 992.4 keV transitions, Talys calculations overestimate the experi-mental data above 5 MeV. For the other transitions the Talys calculation predictssignificantly lower cross-sections. It should be noted that for the transition fromthe level at 2741 keV (1132.5 keV and 2741 keV) the calculation is lower than themeasured data even just above the threshold (see Fig. 5.26).
Where available, the measured points of Dickens et al. [161] at 5.4 MeV agreegenerally well with the present data. For the 1132.5 keV and 2741 keV transitions(Fig. 5.26) the Dickens et al. data are lower than the present values.
Branching ratios
In the case of 5 excited levels of 209Bi, two γ-rays from the decay of each levelwere observed (Table. 5.1). These allowed the determination of the correspondingbranching ratios of the levels. For every level, the branching ratios were determinedfrom the integral cross-sections of the two transitions over the full neutron energy

February 2006 L.C.Mihailescu 119
Table 5.1: Branching ratios for levels in 209Bi nucleus and the correspondingabsolute uncertainties. The present results are compared with the values from theevaluated level scheme.
Elevel(keV) Eγ Present results ENSDFIntensity Uncertainty Intensity Uncertainty
2583.07 1686.66 100 - 100.0 1.32583.1 46.8 1.8 44.1 1.3
2741.05 1132.46 77.1 3.5 67.8 0.62741.03 100 - 100.0 0.6
2826.19 1929.95 37.1 1.9 43 52826.10 100 - 100.0 1.2
3135.77 394.72 17.5 2.3 10.4 0.41527.13 100 - 100 2.1
3575.00 808.0 100 - 100 402678.8 112.7 7.2 58 4
interval. Integrating over a large neutron energy interval the statistical uncertaintywas reduced. For additional check, the branching ratio as a function of the neutronenergy was found to be constant within the statistical fluctuations. The observedthreshold for every of these transitions was the same as the calculated one. Theserepresent additional support in the γ-ray identification.
The new values of the branching ratios were compared in Table 5.1 with thevalues from the evaluated level scheme et al. [131]. Within the uncertainties thebranching ratios for the levels at 2583.07 keV and 2826.19 keV agree with the eval-uated values from Ref. [131] (see Table 5.1). Higher intensities were found for theγ-rays of 394.72 keV, 1132.46 keV and 2678.8 keV. Moreover, the intensity of the2678.8 keV transition was found to be higher than the intensity of the 808.0 keV.
Using the new value for the branching ratio 1132.46 keV transition in the Talyscalculation would not improve significantly the agreement between the calculationand the measurement (Fig. 5.26). As mentioned in the section above, the calculationunderestimates the measurements with about a factor 4 in the middle energy range,while the new value of the branching ratio is higher only with about a factor 0.14.
(n,2n) gamma production cross-sections
For an easier identification of the gamma rays from the (n,2n) reaction channel on208Bi, the amplitude spectrum of the HPGe detectors was constructed integratingthe neutron energies from 7.4 MeV up to 25 MeV (Fig. 5.32); the (n,2n) thresholdis 7.495 MeV. The main γ-ray peaks from the 209Bi(n,2n)208Bi reaction are clearlyvisible. The γ-rays that decay from the first and second excited levels were notobserved in this experiment (Fig. 5.31). The 63.5 keV transition from the firstexcited level in 208Bi to the ground state has a very low energy, below the physicalthresholds in the electronic setup. This transition is also internally converted (α =
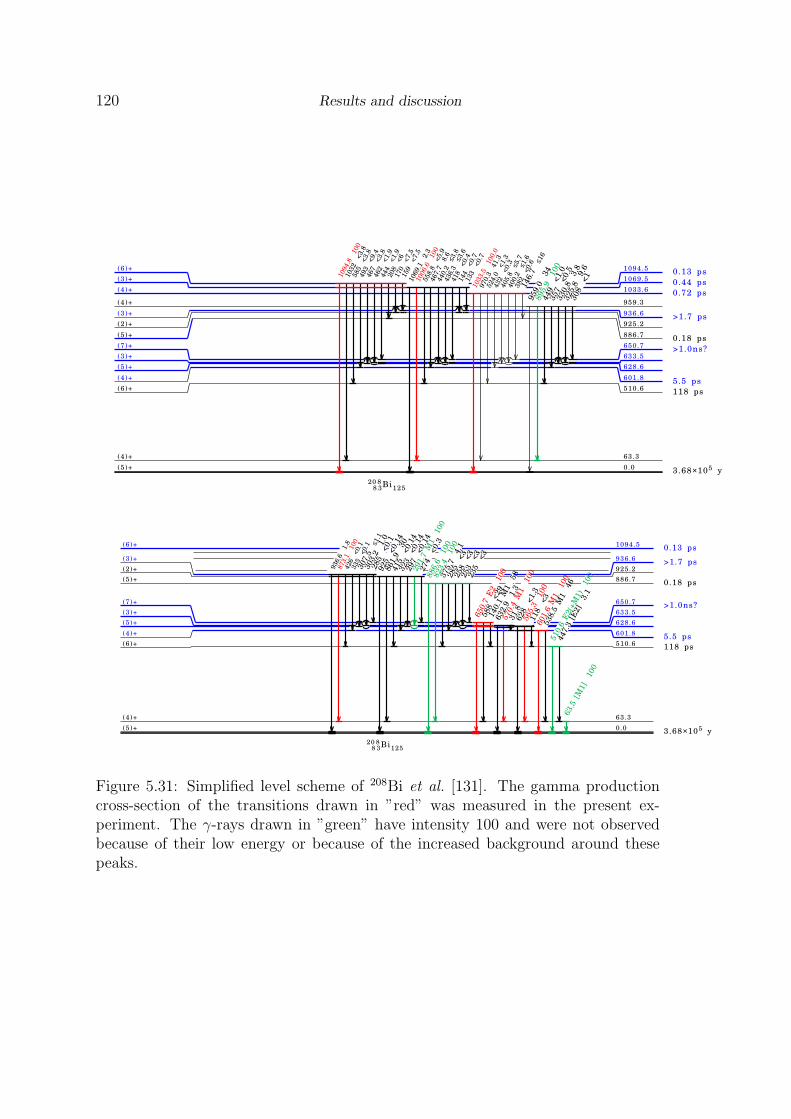
120 Results and discussion
(5)+ 0.0 3.68×10⁵ y
(4)+ 63.3
(6)+ 510.6 118 ps
(4)+ 601.8 5.5 ps
(5)+ 628.6
(3)+ 633.5
(7)+ 650.7 >1.0ns?
(5)+ 886.7 0.18 ps
(2)+ 925.2
(3)+ 936.6 >1.7 ps
(4)+ 959.3
(4)+ 1033.6 0.72 ps
(3)+ 1069.5 0.44 ps
(6)+ 1094.5 0.13 ps
308
<1
325.8
9.6
330.8
3.8
357
<0.5
449
<1.0
895.9
100
959.0
34
146.7
≤1
6
382
<0.6
400.2
≤1
.6
405.8
≤5
.7
432
<0.3
524.0
<1.3
970.3
41.3
1033.5
100.0
133
<0.7
144
<0.7
418
<0.4
436.3
≤3
.6
440.2
≤3
.8
467.7
8.6
558.8
<5.9
1006.6
100
1069.1
2.3
159
<7.5
170
<7.5
208
<6
444
<1.9
462
<1.9
467
<3.8
493
<9.4
585
<3.8
1032
<3.8
1094.8
100
208
83Bi125
(5)+ 0.0 3.68×10⁵ y
(4)+ 63.3
(6)+ 510.6 118 ps
(4)+ 601.8 5.5 ps
(5)+ 628.6
(3)+ 633.5
(7)+ 650.7 >1.0ns?
(5)+ 886.7 0.18 ps
(2)+ 925.2
(3)+ 936.6 >1.7 ps
(6)+ 1094.5 0.13 ps
63.5
[M
1]
100
447.3
[E
2]
3.1
510.6
E2(+
M1)
100
538.5
M1
46
601.6
M1
100
118
<3
565.3
100
628
<1.3
31.8
570.4
M1
100
632.9
1.3
140.1
M1
58
588
<29
650.7
E2
100
235
<3
253
<3
258
<3
285
<3
375.7
4.1
823.4
100
886.6
100
274
<0.3
291.7
M1
100
297
<0.1
4
323
<0.1
4
415
<0.1
4
861.9
30
925
<0.1
4
285
<0.1
303.2
1.0
307.5
≤1
.1
335
<0.1
426
<0.1
873.1
100
936.6
1.8
208
83Bi125
Figure 5.31: Simplified level scheme of 208Bi et al. [131]. The gamma productioncross-section of the transitions drawn in ”red” was measured in the present ex-periment. The γ-rays drawn in ”green” have intensity 100 and were not observedbecause of their low energy or because of the increased background around thesepeaks.

February 2006 L.C.Mihailescu 121
200
400
600
800
500 600 700 800 900 1000 1100
Cou
nts
Eγ (keV)
<--
- 56
5 ke
V
<-- 6
01 ke
V
<-- 6
50 ke
V
<--
873
keV
<--
100
6 ke
V<
-- 1
033
keV
<--
109
4 ke
V
<--
- 57
0 ke
V
Figure 5.32: The (n,2n) γ-ray spectrum of an HPGe detector with the 209Bi sam-ple. The spectrum was integrated over the neutron energies from 7.4 MeV (justbelow the (n,2n) threshold) up to about 25 MeV. The main γ-ray peaks from the209Bi(n,2n)208Bi reaction are clearly visible.
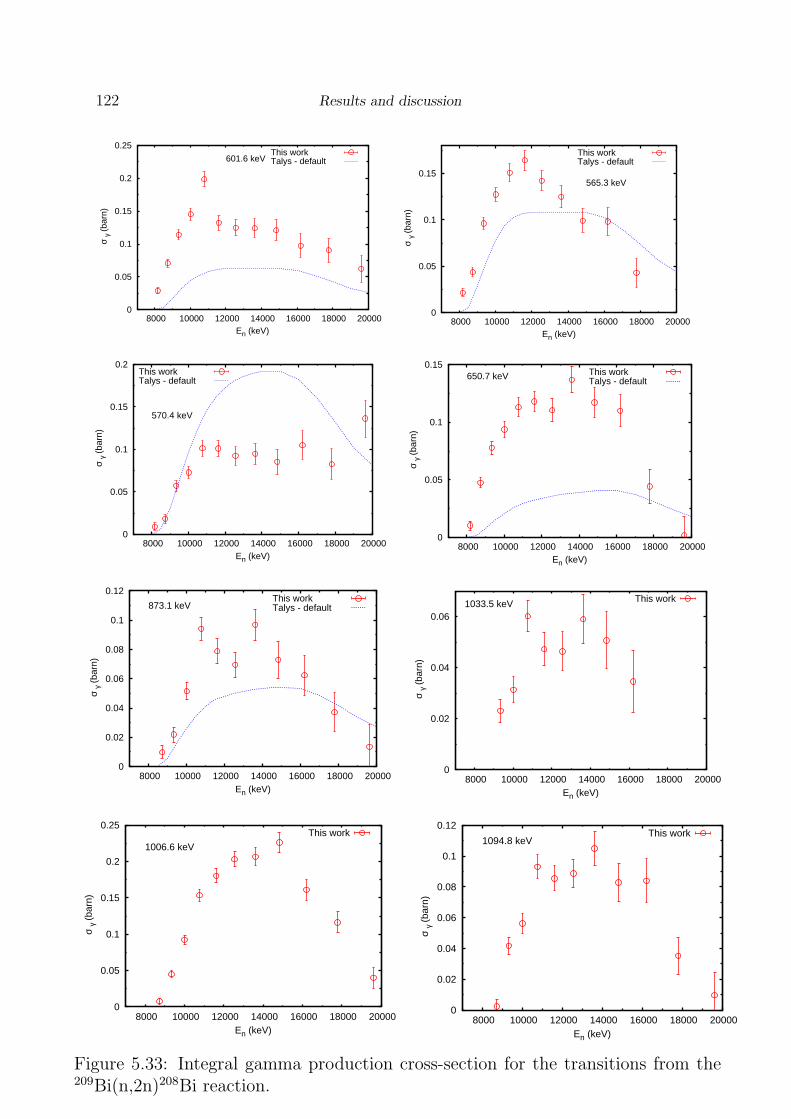
122 Results and discussion
0
0.05
0.1
0.15
0.2
0.25
8000 10000 12000 14000 16000 18000 20000
σ γ
(bar
n)
En (keV)
601.6 keVThis workTalys - default
0
0.05
0.1
0.15
8000 10000 12000 14000 16000 18000 20000
σ γ
(bar
n)
En (keV)
565.3 keV
This workTalys - default
0
0.05
0.1
0.15
0.2
8000 10000 12000 14000 16000 18000 20000
σ γ
(bar
n)
En (keV)
570.4 keV
This workTalys - default
0
0.05
0.1
0.15
8000 10000 12000 14000 16000 18000 20000
σ γ
(bar
n)
En (keV)
650.7 keV This workTalys - default
0
0.02
0.04
0.06
0.08
0.1
0.12
8000 10000 12000 14000 16000 18000 20000
σ γ
(bar
n)
En (keV)
873.1 keVThis workTalys - default
0
0.02
0.04
0.06
8000 10000 12000 14000 16000 18000 20000
σ γ
(bar
n)
En (keV)
1033.5 keV This work
0
0.05
0.1
0.15
0.2
0.25
8000 10000 12000 14000 16000 18000 20000
σ γ
(bar
n)
En (keV)
1006.6 keV
This work
0
0.02
0.04
0.06
0.08
0.1
0.12
8000 10000 12000 14000 16000 18000 20000
σ γ
(bar
n)
En (keV)
1094.8 keVThis work
Figure 5.33: Integral gamma production cross-section for the transitions from the209Bi(n,2n)208Bi reaction.

February 2006 L.C.Mihailescu 123
0
0.5
1
1.5
2
2.5
3
0 5000 10000 15000 20000
σ (
barn
)
En (keV)
This work - smoothTalys - defaultLashuk - 1994Simakov - 1992Shi Xia-Min - 1992Prokopets - 1980Joensson - 1969Owens - 1968Thomson - 1963Rosen - 1957JEFF 3.1ENDF-BVI
0
5
10
15
20
25
30
0 5000 10000 15000 20000
Unc
erta
inty
(%
)
En (keV)
Figure 5.34: Left: Smooth curve for the total inelastic gamma production cross-section of 209Bi from the threshold up to 20 MeV. Right: The corresponding totaluncertainty.
7.52 Ref. [131]). The second excited level decays through a 510.6 keV γ-ray thatcannot be distinguished from the 511 keV transition of the background.
Starting from the third excited level, the gamma production cross-section of 8γ-rays from the 209Bi(n,2n)208Bi reaction were measured for the first time, from thethreshold up to 20 MeV. The measured cross-sections are given in Fig. 5.33. Aneutron energy resolution of 0.55 MeV at 9 MeV up to 1.8 MeV at 20 MeV wasused.
The transition of 895.9 keV from the decay of the level at 959.3 keV was not iden-tified in the spectrum because it has the same energy as the main transition in theinelastic channel. From the cross-sections of the neighboring transitions 873.1 keVand 1033.5 keV and the Talys calculation it can be estimated that the 895.9 keVtransition has a maximum cross-section of about 35 mb at 12 MeV. This may pro-duce an overestimation of the measured gamma production cross-sections of the896.28 keV transition from the inelastic channel with about 50% around 15 MeV(Fig. 5.20). The 209Bi(n,2n)208Bi gamma production cross-section presented herewere not corrected for the neutron attenuation and multiple scattering. For the(n,2n) cross-sections the multiple scattering is expected to be negligible and theattenuation correction with the 209Bi sample is of the order of 1.5 %-2 %.
From Fig. 5.33, the agreement of the default calculation of the Talys code withthe experimental data is very poor. Differences of a factor 3 can be observed betweenthe calculation and the experimental data.
5.2.3 Total inelastic and level cross-section
Total neutron inelastic cross-section
The total inelastic cross-section (Fig. 5.34) was constructed based on the eval-uated level scheme of 209Bi using the integral gamma production cross-sections.The following transitions were used for the total inelastic cross-section (see alsoFig. 5.18): 896.28 keV, 1608.53 keV, 2492.9 keV, 2564.1 keV, 1686.7 keV, 2599.9 keV,
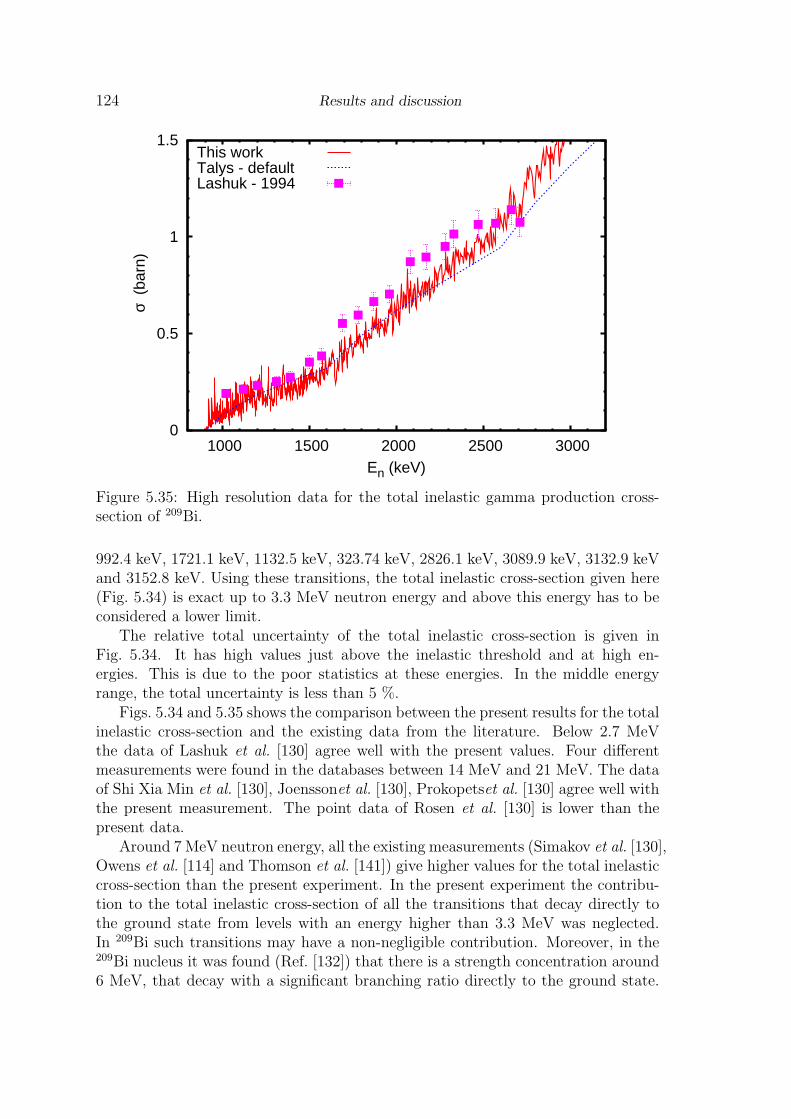
124 Results and discussion
0
0.5
1
1.5
1000 1500 2000 2500 3000
σ (
barn
)
En (keV)
This workTalys - defaultLashuk - 1994
Figure 5.35: High resolution data for the total inelastic gamma production cross-section of 209Bi.
992.4 keV, 1721.1 keV, 1132.5 keV, 323.74 keV, 2826.1 keV, 3089.9 keV, 3132.9 keVand 3152.8 keV. Using these transitions, the total inelastic cross-section given here(Fig. 5.34) is exact up to 3.3 MeV neutron energy and above this energy has to beconsidered a lower limit.
The relative total uncertainty of the total inelastic cross-section is given inFig. 5.34. It has high values just above the inelastic threshold and at high en-ergies. This is due to the poor statistics at these energies. In the middle energyrange, the total uncertainty is less than 5 %.
Figs. 5.34 and 5.35 shows the comparison between the present results for the totalinelastic cross-section and the existing data from the literature. Below 2.7 MeVthe data of Lashuk et al. [130] agree well with the present values. Four differentmeasurements were found in the databases between 14 MeV and 21 MeV. The dataof Shi Xia Min et al. [130], Joenssonet al. [130], Prokopetset al. [130] agree well withthe present measurement. The point data of Rosen et al. [130] is lower than thepresent data.
Around 7 MeV neutron energy, all the existing measurements (Simakov et al. [130],Owens et al. [114] and Thomson et al. [141]) give higher values for the total inelasticcross-section than the present experiment. In the present experiment the contribu-tion to the total inelastic cross-section of all the transitions that decay directly tothe ground state from levels with an energy higher than 3.3 MeV was neglected.In 209Bi such transitions may have a non-negligible contribution. Moreover, in the209Bi nucleus it was found (Ref. [132]) that there is a strength concentration around6 MeV, that decay with a significant branching ratio directly to the ground state.

February 2006 L.C.Mihailescu 125
0
0.2
0.4
0.6
1000 1500 2000 2500 3000 3500 4000
σ (
barn
)
En (keV)
896.28 keV
This work - smoothTalys - defaultLashuk - 1994Guenther - 1980Schweitzer - 1978Korzh - 1977Smith - 1970Degtjarev - 1967Kiehn - 1954
0
5
10
15
20
25
30
1000 1500 2000 2500 3000 3500
Unc
erta
inty
(%
)
En (keV)
Figure 5.36: Left: Cross-section of 896.29 keV excited level in 209Bi.Right: Thecorresponding total uncertainty.
Such transitions, that were not observed in the present experiment, may increase thepresent total inelastic cross-section around 6 MeV. All the existing measurementsaround 7 MeV used the (n,n’)-technique, that is not sensitive to the missed γ-raytransitions.
The Talys calculation describes well the total inelastic cross-section at energiesbelow 3 MeV and at energies above 7 MeV. Between 3 MeV and 5 MeV the Talyscalculation underestimates the present data. This is in contradiction with the factthat the present data for the total inelastic cross-section are a lower limit above3.3 MeV. Between 5 MeV and 7 MeV the Talys calculation is higher than thepresent measurements and is in a better agreement with the Simakov et al. [130]results.
The evaluated total inelastic cross-sections from ENDF/B-VI and JEFF 3.1 areshown in Fig. 5.34. The JEFF 3.1 evaluation coincides with the default Talys cal-culation. The ENDF/B-VI evaluation differs from the JEFF 3.1 evaluation for theenergies between about 4 MeV and 8 MeV. In this region, the ENDF/B-VI evalua-tion is lower.
Level 896.29 keV
The following γ-rays were used to construct the cross-section of the level at 896.29 keV:896.28 keV, 1546.51 keV, 1686.7 keV, 1721.1 keV, 1929.95 keV, 2142.8 keV, 3089.9 keVand 1785.7 keV. The obtained results are shown in Fig. 5.36. This cross-section isexact up to 3.1 MeV neutron energy. In the energy region 3.1 MeV and 3.5 MeVthe cross-section presented here is an upper limit to the exact value. This limit isa very good approximation to the exact value because only 2 very weak transitionswere neglected. The total uncertainty for the 896 keV level cross-section is givenin Fig. 5.36 Right and ranges between 15% just above the inelastic threshold andabout 7% at 3.5 MeV.
Below 2.5 MeV, the present results for the cross-section of the level at 896.28 keVare between the scattered values given by different experiments found in the liter-
126 Results and discussion
ature (Fig. 5.36). Above 2.5 MeV the present results are higher than the valuesgiven by Guenther et al. [108] experiment. The Guenther et al. experiment used the(n,n’)-technique and its data were normalized to the H(n,n) standard cross-section.The level cross-section were the primary measured quantities in the Guenther etal. experiment. Still, the difference between the two data sets is too large to beexplained by the fact that above 3.1 MeV the present data are an upper limit forthe level cross-section. Anyway, the existing data around 3.5 MeV (Lashuk et al.,Schweitzeret al. and Guenther et al.) are very scattered.
The default Talys calculation describes well the present data up to about 2.5 MeV.Above this energy, the calculation follows the Guenther et al. [108] data. TheJEFF 3.1 evaluated level cross-section is not plotted in Fig. 5.36 because it coincideswith the default Talys calculation.
Levels with higher excitation energy
The cross-sections of the other excited levels up to 3.16 MeV excitation energy areshown in Figs. 5.37 and 5.38. Except for the second excited level, at 1608.5 keV,no experimental cross-sections were found for the other levels. In the case of the1608.5 keV level, the data presented here, Fig. 5.37, are exact up to 3.5 MeV. Allthe transitions that feed the 1608.5 keV up to an excitation energy of 3.4 MeV wereused to construct the level cross-section of this level.
For the level at 1608.5 keV, the data of Lashuk et al. [130] and Kiehn et al. [145]are higher than the present results. Contrary, the data of Guenther et al. [108] above2.3 MeV are slightly lower than the present data as in the case of the 896.28 keVlevel. The Talys calculation follows the Guenther et al. data above 2.3 MeV.
For the other excited level given in Figs. 5.37 and 5.38, the Talys calculationwas available for excitation energies up to 3132 keV. Where available, the Talyscalculation with the default parameters describes relatively well the level cross-sections below 3.15 MeV. This agreement was expected already from the comparisonof the gamma production cross-section with the Talys calculation. In both cases,level cross-sections and gamma production cross-sections, the agreement with theTalys calculation is generally good at low energies.
Above 3.15 MeV, the calculation is lower for levels as 2442.8 keV, 2492.8 keV and2617.3 keV. Of course, above the 3.1 MeV neutron energy, the present results forthe level cross-section may be affected by the excited levels that were not observedhere. Above 3154 keV, some excited levels were not observed in the present mea-surement. The difference with the Talys calculation may be consistent with the factthat the feeding from some levels above 3154 keV excitation energy was neglected.It should be noted that in the case of the 209Bi, the JEFF 3.1 evaluation of the levelcross-section coincides with the Talys calculation with the default input parameters.Therefore the JEFF 3.1 evaluation was not plotted here for the level cross-sectionsas in the case of the 52Cr nucleus.

February 2006 L.C.Mihailescu 127
0
0.1
0.2
0.3
0.4
0.5
1500 2000 2500 3000 3500 4000
σ (
barn
)
En (keV)
1608.5 keV
This work - smoothTalys - defaultLashuk - 1994Guenther - 1980Korzh - 1977Degtjarev - 1967Kiehn - 1954
0
0.02
0.04
0.06
0.08
2500 3000 3500
σ (
barn
)
En (keV)
2442.8 keVThis workTalys - default
0
0.02
0.04
0.06
0.08
2500 3000 3500
σ (
barn
)
En (keV)
2492.8 keV
This workTalys - default
0
0.05
0.1
2500 3000 3500
σ (
barn
)
En (keV)
2564.1 keV
This workTalys - default
0
0.05
0.1
2500 3000 3500
σ (
barn
)
En (keV)
2583.0 keV
This workTalys - default
0
0.05
0.1
0.15
2500 3000 3500
σ (
barn
)
En (keV)
2599.0 keV
This workTalys - default
0
0.05
0.1
0.15
0.2
2500 3000 3500
σ (
barn
)
En (keV)
2600.0 keV
This workTalys - default
0
0.02
0.04
0.06
2500 3000 3500
σ (
barn
)
En (keV)
2617.3 keV
This workTalys - default
Figure 5.37: Cross-section of levels with higher excited energy in 209Bi.
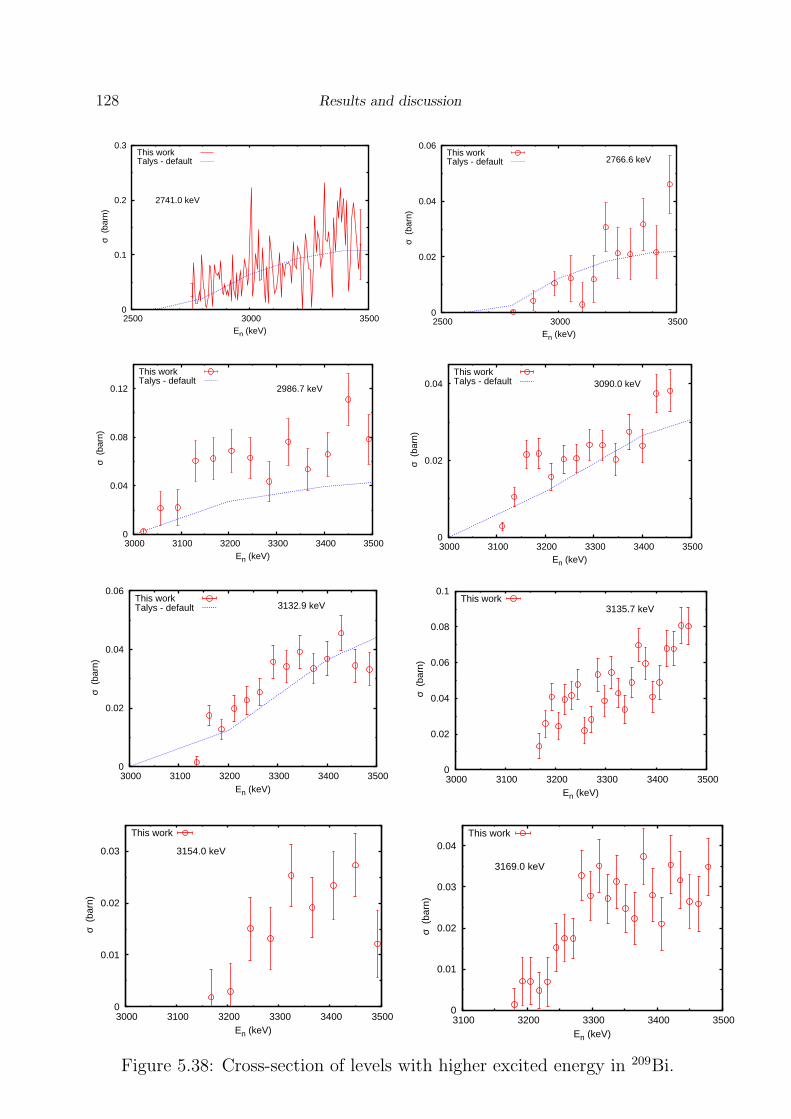
128 Results and discussion
0
0.1
0.2
0.3
2500 3000 3500
σ (
barn
)
En (keV)
2741.0 keV
This workTalys - default
0
0.02
0.04
0.06
2500 3000 3500
σ (
barn
)
En (keV)
2766.6 keVThis workTalys - default
0
0.04
0.08
0.12
3000 3100 3200 3300 3400 3500
σ (
barn
)
En (keV)
2986.7 keV
This workTalys - default
0
0.02
0.04
3000 3100 3200 3300 3400 3500
σ (
barn
)
En (keV)
3090.0 keVThis workTalys - default
0
0.02
0.04
0.06
3000 3100 3200 3300 3400 3500
σ (
barn
)
En (keV)
3132.9 keVThis workTalys - default
0
0.02
0.04
0.06
0.08
0.1
3000 3100 3200 3300 3400 3500
σ (
barn
)
En (keV)
3135.7 keVThis work
0
0.01
0.02
0.03
3000 3100 3200 3300 3400 3500
σ (
barn
)
En (keV)
3154.0 keV
This work
0
0.01
0.02
0.03
0.04
3100 3200 3300 3400 3500
σ (
barn
)
En (keV)
3169.0 keV
This work
Figure 5.38: Cross-section of levels with higher excited energy in 209Bi.
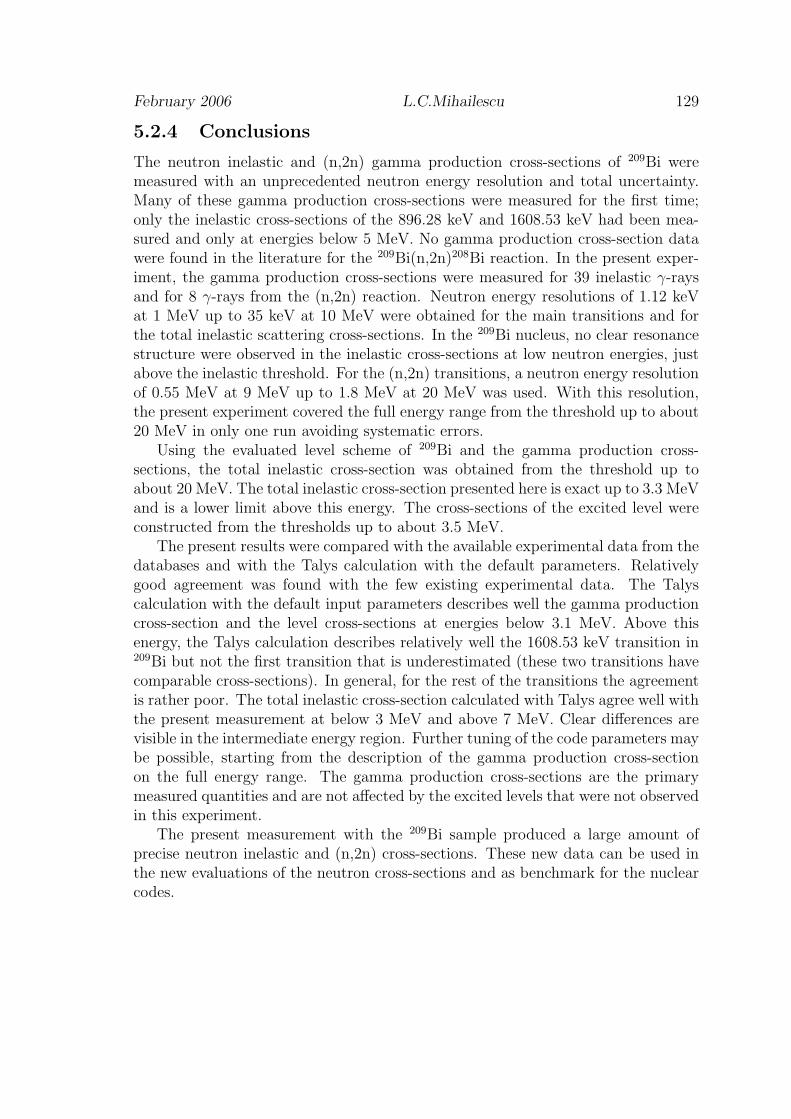
February 2006 L.C.Mihailescu 129
5.2.4 Conclusions
The neutron inelastic and (n,2n) gamma production cross-sections of 209Bi weremeasured with an unprecedented neutron energy resolution and total uncertainty.Many of these gamma production cross-sections were measured for the first time;only the inelastic cross-sections of the 896.28 keV and 1608.53 keV had been mea-sured and only at energies below 5 MeV. No gamma production cross-section datawere found in the literature for the 209Bi(n,2n)208Bi reaction. In the present exper-iment, the gamma production cross-sections were measured for 39 inelastic γ-raysand for 8 γ-rays from the (n,2n) reaction. Neutron energy resolutions of 1.12 keVat 1 MeV up to 35 keV at 10 MeV were obtained for the main transitions and forthe total inelastic scattering cross-sections. In the 209Bi nucleus, no clear resonancestructure were observed in the inelastic cross-sections at low neutron energies, justabove the inelastic threshold. For the (n,2n) transitions, a neutron energy resolutionof 0.55 MeV at 9 MeV up to 1.8 MeV at 20 MeV was used. With this resolution,the present experiment covered the full energy range from the threshold up to about20 MeV in only one run avoiding systematic errors.
Using the evaluated level scheme of 209Bi and the gamma production cross-sections, the total inelastic cross-section was obtained from the threshold up toabout 20 MeV. The total inelastic cross-section presented here is exact up to 3.3 MeVand is a lower limit above this energy. The cross-sections of the excited level wereconstructed from the thresholds up to about 3.5 MeV.
The present results were compared with the available experimental data from thedatabases and with the Talys calculation with the default parameters. Relativelygood agreement was found with the few existing experimental data. The Talyscalculation with the default input parameters describes well the gamma productioncross-section and the level cross-sections at energies below 3.1 MeV. Above thisenergy, the Talys calculation describes relatively well the 1608.53 keV transition in209Bi but not the first transition that is underestimated (these two transitions havecomparable cross-sections). In general, for the rest of the transitions the agreementis rather poor. The total inelastic cross-section calculated with Talys agree well withthe present measurement at below 3 MeV and above 7 MeV. Clear differences arevisible in the intermediate energy region. Further tuning of the code parameters maybe possible, starting from the description of the gamma production cross-sectionon the full energy range. The gamma production cross-sections are the primarymeasured quantities and are not affected by the excited levels that were not observedin this experiment.
The present measurement with the 209Bi sample produced a large amount ofprecise neutron inelastic and (n,2n) cross-sections. These new data can be used inthe new evaluations of the neutron cross-sections and as benchmark for the nuclearcodes.

130 Results and discussion
5.3 206Pb neutron inelastic scattering and (n,2n)
cross-sections
5.3.1 Introduction
The neutron inelastic scattering cross-sections on 206Pb had been measured us-ing both the (n,n’)-technique and the (n,n’γ)-technique. With the first technique(Refs. [134,139–141,143,148]) the measurements were done at few energies between2 MeV and 8 MeV with best neutron energy resolution of 30 keV. The majorityof these experiments measured only the differential cross-sections for few excitedlevels. The experiments presented in Refs. [135, 142, 145, 147, 149] used the (n,n’γ)-technique. Except Refs. [135, 147] where Ge(Li) detectors were used for the γ-raydetection, the other experiments used NaI detectors. Most of the previous experi-ments used radiogenic samples with only about 88% of 206Pb.
For the 206Pb nucleus, there are two major limitations in the use of the (n,n’γ)technique. The first one is the presence of an E0 transition from the second excitedlevel at 1165 keV with the spin and parity 0+ (Fig. 5.39). This transition is fullyconverted internally and is not observed by the HPGe detectors. The second limita-tion is represented by the existence of an isomer at 2200.14 keV with a life time of125 µs. The γ-rays from the decay of this isomer (516.18 keV and 202.44 keV) aredelayed and not observed in the prompt spectrum. Because the life time of this levelis 10 times smaller than the time interval between two consecutive neutron bursts,the level decays almost completely between two bursts. Therefore the isomer leveldoes not spoil the neutron energy resolution of the γ-rays that are fed by the γ-raysfrom the isomer. In practice, no measurable yield was detected below the inelasticthreshold of the 880.98 keV γ-ray that is fed by the 516.18 keV γ-ray from the isomer(Fig. 5.39).
In the present measurement at least one γ-ray was observed from the decay ofthe levels up to 2196.7 keV (see Fig. 5.39). Above this excitation energy, some levelswere not observed. The maximum energy of an observed level was 3562.84 keV.In total, the gamma production cross-section was measured for 23 γ-rays from thethreshold up to about 20 MeV neutron energy. The γ-ray peak at 1588 keV is dueto two different transitions in 206Pb, emitted from the levels at 2391.32 keV and2929.06 keV. Therefore, the measured gamma-production cross-section presentedhere is the sum of the two gamma production cross-sections.
The only (n,2n) cross-sections measurements on 206Pb were performed using theactivation technique (Ref. [137]). Such measurements provide only the total (n,2n)cross-sections. In the present experiment, two γ-rays from the 206Pb(n,2n)205Pbreaction were observed: 573.88 keV and 703.44 keV. No γ-rays from the first twoexcited levels of the 205Pb nucleus were observed because of their low energy.
5.3.2 Gamma production cross-sections
Fig. 5.40 shows an example of the amplitude spectrum obtained with the HPGedetectors and the 206Pb sample. The main peaks from the 206Pb(n,n’γ)206Pb reaction

February 2006 L.C.Mihailescu 131
0+ 0.0 stable
2+ 803.049 8.14 ps
3+ 1340.47
2+ 1466.80
4+ 1683.96
2+ 1784.08
4+ 1997.65
(2+,3+) 2196.7
7– 2200.14 125 µs
6– 2384.12 29 ps
3– 2647.77 0.087 ps
9– 2658.4
5– 2782.15
(4)– 2826.29
7– 2864.52
4+ 2929.06
6– 2939.57
8– 2954.6
5– 3016.40
(3+) 3120.9
(1,2) 3194.3
6–,7– 3225.37
4– 3244.21
6+ 3260.0
5– 3279.18
5– 3402.62
4+ 3453.4
3483.3
(4+) 3516
5– 3562.84
1588.5
9 M
1
100
157.5
04 M
1(+
E2)
22.6
555.3
0
23.9
739.2
4 M
1(+
E2)
100
296.2
M1
68
754.4
M1
100
190.0
4
234.2
42 M
1(+
E2)
5.4
632.2
5 M
1(+
E2)
100
816.2
5
1332.3
3 E
1
6.3
1655.5
28
2319.3
2
100
2391.0
65
3194.6
100
360.8
2
443.2
0
841.2
8 M
1(+
E2)
100
1025.3
0
22.9
227.6
5
1047.6
18
1246.4
6 E
1
22.2
1560.3
0
100
1903.5
6 E
1
92
2439.0
1.3
1575.9
E2
100
34.9
54 M
1(+
E2)
0.1
1
262.7
0 M
1(+
E2)
19.3
339.8
5
452.8
4
1.0
0
497.0
6 M
1(+
E2)
97.8
895.1
2 M
1(+
E2)
100.0
1281.8
1 E
1
0.4
2
1595.2
7 E
1
32.0
2476.7
0.0
9
123.4
15 M
1(+
E2)
0.0
7
158.3
86 M
1(+
E2)
0.2
6
386.2
0 M
1(+
E2)
1.6
2
462.9
2
0.1
7
576.3
6
0.3
5
620.4
8 M
1(+
E2)
18.1
754.9
6 E
2
1.6
6
1018.6
3 M
1(+
E2)
23.8
1202.5
8 E
2
0.3
3
1405.0
1 E
1
4.5
0
1718.7
0 E
1
100.0
2599.6
E3
0.4
1
2650.3
100
1699.5
54
2682.0
100
2713
100
283.7
5
780.6
6
915.0
1.5
3
1565.3
4 E
1
15.1
1878.6
5 E
1
100
2759.6
0.6
9
208
62Pb124
0+ 0.0 stable
2+ 803.049 8.14 ps
0+ 1165 0.75 ns
3+ 1340.47
2+ 1466.80
4+ 1683.96
1+ 1704.46
2+ 1784.08
4+ 1997.65
2+ 2147.9
(2+,3+) 2196.7
7– 2200.14 125 µs
2236.53
2384.12
2391.32
2+ 2423.36
3– 2647.77 0.087 ps
9–
5– 2782.15
(4)– 2826.29
7– 2939.57
4– 3016.40
803.0
6 E
2
100
362
≤0.3
1165 E
0
537.4
7 M
1(+
E2)
100
126.4
2
3.8
663.7
5 (
M1+E
2)
100
1466.7
8 E
2
30.4
343.5
1 M
1(+
E2)
35.4
880.9
8 E
2
100.0
1704.4
5
100
317.5
2
23
617.6
11
980.9
9
100
1784.7
5.2
313.6
6 M
1(+
E2)
21
657.1
8 M
1(+
E2)
100
1194.6
8 E
2
14.5
682.2
9 (
M1+E
2)
20
808.5
8 (
M1+E
2)
20
1345.8
8
100
729.2
(M
1+E
2)
7
856.6
(M
1+E
2)
100
1393.8
(M
1+E
2)
78
202.4
4 E
3
0.1
1
516.1
8 E
3
100
1433.4
7
100
183.9
77 M
1(+
E2)
100
1588.2
M1(+
E2),E
3
100
639.0
4.9
718.9
2
49
956.5
6
20.6
1082.7
8.5
1620.3
0
100
964.2
2 [
E1]
6.4
1844.4
7 E
1
100
458.1
E2
100
398.0
0 M
1(+
E2)
79.6
581.9
7 E
2
3.5
9
784.5
8 E
1
3.9
7
1098.2
6 E
1
100
44.1
10 M
1(+
E2)
6.4
434.8
9
20.5
442.1
4
34
1142.3
7 E
1
100
2022.8
0 M
2,M
3,E
3
11.6
480.3
8 M
1
91
664.1
7 M
1
100
1180.7
0
68
208
62Pb124
Figure 5.39: Simplified level scheme of 206Pb et al. [131]. The gamma productioncross-section of the transitions drawn with colors was measured in the present exper-iment. The ”red” γ-rays were used to construct the total inelastic cross-section. Theexcited levels drawn with black were not observed. The two levels at 2391.32 keVand at 2929.06 keV decay through γ-rays of about same energy: 1588.2 keV and1588.59 keV (see the text for details).
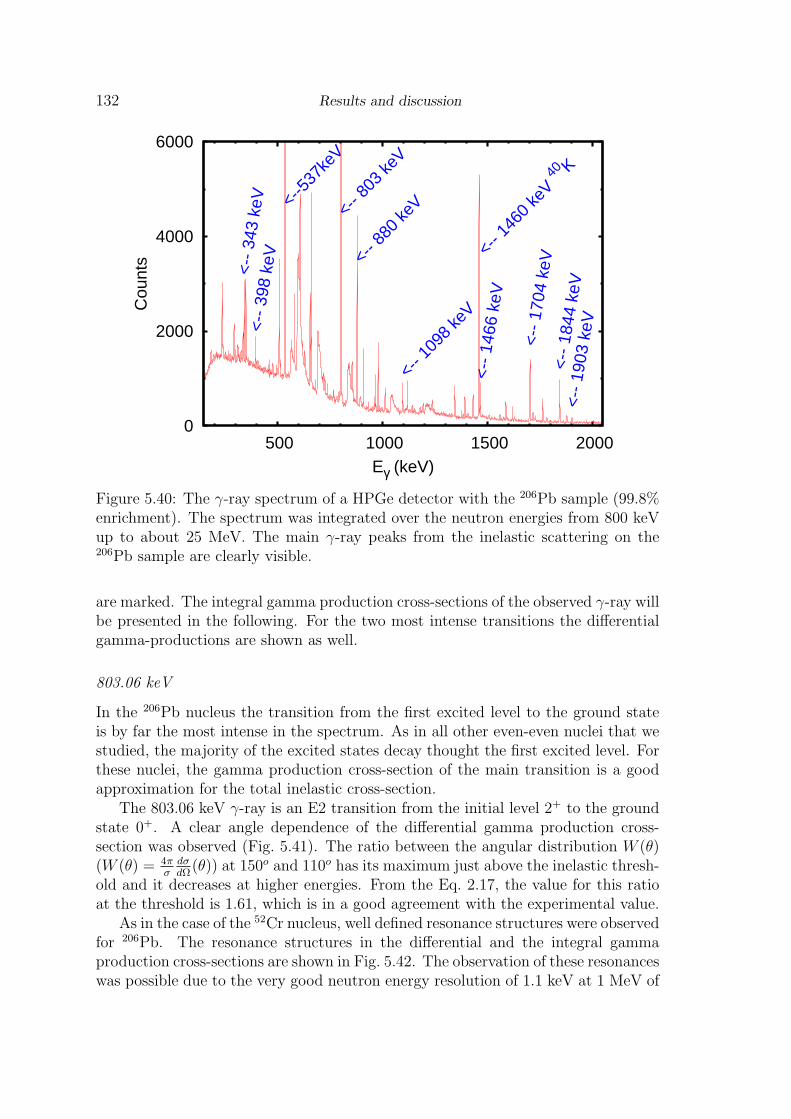
132 Results and discussion
0
2000
4000
6000
500 1000 1500 2000
Cou
nts
Eγ (keV)
<-- 8
03 ke
V
<--5
37ke
V
<--
398
keV <-
- 880
keV
<--
1704
keV
<--
1466
keV
<--
1844
keV
<--
1903
keV
<-- 1
098
keV
<--
343
keV
<-- 1
460
keV 4
0 K
Figure 5.40: The γ-ray spectrum of a HPGe detector with the 206Pb sample (99.8%enrichment). The spectrum was integrated over the neutron energies from 800 keVup to about 25 MeV. The main γ-ray peaks from the inelastic scattering on the206Pb sample are clearly visible.
are marked. The integral gamma production cross-sections of the observed γ-ray willbe presented in the following. For the two most intense transitions the differentialgamma-productions are shown as well.
803.06 keV
In the 206Pb nucleus the transition from the first excited level to the ground stateis by far the most intense in the spectrum. As in all other even-even nuclei that westudied, the majority of the excited states decay thought the first excited level. Forthese nuclei, the gamma production cross-section of the main transition is a goodapproximation for the total inelastic cross-section.
The 803.06 keV γ-ray is an E2 transition from the initial level 2+ to the groundstate 0+. A clear angle dependence of the differential gamma production cross-section was observed (Fig. 5.41). The ratio between the angular distribution W (θ)(W (θ) = 4π
σdσdΩ
(θ)) at 150o and 110o has its maximum just above the inelastic thresh-old and it decreases at higher energies. From the Eq. 2.17, the value for this ratioat the threshold is 1.61, which is in a good agreement with the experimental value.
As in the case of the 52Cr nucleus, well defined resonance structures were observedfor 206Pb. The resonance structures in the differential and the integral gammaproduction cross-sections are shown in Fig. 5.42. The observation of these resonanceswas possible due to the very good neutron energy resolution of 1.1 keV at 1 MeV of

February 2006 L.C.Mihailescu 133
0
0.05
0.1
0.15
0.2
0 5000 10000 15000 20000
dσ γ
/ dΩ
(ba
rn/s
r)
En (keV)
803.06 KeV
110o
150o
1
1.2
1.4
1.6
1.8
0 2000 4000 6000 8000 10000
W(1
50)/
W(1
10)
En (keV)
803.06 KeV
Figure 5.41: Differential gamma production cross-section for the 803.06 keV tran-sition in 206Pb. Left: Smoothed curves from the threshold up to 20 MeV at twoangles, 110 and 150 degrees. Right: The ratio between the angular distributionW (θ) = 4π
σdσdΩ
(θ) at 150 and 110 degrees.
0
0.02
0.04
0.06
0.08
0.1
0.12
800 850 900 950 1000
dσ γ
/ dΩ
(ba
rn/s
r)
En (keV)
110150
0
0.2
0.4
0.6
0.8
1
1.2
800 900 1000 1100
σ γ
(bar
n)
En (keV)
803.06 keV
This workTalys - default
Figure 5.42: Full resolution gamma production cross-section for the 803.06 keV tran-sition in 206Pb. Left: Differential gamma production cross-section at 110o and 150o.Right: Integral gamma production cross-section compared with Talys calculation.

134 Results and discussion
0
0.5
1
1.5
2
2.5
0 5000 10000 15000 20000
σ γ
(bar
n)
En (keV)
803.06 keV
This work - smoothTalys - defaultTalys - default-isomerTalys - default-allLashuk - 1996Yamamoto - 1978Boring - 1961Lind - 1961Day - 1956
0
10
20
30
40
50
0 5000 10000 15000 20000
Unc
erta
inty
(%
)
En (keV)
Figure 5.43: Left: Integral gamma production cross-section for the 803.06 keV tran-sition in 206Pb. Full energy scale from threshold up to 20 MeV. The data weresmoothed with an averaging moving window filter for an easier comparison withother data. Right: The corresponding total uncertainty.
the present experiment.
Fig. 5.43 shows the integral gamma production cross-section of the 803.06 keVtransition from the inelastic threshold up to 20 MeV. The present data were smoothedwith an averaging moving window filter for an easier comparison with the otherdata. The width of the filter was 11 energy bins, which is equivalent to 88 ns time-of-flight. Only few experimental data points were found in the literature for theintegral gamma production cross-section. Large discrepancies with these point dataare observed. The difference with the measured values of Day et al. [149] increaseswith the increase of the incident neutron energy. The two data points of Lashuket al. [?] and Yamamoto et al. [147] are very different compared with the presentresults: the first one lower and the second one, at about 15 MeV is higher. Thepoint value of Boring et al. [142] agrees well with the present values at about 3 MeV.
In the case of the 206Pb nucleus, for a proper comparison with the experimentaldata, two corrections were needed for the gamma production cross-section of the803.06 keV given by the Talys calculation. The first one regards the presence ofthe isomer level at 2200.14 keV. The Talys code neglects the long life time of theisomer level and the γ-rays from the isomer are considered as prompt transitions.For the comparison with the present measurement, the cross-section of the γ-raysthat decay from the isomer (516.18 keV and 202.44 keV) has to be subtracted fromthe cross-section of all the γ-rays that are fed by the isomer.
The second correction regards the presence of the E0 transition. The Talyscode attributes the full decay strength of the 0+ level, at 1165 keV, to the 362 keVtransition that feeds the first excited level. This is contrary to the information inthe evaluated level scheme et al. [131], where the 362 keV transition has negligibleintensity (less than 0.3%). Because of this, the calculated gamma production cross-section of the 362 keV transition has to be subtracted from the calculated gammaproduction cross-section of the 803.06 keV in order to make a correct comparison.
The total uncertainty of the integral gamma production cross-section of the
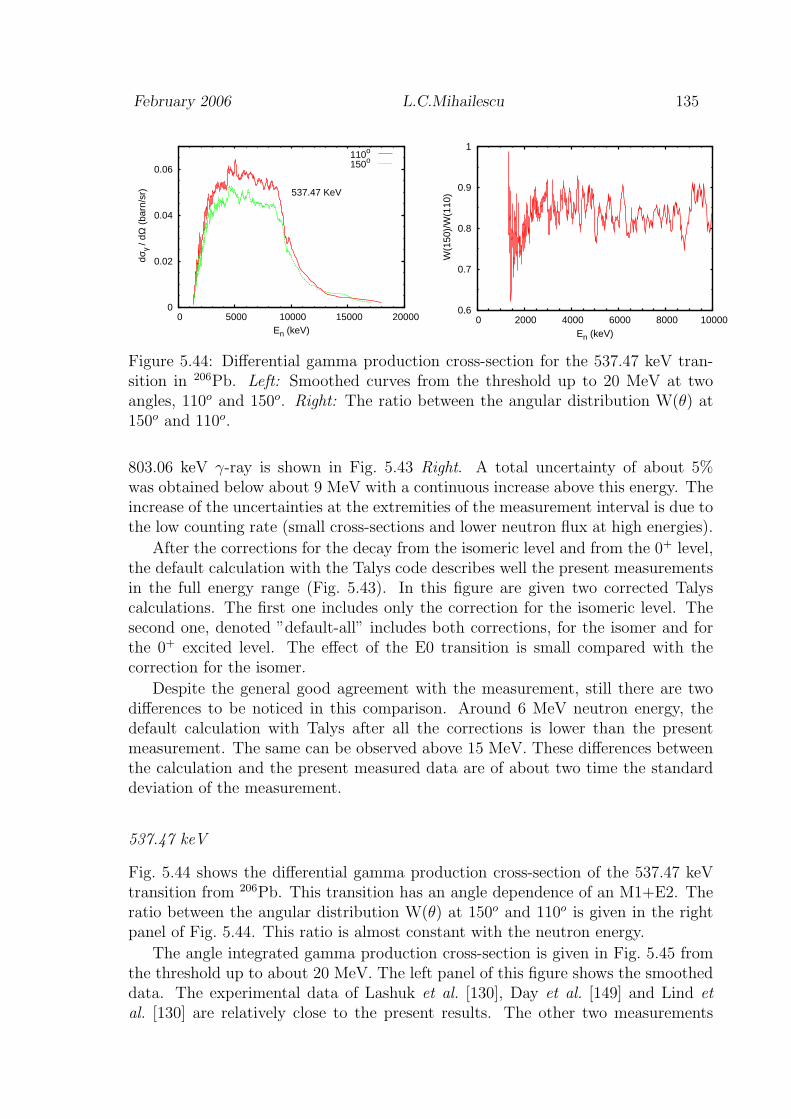
February 2006 L.C.Mihailescu 135
0
0.02
0.04
0.06
0 5000 10000 15000 20000
dσ γ
/ dΩ
(ba
rn/s
r)
En (keV)
537.47 KeV
110o
150o
0.6
0.7
0.8
0.9
1
0 2000 4000 6000 8000 10000
W(1
50)/
W(1
10)
En (keV)
Figure 5.44: Differential gamma production cross-section for the 537.47 keV tran-sition in 206Pb. Left: Smoothed curves from the threshold up to 20 MeV at twoangles, 110o and 150o. Right: The ratio between the angular distribution W(θ) at150o and 110o.
803.06 keV γ-ray is shown in Fig. 5.43 Right. A total uncertainty of about 5%was obtained below about 9 MeV with a continuous increase above this energy. Theincrease of the uncertainties at the extremities of the measurement interval is due tothe low counting rate (small cross-sections and lower neutron flux at high energies).
After the corrections for the decay from the isomeric level and from the 0+ level,the default calculation with the Talys code describes well the present measurementsin the full energy range (Fig. 5.43). In this figure are given two corrected Talyscalculations. The first one includes only the correction for the isomeric level. Thesecond one, denoted ”default-all” includes both corrections, for the isomer and forthe 0+ excited level. The effect of the E0 transition is small compared with thecorrection for the isomer.
Despite the general good agreement with the measurement, still there are twodifferences to be noticed in this comparison. Around 6 MeV neutron energy, thedefault calculation with Talys after all the corrections is lower than the presentmeasurement. The same can be observed above 15 MeV. These differences betweenthe calculation and the present measured data are of about two time the standarddeviation of the measurement.
537.47 keV
Fig. 5.44 shows the differential gamma production cross-section of the 537.47 keVtransition from 206Pb. This transition has an angle dependence of an M1+E2. Theratio between the angular distribution W(θ) at 150o and 110o is given in the rightpanel of Fig. 5.44. This ratio is almost constant with the neutron energy.
The angle integrated gamma production cross-section is given in Fig. 5.45 fromthe threshold up to about 20 MeV. The left panel of this figure shows the smootheddata. The experimental data of Lashuk et al. [130], Day et al. [149] and Lind etal. [130] are relatively close to the present results. The other two measurements
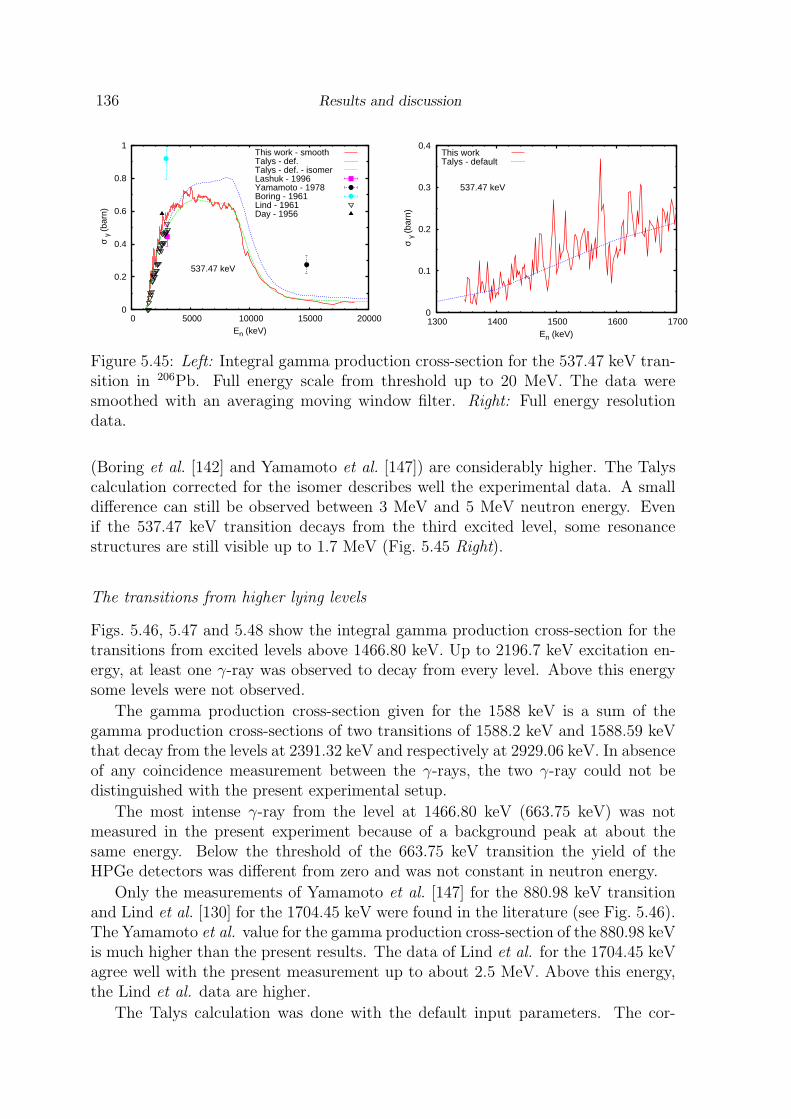
136 Results and discussion
0
0.2
0.4
0.6
0.8
1
0 5000 10000 15000 20000
σ γ
(bar
n)
En (keV)
537.47 keV
This work - smoothTalys - def.Talys - def. - isomerLashuk - 1996Yamamoto - 1978Boring - 1961Lind - 1961Day - 1956
0
0.1
0.2
0.3
0.4
1300 1400 1500 1600 1700
σ γ
(bar
n)
En (keV)
537.47 keV
This workTalys - default
Figure 5.45: Left: Integral gamma production cross-section for the 537.47 keV tran-sition in 206Pb. Full energy scale from threshold up to 20 MeV. The data weresmoothed with an averaging moving window filter. Right: Full energy resolutiondata.
(Boring et al. [142] and Yamamoto et al. [147]) are considerably higher. The Talyscalculation corrected for the isomer describes well the experimental data. A smalldifference can still be observed between 3 MeV and 5 MeV neutron energy. Evenif the 537.47 keV transition decays from the third excited level, some resonancestructures are still visible up to 1.7 MeV (Fig. 5.45 Right).
The transitions from higher lying levels
Figs. 5.46, 5.47 and 5.48 show the integral gamma production cross-section for thetransitions from excited levels above 1466.80 keV. Up to 2196.7 keV excitation en-ergy, at least one γ-ray was observed to decay from every level. Above this energysome levels were not observed.
The gamma production cross-section given for the 1588 keV is a sum of thegamma production cross-sections of two transitions of 1588.2 keV and 1588.59 keVthat decay from the levels at 2391.32 keV and respectively at 2929.06 keV. In absenceof any coincidence measurement between the γ-rays, the two γ-ray could not bedistinguished with the present experimental setup.
The most intense γ-ray from the level at 1466.80 keV (663.75 keV) was notmeasured in the present experiment because of a background peak at about thesame energy. Below the threshold of the 663.75 keV transition the yield of theHPGe detectors was different from zero and was not constant in neutron energy.
Only the measurements of Yamamoto et al. [147] for the 880.98 keV transitionand Lind et al. [130] for the 1704.45 keV were found in the literature (see Fig. 5.46).The Yamamoto et al. value for the gamma production cross-section of the 880.98 keVis much higher than the present results. The data of Lind et al. for the 1704.45 keVagree well with the present measurement up to about 2.5 MeV. Above this energy,the Lind et al. data are higher.
The Talys calculation was done with the default input parameters. The cor-

February 2006 L.C.Mihailescu 137
0
0.02
0.04
0.06
0.08
0 5000 10000 15000
σ γ
(bar
n)
En (keV)
1466.78 keV
This work - smoothTalys - default
0
0.2
0.4
0.6
0.8
0 5000 10000 15000
σ γ
(bar
n)
En (keV)
880.98 keVThis work - smoothTalys - defaultTalys - default - isomerYamamoto - 1978
0
0.1
0.2
0.3
0 5000 10000 15000
σ γ
(bar
n)
En (keV)
343.51 keV
This workTalys - defaultTalys - default - isomer
0
0.05
0.1
0.15
0.2
2000 4000 6000 8000 10000
σ γ
(bar
n)
En (keV)
1704.45 keV
This work - smoothTalys - defaultLind - 1961
0
0.05
0.1
0.15
0.2
5000 10000 15000
σ γ
(bar
n)
En (keV)
980.99 keV
This workTalys - default
0
0.05
0.1
0.15
0.2
5000 10000 15000
σ γ
(bar
n)
En (keV)
657.18 keV
This workTalys - defaultTalys - default - isomer
0
0.02
0.04
0.06
0.08
0.1
0.12
2000 4000 6000 8000 10000
σ γ
(bar
n)
En (keV)
1345.88 keV
This workTalys - default
0
0.02
0.04
0.06
0.08
0.1
0.12
0.14
2000 4000 6000 8000 10000 12000
σ γ
(bar
n)
En (keV)
856.6 keV
This workTalys - default
Figure 5.46: Integral gamma production cross-section for the transitions from higherlying levels in 206Pb.
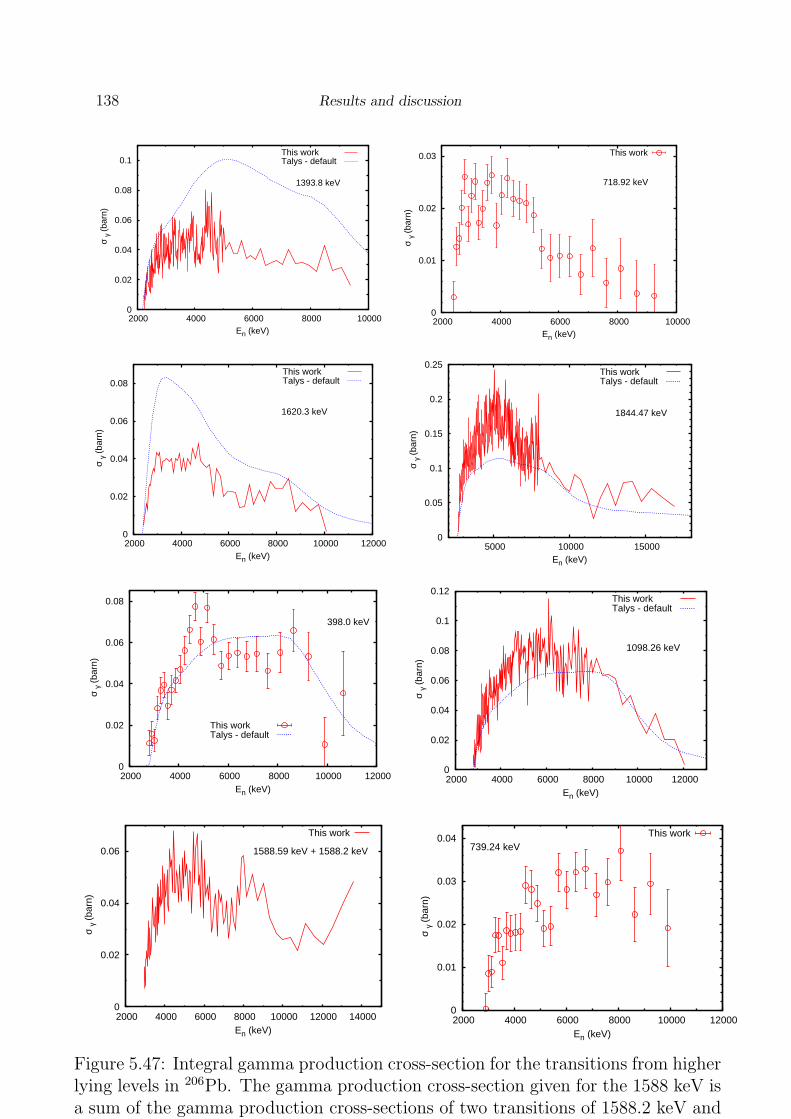
138 Results and discussion
0
0.02
0.04
0.06
0.08
0.1
2000 4000 6000 8000 10000
σ γ
(bar
n)
En (keV)
1393.8 keV
This workTalys - default
0
0.01
0.02
0.03
2000 4000 6000 8000 10000
σ γ
(bar
n)
En (keV)
718.92 keV
This work
0
0.02
0.04
0.06
0.08
2000 4000 6000 8000 10000 12000
σ γ
(bar
n)
En (keV)
1620.3 keV
This workTalys - default
0
0.05
0.1
0.15
0.2
0.25
5000 10000 15000
σ γ
(bar
n)
En (keV)
1844.47 keV
This workTalys - default
0
0.02
0.04
0.06
0.08
2000 4000 6000 8000 10000 12000
σ γ
(bar
n)
En (keV)
398.0 keV
This workTalys - default
0
0.02
0.04
0.06
0.08
0.1
0.12
2000 4000 6000 8000 10000 12000
σ γ
(bar
n)
En (keV)
1098.26 keV
This workTalys - default
0
0.02
0.04
0.06
2000 4000 6000 8000 10000 12000 14000
σ γ
(bar
n)
En (keV)
1588.59 keV + 1588.2 keV
This work
0
0.01
0.02
0.03
0.04
2000 4000 6000 8000 10000 12000
σ γ
(bar
n)
En (keV)
739.24 keVThis work
Figure 5.47: Integral gamma production cross-section for the transitions from higherlying levels in 206Pb. The gamma production cross-section given for the 1588 keV isa sum of the gamma production cross-sections of two transitions of 1588.2 keV and1588.59 keV (see the text).
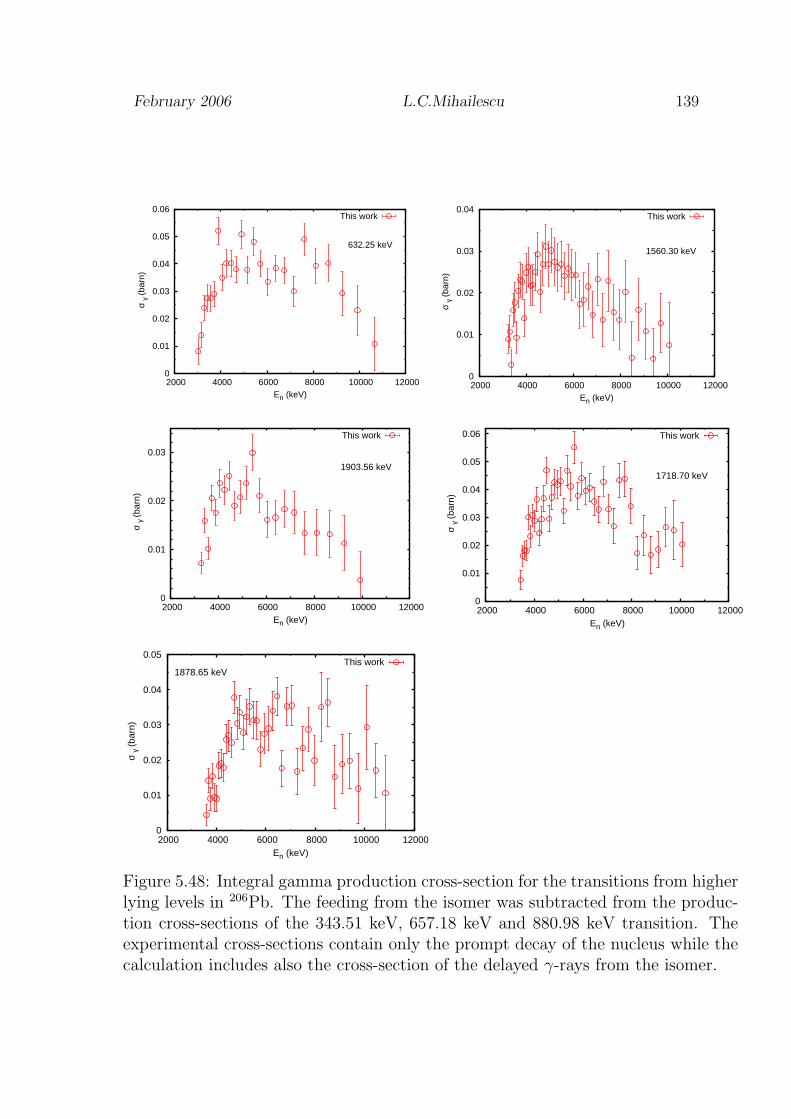
February 2006 L.C.Mihailescu 139
0
0.01
0.02
0.03
0.04
0.05
0.06
2000 4000 6000 8000 10000 12000
σ γ
(bar
n)
En (keV)
632.25 keV
This work
0
0.01
0.02
0.03
0.04
2000 4000 6000 8000 10000 12000
σ γ
(bar
n)
En (keV)
1560.30 keV
This work
0
0.01
0.02
0.03
2000 4000 6000 8000 10000 12000
σ γ
(bar
n)
En (keV)
1903.56 keV
This work
0
0.01
0.02
0.03
0.04
0.05
0.06
2000 4000 6000 8000 10000 12000
σ γ
(bar
n)
En (keV)
1718.70 keV
This work
0
0.01
0.02
0.03
0.04
0.05
2000 4000 6000 8000 10000 12000
σ γ
(bar
n)
En (keV)
1878.65 keVThis work
Figure 5.48: Integral gamma production cross-section for the transitions from higherlying levels in 206Pb. The feeding from the isomer was subtracted from the produc-tion cross-sections of the 343.51 keV, 657.18 keV and 880.98 keV transition. Theexperimental cross-sections contain only the prompt decay of the nucleus while thecalculation includes also the cross-section of the delayed γ-rays from the isomer.
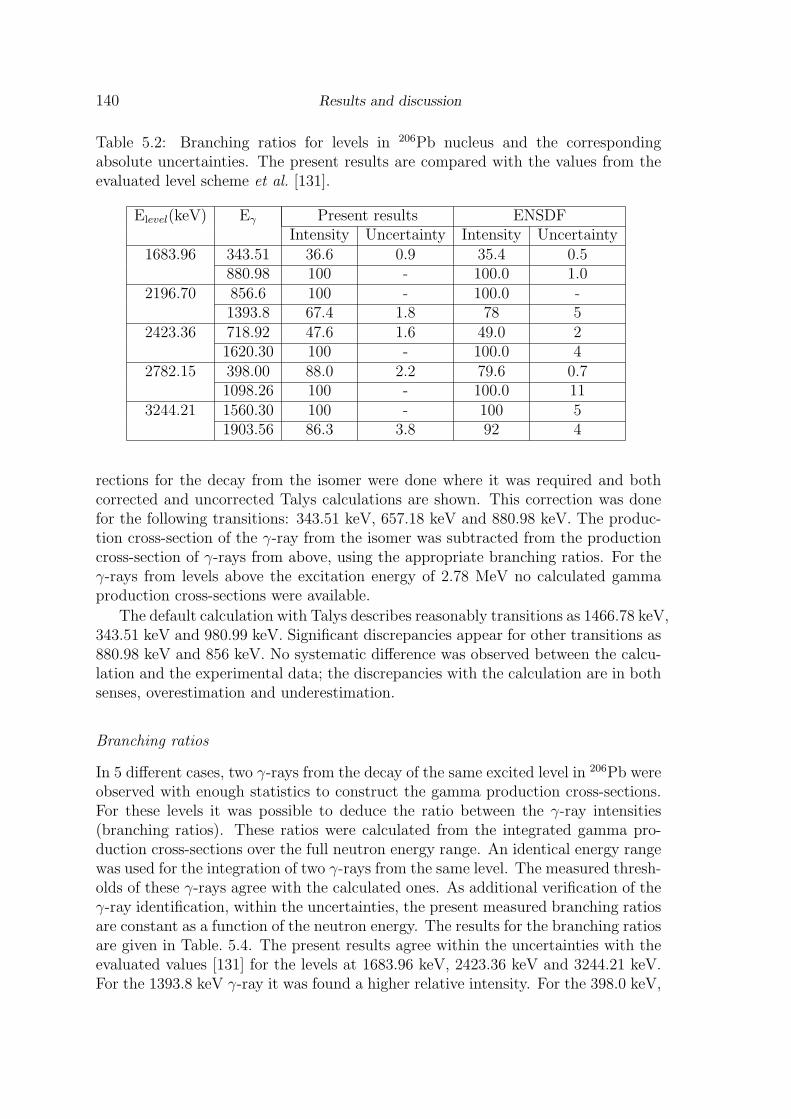
140 Results and discussion
Table 5.2: Branching ratios for levels in 206Pb nucleus and the correspondingabsolute uncertainties. The present results are compared with the values from theevaluated level scheme et al. [131].
Elevel(keV) Eγ Present results ENSDFIntensity Uncertainty Intensity Uncertainty
1683.96 343.51 36.6 0.9 35.4 0.5880.98 100 - 100.0 1.0
2196.70 856.6 100 - 100.0 -1393.8 67.4 1.8 78 5
2423.36 718.92 47.6 1.6 49.0 21620.30 100 - 100.0 4
2782.15 398.00 88.0 2.2 79.6 0.71098.26 100 - 100.0 11
3244.21 1560.30 100 - 100 51903.56 86.3 3.8 92 4
rections for the decay from the isomer were done where it was required and bothcorrected and uncorrected Talys calculations are shown. This correction was donefor the following transitions: 343.51 keV, 657.18 keV and 880.98 keV. The produc-tion cross-section of the γ-ray from the isomer was subtracted from the productioncross-section of γ-rays from above, using the appropriate branching ratios. For theγ-rays from levels above the excitation energy of 2.78 MeV no calculated gammaproduction cross-sections were available.
The default calculation with Talys describes reasonably transitions as 1466.78 keV,343.51 keV and 980.99 keV. Significant discrepancies appear for other transitions as880.98 keV and 856 keV. No systematic difference was observed between the calcu-lation and the experimental data; the discrepancies with the calculation are in bothsenses, overestimation and underestimation.
Branching ratios
In 5 different cases, two γ-rays from the decay of the same excited level in 206Pb wereobserved with enough statistics to construct the gamma production cross-sections.For these levels it was possible to deduce the ratio between the γ-ray intensities(branching ratios). These ratios were calculated from the integrated gamma pro-duction cross-sections over the full neutron energy range. An identical energy rangewas used for the integration of two γ-rays from the same level. The measured thresh-olds of these γ-rays agree with the calculated ones. As additional verification of theγ-ray identification, within the uncertainties, the present measured branching ratiosare constant as a function of the neutron energy. The results for the branching ratiosare given in Table. 5.4. The present results agree within the uncertainties with theevaluated values [131] for the levels at 1683.96 keV, 2423.36 keV and 3244.21 keV.For the 1393.8 keV γ-ray it was found a higher relative intensity. For the 398.0 keV,

February 2006 L.C.Mihailescu 141
100
200
300
400
500
200 400 600 800 1000
Cou
nts
Eγ (keV)<
---
703
keV
<--
- 57
3 ke
V
<-- 8
03 ke
V
<-- 5
37 ke
V
<--
- 26
0 ke
V
Figure 5.49: γ-rays spectrum with the 206Pb sample (99.8% enrichment) integratedover neutron energies above 8.12 MeV up to about 25 MeV. The 573.88 keV and703.44 keV γ-ray peaks from the 206Pb(n,2n)205Pb reaction are seen well in such aspectrum. The position of 260.5 keV γ-ray peak is indicated but such peak is notclearly defined in this spectrum.
the present value of the branching ratio is lower than the evaluated one.
(n,2n) gamma production cross-sections
The threshold of the (n,2n) reaction on 206Pb is at 8.125 MeV. The γ-rays spectrumwith the 206Pb sample integrated over neutron energies above the (n,2n) thresholdis given in Fig. 5.49. Two γ-ray from the 205Pb nucleus were observed: 573.88 keVand 703.44 keV. The γ-rays from the decay of the first two excited levels in 205Pbwere not observed because of their low energy (2.3 keV and 260.5 keV) and theincreased background in that energy region. The fact that the 260.48 keV γ-ray wasnot clearly observed may be due also to its conversion coefficient of 0.61 [131].
The gamma production cross-section of the 573.88 keV and 703.44 keV transi-tions is given in Fig. 5.50. The observed experimental threshold of the two (n,2n)transitions is the same as the calculated one. At 10 MeV neutron energy, an en-ergy resolution of 150 keV was obtained for the 703.44 keV transition and 360 keVfor the 573.88 keV. The Talys calculation underestimates the gamma productioncross-section of the 573.88 keV transition and overestimates it in the case of the703.44 keV transition.
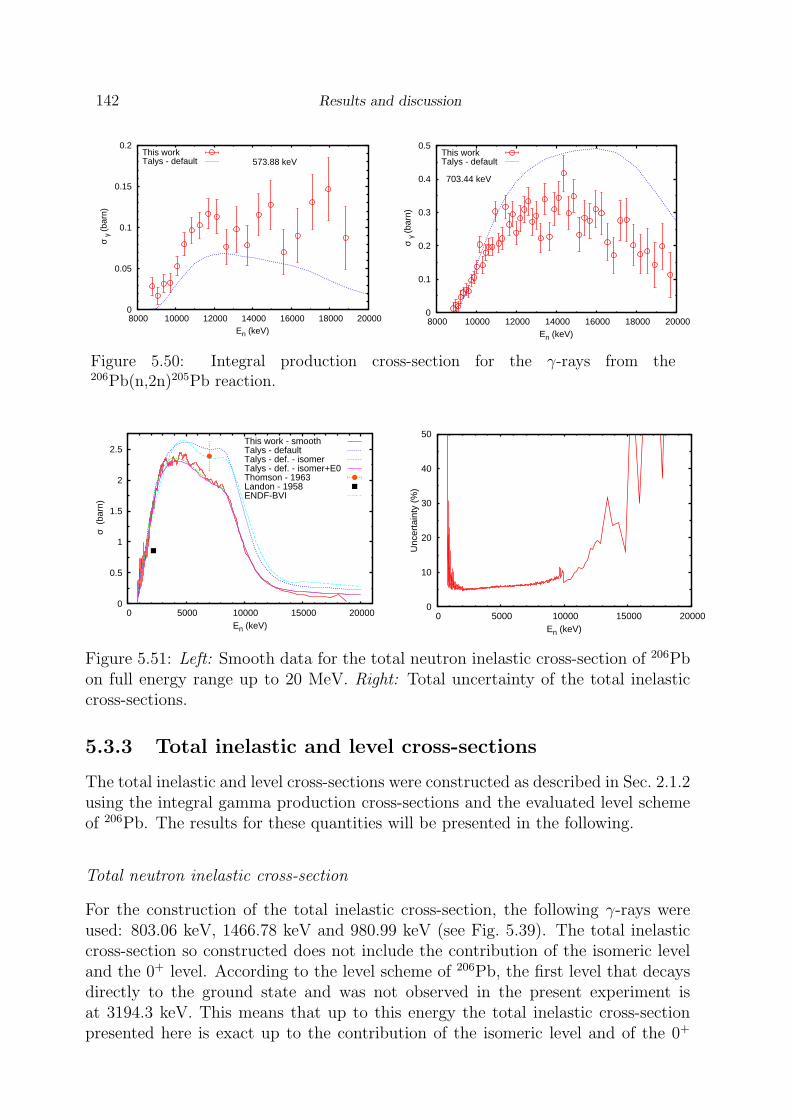
142 Results and discussion
0
0.05
0.1
0.15
0.2
8000 10000 12000 14000 16000 18000 20000
σ γ
(bar
n)
En (keV)
573.88 keVThis workTalys - default
0
0.1
0.2
0.3
0.4
0.5
8000 10000 12000 14000 16000 18000 20000
σ γ
(bar
n)
En (keV)
703.44 keV
This workTalys - default
Figure 5.50: Integral production cross-section for the γ-rays from the206Pb(n,2n)205Pb reaction.
0
0.5
1
1.5
2
2.5
0 5000 10000 15000 20000
σ (
barn
)
En (keV)
This work - smoothTalys - defaultTalys - def. - isomerTalys - def. - isomer+E0Thomson - 1963Landon - 1958ENDF-BVI
0
10
20
30
40
50
0 5000 10000 15000 20000
Unc
erta
inty
(%
)
En (keV)
Figure 5.51: Left: Smooth data for the total neutron inelastic cross-section of 206Pbon full energy range up to 20 MeV. Right: Total uncertainty of the total inelasticcross-sections.
5.3.3 Total inelastic and level cross-sections
The total inelastic and level cross-sections were constructed as described in Sec. 2.1.2using the integral gamma production cross-sections and the evaluated level schemeof 206Pb. The results for these quantities will be presented in the following.
Total neutron inelastic cross-section
For the construction of the total inelastic cross-section, the following γ-rays wereused: 803.06 keV, 1466.78 keV and 980.99 keV (see Fig. 5.39). The total inelasticcross-section so constructed does not include the contribution of the isomeric leveland the 0+ level. According to the level scheme of 206Pb, the first level that decaysdirectly to the ground state and was not observed in the present experiment isat 3194.3 keV. This means that up to this energy the total inelastic cross-sectionpresented here is exact up to the contribution of the isomeric level and of the 0+

February 2006 L.C.Mihailescu 143
0
0.5
1
σ (
barn
)
N,INLThis work
5
10
800 850 900 950 1000
σ (
barn
)
En (keV)
N,TOT ORELA
Figure 5.52: Full resolution total inelastic cross-section compared with the neutrontotal cross-section measured at ORELA et al. [?]
level. Above 3.2 MeV the present curve is a lower limit to the total inelastic cross-section. This limit is a very close to the exact value for the even-even nucleus of206Pb. In this case the total inelastic cross-section is determined mainly by thegamma production cross-section of the main transition.
The energy resolution was 1.1 keV at 1 MeV and 35 keV at 10 MeV. The resultis shown in Fig. 5.51 together with the corresponding total uncertainty. The totalrelative uncertainty is around 5 % at about 2 MeV and increases slowly for higherenergies. The large values of the relative total uncertainty at the extremities of theenergy interval are due to the poor statistics.
Two experimental points for the total inelastic cross-sections were found in theliterature (Ref. [141] and [143]). Both these pints differs from the present mea-surement. The Landon [143] data point at about 3 MeV is lower than the presentresults and the data point of Thomson [141] at about 7 MeV is higher. The Talyscalculation with the default parameters describes very well the present results afterthe correction for the isomer and for the E0 transition (Sec. 5.3.2). Fig. 5.51 Leftshows three different curves for the Talys calculation with the default parameters.The curve denoted ”def.-isomer” represents the default calculation from which itwas subtracted the isomer contribution. The curve denoted ”def.-isomer+E0” iscorrected for both, the isomer and the 0+ level. It can be seen that the contributiondue to the 0+ level is very small compared with the contribution of the isomer.
The ENDF-BVI evaluation (Fig. 5.51) gives higher values for the total inelasticcross-section because it includes the contribution of the isomer level. The JEFF 3.1evaluation was not plotted here because it coincides with the Talys calculation.
Fig. 5.52 shows the total inelastic cross-section below 1 MeV compared with the
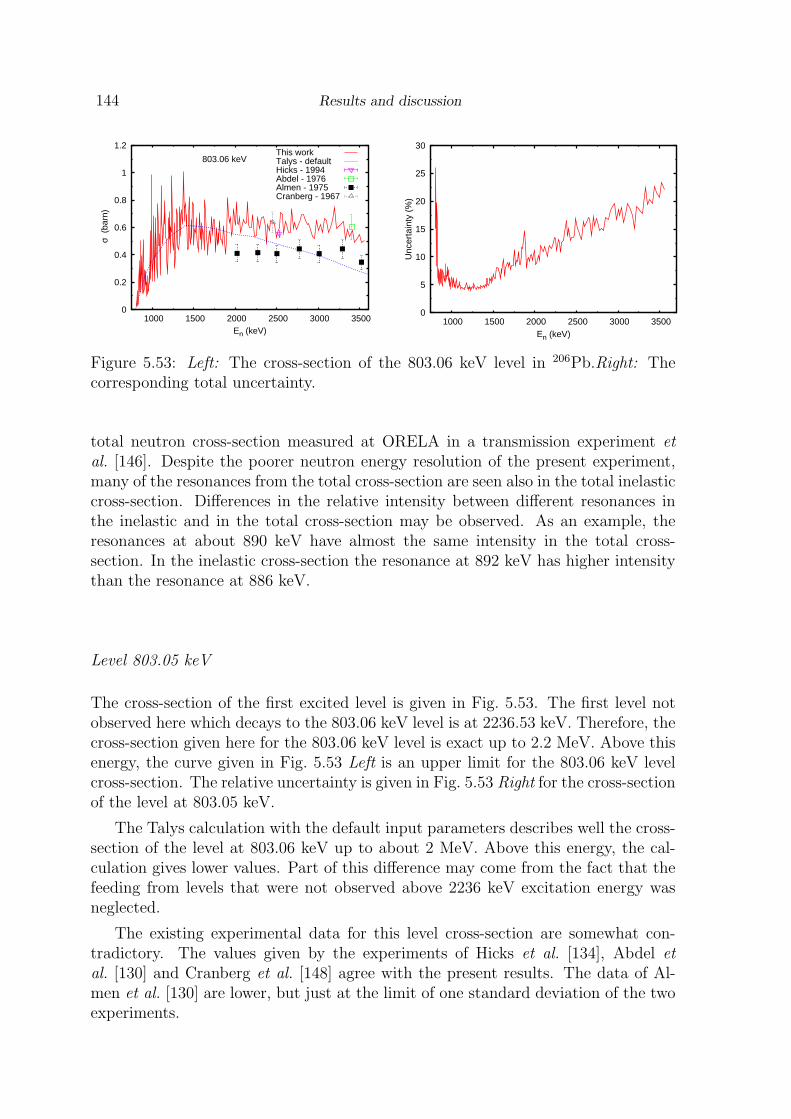
144 Results and discussion
0
0.2
0.4
0.6
0.8
1
1.2
1000 1500 2000 2500 3000 3500
σ (
barn
)
En (keV)
803.06 keVThis workTalys - defaultHicks - 1994Abdel - 1976Almen - 1975Cranberg - 1967
0
5
10
15
20
25
30
1000 1500 2000 2500 3000 3500
Unc
erta
inty
(%
)
En (keV)
Figure 5.53: Left: The cross-section of the 803.06 keV level in 206Pb.Right: Thecorresponding total uncertainty.
total neutron cross-section measured at ORELA in a transmission experiment etal. [146]. Despite the poorer neutron energy resolution of the present experiment,many of the resonances from the total cross-section are seen also in the total inelasticcross-section. Differences in the relative intensity between different resonances inthe inelastic and in the total cross-section may be observed. As an example, theresonances at about 890 keV have almost the same intensity in the total cross-section. In the inelastic cross-section the resonance at 892 keV has higher intensitythan the resonance at 886 keV.
Level 803.05 keV
The cross-section of the first excited level is given in Fig. 5.53. The first level notobserved here which decays to the 803.06 keV level is at 2236.53 keV. Therefore, thecross-section given here for the 803.06 keV level is exact up to 2.2 MeV. Above thisenergy, the curve given in Fig. 5.53 Left is an upper limit for the 803.06 keV levelcross-section. The relative uncertainty is given in Fig. 5.53 Right for the cross-sectionof the level at 803.05 keV.
The Talys calculation with the default input parameters describes well the cross-section of the level at 803.06 keV up to about 2 MeV. Above this energy, the cal-culation gives lower values. Part of this difference may come from the fact that thefeeding from levels that were not observed above 2236 keV excitation energy wasneglected.
The existing experimental data for this level cross-section are somewhat con-tradictory. The values given by the experiments of Hicks et al. [134], Abdel etal. [130] and Cranberg et al. [148] agree with the present results. The data of Al-men et al. [130] are lower, but just at the limit of one standard deviation of the twoexperiments.

February 2006 L.C.Mihailescu 145
0
0.1
0.2
0.3
0.4
1500 2000 2500 3000 3500
σ (
barn
)
En (keV)
1340.47 keV
This workTalys - defaultHicks - 1994Almen - 1975
0
0.1
0.2
0.3
1500 2000 2500 3000 3500
σ (
barn
)
En (keV)
1466.8 keV
This workTalys - defaultHicks - 1994Almen - 1975
0
0.1
0.2
1500 2000 2500 3000 3500
σ (
barn
)
En (keV)
1683.96 keV
This workTalys - default
0
0.05
0.1
0.15
1500 2000 2500 3000 3500
σ (
barn
)
En (keV)
1704.46 keV
This workTalys - default
0
0.02
0.04
0.06
0.08
0.1
0.12
0.14
0.16
0.18
0.2
1500 2000 2500 3000 3500
σ (
barn
)
En (keV)
1784.08 keV
This workTalys - default
0
0.02
0.04
0.06
0.08
0.1
0.12
0.14
2000 2500 3000 3500
σ (
barn
)
En (keV)
1997.65 keV
This workTalys - default
0
0.02
0.04
0.06
0.08
0.1
0.12
2000 2500 3000 3500
σ (
barn
)
En (keV)
2147.9 keV
This workTalys - default
0
0.02
0.04
0.06
0.08
0.1
0.12
0.14
0.16
2000 2500 3000 3500
σ (
barn
)
En (keV)
2196.7 keV
This workTalys - default
Figure 5.54: The cross-section of the excited levels above 1.3 MeV in 206Pb. Genericerror bars are plotted at the extremities of the energy interval.

146 Results and discussion
0
0.02
0.04
0.06
0.08
0.1
2500 3000 3500
σ (
barn
)
En (keV)
2423.36 keV
This workTalys - default
0
0.05
0.1
0.15
2400 2600 2800 3000 3200 3400 3600
σ (
barn
)
En (keV)
2647.77 keV
This workTalys - default
Figure 5.55: The cross-section of the excited levels above 1.3 MeV in 206Pb.
Levels with higher excitation energy
The cross-sections of the levels with excitation energy between 1340.47 keV and2647.77 keV are given in Figs. 5.54 and 5.55. These cross-sections were given onlyup to about 3.5 MeV neutron energy, because 3.56 MeV is the highest excited levelobserved in this experiment.
Above 2.2 MeV excitation energy some excited levels were not observed. Becauseof this, above 2.2 MeV neutron energy, the level cross-sections presented here areupper limits to the exact values. The difference to the exact values reflects theintensity of the excited levels not observed in this experiment. The cross-section ofthese levels has to be weak such as the transitions that decay from them to havea cross-section of less than 20 mb, which is the approximate observation limit ofthe present measurement. Generic error bars are plotted at the extremities of theenergy interval for every level cross-section.
Previous experimental data were found only for the levels at 1340.47 keV and at1466.8 keV. The data of Almen et al. [130] are lower than the present results. Thevalues of Hicks et al. [134] at about 2.5 MeV are in good agreement with the presentone.
The Talys calculation with the default input parameters is plotted together withthe present results (Figs. 5.54 and 5.55). No correction of the calculated curves wasneeded for the level cross-sections for the presence of the isomer and the 0+ level.
Below 2.5 MeV neutron energy, the agreement between the calculation and thepresent measurement is good for the majority of the levels presented here. Above2.5 MeV, the calculation gives lower values than the present measurement for the lev-els at 1340.47 keV, 1683.96 KeV, 1704.46 keV, 2423.36 keV and 2647.77 keV. Thesedifferences are in accord to the approximation of the lower limit above 2.5 MeV forthe present measurement. For the level at 1997.65 keV, the calculation gives highervalues than the measurement. This is a contradiction of the lower limit approxima-tion. For the other levels presented here the calculation describes relatively well themeasurement also above 2.5 MeV.
It has to be noted that the Talys calculation with the default input parameters
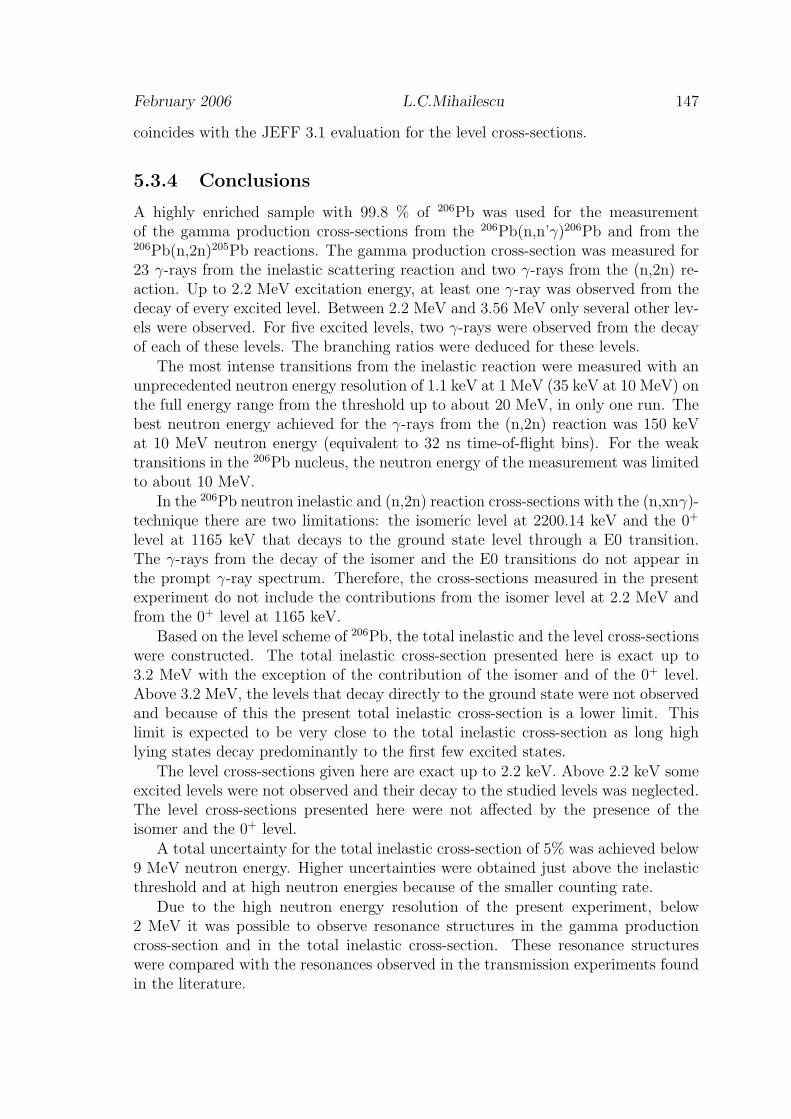
February 2006 L.C.Mihailescu 147
coincides with the JEFF 3.1 evaluation for the level cross-sections.
5.3.4 Conclusions
A highly enriched sample with 99.8 % of 206Pb was used for the measurementof the gamma production cross-sections from the 206Pb(n,n’γ)206Pb and from the206Pb(n,2n)205Pb reactions. The gamma production cross-section was measured for23 γ-rays from the inelastic scattering reaction and two γ-rays from the (n,2n) re-action. Up to 2.2 MeV excitation energy, at least one γ-ray was observed from thedecay of every excited level. Between 2.2 MeV and 3.56 MeV only several other lev-els were observed. For five excited levels, two γ-rays were observed from the decayof each of these levels. The branching ratios were deduced for these levels.
The most intense transitions from the inelastic reaction were measured with anunprecedented neutron energy resolution of 1.1 keV at 1 MeV (35 keV at 10 MeV) onthe full energy range from the threshold up to about 20 MeV, in only one run. Thebest neutron energy achieved for the γ-rays from the (n,2n) reaction was 150 keVat 10 MeV neutron energy (equivalent to 32 ns time-of-flight bins). For the weaktransitions in the 206Pb nucleus, the neutron energy of the measurement was limitedto about 10 MeV.
In the 206Pb neutron inelastic and (n,2n) reaction cross-sections with the (n,xnγ)-technique there are two limitations: the isomeric level at 2200.14 keV and the 0+
level at 1165 keV that decays to the ground state level through a E0 transition.The γ-rays from the decay of the isomer and the E0 transitions do not appear inthe prompt γ-ray spectrum. Therefore, the cross-sections measured in the presentexperiment do not include the contributions from the isomer level at 2.2 MeV andfrom the 0+ level at 1165 keV.
Based on the level scheme of 206Pb, the total inelastic and the level cross-sectionswere constructed. The total inelastic cross-section presented here is exact up to3.2 MeV with the exception of the contribution of the isomer and of the 0+ level.Above 3.2 MeV, the levels that decay directly to the ground state were not observedand because of this the present total inelastic cross-section is a lower limit. Thislimit is expected to be very close to the total inelastic cross-section as long highlying states decay predominantly to the first few excited states.
The level cross-sections given here are exact up to 2.2 keV. Above 2.2 keV someexcited levels were not observed and their decay to the studied levels was neglected.The level cross-sections presented here were not affected by the presence of theisomer and the 0+ level.
A total uncertainty for the total inelastic cross-section of 5% was achieved below9 MeV neutron energy. Higher uncertainties were obtained just above the inelasticthreshold and at high neutron energies because of the smaller counting rate.
Due to the high neutron energy resolution of the present experiment, below2 MeV it was possible to observe resonance structures in the gamma productioncross-section and in the total inelastic cross-section. These resonance structureswere compared with the resonances observed in the transmission experiments foundin the literature.
148 Results and discussion
The measured cross-section were compared with the existing data found in theliterature and with the Talys calculation with the default parameters. A smallamount of previously measured data were found and in general poor agreement wasobserved with these data.
For a correct comparison of the measured cross-sections in this experiment withthe Talys calculation, the later was corrected for the contributions of the isomer and0+ level. For the gamma production cross-section of the two most intense γ-raysin 206Pb, the corrected Talys calculation with the default input parameters is in ageneral good agreement with the measured data on the full energy range. For theother γ-rays the measured production cross-sections agree well with the correctedTalys calculation at low neutron energies. Differences appear above 3.5 MeV. Thetotal inelastic cross-section without the contribution of the isomer and the 0+ levelagree generally well with the corrected Talys calculation on the full energy range,from the inelastic threshold up to about 20 MeV.
The present measurement provided a large amount of cross-section data for theneutron inelastic and (n,2n) reactions. The improvement brought by this new ex-periment to the neutron inelastic and (n,2n) reactions cross-section consists of thevery good neutron energy resolution, the very good total uncertainty and the largenumber of observed γ-rays. Such cross-section can be used in the further neutrondata evaluations and as benchmark for the nuclear codes.

February 2006 L.C.Mihailescu 149
5.4 207Pb neutron inelastic scattering and (n,2n)
cross-sections
5.4.1 Introduction
Few experimental data exist for the 207Pb neutron inelastic and (n,2n) cross-sections.Three measurements were done with (n,n’γ)-technique (Lashuk et al. [130], Ya-mamoto et al. [147] and Day et al. [149]). From these experiments only Lashuk etal. [130] and Yamamoto et al. [147] used the advantage of the Ge(Li) detectors forthe γ-ray identification in the spectrum. The (n,n’)-technique was used by Cranberget al. [148], Abdel et al. [130] and Almen et al. [130]. The first author measuredonly the differential level cross-sections.
The production cross-section of the main γ-ray in the 207Pb(n,2n)206Pb reactionwas measured by Vonach et al. [152]. In the experiment of Vonach et al. [152] the(n,n’γ) reaction was not analyzed because of the overlap of the low energy neutronsfrom consecutive bursts.
As in the case of 206Pb nucleus, 207Pb has an isomer at relatively low excitationenergy, 1633.36 MeV (Fig. 5.56). The isomer in 207Pb has a life time of 0.806 swhich is much larger than the period between two consecutive bursts at GELINA(1.25 ms). In these conditions it was found that the prompt decay of the isomerlevel is negligible. Therefore the cross-sections measured in the present experimentdo not include any contribution from the isomer. For a proper comparison with thedefault Talys calculation, the theoretical cross-sections for some γ-rays and for thetotal inelastic cross-section have to be corrected for the contribution of the isomer.
From the five samples studied in this work, the 207Pb sample was the first casewhere the sample enrichment was only 92.40 % and the concentrations of the im-purities of 206Pb and 208Pb isotopes could not be neglected. Therefore, additionalcorrections for the (n,xnγ) reactions on different isotopes were needed. Table. 5.3shows how the residual nuclei (γ-ray peaks) were produced with the present 207Pbsample. The threshold of the γ-ray production is indicated as well. As an exam-ple, Fig. 5.57 shows the yield of the 803.06 keV transition from the 206Pb residualnucleus. This γ-ray peak resulted mainly from the 207Pb(n,2nγ)206Pb reaction, but
Table 5.3: Corrections for the isotopic composition of 207Pb sample. The residualnuclei 207Pb and 206Pb can be produced in different reactions on the 92.4 % en-riched sample. The threshold is given for the γ-ray production in different reactions.
residual nucleus reaction content in the sample threshold (MeV)207Pb 207Pb(n,n’γ)207Pb 92.40 % 0.572
208Pb(n,2nγ)207Pb 5.48 % 7.975206Pb 206Pb(n,n’γ)206Pb 2.16 % 0.806
207Pb(n,2nγ)206Pb 92.40 % 7.57208Pb(n,3nγ)206Pb 5.48 % 14.98
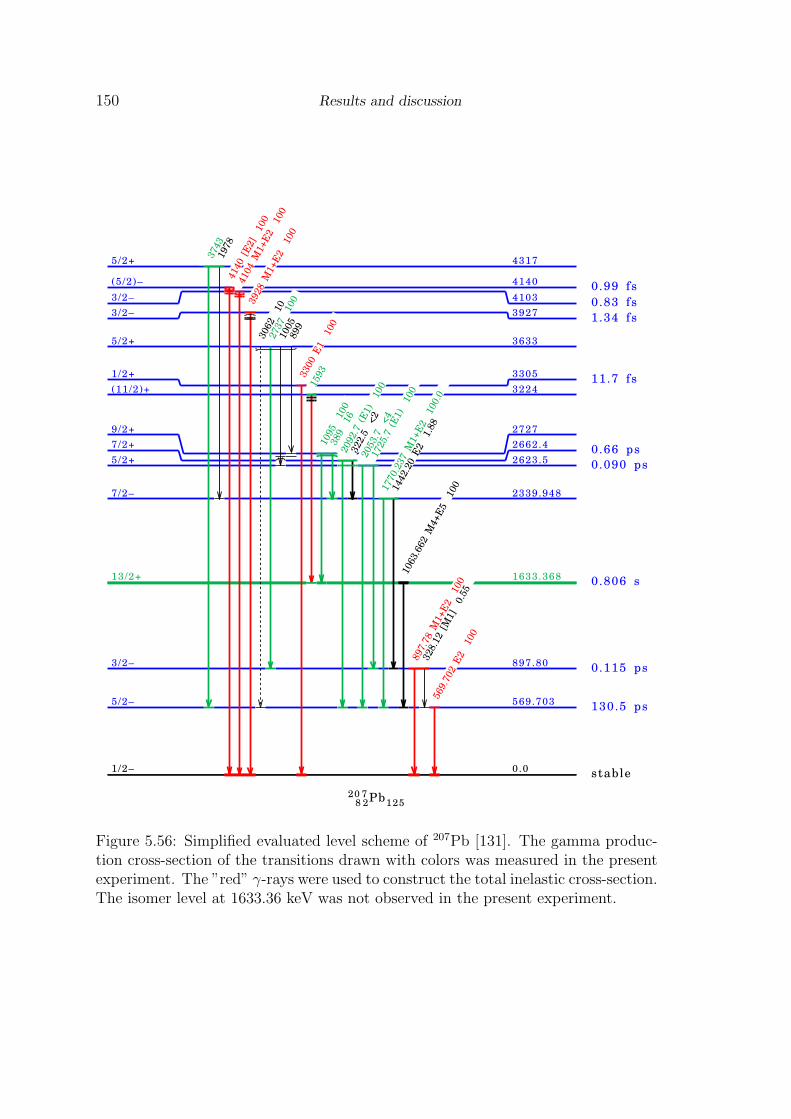
150 Results and discussion
208
72Pb125
1/2– 0.0 stable
5/2– 569.703 130.5 ps
3/2– 897.80 0.115 ps
13/2+ 1633.368 0.806 s
7/2– 2339.948
5/2+ 2623.5 0.090 ps
7/2+ 2662.4 0.66 ps
9/2+ 2727
(11/2)+ 3224
1/2+ 3305 11.7 fs
5/2+ 3633
3/2– 3927 1.34 fs
3/2– 4103 0.83 fs
(5/2)– 4140 0.99 fs
5/2+ 4317
569.7
02 E
2
100
328.1
2 [
M1]
0.5
5
897.7
8 M
1+E
2
100
1063.6
62 M
4+E
5
1001442.2
0 E
2
1.8
8
1770.2
37 M
1+E
2
100.0
1725.7
(E
1)
100
2053.7
<4
322.5
<2
2092.7
(E
1)
100
389
16
1095
100
1593
3300 E
1
100
899
1005
2737
100
3062
103
928 M
1+E
2
100
4104 M
1+E
2
100
4140 [
E2]
100
1978
3743
Figure 5.56: Simplified evaluated level scheme of 207Pb [131]. The gamma produc-tion cross-section of the transitions drawn with colors was measured in the presentexperiment. The ”red” γ-rays were used to construct the total inelastic cross-section.The isomer level at 1633.36 keV was not observed in the present experiment.
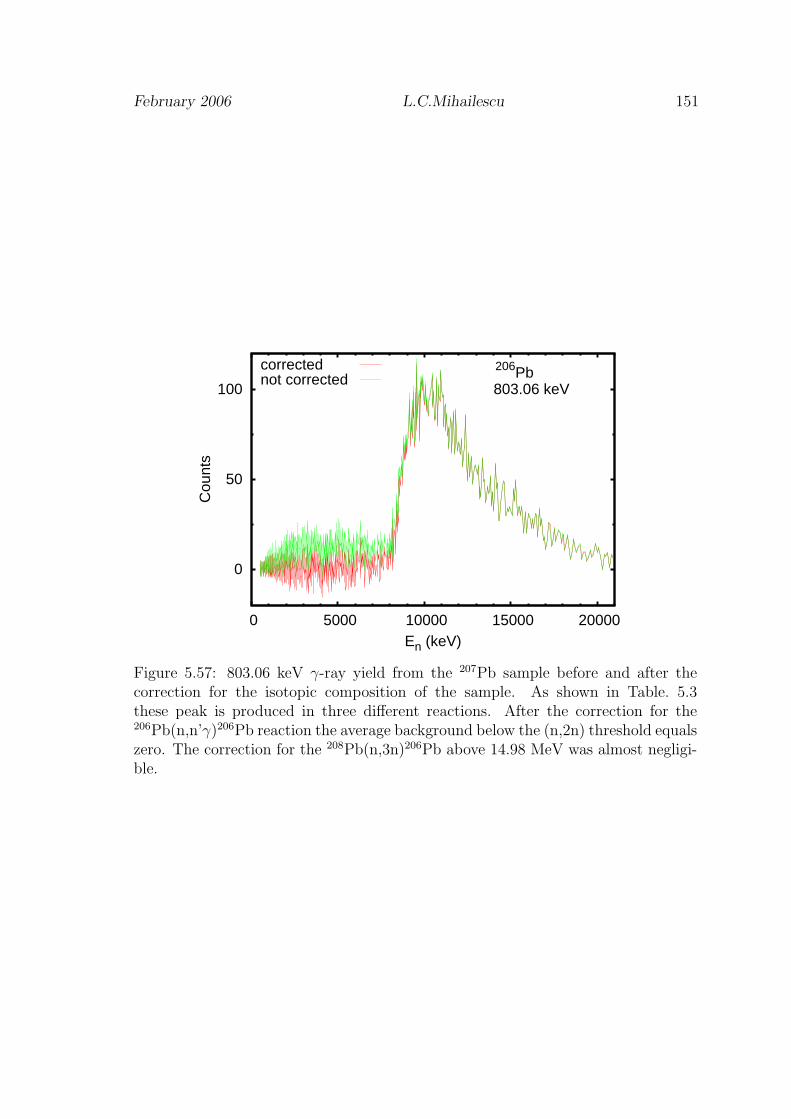
February 2006 L.C.Mihailescu 151
0
50
100
0 5000 10000 15000 20000
Cou
nts
En (keV)
206Pb803.06 keV
correctednot corrected
Figure 5.57: 803.06 keV γ-ray yield from the 207Pb sample before and after thecorrection for the isotopic composition of the sample. As shown in Table. 5.3these peak is produced in three different reactions. After the correction for the206Pb(n,n’γ)206Pb reaction the average background below the (n,2n) threshold equalszero. The correction for the 208Pb(n,3n)206Pb above 14.98 MeV was almost negligi-ble.
152 Results and discussion
clear evidence for the other two reactions is visible: the inelastic scattering reactionbelow 7 MeV and the (n,3nγ) reaction above 15 MeV. The corrections for the (n,xnγ)reaction on 207Pb sample were done using the measured cross-sections presented inthis work.
In the present measurement the gamma production cross-section was measuredfor 15 γ-rays from the 207Pb(n,n’γ)207Pb reaction (see Fig. 5.56) and four γ-raysfrom 207Pb(n,n’γ)207Pb reaction. The maximum energy of an observed excited levelin 207Pb was 4317 keV. In Fig. 5.56, the observed γ-rays are drawn with colors.Based on the evaluated level scheme, the total inelastic and the level cross-sectionwere constructed.
5.4.2 Gamma production cross-sections
Fig. 5.58 shows the γ-ray spectrum recorded with the HPGe detector at 150o. Thespectrum was integrated over the neutron energy from just below the inelasticthreshold up to 25 MeV. The most intense peaks in the spectrum are by far thepeaks at 569.70 keV and 897.78 keV. The gamma production cross-section for allthe measured transitions will be given in the following. The differential gamma pro-duction cross-section will be shown as an example for the 569.70 keV and 897.78 keVtransitions. The angle integration was done using the Gauss quadrature describedin Sec. 2.3.3.
569.70 keV
The 569.70 keV is the most intense transition in the 207Pb spectrum. The differentialgamma production of this transition is shown in Fig. 5.59 for the two angles: 110o
and 150o. The typical angular distribution for an E2 transition is observed. The ratiobetween the angular distribution W(θ) at 150o and 110o is given in Fig. 5.59 Right.No clear energy dependence of this ratio was observed.
The very good neutron energy resolution of the present experiment allowed theobservation of the resonance structures in the gamma production cross-section be-tween the inelastic threshold and about 2.5 MeV. The full resolution data for thedifferential and the angle integrated gamma production cross-section is shown inFig. 5.60.
The angle integrated gamma production cross-section on the full energy rangefrom the threshold up to 20 MeV is given in Fig. 5.61. The present data weresmoothed with moving average filter only for an easier comparison with the otherdata. The width of the filter was 11 neutron energy bins (equivalent of 88 ns time-of-flight). The neutron energy resolution of this cross-section was 1.1 keV at 1 MeVand 35 keV at 10 MeV.
A total uncertainty of about 5 % was obtained between 2 MeV and 7 MeV(Fig. 5.61 Right). Above 7 MeV the statistical uncertainty starts to increase due tothe small counting rate and becomes the dominant component in the total uncer-tainty. To reduce the total uncertainty, few energy bins were grouped together atthe expense of lower energy resolution. This grouping procedure produced the steps
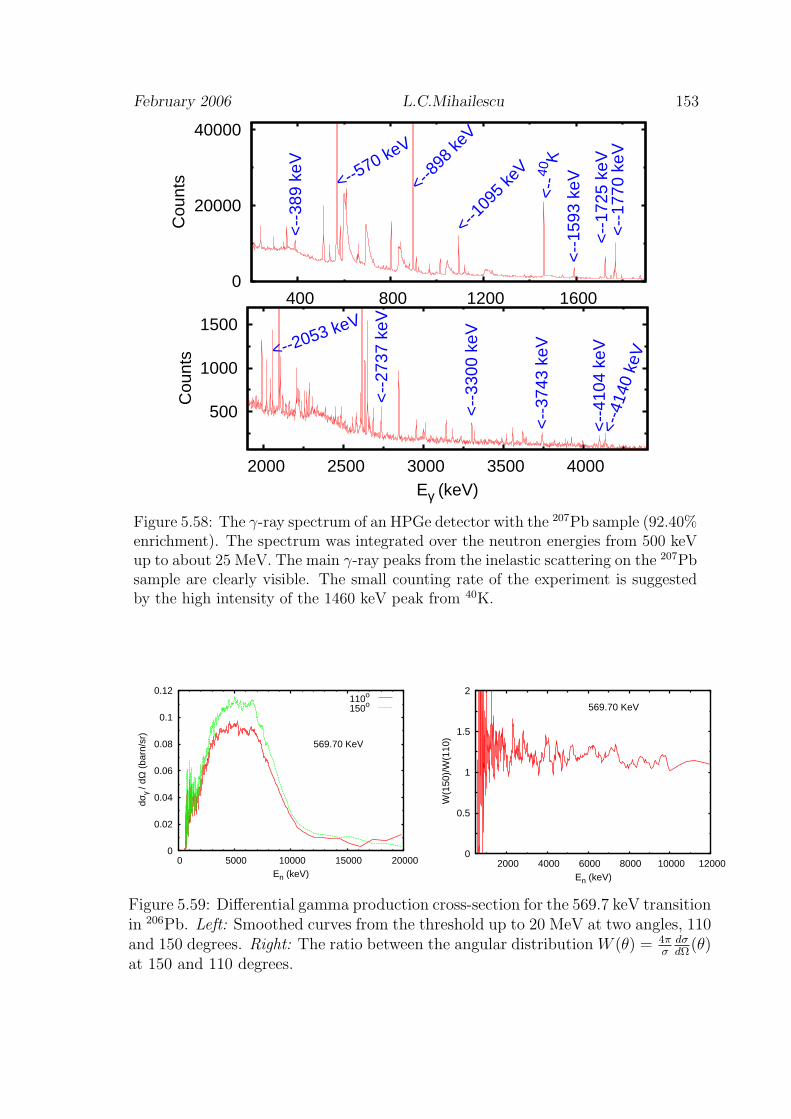
February 2006 L.C.Mihailescu 153
0
20000
40000
400 800 1200 1600
Cou
nts <--5
70 keV
<--8
98 ke
V
<--
389
keV
<--1
095
keV
<--
1725
keV
<--
1770
keV
<--
1593
keV<--40
K
500
1000
1500
2000 2500 3000 3500 4000
Cou
nts
Eγ (keV)
<--2053 keV
<--
2737
keV
<--
3300
keV
<--
3743
keV
<--
4104
keV
<--4
140
keV
Figure 5.58: The γ-ray spectrum of an HPGe detector with the 207Pb sample (92.40%enrichment). The spectrum was integrated over the neutron energies from 500 keVup to about 25 MeV. The main γ-ray peaks from the inelastic scattering on the 207Pbsample are clearly visible. The small counting rate of the experiment is suggestedby the high intensity of the 1460 keV peak from 40K.
0
0.02
0.04
0.06
0.08
0.1
0.12
0 5000 10000 15000 20000
dσ γ
/ dΩ
(ba
rn/s
r)
En (keV)
569.70 KeV
110o
150o
0
0.5
1
1.5
2
2000 4000 6000 8000 10000 12000
W(1
50)/
W(1
10)
En (keV)
569.70 KeV
Figure 5.59: Differential gamma production cross-section for the 569.7 keV transitionin 206Pb. Left: Smoothed curves from the threshold up to 20 MeV at two angles, 110and 150 degrees. Right: The ratio between the angular distribution W (θ) = 4π
σdσdΩ
(θ)at 150 and 110 degrees.

154 Results and discussion
0
0.02
0.04
0.06
0.08
0.1
0.12
600 650 700 750
dσ γ
/ dΩ
(ba
rn/s
r)
En (keV)
569.70 KeV110150
0
0.2
0.4
0.6
0.8
1
600 650 700 750
σ γ
(bar
n)En (keV)
569.70 keVThis workTalys - default - isomer
Figure 5.60: Full resolution gamma production cross-section for the 569.7 keV tran-sition in 207Pb. Left: Differential gamma production cross-section at 110o and 150o.Right: Integral gamma production cross-section compared with Talys calculation.
0
0.5
1
1.5
2
0 5000 10000 15000 20000
σ γ
(bar
n)
En (keV)
569.70 keVThis work - smoothTalys - defaultTalys - default - isomerDay - 1956Yamamoto- 1978
0
5
10
15
20
25
30
0 5000 10000 15000 20000
Rel
ativ
e U
ncer
tain
ty (
%)
En (keV)
569.70 keV
Figure 5.61: Left: Integral gamma production cross-section for the 569.7 keV tran-sition in 207Pb. Full energy scale from threshold up to 20 MeV. The data weresmoothed with an averaging moving window filter for an easier comparison withother data. Right: The corresponding total uncertainty.

February 2006 L.C.Mihailescu 155
0
0.01
0.02
0.03
0.04
0.05
0 5000 10000 15000 20000
dσ γ
/ dΩ
(ba
rn/s
r)
En (keV)
897.78 KeV
110o
150o
0
0.5
1
1.5
2
2000 4000 6000 8000 10000 12000
W(1
50)/
W(1
10)
En (keV)
896.78 KeV
Figure 5.62: Differential gamma production cross-section for the 897.78 keV tran-sition in 207Pb. Left: Smoothed curves from the threshold up to 20 MeV at twoangles, 110o and 150o. Right: The ratio between the angular distribution W(θ) at150o and 110o.
in the uncertainty plot (Fig. 5.61 Right).
Only two measured points were found in the literature. The Yamamoto etal. [147] data are very high compared with the present results. The Day et al. [149]point at low energies agrees well with the present results.
For the comparison with the present experimental data, the Talys calculationwith the default input parameters was corrected for the isomer level. The isomerlevel at 1633.37 keV decays directly to the first excited level. The Talys code neglectsthe long decay time of the isomer and considers the 1063.66 keV transition as aprompt γ-ray (Fig. 5.56). The calculated gamma production cross-section of the1063.66 keV transition was subtracted from the calculated gamma production cross-section of the 569.702 keV transition. Fig. 5.61 shows both, the isomer corrected andthe uncorrected Talys calculated curves. After the isomer correction, the calculationdescribes well the measured data on the full energy range.
897.78 keV
The 897.78 keV γ-ray from the decay of the second excited state to the ground state isan M1+E2 transition. Almost no angle dependence was observed for this transition(Fig. 5.62). This can be also observed from the ratio between the differential gammaproduction cross-sections at the two angles, which equals unity.
Fig. 5.63 gives the integral gamma production cross-section from the threshold(901 keV) up to 20 MeV. The same neutron energy resolution was used as in thecase of the 569.70 keV transition. The resonance structures above the threshold arevisible well for this transition up to about 2 MeV.
The point of Day et al. [149] at about 3 MeV is slightly higher than the presentmeasurement. As in the case of the main transition, the value from the measurementof Yamamoto et al. [147] is higher. For the 897.78 keV transition no correction ofthe Talys calculation is needed for the decay of the isomer, because there is no
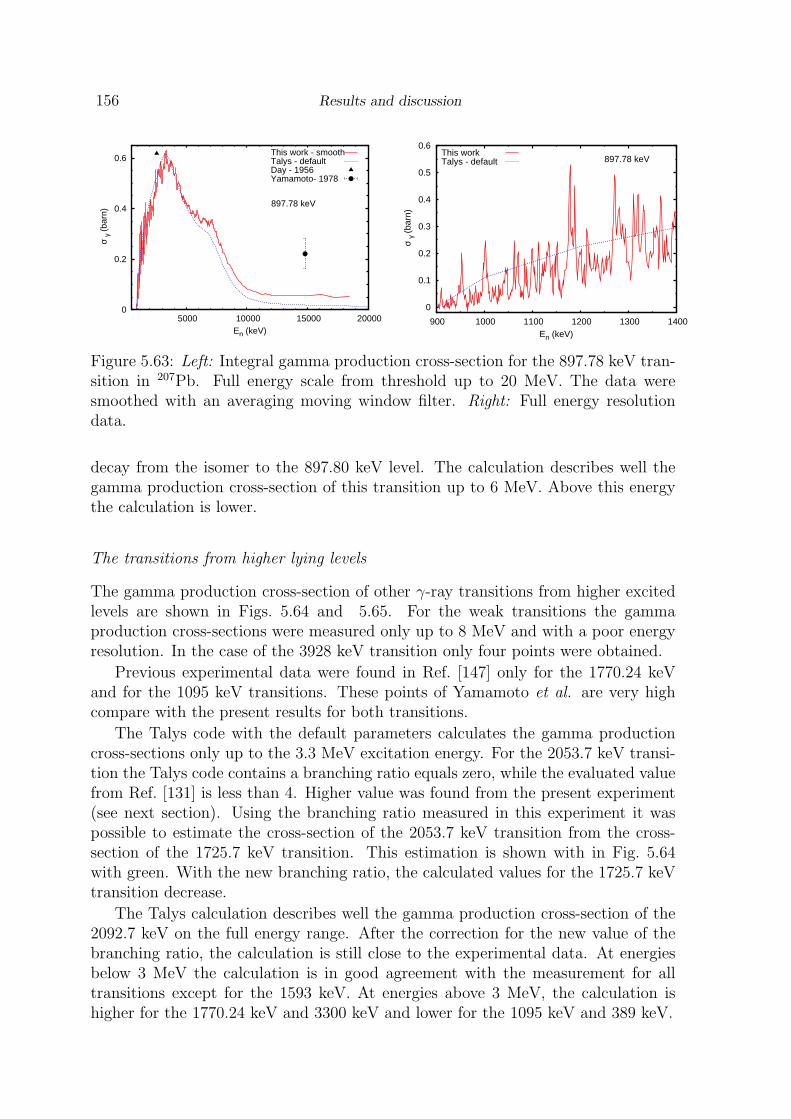
156 Results and discussion
0
0.2
0.4
0.6
5000 10000 15000 20000
σ γ
(bar
n)
En (keV)
897.78 keV
This work - smoothTalys - defaultDay - 1956Yamamoto- 1978
0
0.1
0.2
0.3
0.4
0.5
0.6
900 1000 1100 1200 1300 1400
σ γ
(bar
n)
En (keV)
897.78 keVThis workTalys - default
Figure 5.63: Left: Integral gamma production cross-section for the 897.78 keV tran-sition in 207Pb. Full energy scale from threshold up to 20 MeV. The data weresmoothed with an averaging moving window filter. Right: Full energy resolutiondata.
decay from the isomer to the 897.80 keV level. The calculation describes well thegamma production cross-section of this transition up to 6 MeV. Above this energythe calculation is lower.
The transitions from higher lying levels
The gamma production cross-section of other γ-ray transitions from higher excitedlevels are shown in Figs. 5.64 and 5.65. For the weak transitions the gammaproduction cross-sections were measured only up to 8 MeV and with a poor energyresolution. In the case of the 3928 keV transition only four points were obtained.
Previous experimental data were found in Ref. [147] only for the 1770.24 keVand for the 1095 keV transitions. These points of Yamamoto et al. are very highcompare with the present results for both transitions.
The Talys code with the default parameters calculates the gamma productioncross-sections only up to the 3.3 MeV excitation energy. For the 2053.7 keV transi-tion the Talys code contains a branching ratio equals zero, while the evaluated valuefrom Ref. [131] is less than 4. Higher value was found from the present experiment(see next section). Using the branching ratio measured in this experiment it waspossible to estimate the cross-section of the 2053.7 keV transition from the cross-section of the 1725.7 keV transition. This estimation is shown with in Fig. 5.64with green. With the new branching ratio, the calculated values for the 1725.7 keVtransition decrease.
The Talys calculation describes well the gamma production cross-section of the2092.7 keV on the full energy range. After the correction for the new value of thebranching ratio, the calculation is still close to the experimental data. At energiesbelow 3 MeV the calculation is in good agreement with the measurement for alltransitions except for the 1593 keV. At energies above 3 MeV, the calculation ishigher for the 1770.24 keV and 3300 keV and lower for the 1095 keV and 389 keV.

February 2006 L.C.Mihailescu 157
0
0.1
0.2
0.3
0.4
5000 10000 15000 20000
σ γ
(bar
n)
En (keV)
1770.24 keV
This workTalys - defaultYamamoto- 1978
0
0.01
0.02
0.03
0.04
5000 10000
σ γ
(bar
n)
En (keV)
2053.7 keV
This workTalys - corrected branching
0
0.05
0.1
0.15
0.2
5000 10000 15000
σ γ
(bar
n)
En (keV)
1725.7 keV
This workTalys - defaultTalys - corrected branching
0
0.05
0.1
0.15
0.2
0.25
0.3
5000 10000 15000
σ γ
(bar
n)
En (keV)
2092.7 keV
This workTalys - default
0
0.05
0.1
0.15
0.2
0.25
0.3
0.35
5000 10000 15000
σ γ
(bar
n)
En (keV)
1095 keV This workTalys - defaultYamamoto- 1978
0
0.01
0.02
0.03
0.04
0.05
0.06
0.07
5000 10000
σ γ
(bar
n)
En (keV)
389.0 keV
This workTalys - default
0
0.02
0.04
0.06
0.08
0.1
0.12
5000 10000 15000 20000
σ γ
(bar
n)
En (keV)
1593 keV
This workTalys - default
0
0.01
0.02
0.03
0.04
2000 4000 6000 8000 10000
σ γ
(bar
n)
En (keV)
3300 keV
This workTalys - default
Figure 5.64: Integral gamma production cross-section for the transitions from higherlying levels in 207Pb. New intensity ratio was found for the γ-rays of energy1725.7 keV and 2053.7 keV. Using this new value, a calculated curve can be de-duced from the Talys default calculation.
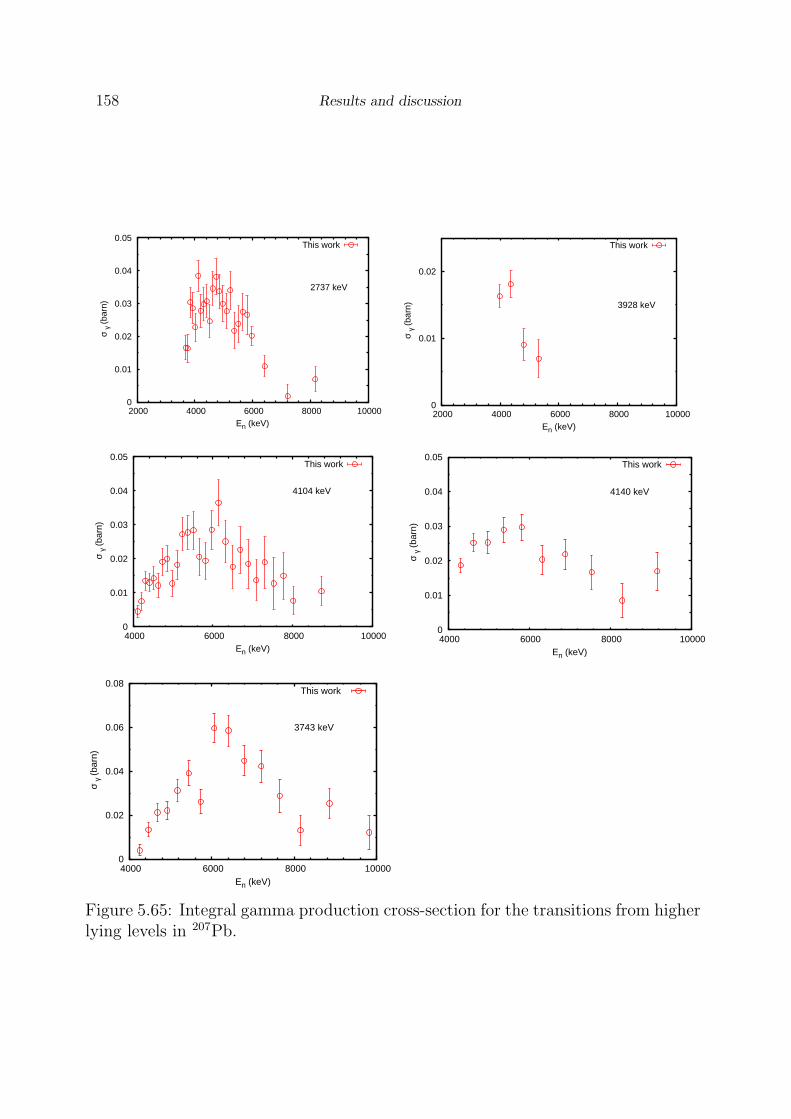
158 Results and discussion
0
0.01
0.02
0.03
0.04
0.05
2000 4000 6000 8000 10000
σ γ
(bar
n)
En (keV)
2737 keV
This work
0
0.01
0.02
2000 4000 6000 8000 10000 σ
γ (b
arn)
En (keV)
3928 keV
This work
0
0.01
0.02
0.03
0.04
0.05
4000 6000 8000 10000
σ γ
(bar
n)
En (keV)
4104 keV
This work
0
0.01
0.02
0.03
0.04
0.05
4000 6000 8000 10000
σ γ
(bar
n)
En (keV)
4140 keV
This work
0
0.02
0.04
0.06
0.08
4000 6000 8000 10000
σ γ
(bar
n)
En (keV)
3743 keV
This work
Figure 5.65: Integral gamma production cross-section for the transitions from higherlying levels in 207Pb.

February 2006 L.C.Mihailescu 159
Table 5.4: Branching ratios for levels in 207Pb nucleus and the correspondingabsolute uncertainties. The present results are compared with the values from theevaluated level scheme [131].
Elevel(keV) Eγ Present results ENSDFIntensity Uncertainty Intensity Uncertainty
2623.5 1725.7 100 - 100 -2053.7 18.6 3.4 <4 -
2727 389 21.1 4.7 16 -1095 100 - 100 -
Branching ratios
For each of the levels at 2623.5 keV and 2727 keV excitation energy two γ-rayswere observed (Fig. 5.56). From the integral gamma production cross-sections ofthis transitions (Fig. 5.64) the relative intensities (branching ratios) were deduced.These ratios were calculated from the gamma production cross-sections integratedover the same interval of neutron energy. Within the statistical fluctuations, thebranching ratios of the two levels are constant with the neutron energy. The samethreshold was observed for the γ-rays from the decay of every excited level. Thesetwo observation are an additional support for the correct identification of the γ-raysin the spectrum.
In Table. 5.4, the present branching ratios were compared with the evaluatedvalues [131]. The present value for branching ratio of the 2053.7 keV transition ishigher than the evaluated value. For the transitions from the level at 2727 keV thepresent values agree with the evaluated [131] values within the uncertainties.
(n,2n) gamma production cross-sections
For an identification of the γ-rays from the 207Pb(n,2n)206Pb reaction, the gammaray spectrum was integrated over the neutron energies from about 7 MeV up to25 MeV (Fig. 5.66). Four γ-rays from the (n,2n) reaction were observed. Thesepeaks have contributions from the other (n,xn) reactions of different Pb isotopesin the sample as described in Table. 5.3. Only the cross-section of the 803.06 keVtransition was corrected for the contribution from 208Pb(n,3n)206Pb reaction andthat correction was very small (see Fig. 5.57). No correction was applied for theneutron attenuation and multiple scattering in the 207Pb sample for these (n,2n)cross-sections.
At energies above 7 MeV the peak intensities of the 803.06 keV from the (n,2n)reaction and of the 897.78 keV from the (n,n’γ) reaction are comparable. Fig. 5.67shows the gamma production cross-section for the four transitions observed in the207Pb(n,2n)206Pb reaction. In the case of the 803.06 keV transition, the data ofVonach et al. [152] are slightly above the present results. For the other three tran-sitions there is no other experimental data.
The energy resolution for the 803.06 keV was 35 keV at 10 MeV up to 200 keV

160 Results and discussion
1000
2000
3000
4000
500 1000 1500 2000
Cou
nts
Eγ (keV)
<---
803
keV
<--5
37 ke
V
<--
880
keV
<--
1704
keV
<--8
97 ke
V - 20
7 Pb
Figure 5.66: γ-rays spectrum for the 207Pb measurement (92.4 keV% enriched sam-ple) integrated over neutron energies from 6.7 MeV to about 25 MeV. The 803.06 keVand 537.47 keV γ-ray peaks from the 207Pb(n,2n)206Pb reaction are seen well in sucha spectrum.

February 2006 L.C.Mihailescu 161
0
0.5
1
1.5
2
2.5
5000 10000 15000 20000
σ γ
(bar
n)
En (keV)
803.06 keVThis workVonach - 1994Talys - defaultTalys - default - E0Talys - default - all
0
0.2
0.4
0.6
0.8
10000 15000 20000
σ γ
(bar
n)
En (keV)
537.47 keVThis workTalys - defaultTalys - default - all
0
0.2
0.4
0.6
10000 15000 20000
σ γ
(bar
n)
En (keV)
880.98 keVThis workTalys - default
0
0.02
0.04
0.06
0.08
10000 15000 20000
σ γ
(bar
n)
En (keV)
1704.45 keV
This workTalys - default
Figure 5.67: Integral production cross-section for the γ-rays from the207Pb(n,2n)206Pb reaction.

162 Results and discussion
at 19.5 MeV. A minimum of 8 % total uncertainty around 10 MeV was achieved.For the other three transitions a lower neutron energy resolution was used.
The (n,2n) cross-section measurement for 207Pb is limited by the presence of the0+ level at 1165 keV and an isomer at 2200.14 keV in the residual nucleus of 206Pb.The γ-rays from the decay of the isomer and the E0 transition were not observed inthe prompt γ-ray spectrum. The measured gamma production cross-sections fromthe 207Pb(n,2n)206Pb reaction do not contain any contribution from the isomer andfrom 0+ level. For a correct comparison with the present measurement, the Talyscalculation with the input parameters has to be corrected for the isomer and forthe E0 transition. This means that the calculated gamma production cross-sectionsof the γ-rays from the isomer have to be subtracted from the calculated gammaproduction cross-section of the transition that is fed by the isomer or by the 0+
level.After the correction for both the E0 transition and the isomer in 206Pb, the Talys
calculation is close to the present measurement for the 803.06 keV transition and537.47 keV (Fig. 5.67). The differences that remained after the corrections for theisomer and for the E0 transition are at the limit of the uncertainty bars. Afterthe isomer correction, the calculation gives lower cross-sections for the 880.98 keVtransition, above 10 MeV. Above this energy the calculation gives negligible valueswhile the measurements gives cross-sections of the order of 200 mb. The 1704.45 keVtransition is not affected by the presence of the isomer in the level scheme of 207Pb.
5.4.3 Total inelastic and level cross-sections
The angle integrated gamma production cross-sections and the evaluated level schemeof 207Pb were used to construct the total inelastic and the level cross-sections as de-scribed in Sec. 2.1.2. These will be given in the following.
Total neutron inelastic cross-section
The total inelastic cross-section excluding the cross-section leading to the isomerwas constructed using the production cross-section of the following transitions:569.70 keV, 897.78 keV, 3300 keV , 3928 keV, 4104 keV and 4140 keV. All theseγ-rays are drawn with ”red” in Fig. 5.56. The total inelastic cross-section with-out the isomer contribution (Fig. 5.68) is exact up to about 4.1 MeV which is thehighest energy of an observed excited level that decays directly to the ground state.Above 4.1 MeV, the present result is a lower limit for the total inelastic cross-section,excluding the isomer contribution.
The 569.7 keV and 897.78 keV transitions are the major components in thetotal neutron inelastic cross-section. The cross-section of all the other transitionsis much smaller. Therefore, the same neutron energy resolution was obtained asin the case of the 569.7 keV gamma-production cross-section: 1.1 keV at 1 MeVand 35 keV at 10 MeV. A total uncertainty smaller than 8 % was obtained below10 MeV (Fig. 5.68 Right). Higher uncertainties were obtained at the higher energiesdue to the low counting rate. The same observation is valid at low energies were
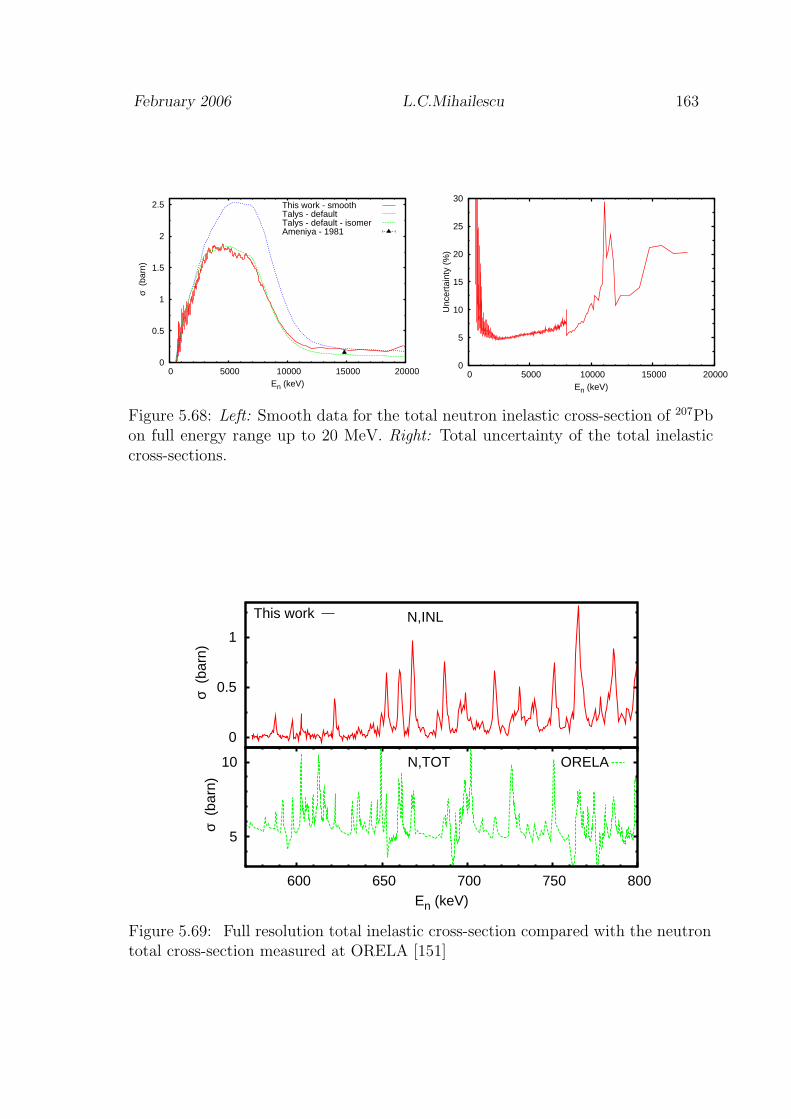
February 2006 L.C.Mihailescu 163
0
0.5
1
1.5
2
2.5
0 5000 10000 15000 20000
σ (
barn
)
En (keV)
This work - smoothTalys - defaultTalys - default - isomerAmeniya - 1981
0
5
10
15
20
25
30
0 5000 10000 15000 20000
Unc
erta
inty
(%
)
En (keV)
Figure 5.68: Left: Smooth data for the total neutron inelastic cross-section of 207Pbon full energy range up to 20 MeV. Right: Total uncertainty of the total inelasticcross-sections.
0
0.5
1
σ (
barn
)
N,INLThis work
5
10
600 650 700 750 800
σ (
barn
)
En (keV)
N,TOT ORELA
Figure 5.69: Full resolution total inelastic cross-section compared with the neutrontotal cross-section measured at ORELA [151]

164 Results and discussion
0
0.5
1
500 1000 1500 2000 2500 3000 3500 4000 4500
σ (
barn
)
En (keV)
569.70keV
This workTalys - defaultAbdel - 1976Almen - 1976
0
10
20
30
500 1000 1500 2000 2500 3000 3500 4000 4500
Unc
erta
inty
(%
)
En (keV)
569.70keV
Figure 5.70: Left: The cross-section of the 569.7 keV level in 207Pb.Right: Thecorresponding total uncertainty.
the counting rate was very small between the resonances (Fig. 5.69). The steps inthe relative total uncertainty from Fig. 5.68 Right are due to the grouping of fewneutron energy bins in one bin to reduce the statistical fluctuations. This groupingprocedure was explained in Sec. 3.3.5.
In Fig. 5.69 the full resolution data for the total inelastic cross-section is com-pared with the neutron total cross-section measured in a transmission experimentat ORELA [151]. Many resonances from the total cross-section are observed alsoin the inelastic cross-section, but still with a poorer neutron energy resolution. Itcan be observed that the relative intensity of different resonances is different in theinelastic channel than in the total cross-section. For example, in the inelastic reac-tion, the resonance at 750 keV has smaller amplitude than the resonance at 765 keV(Fig. 5.69). The intensity is reversed in the total cross-section.
Only one experimental point was found in the literature for the total inelasticcross-section at 14.7 MeV (Ameniya et al. [130]). This point agrees well with thepresent measurement (Fig. 5.68).
For a correct comparison with the present experimental data, the Talys calcula-tion with the default input parameters has to be corrected for the contribution ofthe isomer to the total inelastic cross-section. Fig. 5.68 shows both Talys curves,corrected and uncorrected for the contribution of the isomer level. After the correc-tion for the isomer level in 207Pb at 1633 keV, the calculation describes generallywell the measured cross-section on the full energy range. The difference betweenthe calculation and the measurement at energies above 12 MeV is within the givenuncertainties of the present measurement.
Level 569.703 keV
The cross-section of the level at 569.7 keV in 207Pb (Fig. 5.70) is exact up to about4.1 MeV, the maximum observed excitation energy. The following γ-rays were usedfor this level cross-sections: 569.702 keV, 897.78 keV, 1770.237 keV, 1725.7 keV,2092.7 keV and 2737.0 keV. Fig. 5.70 Right shows the relative total uncertainty of
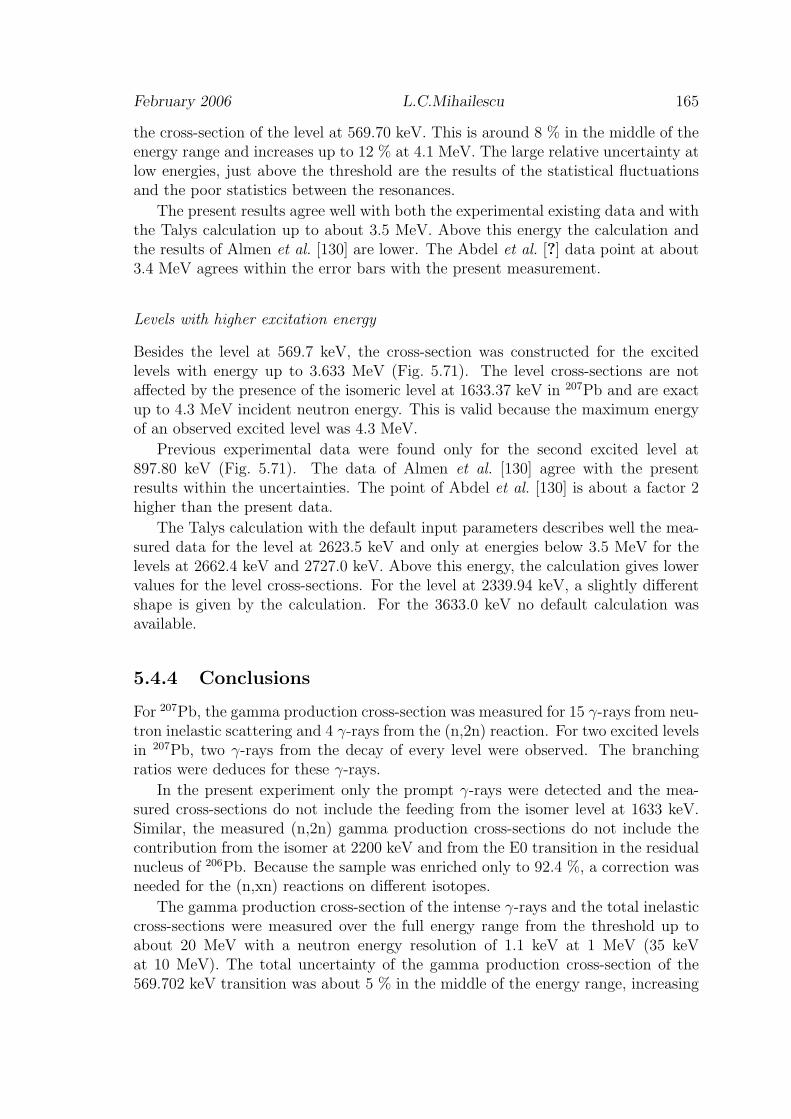
February 2006 L.C.Mihailescu 165
the cross-section of the level at 569.70 keV. This is around 8 % in the middle of theenergy range and increases up to 12 % at 4.1 MeV. The large relative uncertainty atlow energies, just above the threshold are the results of the statistical fluctuationsand the poor statistics between the resonances.
The present results agree well with both the experimental existing data and withthe Talys calculation up to about 3.5 MeV. Above this energy the calculation andthe results of Almen et al. [130] are lower. The Abdel et al. [?] data point at about3.4 MeV agrees within the error bars with the present measurement.
Levels with higher excitation energy
Besides the level at 569.7 keV, the cross-section was constructed for the excitedlevels with energy up to 3.633 MeV (Fig. 5.71). The level cross-sections are notaffected by the presence of the isomeric level at 1633.37 keV in 207Pb and are exactup to 4.3 MeV incident neutron energy. This is valid because the maximum energyof an observed excited level was 4.3 MeV.
Previous experimental data were found only for the second excited level at897.80 keV (Fig. 5.71). The data of Almen et al. [130] agree with the presentresults within the uncertainties. The point of Abdel et al. [130] is about a factor 2higher than the present data.
The Talys calculation with the default input parameters describes well the mea-sured data for the level at 2623.5 keV and only at energies below 3.5 MeV for thelevels at 2662.4 keV and 2727.0 keV. Above this energy, the calculation gives lowervalues for the level cross-sections. For the level at 2339.94 keV, a slightly differentshape is given by the calculation. For the 3633.0 keV no default calculation wasavailable.
5.4.4 Conclusions
For 207Pb, the gamma production cross-section was measured for 15 γ-rays from neu-tron inelastic scattering and 4 γ-rays from the (n,2n) reaction. For two excited levelsin 207Pb, two γ-rays from the decay of every level were observed. The branchingratios were deduces for these γ-rays.
In the present experiment only the prompt γ-rays were detected and the mea-sured cross-sections do not include the feeding from the isomer level at 1633 keV.Similar, the measured (n,2n) gamma production cross-sections do not include thecontribution from the isomer at 2200 keV and from the E0 transition in the residualnucleus of 206Pb. Because the sample was enriched only to 92.4 %, a correction wasneeded for the (n,xn) reactions on different isotopes.
The gamma production cross-section of the intense γ-rays and the total inelasticcross-sections were measured over the full energy range from the threshold up toabout 20 MeV with a neutron energy resolution of 1.1 keV at 1 MeV (35 keVat 10 MeV). The total uncertainty of the gamma production cross-section of the569.702 keV transition was about 5 % in the middle of the energy range, increasing
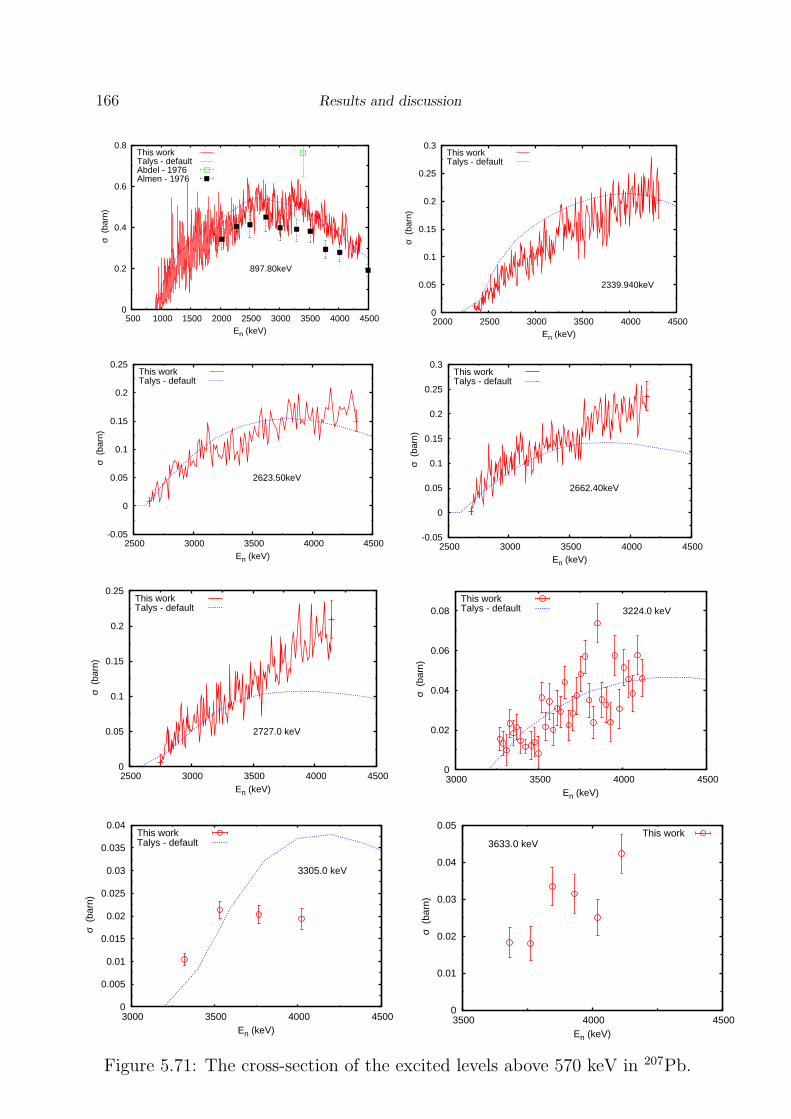
166 Results and discussion
0
0.2
0.4
0.6
0.8
500 1000 1500 2000 2500 3000 3500 4000 4500
σ (
barn
)
En (keV)
897.80keV
This workTalys - defaultAbdel - 1976Almen - 1976
0
0.05
0.1
0.15
0.2
0.25
0.3
2000 2500 3000 3500 4000 4500
σ (
barn
)
En (keV)
2339.940keV
This workTalys - default
-0.05
0
0.05
0.1
0.15
0.2
0.25
2500 3000 3500 4000 4500
σ (
barn
)
En (keV)
2623.50keV
This workTalys - default
-0.05
0
0.05
0.1
0.15
0.2
0.25
0.3
2500 3000 3500 4000 4500
σ (
barn
)
En (keV)
2662.40keV
This workTalys - default
0
0.05
0.1
0.15
0.2
0.25
2500 3000 3500 4000 4500
σ (
barn
)
En (keV)
2727.0 keV
This workTalys - default
0
0.02
0.04
0.06
0.08
3000 3500 4000 4500
σ (
barn
)
En (keV)
3224.0 keVThis workTalys - default
0
0.005
0.01
0.015
0.02
0.025
0.03
0.035
0.04
3000 3500 4000 4500
σ (
barn
)
En (keV)
3305.0 keV
This workTalys - default
0
0.01
0.02
0.03
0.04
0.05
3500 4000 4500
σ (
barn
)
En (keV)
3633.0 keVThis work
Figure 5.71: The cross-section of the excited levels above 570 keV in 207Pb.
February 2006 L.C.Mihailescu 167
at the extremities because of the statistical fluctuations. Uncertainties below 25%at the maximum of the cross-section were obtained for the other γ-rays.
The total neutron inelastic scattering cross-section and the level cross-sectionswere constructed based on the evaluated level scheme of 207Pb and using the mea-sured integral gamma production cross-sections. The transitions of 569.70 keV and897.78 keV had the largest contribution to the total inelastic cross-section.
Due to the unprecedented neutron energy resolution of the experimental setup atGELINA, well defined resonance structures were observed for the 569.702 keV andfor the 897.78 keV γ-rays below about 2.5 MeV. These resonances in the inelasticcross-sections were compared with the resonances in the total neutron cross-sectionsfrom the literature.
Few experimental data were available for the comparison with the present results.The disagreement with some previous measured data may be explained by the useof the detectors with poor resolution (NaI detectors), the use of natural Pb sampleor improper multiple scattering correction.
The present measured data were compared also with the Talys calculation withthe default input parameters. The Talys calculation had to be corrected for thecontribution of the isomer level in 207Pb. Corrections for the E0 transition andfor the isomer level in 206Pb nucleus were needed for a correct comparison in thecase of the (n,2n) gamma production cross-sections. In the case of 207Pb the codedescribes relatively well the production cross-sections of the most intense γ-rays.For the other γ-rays the agreement is good only at low neutron energies. Significantdifferences are observed at energies above 3 MeV. This general good agreement ofthe gamma production cross-section at low neutron energy may explain also therelative good agreement between the calculation and the present measurement forthe level cross-sections.
For the (n,2n) cross-sections, after the correction for the isomer level in theresidual nucleus 206Pb, the calculation gives comparable values for the most intensetransition. Large difference were observed for the other 3 measured transition fromthe (n,2n) reaction on 207Pb.
In conclusion, a large amount of precise neutron inelastic and (n,2n) reactioncross-section data were produced in only one run, from the threshold up to about20 MeV. These data can be used in future neutron data evaluations and as bench-mark for the nuclear codes.

168 Results and discussion
5.5 208Pb neutron inelastic scattering, (n,2n) and
(n,3n) cross-sections
5.5.1 Introduction
The 208Pb nucleus was studied by different authors using both techniques describedin Sec. 2.1((n,n’)-technique and (n,xnγ)-technique). Experiments like Towle etal. [163], Almen et al. [130], Finlay et al. [157] and Bainum et al. [160] use the(n,n’)-technique. All these experiments were able to identify only few neutron en-ergy groups. Moreover Finlay et al. [157] and Bainum et al. [160] measured only thedifferential level cross-sections.
The (n,n’γ)-technique was used in experiments from Refs. [152–156, 161]. Allthese experiment used germanium detectors (Ge(Li) or HPGe). In the experimentof Dickens et al. [161] a large number of γ-rays from 208Pb were identified andtheir production cross-section was measured at 6 energies between 4.9 MeV and8 MeV. The measurement was done with a Ge(Li) detector placed at 55o and 125o.The maximum observed excitation energy was about 6.6 MeV. Only the transitionfrom the first excited state to the ground state was measured in the experiment ofVonach et al. [152] for the neutron inelastic, (n,2n) and (n,3n) reactions on 208Pb.The measurement was done with the HPGe detectors at 125o, from the thresholdup to 200 MeV neutron energy. The normalization of the Vonach data was donerelative to the measurement of Hlavac et al. [154] at 14.7 MeV. At its turn theHlavac measurement was normalized to the gamma production cross-section of the1434 keV transition in 52Cr(n,n’γ)52Cr reaction. In Refs. [155, 156] the γ-rays weremeasured from the decay of levels around 5.5 MeV excitation energy.
As in the case of the 207Pb measurement, corrections for the isotopic compositionof the sample were needed for the 208Pb sample. The studied residual nuclei (208Pb,207Pb and 206Pb) were produced in different (n,xnγ) reaction on the isotopes presentin the sample. In Table. 5.5 is shown how the γ-ray peaks are produced in the 208Pbsample with only 88.1 % enrichment. All the (n,2n) and (n,3n) production cross-sections measured here were corrected for the contribution of different isotopes.
In the present measurement 29 γ-rays were observed from the inelastic scattering
Table 5.5: Corrections for the isotopic composition of 208Pb sample results. Thethreshold is given for the γ-ray production in different reactions.
residual nucleus reaction content in the sample threshold (MeV)208Pb 208Pb(n,n’γ)208Pb 88.11 % 2.63207Pb 208Pb(n,2nγ)207Pb 88.11 % 7.98
207Pb(n,n’γ)207Pb 0.89 % 0.57206Pb 208Pb(n,3nγ)206Pb 88.11 % 14.98
207Pb(n,2nγ)206Pb 0.89 % 7.57206Pb(n,n’γ)206Pb 10.99 % 0.81

February 2006 L.C.Mihailescu 169
0+ 0 . 0stable
3– 2614.551 16.7 ps
5– 3197.743 294 ps
4– 3475.113 4 ps
5– 3708.44 <100 ps
(6)– 3919.80
(4)– 3946.44
5– 3960.96 ≤18 ps
(5)– 3995.7
(3–) 4050.5
2+ 4085.4 0.74 fs
(4,5)– 4125.31
5– 4180.41
(6)– 4205.4
2– 4229.5
(4)– 4230
(3–) 4253.5
(5)– 4262.4
5– 4296.17
4+ 4323.2
(4)– 4358.46
6– 4382.9
6+ 4422
6– 4480.5
4626
3– 4698.2
1– 4842.1 0.066 fs
2614.5
33 E
3
100
583.1
91 E
2
100
277.3
51 M
1+E
2
50.4
860.5
64 M
1+E
2
100.0
233.3
6 M
1
1.3
7
510.7
7 M
1+E
2
100.0
1093.9
1.7
6
211.4
0 M
1
78
722.0
4 M
1+E
2
100
748.7
100
252.6
1 M
1
40
485.9
5 i
fM1,E
2
2.8
763.1
3 M
1(+
E2)
100
798.0
28
1381.1
100
1436.0
100
4085.4
100
650.1
27
927.6
100
705.2
11
982.7
100
1008
100
1614.9
100
4229.5
(M
2)
25
1639
100
553
45
786.8
60
1647.9
100
587.7
100
821.2
100
1125.8
100
883.3
100
1160.8
35
1744.0
6
1185.1
100
1225
100
1282.8
100
4626
443
40
466
20
1223.3
100
1501
40
46944842.1
100
770
100
208
82Pb126
Figure 5.72: Simplified evaluated level scheme of 208Pb [131]. The gamma produc-tion cross-section of the transitions drawn with colors was measured in the presentexperiment. The ”red” γ-rays were used to construct the total inelastic cross-section.The level at 3708.44 keV was not observed because it decays through a 510.36 keVγ-ray that could not be distinguished from the 511 keV in the background.

170 Results and discussion
0
20000
40000
60000
0 500 1000 1500 2000 2500
Cou
nts
Eγ (keV)
<---
583
keV
<--
- 51
1 ke
V
<--
- 86
0 ke
V
<---
1460
keV
<--
- 26
14 k
eV
<--
- 17
64 k
eV<---
609
keV
<--
- 23
8 ke
V
<---
911
keV
Figure 5.73: Background spectrum with the 208Pb sample in position and no neutronbeam. The 2614.5 keV, 583.19 keV and 860.56 keV peaks from 208Pb are present inthe background.
on 208Pb, 5 γ-rays from the (n,2n) reaction and one γ-ray from the (n,3n) reaction.The maximum observed excitation energy in the inelastic scattering was 5563 keV.Up to 4323 keV at least one γ-ray was observed to decay from every excited level.The level at 3708.44 keV was not observed because it decays through a 510.36 keVγ-ray that could not be distinguished from the 511 keV in the background.
The total inelastic and the level cross-sections were constructed using the levelscheme of 208Pb and the measured integral gamma production cross-sections. Thedetailed results for 208Pb nucleus are given in the following.
5.5.2 Gamma production cross-sections
The 208Pb sample used in the present experiment had radiogenic origin. There-fore a slightly increased radioactivity was observed from the sample and a higherbackground was measured with the sample in position, especially at energies below500 keV. The background spectrum measured with one of the HPGe detector isshown in Fig. 5.73 as an example. Different from the other 4 nuclei presented in thiswork, the main γ-ray peaks of 208Pb are always present in a background spectrum.All these 208Pb transitions from the background result from the decay of the parentnucleus 208Tl. The most intense γ-rays from the natural decay of 208Tl and theirrelative intensities are: 2614.533 keV (99.16 %), 583.191 keV (84.5 %), 510.77 keV(22.6 %), 860.564 keV (12.42 %), 277.35 keV (6.31 %) and 763.13 keV (1.81 %).
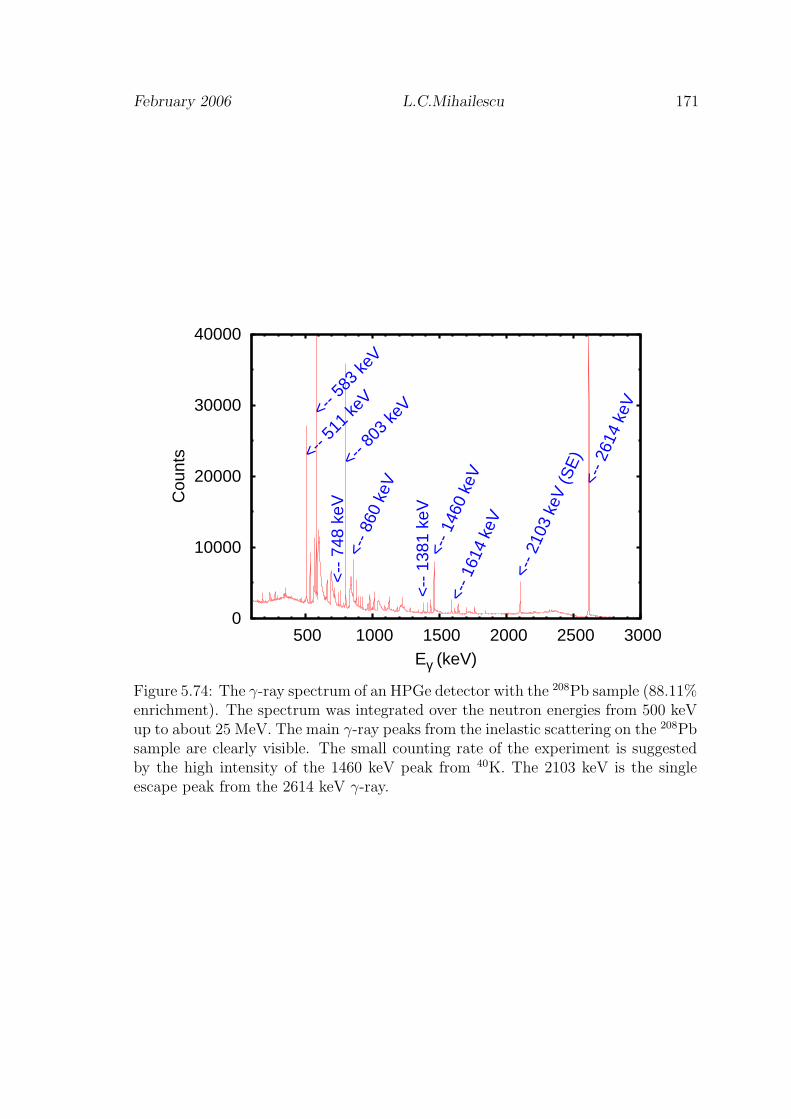
February 2006 L.C.Mihailescu 171
0
10000
20000
30000
40000
500 1000 1500 2000 2500 3000
Cou
nts
Eγ (keV)
<-- 1
460
keV
<-- 5
83 ke
V
<-- 8
03 ke
V
<-- 8
60 k
eV
<--
138
1 ke
V
<--
748
keV
<-- 5
11 ke
V
<-- 1
614
keV
<-- 2
103
keV
(SE
)<-
- 261
4 ke
V
Figure 5.74: The γ-ray spectrum of an HPGe detector with the 208Pb sample (88.11%enrichment). The spectrum was integrated over the neutron energies from 500 keVup to about 25 MeV. The main γ-ray peaks from the inelastic scattering on the 208Pbsample are clearly visible. The small counting rate of the experiment is suggestedby the high intensity of the 1460 keV peak from 40K. The 2103 keV is the singleescape peak from the 2614 keV γ-ray.

172 Results and discussion
0
0.05
0.1
0.15
0.2
0.25
5000 10000 15000 20000
dσ γ
/ dΩ
(ba
rn/s
r)
En (keV)
2614.5 KeV
110o
150o
1
1.5
2
2.5
3
2000 4000 6000 8000 10000 12000
W(1
50)/
W(1
10)
En (keV)
2614.5 KeV
Figure 5.75: Differential gamma production cross-section for the 2614.5 keV tran-sition in 208Pb. Left: Smoothed curves from the threshold up to 20 MeV at twoangles, 110 and 150 degrees. Right: The ratio between the angular distributionW(θ) at 150 and 110 degrees.
The presence of the 208Pb peaks in the natural background resulted in an aver-age HPGe yield different from zero below the thresholds in the 208Pb(n,n’γ)208Pbreaction. Such effect was observed only for three γ-rays: 2614.5 keV, 583.19 keV and860.56 keV. The 510.77 keV transition was not measured at all in this experimentbecause these γ-ray peak coincides with the 511 keV peak from the background.The other γ-ray peaks from the decay of 208Tl nucleus were not observed in thebackground measurement with the sample in position because of their low inten-sity. For the 2614.5 keV, 583.19 keV and 860.56 keV transitions the prompt γ-rayyield was corrected for the natural background measured in an independent run of48 hours and normalized to the acquisition time. After the correction, the averageHPGe yield equals zero below the reaction threshold.
The angle integrated production cross-section for the γ-rays from the (n,xnγ)(x=1,2,3) reaction on 208Pb are given in the following. The angle integration wasdone with the Gauss quadrature procedure described in Sec. 2.3.3. The differentialgamma production cross-section at the two measurement angles 110o and 150o isgiven only for two transitions as example.
2614.5 keV
Fig. 5.75 shows the differential production cross-section for the 2614.5 keV transitionat two angles 110o and 150o. For this transition one can observe a significant angulardistribution. The ratio between the angular distribution (W (θ) = 4π
σdσdΩ
(θ)) at 150o
and 110o (Fig. 5.75 Right) has a maximum at the inelastic threshold and decreasesat high energies where become almost constant, equal to 1.5. According to thetheoretical predictions for an E3 transition from the 3− level to 0+ level(Eq. 2.17),the ratio between the angular distribution at 150o and 110o equals 2.59 just abovethe threshold. This prediction is in good agreement with the observed value.
Fig. 5.76 shows the full neutron energy resolution data for the differential and for

February 2006 L.C.Mihailescu 173
0
0.05
0.1
0.15
0.2
0.25
2500 3000 3500 4000 4500 5000
dσ γ
/ dΩ
(ba
rn/s
r)
En (keV)
110150
0
0.5
1
1.5
2500 3000 3500 4000
σ γ
(bar
n)
En (keV)
2614.53 keVThis workTalys - defaultLashuk -1996Vonach - 1995
Figure 5.76: Full resolution gamma production cross-section for the 2614.5 keV tran-sition in 208Pb. Left: Differential gamma production cross-section at 110o and 150o.Right: Integral gamma production cross-section compared with Talys calculation.
0
0.5
1
1.5
2
2.5
5000 10000 15000 20000
σ γ
(bar
n)
En (keV)
2614.53 keV
This work - smoothTalys - defaultZhou -2000Lashuk -1996Vonach - 1995Hlavac -1995Dickens -1976Nellis -1974
0
5
10
15
20
25
30
5000 10000 15000 20000
Unc
erta
inty
(%
)
En (keV)
2614.53 keVThis work
Figure 5.77: Left: Integral gamma production cross-section for the 2614.5 keV tran-sition in 208Pb. Full energy scale from threshold up to 20 MeV. The data weresmoothed with an averaging moving window filter for an easier comparison withother data. Right: The corresponding total uncertainty.

174 Results and discussion
the integral gamma production cross-section of the 2614.5 keV transition. No clearresonance structures were observed for the 208Pb nucleus, despite de good neutronenergy resolution that was used.
The integral gamma production cross-section on full energy range from the in-elastic threshold up to 20 MeV is given in Fig. 5.77. The smoothed curve is givenhere to allow an easier comparison with the other data. The present data were ob-tained with a neutron energy resolution of 1.1 keV at 1 MeV (35 keV at 10 MeV).The corresponding total uncertainty is shown in the Right panel of Fig. 5.77. Thetotal uncertainty is around 5 % below 8 MeV and increases up to 15 % at about20 MeV. The increase in the total uncertainty above 8 MeV is due to the statisticalfluctuations. The same observation is valid just above the inelastic threshold wherethe cross-section increases slowly and consequently the statistics is poor. The stepsat 10 MeV and 12 MeV in the relative total uncertainty are the result of the group-ing of few neutron energy bins in one bin to improve the statistical uncertainty. Thegrouping procedure was described in Sec. 3.3.5.
A detailed measurement of the gamma production cross-section of the 2614.5 keVtransition had been done by Vonach et al. [152]. The present results agree well withthe data of Vonach et al.. In the experiment of Vonach et al. the γ-ray detectionwas done at 125o with respected to the beam direction. The integral gamma pro-duction cross-section was calculated multiplying the differential gamma productioncross-section at 125o with 4π. For the angular distribution of the 2614.5 keV as givenby Eq. 2.17, the angle integration method used by Vonach et al. should underesti-mate the integral cross-section with about 17 % just above the inelastic thresholdcompared with the Gauss quadrature used in the present work (Sec. 2.3.3). Withthe increase of the neutron energy, the difference between the two integration proce-dures should diminish to about 10 % because of the decrease in the anisotropy (seealso Fig. 5.75 Right). Such difference between the two data sets is not observed inFig. 5.77.
The point measurement of Lashuk et al. [130] at 3 MeV and the measurementof Zhou et al. [153] at 14.7 MeV are lower and respectively higher than the presentresults. The Hlavach et al. [154] measured point at 14.7 MeV agrees well with thepresent measurement. The Dickens et al. [161] points at 4.9 MeV and 5.4 MeV agreewell with the present measurement, while the other four points between 6.4 MeVand 8 MeV are lower. The Nellis et al. [162] point at 5 MeV is also lower than thepresent data.
The Talys calculation with the default parameters agrees well with the mea-sured data up to about 7 MeV. Above this energy, the calculation is slightly higher.No correction was needed to the calculation for the comparison with the presentmeasured data.
583.19 keV
Fig. 5.78 gives the differential gamma production cross-section for the second transi-tion in 208Pb nucleus. The typical angle dependence of an E2 transition is observed.The ratio of the differential cross-section at the two angles 150o and 110o has the

February 2006 L.C.Mihailescu 175
0
0.02
0.04
0.06
0.08
0.1
0.12
5000 10000 15000 20000
dσ γ
/ dΩ
(ba
rn/s
r)
En (keV)
583.19 KeV
110o
150o
1
1.2
1.4
1.6
2000 4000 6000 8000 10000 12000
W(1
50)/
W(1
10)
En (keV)
583.19 KeV
Figure 5.78: Differential gamma production cross-section for the 583.19 keV tran-sition in 208Pb. Left: Smoothed curves from the threshold up to 20 MeV at twoangles, 110o and 150o. Right: The ratio between the angular distribution W(θ) at150o and 110o.
0
0.5
1
1.5
5000 10000 15000 20000
σ γ
(bar
n)
En (keV)
583.19 keV
This workTalys - defaultZhou -2000Hlavac -1995Dickens -1976Nellis -1974
0
0.05
0.1
0.15
0.2
0.25
2000 4000 6000 8000 10000 12000 14000 16000
σ γ
(bar
n)
En (keV)
860.56 keV
This workTalys - defaultHlavac -1995Dickens -1976Nellis -1974
Figure 5.79: Integral gamma production cross-section for 208Pb. Full energy scalefrom threshold up to 20 MeV. Left: 583.19 keV transition .Right: 860.56 keV tran-sition.

176 Results and discussion
maximum value at the threshold and become almost constant, equal to 1.2, above4 MeV. The behavior of this E2 transition from a 4+ level to a 2+ level is similarwith the energy dependence of the angular distribution for the other measured E2transitions in 52Cr and 206Pb.
The integral gamma production cross-section of the 583.19 keV transition isgiven in Fig. 5.79. For this transition the production cross-section was measuredfrom the threshold, 3.2 MeV, up to 17 MeV. The previous measurements of Zhou etal. [153] and Hlavac et al. [154] gave slightly higher values for the integral gammaproduction cross-section. The Dickens et al. [161] point at 4.9 MeV agrees withpresent measurements. The other points of Dickens et al. are lower. The Nellis etal. [162] point at 5 MeV is also lower.
The Talys calculation with the default parameters agrees well with the measure-ments up to 5 MeV and between 9 MeV and 12 MeV. The calculation underestimatesthe integral cross-section with about 25 % in the energy range between 5 MeV and9 MeV. At high energies, above 12 MeV the calculation predicts higher values.
The transitions from higher lying levels
The integral production cross-section for other 27 γ-rays from the neutron inelasticscattering on 208Pb nucleus are given in Figs. 5.79 Right, 5.80, 5.81, 5.82, 5.83. The2948 keV transition decays from the maximum observed excited level at 5563 keV.The level at 3708.44 keV was not observed because it decays through a 510.36 keVγ-ray. Above 4480.5 keV some excited levels were not observed, maybe because oftheir low cross-section.
The cross-section of the majority of these transitions was measured only up toabout 10 MeV incident neutron energy. Above this energy the statistics was notsufficient for a precise measurement; the γ-ray peaks were not clearly visible fromthe background even after grouping several energy bins.
The production cross-section of the observed transitions from levels higher than3.4 MeV had maximum values between 15 mb and 200 mb. At the extremities ofthe measurement energy interval the cross-sections are much lower.
In general the data of Hlavac et al. [154] and the data of Dickens et al. [161]agree well with the value that can be extrapolated from the present measurement(Fig. 5.79 Right).
The Talys code calculates the production cross-section of the γ-rays that decayfrom levels up to 4229 keV. Where calculation is available, there is no systematicdifference between the present measurement and the calculation. Some gammaproduction cross-sections are well described by the calculation (722 keV, 1436 keVor 1008 keV). In the case of the 860 keV, 748 keV and 763 keV the difference to themeasured values is not negligible.
Branching ratios
In 208Pb nucleus, five were the cases where two γ-rays that decay from the sameexcited level were observed. For these levels the ratios between the γ-ray intensity(branching ratios) were measured. The intensity ratio was calculated as the ratio

February 2006 L.C.Mihailescu 177
0
0.02
0.04
0.06
0.08
0.1
0.12
0.14
2000 4000 6000 8000 10000 12000 14000
σ γ
(bar
n)
En (keV)
277.35 keV
This workTalys - default
0
0.02
0.04
0.06
2000 4000 6000 8000 10000 12000
σ γ
(bar
n)
En (keV)
722.04 keVThis workTalys - defaultDickens -1976
0
0.02
0.04
0.06
0.08
0.1
2000 4000 6000 8000 10000 12000
σ γ
(bar
n)
En (keV)
748.7 keV
This workTalys - defaultDickens -1976Nellis -1974
0
0.02
0.04
0.06
0.08
0.1
4000 6000 8000 10000 12000
σ γ
(bar
n)
En (keV)
763.13 keV
This workTalys - defaultDickens -1976Nellis -1974
0
0.01
0.02
0.03
4000 6000 8000 10000 12000
σ γ
(bar
n)
En (keV)
798.0 keV
This workTalys - defaultDickens -1976
0
0.02
0.04
0.06
0.08
0.1
4000 6000 8000 10000 12000
σ γ
(bar
n)
En (keV)
1381.1 keV
This workTalys - defaultDickens -1976Nellis -1974
0
0.02
0.04
0.06
0.08
0.1
0.12
4000 6000 8000 10000 12000
σ γ
(bar
n)
En (keV)
1436.0 keV
This workTalys - defaultDickens -1976Nellis -1974
0
0.02
0.04
0.06
0.08
0.1
0.12
4000 6000 8000 10000 12000
σ γ
(bar
n)
En (keV)
4085.4 keV
This workTalys - defaultDickens -1976Nellis -1974
Figure 5.80: Integral gamma production cross-section for the transitions from higherlying levels in 208Pb.
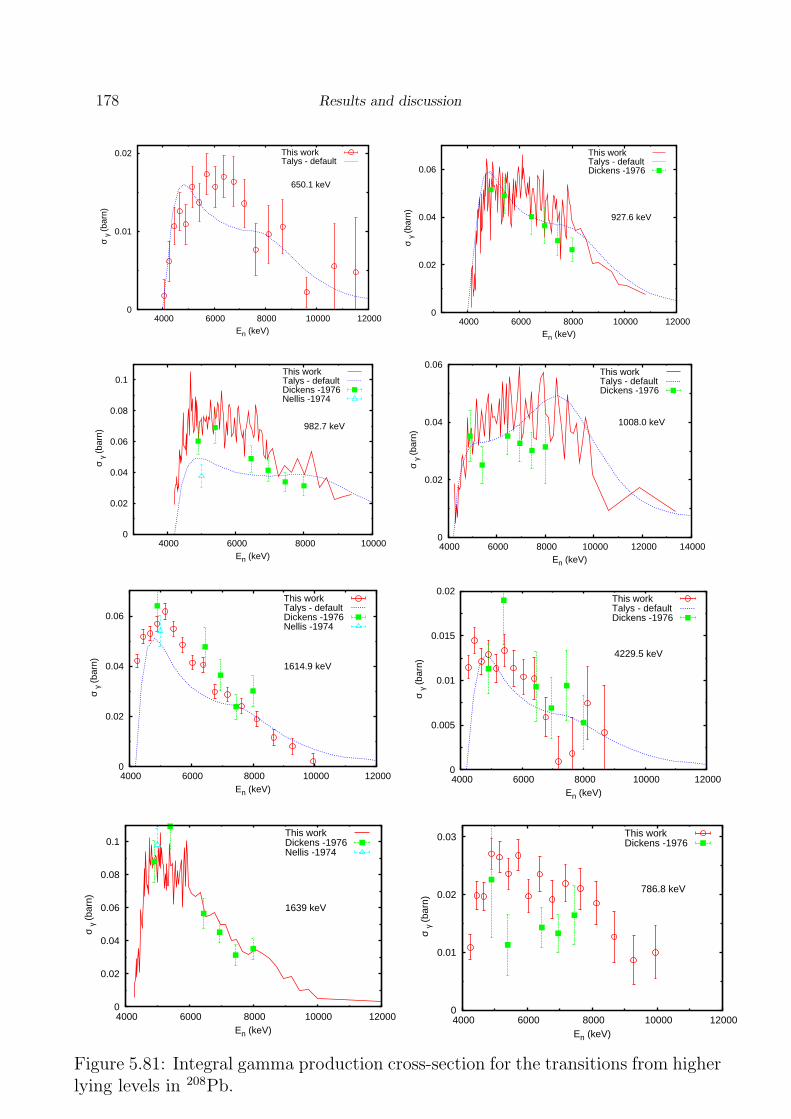
178 Results and discussion
0
0.01
0.02
4000 6000 8000 10000 12000
σ γ
(bar
n)
En (keV)
650.1 keV
This workTalys - default
0
0.02
0.04
0.06
4000 6000 8000 10000 12000
σ γ
(bar
n)
En (keV)
927.6 keV
This workTalys - defaultDickens -1976
0
0.02
0.04
0.06
0.08
0.1
4000 6000 8000 10000
σ γ
(bar
n)
En (keV)
982.7 keV
This workTalys - defaultDickens -1976Nellis -1974
0
0.02
0.04
0.06
4000 6000 8000 10000 12000 14000
σ γ
(bar
n)
En (keV)
1008.0 keV
This workTalys - defaultDickens -1976
0
0.02
0.04
0.06
4000 6000 8000 10000 12000
σ γ
(bar
n)
En (keV)
1614.9 keV
This workTalys - defaultDickens -1976Nellis -1974
0
0.005
0.01
0.015
0.02
4000 6000 8000 10000 12000
σ γ
(bar
n)
En (keV)
4229.5 keV
This workTalys - defaultDickens -1976
0
0.02
0.04
0.06
0.08
0.1
4000 6000 8000 10000 12000
σ γ
(bar
n)
En (keV)
1639 keV
This workDickens -1976Nellis -1974
0
0.01
0.02
0.03
4000 6000 8000 10000 12000
σ γ
(bar
n)
En (keV)
786.8 keV
This workDickens -1976
Figure 5.81: Integral gamma production cross-section for the transitions from higherlying levels in 208Pb.

February 2006 L.C.Mihailescu 179
0
0.01
0.02
0.03
0.04
0.05
4000 6000 8000 10000
σ γ
(bar
n)
En (keV)
1647.9 keV
This workDickens -1976
0
0.01
0.02
0.03
0.04
4000 6000 8000 10000
σ γ
(bar
n)
En (keV)
587.7 keV
This work
0
0.02
0.04
0.06
0.08
0.1
0.12
0.14
4000 6000 8000 10000 12000 14000 16000 18000
σ γ
(bar
n)
En (keV)
1125.8 keV
This workDickens -1976
0
0.02
0.04
0.06
4000 6000 8000 10000 12000
σ γ
(bar
n)
En (keV)
1185.1 keV
This workDickens -1976
0
0.05
0.1
0.15
4000 6000 8000 10000 12000
σ γ
(bar
n)
En (keV)
1225keV + 1223.3 keV
This workDickens -1976
0
0.02
0.04
4000 6000 8000 10000
σ γ
(bar
n)
En (keV)
1282.8 keV
This workDickens -1976
0
0.01
0.02
0.03
4000 6000 8000 10000 12000
σ γ
(bar
n)
En (keV)
4841.1 keV
This workDickens -1976
0
0.01
0.02
0.03
0.04
4000 6000 8000 10000
σ γ
(bar
n)
En (keV)
2321.5 keV
This workDickens -1976
Figure 5.82: Integral gamma production cross-section for the transitions from higherlying levels in 208Pb.

180 Results and discussion
0
0.01
0.02
0.03
0.04
4000 6000 8000 10000 12000
σ γ
(bar
n)
En (keV)
2423.9 keV
This workDickens -1976
0
0.01
0.02
4000 6000 8000 10000 12000
σ γ
(bar
n)En (keV)
2948 keV
This workDickens -1976
Figure 5.83: Integral gamma production cross-section for the transitions from higherlying levels in 208Pb.
Table 5.6: Branching ratios for levels in 208Pb nucleus and the correspondingabsolute uncertainties. The present results are compared with the values from theevaluated level scheme [131].
Elevel(keV) Eγ Present results ENSDFIntensity Uncertainty Intensity Uncertainty
3475.113 277.35 45.0 7.5 50.4 1.6860.564 100 - 100 1.1
3995.7 798.0 32.7 4.9 28.0 41381.1 100 - 100 -
4125.31 650.1 29.6 5.2 27 4927.6 100 - 100 -
4229.5 1614.9 100 - 100 -4229.5 22.4 2.8 25 6
4262.4 786.8 81.0 14.6 60 131647.9 100 - 100 -

February 2006 L.C.Mihailescu 181
0
2000
4000
6000
500 1000 1500 2000
Cou
nts
Eγ (keV)
<-- 5
69 ke
V
<-- 8
97 ke
V
<-- 1
593
keV
<--
209
2 ke
V
<-- 5
83 ke
V
<-- 8
03 ke
V (n,3
n)
0
500
2000 2100
Figure 5.84: γ-ray spectrum with the 208Pb sample (88.1 keV% enrichment)integrated over neutron energies above 7.4 MeV up to about 25 MeV. The569 keV, 897 keV, 1770 keV, 1593 keV and 2092 keV peaks resulted mainlyfrom the 208Pb(n,2nγ)207Pb reaction. The 803 keV peak was produced in the208Pb(n,3nγ)206Pb reaction. A zoom of the spectrum around 2092 keV peak isshown as inset.
between the integrated gamma production cross-sections over the full measuredneutron energy range. As additional check in the support of the correct γ-rayidentification, the branching ratio was observed to be constant with the neutronenergy. The same threshold was observed for the γ-rays from the decay of the sameexcited level.
The resulted branching ratios are given in Table. 5.6. The present values forthe branching ratios agree with the evaluated values within the uncertainties. Thelarge uncertainties of the present measurement are due the poor statistics of the lessintense transitions from every level.
(n,2n) and (n,3n) gamma production cross-sections
Fig. 5.84 shows the γ-ray spectrum with the 208Pb sample integrated over the neu-tron energies from 7.4 MeV up to about 25 MeV. In this spectrum were observed 5γ-rays from the 207Pb nucleus and one γ-ray from the 206Pb nucleus. These γ-raypeaks resulted mainly from the (n,2n) and respectively (n,3n) reactions on 208Pbnucleus. As shown in Table. 5.5, these γ-ray peaks have contributions from other(n,xn) (x=1,2,3) reactions on the Pb isotopes present in the sample.
The (n,2n) and (n,3n) cross-sections presented here were corrected for the iso-

182 Results and discussion
0
0.5
1
1.5
2
8000 10000 12000 14000 16000 18000 20000
σ γ
(bar
n)
En (keV)
569.7 keV
This workTalys - defaultTalys - default - isomerZhou -2000Vonach - 1995Hlavac -1995
0
0.1
0.2
0.3
8000 10000 12000 14000 16000 18000 20000 σ
γ (b
arn)
En (keV)
897.78 keVThis workTalys - defaultZhou -2000Hlavac -1995
0
0.05
0.1
0.15
0.2
0.25
8000 10000 12000 14000 16000 18000 20000
σ γ
(bar
n)
En (keV)
1770.23 keV
This workTalys - defaultZhou -2000Hlavac -1995
0
0.05
0.1
0.15
8000 10000 12000 14000 16000 18000 20000
σ γ
(bar
n)
En (keV)
2092.7 keV
This workTalys - defaultZhou -2000Hlavac -1995
0
0.05
0.1
0.15
0.2
8000 10000 12000 14000 16000 18000 20000
σ γ
(bar
n)
En (keV)
1593 keVThis workZhou -2000
0
0.2
0.4
0.6
0.8
1
14000 15000 16000 17000 18000 19000 20000
σ γ
(bar
n)
En (keV)
803.06 keV
This workTalys - defaultVonach - 1995
Figure 5.85: Integral cross-section of the γ-rays from the (n,2n) and (n,3n) reactionson 208Pb.
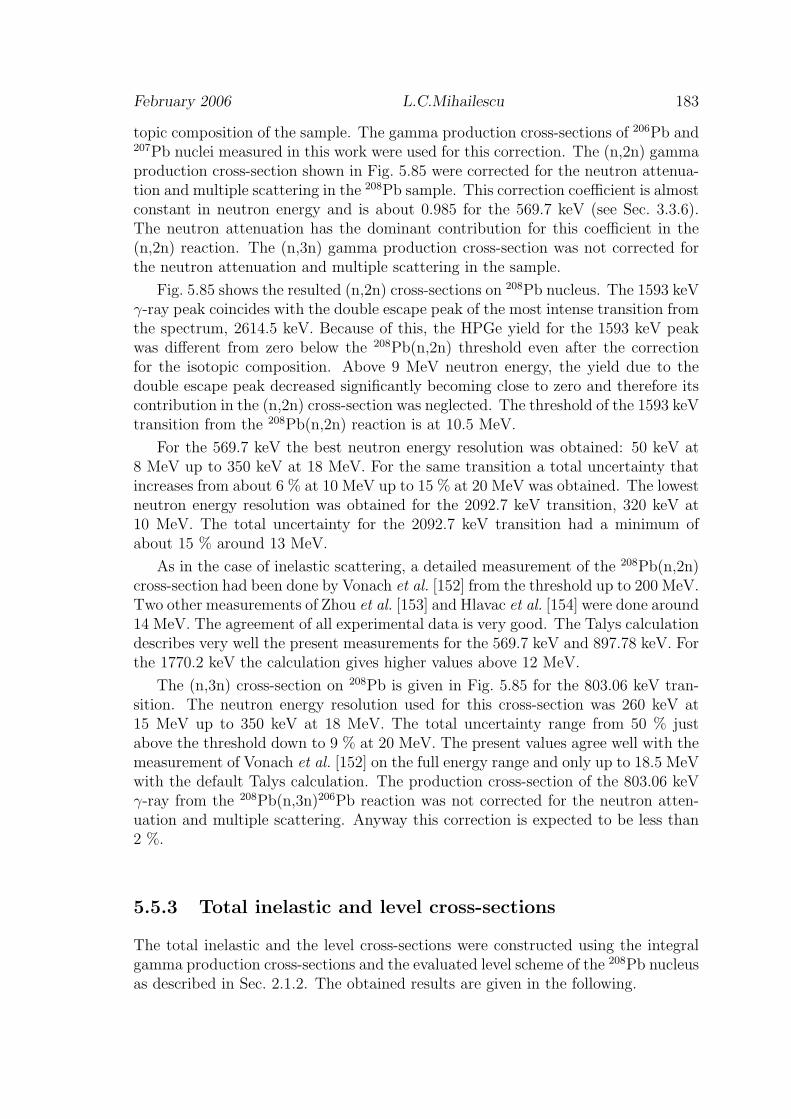
February 2006 L.C.Mihailescu 183
topic composition of the sample. The gamma production cross-sections of 206Pb and207Pb nuclei measured in this work were used for this correction. The (n,2n) gammaproduction cross-section shown in Fig. 5.85 were corrected for the neutron attenua-tion and multiple scattering in the 208Pb sample. This correction coefficient is almostconstant in neutron energy and is about 0.985 for the 569.7 keV (see Sec. 3.3.6).The neutron attenuation has the dominant contribution for this coefficient in the(n,2n) reaction. The (n,3n) gamma production cross-section was not corrected forthe neutron attenuation and multiple scattering in the sample.
Fig. 5.85 shows the resulted (n,2n) cross-sections on 208Pb nucleus. The 1593 keVγ-ray peak coincides with the double escape peak of the most intense transition fromthe spectrum, 2614.5 keV. Because of this, the HPGe yield for the 1593 keV peakwas different from zero below the 208Pb(n,2n) threshold even after the correctionfor the isotopic composition. Above 9 MeV neutron energy, the yield due to thedouble escape peak decreased significantly becoming close to zero and therefore itscontribution in the (n,2n) cross-section was neglected. The threshold of the 1593 keVtransition from the 208Pb(n,2n) reaction is at 10.5 MeV.
For the 569.7 keV the best neutron energy resolution was obtained: 50 keV at8 MeV up to 350 keV at 18 MeV. For the same transition a total uncertainty thatincreases from about 6 % at 10 MeV up to 15 % at 20 MeV was obtained. The lowestneutron energy resolution was obtained for the 2092.7 keV transition, 320 keV at10 MeV. The total uncertainty for the 2092.7 keV transition had a minimum ofabout 15 % around 13 MeV.
As in the case of inelastic scattering, a detailed measurement of the 208Pb(n,2n)cross-section had been done by Vonach et al. [152] from the threshold up to 200 MeV.Two other measurements of Zhou et al. [153] and Hlavac et al. [154] were done around14 MeV. The agreement of all experimental data is very good. The Talys calculationdescribes very well the present measurements for the 569.7 keV and 897.78 keV. Forthe 1770.2 keV the calculation gives higher values above 12 MeV.
The (n,3n) cross-section on 208Pb is given in Fig. 5.85 for the 803.06 keV tran-sition. The neutron energy resolution used for this cross-section was 260 keV at15 MeV up to 350 keV at 18 MeV. The total uncertainty range from 50 % justabove the threshold down to 9 % at 20 MeV. The present values agree well with themeasurement of Vonach et al. [152] on the full energy range and only up to 18.5 MeVwith the default Talys calculation. The production cross-section of the 803.06 keVγ-ray from the 208Pb(n,3n)206Pb reaction was not corrected for the neutron atten-uation and multiple scattering. Anyway this correction is expected to be less than2 %.
5.5.3 Total inelastic and level cross-sections
The total inelastic and the level cross-sections were constructed using the integralgamma production cross-sections and the evaluated level scheme of the 208Pb nucleusas described in Sec. 2.1.2. The obtained results are given in the following.
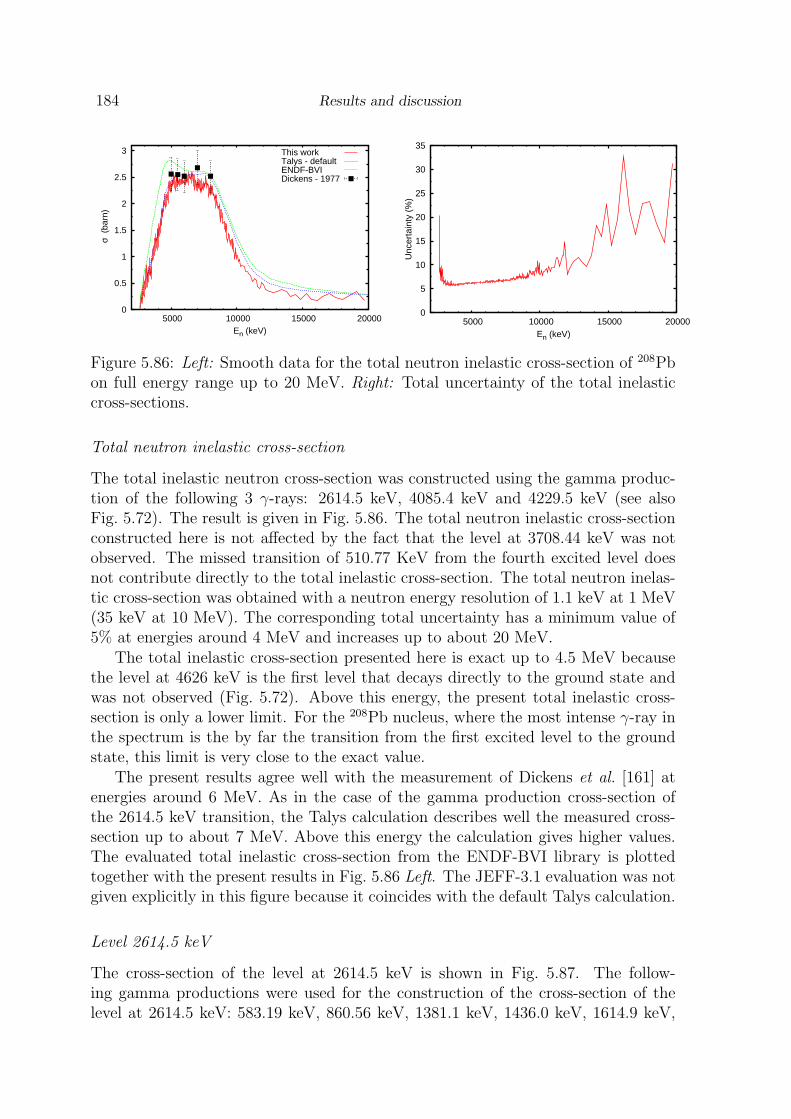
184 Results and discussion
0
0.5
1
1.5
2
2.5
3
5000 10000 15000 20000
σ (
barn
)
En (keV)
This workTalys - defaultENDF-BVIDickens - 1977
0
5
10
15
20
25
30
35
5000 10000 15000 20000
Unc
erta
inty
(%
)
En (keV)
Figure 5.86: Left: Smooth data for the total neutron inelastic cross-section of 208Pbon full energy range up to 20 MeV. Right: Total uncertainty of the total inelasticcross-sections.
Total neutron inelastic cross-section
The total inelastic neutron cross-section was constructed using the gamma produc-tion of the following 3 γ-rays: 2614.5 keV, 4085.4 keV and 4229.5 keV (see alsoFig. 5.72). The result is given in Fig. 5.86. The total neutron inelastic cross-sectionconstructed here is not affected by the fact that the level at 3708.44 keV was notobserved. The missed transition of 510.77 KeV from the fourth excited level doesnot contribute directly to the total inelastic cross-section. The total neutron inelas-tic cross-section was obtained with a neutron energy resolution of 1.1 keV at 1 MeV(35 keV at 10 MeV). The corresponding total uncertainty has a minimum value of5% at energies around 4 MeV and increases up to about 20 MeV.
The total inelastic cross-section presented here is exact up to 4.5 MeV becausethe level at 4626 keV is the first level that decays directly to the ground state andwas not observed (Fig. 5.72). Above this energy, the present total inelastic cross-section is only a lower limit. For the 208Pb nucleus, where the most intense γ-ray inthe spectrum is the by far the transition from the first excited level to the groundstate, this limit is very close to the exact value.
The present results agree well with the measurement of Dickens et al. [161] atenergies around 6 MeV. As in the case of the gamma production cross-section ofthe 2614.5 keV transition, the Talys calculation describes well the measured cross-section up to about 7 MeV. Above this energy the calculation gives higher values.The evaluated total inelastic cross-section from the ENDF-BVI library is plottedtogether with the present results in Fig. 5.86 Left. The JEFF-3.1 evaluation was notgiven explicitly in this figure because it coincides with the default Talys calculation.
Level 2614.5 keV
The cross-section of the level at 2614.5 keV is shown in Fig. 5.87. The follow-ing gamma productions were used for the construction of the cross-section of thelevel at 2614.5 keV: 583.19 keV, 860.56 keV, 1381.1 keV, 1436.0 keV, 1614.9 keV,
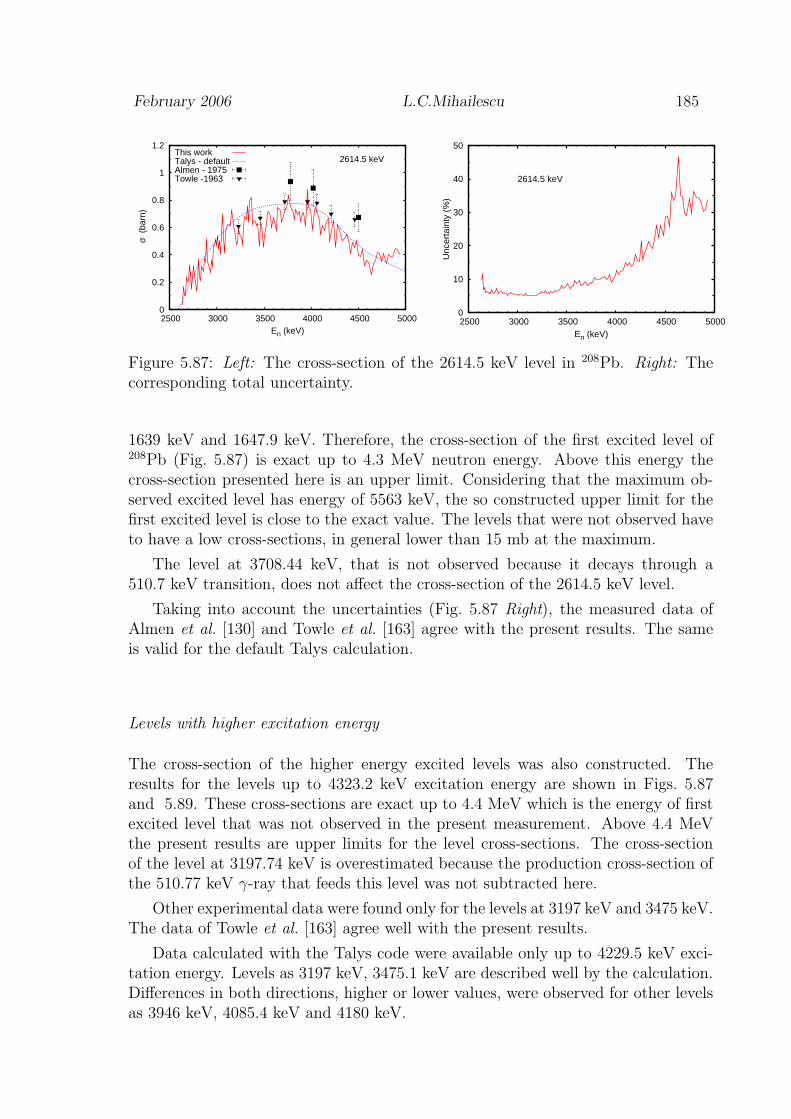
February 2006 L.C.Mihailescu 185
0
0.2
0.4
0.6
0.8
1
1.2
2500 3000 3500 4000 4500 5000
σ (
barn
)
En (keV)
2614.5 keVThis workTalys - defaultAlmen - 1975Towle -1963
0
10
20
30
40
50
2500 3000 3500 4000 4500 5000
Unc
erta
inty
(%
)
En (keV)
2614.5 keV
Figure 5.87: Left: The cross-section of the 2614.5 keV level in 208Pb. Right: Thecorresponding total uncertainty.
1639 keV and 1647.9 keV. Therefore, the cross-section of the first excited level of208Pb (Fig. 5.87) is exact up to 4.3 MeV neutron energy. Above this energy thecross-section presented here is an upper limit. Considering that the maximum ob-served excited level has energy of 5563 keV, the so constructed upper limit for thefirst excited level is close to the exact value. The levels that were not observed haveto have a low cross-sections, in general lower than 15 mb at the maximum.
The level at 3708.44 keV, that is not observed because it decays through a510.7 keV transition, does not affect the cross-section of the 2614.5 keV level.
Taking into account the uncertainties (Fig. 5.87 Right), the measured data ofAlmen et al. [130] and Towle et al. [163] agree with the present results. The sameis valid for the default Talys calculation.
Levels with higher excitation energy
The cross-section of the higher energy excited levels was also constructed. Theresults for the levels up to 4323.2 keV excitation energy are shown in Figs. 5.87and 5.89. These cross-sections are exact up to 4.4 MeV which is the energy of firstexcited level that was not observed in the present measurement. Above 4.4 MeVthe present results are upper limits for the level cross-sections. The cross-sectionof the level at 3197.74 keV is overestimated because the production cross-section ofthe 510.77 keV γ-ray that feeds this level was not subtracted here.
Other experimental data were found only for the levels at 3197 keV and 3475 keV.The data of Towle et al. [163] agree well with the present results.
Data calculated with the Talys code were available only up to 4229.5 keV exci-tation energy. Levels as 3197 keV, 3475.1 keV are described well by the calculation.Differences in both directions, higher or lower values, were observed for other levelsas 3946 keV, 4085.4 keV and 4180 keV.
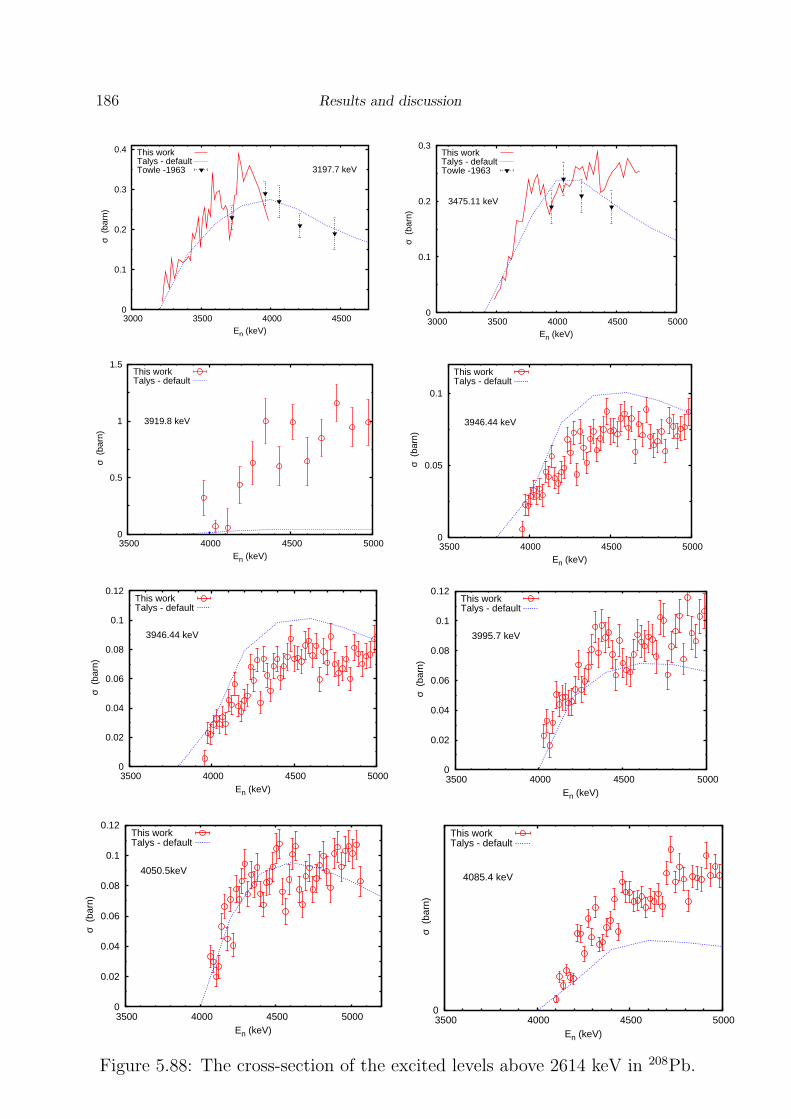
186 Results and discussion
0
0.1
0.2
0.3
0.4
3000 3500 4000 4500
σ (
barn
)
En (keV)
3197.7 keV
This workTalys - defaultTowle -1963
0
0.1
0.2
0.3
3000 3500 4000 4500 5000
σ (
barn
)
En (keV)
3475.11 keV
This workTalys - defaultTowle -1963
0
0.5
1
1.5
3500 4000 4500 5000
σ (
barn
)
En (keV)
3919.8 keV
This workTalys - default
0
0.05
0.1
3500 4000 4500 5000
σ (
barn
)
En (keV)
3946.44 keV
This workTalys - default
0
0.02
0.04
0.06
0.08
0.1
0.12
3500 4000 4500 5000
σ (
barn
)
En (keV)
3946.44 keV
This workTalys - default
0
0.02
0.04
0.06
0.08
0.1
0.12
3500 4000 4500 5000
σ (
barn
)
En (keV)
3995.7 keV
This workTalys - default
0
0.02
0.04
0.06
0.08
0.1
0.12
3500 4000 4500 5000
σ (
barn
)
En (keV)
4050.5keV
This workTalys - default
0 3500 4000 4500 5000
σ (
barn
)
En (keV)
4085.4 keV
This workTalys - default
Figure 5.88: The cross-section of the excited levels above 2614 keV in 208Pb.

February 2006 L.C.Mihailescu 187
0
0.02
0.04
0.06
0.08
0.1
4000 4500 5000
σ (
barn
)
En (keV)
4125.3 keV
This workTalys - default
0
0.02
0.04
0.06
0.08
0.1
0.12
0.14
4000 4500 5000
σ (
barn
)
En (keV)
4180.41 keV
This workTalys - default
0
0.02
0.04
4000 4500 5000
σ (
barn
)
En (keV)
4205.4 keV
This workTalys - default
0
0.02
0.04
0.06
0.08
0.1
4000 4500 5000
σ (
barn
)
En (keV)
4229.50 keV
This workTalys - default
0
0.02
0.04
0.06
0.08
0.1
0.12
4000 4500 5000
σ (
barn
)
En (keV)
4253.50 keV
This work
0
0.02
0.04
0.06
0.08
0.1
4000 4500 5000
σ (
barn
)
En (keV)
4262.4 keV
This work
0
0.02
0.04
0.06
0.08
4000 4500 5000
σ (
barn
)
En (keV)
4296.1 keV
This work
0
0.02
0.04
0.06
0.08
4000 4500 5000
σ (
barn
)
En (keV)
4323.2 keV
This work
Figure 5.89: The cross-section of the excited levels above 2614 keV in 208Pb.
188 Results and discussion
5.5.4 Conclusions
Using an 88.11 % enriched 208Pb sample, the production cross-section of the γ-raysfrom the neutron inelastic, (n,2n) and (n,3n) reaction on 208Pb was measured withan unprecedented neutron energy resolution and total uncertainty. The productioncross-section of the intense γ-rays was measured over the full energy range, from thethreshold up to about 20 MeV, in only one run.
The production cross-section was measured for 29 γ-rays of the inelastic reaction.The neutron energy resolution was 1.1 keV at 1 MeV up to 35 keV at 10 MeV. Thisresolution was equivalent to time-of-flight bins of 8 ns. A total uncertainty of about5 % below 8 MeV neutron energy was achieved for the most intense γ-ray transitionin 208Pb, 2614.5 keV. The excited level at 3708.44 keV was not observed becausethe main transition from the decay of this level has an energy of 510.77 keV andcannot be distinguished from the 511 keV background peak. Except for the level at3708.44 keV, at least one γ-ray was observed to decay from every excited level upto 4.3 MeV excitation energy. The maximum observed excited level has an energyof 5.563 MeV. The only reason for not observing all the levels between 4.3 MeV and5.5 MeV is their low cross-section.
Based on the 208Pb level scheme and on the measured gamma production cross-sections the total inelastic cross-section was constructed up to about 20 MeV neutronenergy. The level at 3708.44 keV that was not observed does not affect the totalinelastic cross-section. The cross-sections of the levels up to 4323.2 keV excitationenergy were obtained up to about 5 MeV neutron energy.
Five γ-rays from the (n,2n) reaction and one γ-ray from the (n,3n) reaction on208Pb were observed. 208Pb nucleus was the only case from the nuclei presentedin this work where the production cross-section was measured for a γ-ray from the(n,3n) reaction.
All the cross-sections presented here were corrected for the isotopic compositionof 208Pb sample. The best neutron energy resolution used for these transitions wasof 50 keV at 8 MeV (350 keV at 18 MeV). The uncertainties at the maximum of thecross-section ranged between 6 % and 15 % depending on the γ-ray.
The present results were compared with existing experimental data and withthe Talys code calculation with the default input parameters. The general goodagreement can be noted with the experimental data of Vonach et al. [152] and thedata of Dickens et al [161]. The Vonach et al. data agree relatively well withthe present measurement also for the (n,2n) and (n,3n) gamma production cross-sections.
The default Talys calculation describes well the gamma production of the2614.53 keV transition. For the second most intense transition in the 208Pb spec-trum, 583.19 keV, the calculation differs from the measurement in the middle energyrange and at energies above 12 MeV. The other inelastic gamma production cross-sections are described well at low energies. Important differences were observed athigh energies for some transitions.
The total inelastic cross-section is described well by the calculation below 7 MeV.The higher values given by the calculation at higher energies do not contradict the
February 2006 L.C.Mihailescu 189
fact that the curve presented here is a lower limit for the total inelastic cross-section above 4.5 MeV neutron energy. The good agreement observed for the totalinelastic cross-section may be reflected by the good description of the integral gammaproduction cross-section of the 2614.53 keV transition which are the most intensein the 208Pb spectrum.
The neutron inelastic, (n,2n) and (n,3n) cross-sections measured in this experi-ment for the 208Pb nucleus can be used in further neutron data evaluations and asbenchmark for the nuclear codes. Further tuning can still be done for the Talys codefor a better description of the 208Pb cross-sections presented here.

190 Results and discussion

Chapter 6
Conclusions
The project described in the present work had two main results:
• The (n,xnγ)(x=1,2,3) cross-sections were measured for five nuclei (52Cr, 209Biand 206,207,208Pb) with an unprecedented neutron energy resolution and totaluncertainty of about 5 % for the most intense γ-rays.
• It was proven that a 12 bits and 420 MSPS fast digitizer can be successfullyused at GELINA for the (n,xnγ)(x=1,2,3) cross-sections measurements withlarge volume HPGe detectors.
An experimental setup based on large volume HPGe detectors was used for the mea-surement of the production cross-section of the γ-rays from the neutron inelastic,(n,2n) and (n,3n)1 reactions on 5 nuclei: 52Cr, 209Bi and 206,207,208Pb. The very goodenergy resolution of the germanium detectors allowed the precise identification ofa large number of γ-rays from the reactions of interest in complex γ-ray spectra.Table. 6.1 gives the number of γ-rays in every studied reaction for which the pro-duction cross-section was measured. The maximum energy of an observed excitedlevel is also given.
Using the white neutron spectrum from Gelina, the production cross-sectionswere measured quasi-continuously over the full energy range from the thresholdup to about 20 MeV in only one long run for every nucleus. The neutron energyresolution of 1.1 keV at 1 MeV up to 35 keV at 10 MeV was realized for the mostintense γ-rays. This neutron energy resolution corresponds to 8 ns resolution inthe time-of-flight for a flight-path length of 200 m. To achieve such neutron energyresolution and small total uncertainties runs of about 500 to 1000 hours of effectivedata acquisition were needed for every nucleus.
The measured cross-section were normalized to the well known standard fissioncross-section of 235U. The neutron flux was measured simultaneously with the γ-ray yield avoiding the errors introduced by the sample-in sample-out normalizationtechniques.
The smallest cross-section that was measured in the present experiment wasaround 15 mb at the maximum. Just above the thresholds or at higher energies
1The (n,3nγ) cross-section was measured only for the 208Pb nucleus
191
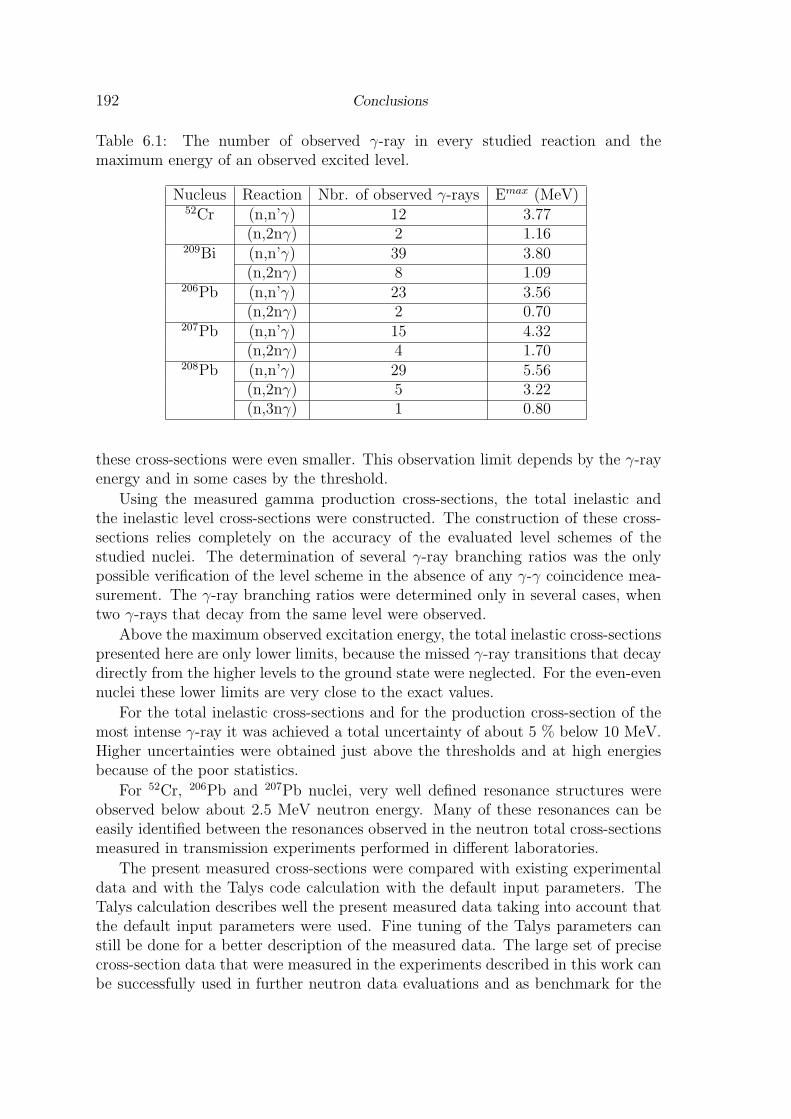
192 Conclusions
Table 6.1: The number of observed γ-ray in every studied reaction and themaximum energy of an observed excited level.
Nucleus Reaction Nbr. of observed γ-rays Emax (MeV)52Cr (n,n’γ) 12 3.77
(n,2nγ) 2 1.16209Bi (n,n’γ) 39 3.80
(n,2nγ) 8 1.09206Pb (n,n’γ) 23 3.56
(n,2nγ) 2 0.70207Pb (n,n’γ) 15 4.32
(n,2nγ) 4 1.70208Pb (n,n’γ) 29 5.56
(n,2nγ) 5 3.22(n,3nγ) 1 0.80
these cross-sections were even smaller. This observation limit depends by the γ-rayenergy and in some cases by the threshold.
Using the measured gamma production cross-sections, the total inelastic andthe inelastic level cross-sections were constructed. The construction of these cross-sections relies completely on the accuracy of the evaluated level schemes of thestudied nuclei. The determination of several γ-ray branching ratios was the onlypossible verification of the level scheme in the absence of any γ-γ coincidence mea-surement. The γ-ray branching ratios were determined only in several cases, whentwo γ-rays that decay from the same level were observed.
Above the maximum observed excitation energy, the total inelastic cross-sectionspresented here are only lower limits, because the missed γ-ray transitions that decaydirectly from the higher levels to the ground state were neglected. For the even-evennuclei these lower limits are very close to the exact values.
For the total inelastic cross-sections and for the production cross-section of themost intense γ-ray it was achieved a total uncertainty of about 5 % below 10 MeV.Higher uncertainties were obtained just above the thresholds and at high energiesbecause of the poor statistics.
For 52Cr, 206Pb and 207Pb nuclei, very well defined resonance structures wereobserved below about 2.5 MeV neutron energy. Many of these resonances can beeasily identified between the resonances observed in the neutron total cross-sectionsmeasured in transmission experiments performed in different laboratories.
The present measured cross-sections were compared with existing experimentaldata and with the Talys code calculation with the default input parameters. TheTalys calculation describes well the present measured data taking into account thatthe default input parameters were used. Fine tuning of the Talys parameters canstill be done for a better description of the measured data. The large set of precisecross-section data that were measured in the experiments described in this work canbe successfully used in further neutron data evaluations and as benchmark for the
February 2006 L.C.Mihailescu 193
nuclear codes.The detailed results will be sent to the online databases as EXFOR files. Part
of them is already available for online download.In parallel with the cross-section measurement with the conventional electronics,
a commercially available fast digitizer was tested for the use in time-of-flight mea-surements at Gelina with large volume HPGe detectors. Different pulse processingalgorithms were tested and the one with the best performances was implementedfor an online data acquisition. In the online data acquisition only the values of thetime and amplitude were saved for all recorded signals.
The tests for the use of the fast digitizer were concluded with the measurementof the neutron inelastic cross-sections for the 206Pb and for the 208Pb nucleus. Forthese two nuclei, the data acquisition system with the fast digitizer run in parallelwith the acquisition system based on conventional electronics. After the completedata analysis of the two data sets, from the fast digitizer and from the conventionalelectronics, the same values were obtained for the differential gamma productioncross-sections. This showed that the fast digitizer can be successfully used for the(n,xnγ) cross-section measurements at GELINA in favor of the data acquisitionsystem based on conventional electronics.
The advantage of the fast digitizer is the higher acquisition efficiency preservingthe time and amplitude resolution of the acquisition system based on conventionalelectronics. The increase in the efficiency is due to the following:
• The digitizer resolves the pile-up of the neutron induced events with thegamma-flash induced events. The resolving time of the digitizer is 2.5 µs,smaller than the conventional electronics.
• The tail of the time resolution spectrum is significantly reduced for the digitizercompared with the CF function and no pulse is rejected.
The performances of the tested digitizer can be improved in terms of acquisitionrate if an on-board signal processing could be available by means of an FPGA openedto be programmable by the user.

194 Conclusions
Bibliography
[1] L. C. Mihailescu, C. Borcea, L. Olah, A. J. M. Plompen, A new HPGesetup at Gelina for measurement of gamma-ray production cross-sections frominelastic neutron scattering, Nucl.Instr. and Meth A531 (2004) 375-391.
[2] L. C. Mihailescu, C. Borcea, A. J. M. Plompen, Measurements of neutron in-elastci scattering cross-sections for 52Cr from theshold up to 18 MeV, RadiationProtection Dosimetry, Vol. 115, No. 1-4, pp. 136-138, 2005
[3] L. C. Mihailescu, C. Borcea, A. J. M. Plompen, Measurements of neutroninelastic scattering cross-sections for 209Bi from threshold up to 18 MeV, inProceedings of the International Conference on Nuclear Data for Science andTechnology - ND2004, Sep.26-Oct.1,2004, Santa Fe, USA
[4] L. C. Mihailescu, C. Borcea, A. J. M. Plompen, Tests for the use of a fastdigitizer in a time-of-flight measurement with large volume HPGe detectors inProceedings of the NEMEA 2 Workshop, Bucharest, October 20-23, 2004.
[5] L. C. Mihailescu, C. Borcea, A. J. M. Plompen, Measurements of high-resolution neutron inelastic scattering cross-sections for 52Cr from threshold upto 18 MeV, in Proceedings of the NEMEA 1 Workshop, Budapest, October,2003.
[6] A.J.Koning, S.Hilaire and M.C.Duijvestijn, Talys: comprehensive nuclear re-action modeling, Proceedings of the International Conference on Nuclear Datafor Science and Technology - ND2004, Sep.26-Oct.1,2004, Santa Fe, USA
[7] G. Aliberti, G. Palmiotti, M. Salvatores, C. Stenberg, Impact of nuclear datauncertainties on transmutation of actinides in accelerator-driven assemblies,Nucl. Sci. Eng. 146 (2004) 13.
[8] I. G. Birn, A. Meister, E. Wattecamps, H. Weigmann, Measurement of the(n,n’γ) excitation functions of low-lying levels of molybdenum isotopes, in:A. V. G. Reffo, C. Grandi (Eds.), Proc. Conf. for Nuclear Data for Science andTechnology, Editrice Compositori, 40128 Bologna, Italy, Trieste, Italy, 1997, p.526.
[9] J.Q.Shao,G.P.Couchell,J.J.Egan,G.H.R.Kegel,S.Q.Li,A.Mittler,D.J.Pullen,anddW.A.Schier,Fast neutron inelastic scattering cross-section of 238U forstates between 680 and 1530 keV, Nucl. Sci. Eng. 92 (1986) 350–371
195
196 Bibliography
[10] N.V.Kornilov and A.B.Kagalenko, Inelastic neutron scattering by 235U and 238Unuclei, Nucl. Sci. Eng. 120 (1995) 55–64
[11] E. Sheldon, D. Van Patter, Compound inelastic nucleon and gamma-ray angulardistribution for even and odd-mass nuclei, Rev. of Mod. Physics 38 (1966) 143.
[12] G. Palmiotti, P. Finck, I. Gomes, B. Micklich, M. Salvatores, Uncertainty as-sessment for accelerator driven systems, in: Proc. Int. Conf. Global 1999, ANS,Jackson Hole, Wyoming, USA, 1999.
[13] M. Salvatores, G. Palmiotti, LMFBR design parameter uncertainties and targetaccuracies, Ann. Nucl. Energy 12 (1985) 291.
[14] G. Palmiotti, M. Salvatores, Use of integral experiments in the assessment oflarge liquid-metal fast breeder reactor basic design parameters, Nucl. Sci. Eng.87 (1984) 333.
[15] A. Fessler, D. L. Smith, Parameter sensitivities in nuclear reaction cross-sectioncalculations, Ann. Nucl. Energy 29 (2002) 363.
[16] C. Y. Fu, D. C. Larson, Effects of shape differences in the level densities ofthree formalisms on calculated cross sections, Report NEA/WPEC-16, OECD,Paris (1998).
[17] T. Kawano, Y. Watanabe, M. Kawai, Validity of DWBA calculations for neu-tron inelastic scattering from molybdenum isotopes, J. of Nucl. Sci. and Tech-nol. 35 (1998) 519.
[18] K. Shibata, Sensitivities of calculated cross sections of 56Fe to model parame-ters, NEA Report OECD/GD(94)21, OECD, Paris (1994).
[19] A. Hogenbirk, Extensive neutronic sensitivity-uncertainty analysis of a fusionreactor shielding blanket, Fusion Eng. and Design 24 (1994) 275.
[20] A. J. Koning, H. Gruppelaar, A. Hogenbirk, The EFF-3.0 evaluation for 56Fe,Fusion Eng. and Design 37 (1997) 211.
[21] C. L. Dunford, R. R. Kinsey, The NuDat System for Access to Nuclear Data,Report IAEA-NDC-205 (BNL-NCS-65687), IAEA, Vienna, Austria, also avail-able online from www.nndc.bnl.gov (1998).
[22] M. Bhat, Evaluated Nuclear Structure Data File, www.nndc.bnl.gov, NNDC,Brookhaven, USA (2003).
[23] S. Traiforos, A. Mittler, W. A. Schier, B. K. Barnes, L. E. Beghian, P. Harihar,Gamma-ray production and inferred inelastic neutron cross sections for nickelisotopes, Nucl. Sci. Eng. 72 (1979) 191–201.

6th January 2006 L.C.Mihailescu 197
[24] T. Yamamoto, Y. Hino, S. Itagaki, K. Sugiyama, Gamma-ray production crosssection for interaction of 14.8 MeV neutrons with O, Na, Al, Cl. Cr, Fe, Ni,Cu, Pb, J. of Nucl. Sci. and Technol. 15 (1978) 797.
[25] A. Meister, E. Wattecamps, A. Koning, A. Hogenbirk, H. Gruppelaar, Crosssections of inelastic neutron scattering for palladium isotope nuclei, in: A. V.G. Reffo, C. Grandi (Eds.), Proc. Conf. for Nuclear Data for Science and Tech-nology, Editrice Compositori, 40128 Bologna, Italy, Trieste, Italy, 1997, p. 586.
[26] F. Voss and C. Cierjacks and D. Erbe and G. Schmalz, Measurement of the γ-rayproduction cross sections from inelastic neutron scattering in some chromiumand nickel isotopes between 0.5 and 10 MeV, in: Conf. on Nuclear Cross Sec-tions and Technology, Washington USA, 1975, p. 916.
[27] H. Vonach, A. Pavlik, M. B. Chadwick, R. C. Haight, R. O. Nelson, S. A.Wender, P. G. Young, 207,208Pb(n,xnγ) reactions for neutron energies from 3 to200 MeV, Phys. Rev. C 50 (1994) 1952.
[28] N. Fotiades, G. D. Johns, R. O. Nelson, M. B. Chadwick, M. Devlin, W. S.Wilburn, P. G. Young, D. E. Archer, J. A. Becker, L. A. Becker, L. A. Bernstein,P. E. Garrett, C. A. McGrath, D. P. McNabb, W. Younes, Absolute partial γ-ray cross sections in 238U(n,xnγ) reactions, J. of Nucl. Sci. and Technol. Suppl.2 (2002) 234.
[29] G. F. Knoll, Radiation Detection and Measurement, 3rd edition, John Wileyand Sons, Inc., New York, USA, 2000.
[30] K. H. Bockhoff, A. D. Carlson, O. A. Wasson, J. A. Harvey, D. C. Larson,Electron linear accelerators for fast neutron data measurements in support offusion energy applications, Nucl. Sci. Eng. 106 (1990) 192.
[31] D. Tronc, J. M. Salome, K. Bockhoff, A new pulse compression system for in-tense relativistic electron beams, Nucl. Instrum. Methods Phys. Res. 228 (1985)346.
[32] A. Benussan, J. M. Salome, Gelina: a modern accelerator for high resolutionneutron time-of-flight measurements, Nucl. Instrum. Methods Phys. Res. 155(1978) 11.
[33] J. Gonzalez, C. Bastian, S. de Jonge, K. Hofmans, Modular MultiParameterMultiplexer, MMPM, hardware description and user manual, Internal ReportGE/R/INF/06/97, JRC-IRMM, Geel (1997).
[34] S. de Jonge, Fast Time Digitizer, Internal Report GE/DE/R/24/87, JRC-CBNM, Geel (1987).
[35] H. Conde, Nuclear Data Standards for Nuclear Measurements, ReportNEANDC-311 ”U”, OECD-Nuclear Energy Agency, Paris, France (1992).
198 Bibliography
[36] H. J. Rose, D. M. Brink, Angular distributions of gamma rays in terms ofphase-defined reduced matrix elements, Revs. Mod. Phys. 39 (1976) 306.
[37] R. D. Gill, Gamma-ray angular correlations and distributions, Academic Press,London, UK, 1975.
[38] K. E. Atkinson, An introduction to numerical analysis, 2nd edition, John Wileyand Sons, New York, USA, 1989.
[39] J. F. Briesmeister, MCNPTM - A General Monte Carlo N-Particle TransportCode, Report LA-13709-M, Los Alamos National Laboratory, Los Alamos NM,USA (2000).
[40] J.Q.Shao,G.P.Couchell,J.J.Egan,G.H.R.Kegel,S.Q.Li,A.Mittler,D.J.Pullen,anddW.A.Schier,Fast neutron inelastic scattering cross-section of 238U forstates between 680 and 1530 keV, Nucl. Sci. Eng. 92 (1986) 350–371
[41] N.V.Kornilov and A.B.Kagalenko, Inelastic neutron scattering by 235U and 238Unuclei, Nucl. Sci. Eng. 120 (1995) 55–64
[42] E. Sheldon, D. Van Patter, Compound inelastic nucleon and gamma-ray angulardistribution for even and odd-mass nuclei, Rev. of Mod. Physics 38 (1966) 143.
[43] G. Aliberti, G. Palmiotti, M. Salvatores, C. Stenberg, Impact of nuclear datauncertainties on transmutation of actinides in accelerator-driven assemblies,Nucl. Sci. Eng. 146 (2004) 13.
[44] G. Palmiotti, P. Finck, I. Gomes, B. Micklich, M. Salvatores, Uncertainty as-sessment for accelerator driven systems, in: Proc. Int. Conf. Global 1999, ANS,Jackson Hole, Wyoming, USA, 1999.
[45] M. Salvatores, G. Palmiotti, LMFBR design parameter uncertainties and targetaccuracies, Ann. Nucl. Energy 12 (1985) 291.
[46] G. Palmiotti, M. Salvatores, Use of integral experiments in the assessment oflarge liquid-metal fast breeder reactor basic design parameters, Nucl. Sci. Eng.87 (1984) 333.
[47] A. Fessler, D. L. Smith, Parameter sensitivities in nuclear reaction cross-sectioncalculations, Ann. Nucl. Energy 29 (2002) 363.
[48] C. Y. Fu, D. C. Larson, Effects of shape differences in the level densities ofthree formalisms on calculated cross sections, Report NEA/WPEC-16, OECD,Paris (1998).
[49] T. Kawano, Y. Watanabe, M. Kawai, Validity of DWBA calculations for neu-tron inelastic scattering from molybdenum isotopes, J. of Nucl. Sci. and Tech-nol. 35 (1998) 519.

6th January 2006 L.C.Mihailescu 199
[50] K. Shibata, Sensitivities of calculated cross sections of 56Fe to model parame-ters, NEA Report OECD/GD(94)21, OECD, Paris (1994).
[51] A. Hogenbirk, Extensive neutronic sensitivity-uncertainty analysis of a fusionreactor shielding blanket, Fusion Eng. and Design 24 (1994) 275.
[52] A. J. Koning, H. Gruppelaar, A. Hogenbirk, The EFF-3.0 evaluation for 56Fe,Fusion Eng. and Design 37 (1997) 211.
[53] C. L. Dunford, R. R. Kinsey, The NuDat System for Access to Nuclear Data,Report IAEA-NDC-205 (BNL-NCS-65687), IAEA, Vienna, Austria, also avail-able online from www.nndc.bnl.gov (1998).
[54] M. Bhat, Evaluated Nuclear Structure Data File, www.nndc.bnl.gov, NNDC,Brookhaven, USA (2003).
[55] A.H. Wapstra, G. Audi, and C. Thibault, Atomic mass table ,www.nndc.bnl.gov, NNDC, Brookhaven, USA (2003).
[56] S. Traiforos, A. Mittler, W. A. Schier, B. K. Barnes, L. E. Beghian, P. Harihar,Gamma-ray production and inferred inelastic neutron cross sections for nickelisotopes, Nucl. Sci. Eng. 72 (1979) 191–201.
[57] T. Yamamoto, Y. Hino, S. Itagaki, K. Sugiyama, Gamma-ray production crosssection for interaction of 14.8 MeV neutrons with O, Na, Al, Cl. Cr, Fe, Ni,Cu, Pb, J. of Nucl. Sci. and Technol. 15 (1978) 797.
[58] A. Meister, E. Wattecamps, A. Koning, A. Hogenbirk, H. Gruppelaar, Crosssections of inelastic neutron scattering for palladium isotope nuclei, in: A. V.G. Reffo, C. Grandi (Eds.), Proc. Conf. for Nuclear Data for Science and Tech-nology, Editrice Compositori, 40128 Bologna, Italy, Trieste, Italy, 1997, p. 586.
[59] I. G. Birn, A. Meister, E. Wattecamps, H. Weigmann, Measurement of the(n,n’γ) excitation functions of low-lying levels of molybdenum isotopes, in:A. V. G. Reffo, C. Grandi (Eds.), Proc. Conf. for Nuclear Data for Science andTechnology, Editrice Compositori, 40128 Bologna, Italy, Trieste, Italy, 1997, p.526.
[60] F. Voss and C. Cierjacks and D. Erbe and G. Schmalz, Measurement of the γ-rayproduction cross sections from inelastic neutron scattering in some chromiumand nickel isotopes between 0.5 and 10 MeV, in: Conf. on Nuclear Cross Sec-tions and Technology, Washington USA, 1975, p. 916.
[61] H. Vonach, A. Pavlik, M. B. Chadwick, R. C. Haight, R. O. Nelson, S. A.Wender, P. G. Young, 207,208Pb(n,xnγ) reactions for neutron energies from 3 to200 MeV, Phys. Rev. C 50 (1994) 1952.

200 Bibliography
[62] N. Fotiades, G. D. Johns, R. O. Nelson, M. B. Chadwick, M. Devlin, W. S.Wilburn, P. G. Young, D. E. Archer, J. A. Becker, L. A. Becker, L. A. Bernstein,P. E. Garrett, C. A. McGrath, D. P. McNabb, W. Younes, Absolute partial γ-ray cross sections in 238U(n,xnγ) reactions, J. of Nucl. Sci. and Technol. Suppl.2 (2002) 234.
[63] G. F. Knoll, Radiation Detection and Measurement, 3rd edition, John Wileyand Sons, Inc., New York, USA, 2000.
[64] K. H. Bockhoff, A. D. Carlson, O. A. Wasson, J. A. Harvey, D. C. Larson,Electron linear accelerators for fast neutron data measurements in support offusion energy applications, Nucl. Sci. Eng. 106 (1990) 192.
[65] D. Tronc, J. M. Salome, K. Bockhoff, A new pulse compression system for in-tense relativistic electron beams, Nucl. Instrum. Methods Phys. Res. 228 (1985)346.
[66] A. Benussan, J. M. Salome, Gelina: a modern accelerator for high resolutionneutron time-of-flight measurements, Nucl. Instrum. Methods Phys. Res. 155(1978) 11.
[67] J. Gonzalez, C. Bastian, S. de Jonge, K. Hofmans, Modular MultiParameterMultiplexer, MMPM, hardware description and user manual, Internal ReportGE/R/INF/06/97, JRC-IRMM, Geel (1997).
[68] S. de Jonge, Fast Time Digitizer, Internal Report GE/DE/R/24/87, JRC-CBNM, Geel (1987).
[69] H. Conde, Nuclear Data Standards for Nuclear Measurements, ReportNEANDC-311 ”U”, OECD-Nuclear Energy Agency, Paris, France (1992).
[70] H. J. Rose, D. M. Brink, Angular distributions of gamma rays in terms ofphase-defined reduced matrix elements, Revs. Mod. Phys. 39 (1976) 306.
[71] R. D. Gill, Gamma-ray angular correlations and distributions, Academic Press,London, UK, 1975.
[72] K. E. Atkinson, An introduction to numerical analysis, 2nd edition, John Wileyand Sons, New York, USA, 1989.
[73] J. F. Briesmeister, MCNPTM - A General Monte Carlo N-Particle TransportCode, Report LA-13709-M, Los Alamos National Laboratory, Los Alamos NM,USA (2000).
[74] Z. H. Cho, R. L. Chase, Comparative Study of the Timing Techniques CurrentlyEmployed with Ge Detectors, Nucl.Instr. and Meth A 356 (1995) 335-347.
[75] A. R. Frolov,T. V. Oslopova, Yu. N. Pestov, Double Treshold Discriminator forTiming Measurements, Nucl.Instr. and Meth A 98 (1972) 447-451 .

6th January 2006 L.C.Mihailescu 201
[76] J. P. Fouan, J. P. Passerieux, A time Compansation Method for CoincidencesUsing Large Coaxial Ge(Li) Detetors, Nucl.Instr. and Meth A 62 (1968) 327-329.
[77] A. Georgiev, W. Gast, Digital Pulse Processing in High Resolution, HighThroughput Gamma-Ray Spectroscopy, IEEE Trans.Nucl.Sci, NS-40, No. 4,1993, 770-779.
[78] G. F. Knoll, Radiation Detection and Measurement, 3rd edition, John Wileyand Sons, Inc., New York, USA, 2000.
[79] V. T. Jordanov, G. F. Knoll, Digital Syntesis of the Pulse Shapes in RealTime for High Resolution Radiation Spectroscopy, Nucl.Instr. and Meth. A345 (1994) 337-345.
[80] V. Radeka, Trapezoidal Filtering of Signals from Large Germanium Detectorsat High Rates, IEEE Trans.Nucl.Sci, NS-19, No. 1, 1972, 412-428.
[81] P. Ryge, R. R. Borchers, Coincidence Resolving Time of Large Coaxial Ge(Li)Detectors, Nucl.Instr. and Meth A 95 (1971) 137-140 .
[82] Z. H. Cho, R. L. Chase, Comparative Study of the Timing Techniques CurrentlyEmployed with Ge Detectors, Nucl.Instr. and Meth A 356 (1995) 335-347.
[83] A. R. Frolov,T. V. Oslopova, Yu. N. Pestov, Double Treshold Discriminator forTiming Measurements, Nucl.Instr. and Meth A 98 (1972) 447-451 .
[84] J. P. Fouan, J. P. Passerieux, A time Compansation Method for CoincidencesUsing Large Coaxial Ge(Li) Detetors, Nucl.Instr. and Meth A 62 (1968) 327-329.
[85] A. Georgiev, W. Gast, Digital Pulse Processing in High Resolution, HighThroughput Gamma-Ray Spectroscopy, IEEE Trans.Nucl.Sci, NS-40, No. 4,1993, 770-779.
[86] G. F. Knoll, Radiation Detection and Measurement, 3rd edition, John Wileyand Sons, Inc., New York, USA, 2000.
[87] V. T. Jordanov, G. F. Knoll, Digital Syntesis of the Pulse Shapes in RealTime for High Resolution Radiation Spectroscopy, Nucl.Instr. and Meth. A345 (1994) 337-345.
[88] V. Radeka, Trapezoidal Filtering of Signals from Large Germanium Detectorsat High Rates, IEEE Trans.Nucl.Sci, NS-19, No. 1, 1972, 412-428.
[89] P. Ryge, R. R. Borchers, Coincidence Resolving Time of Large Coaxial Ge(Li)Detectors, Nucl.Instr. and Meth A 95 (1971) 137-140 .
[90] EXFOR - Nuclear reaction experimental data files, www.nndc.bnl.gov
202 Bibliography
[91] ENSDF - Evaluated Nuclear Structure Data Files, www.nndc.bnl.gov
[92] Y. Han, Calculations and analysis of n+50,52,53,54Cr reactions in theEn ≤250MeV energy range, Nucl.Phys.A 748 (2005) 75-111.
[93] P. Oblozinsky, S. Hlavac, G. Maino, A. Mengoni, Gamma-ray production from52Cr(n,xnγ) reactions at 14.6 MeV, Il Nuovo Cimento vol.105 A, N7, 965.
[94] N. Olsson, E. Ramstrom, B. Trostell, Neutron elastic and inelastic scatteringfrom Mg, Si, S, Ca, Cr, Fe and Ni at En=21.6 MeV, Nucl.Phys. A 513 (1990)205-238.
[95] T. Yamamoto, Y. Hino, S. Itagaki, K. Sugiyama, Gamma-ray production crosssection for interaction of 14.8 MeV neutrons with O, Na, Al, Cl. Cr, Fe, Ni,Cu, Pb, J. of Nucl. Sci. and Technol. 15 (1978) 797.
[96] P. T. Karatzas, G. Couchell, B. K. Barnes, L. E. Beghian, P. Harihar, A. Mittler,D. J. Pullen, E. Sheldon, N. B. Sullivan, neutron Inelastic scattering cross-section for natural chromium determined from the (n,n’γ) reaction, Nucl. Sci.and Eng. 67 (1978) 34-53.
[97] I. A. Korzh, V. A. Mishchenko, E. N. Mozhzhukhin, M. V. Pasechnik,N. M. Pravdivyi, I. E. Sanzhur, Study of neutron scattering in the energy region1.5-3.0 MeV by even-even isotopes of Cr, Sov. J. Nucl. Phys. 26(6), Dec.1977.
[98] F. I. Habbani, A. H. Jiggins,Gamma emmision cross-sections for 23 elementsusing 3.29 MeV neutron inelastic scattering Nucl.Instr. and Meth I34 (1976)545-552.
[99] F. Voss and C. Cierjacks and D. Erbe and G. Schmalz, Measurement of the γ-rayproduction cross sections from inelastic neutron scattering in some chromiumand nickel isotopes between 0.5 and 10 MeV, in: Conf. on Nuclear Cross Sec-tions and Technology, Washington USA, 1975, p. 916.
[100] E. M. Burimov, Cross-sections for excitation of 16O, 27Al, 52Cr and 64,66,68Znlevels by 14.6 MeV neutrons, Sov. J. Nucl. Phys. 9(5), Nov.1969.
[101] Y. G. Degtyarev, N. V. Protopopov, Excitation of low-lying levels of 27Al, Cr,Fe and Bi in the inelastic scattering of 1-4 MeV neutrons, Atomnaya Energiya,Vol.23, No.6, 568-571, Dec. 1967.
[102] D. M. Van Patter, N. Nath, S. M. Shadroth, S. .S. Malik, M. A. Rothman,Gamma rays from inelastic neutron scattering in chromium, Phys. Rev. 128,1246 (1962).
[103] R. M. Kiehn, C. Goodman, neutron inelastic scattering, Phys. Rev. 95, 989(1954).
[104] A. Fessler, E.Wattecamps, D. L. Smith, S. M. Qaim, Excitation functions of(n,2n), (n,p), (n,np+pn+d), and (n,α) reactions, Phys. Rev. C58, 996 (1998).
6th January 2006 L.C.Mihailescu 203
[105] J. A. Harvey, D. C. Larson, N. W. Hill, Neutron resonance spectroscopy forn+52Cr: total and differential elastic scattering cross-sections, Phys.Rev. C62,014608 (2000)
[106] R.B.Galloway and J.Rahighi, A novel fast neutron time-of-flight system,Nucl.Instr. and Meth in Phys Research A 297 (1990) 452-456.
[107] X.Wang, Y.Wang, D.Wang, J.Rapaport Neutron scattering and neutronemission cross-sections on 27-Al, 93-Nb and 209-Bi at 7 MeV, Nucl. Phys.A465(1987) 483-496.
[108] A.Smith, P.Guenther, J.Whalen Fast neutron cross-sections of elemental Bis-muth, Nucl. Sci. and Eng. 75 (1980) 69-75.
[109] J.K.Dickens Neutron-induced gamma-ray production in Lead-208 for incident-neutron energies between 4.9 and 8.0 MeV and in Bismuth-209 for an incident-neutron energy of 5.4 MeV.,Nucl. Sci. and Eng. 63 (1977) 101-109.
[110] M.Matoba, M.Hyakutake, H.Tawaram, K.Thuji, H.Hasuyama, S.Matsuki,A.Katase, M.Sonoda, Scattering of 14.1 MeV from 209Bi, Nucl. Phys. A204(1973) 129-137.
[111] S.Tanaka, Y.Tomita, K.Ideno, S.Kikuchi, Fast neutron scattering from 139La,141Pr, Er, and 209Bi Nucl. Phys. A179 (1972) 513-523.
[112] P.Kuijper, J.C.Veefkind, C.C.Jonker, Neutron scattering from Bismuth, Stron-tium and Sodium at 14.8 MeV Nucl. Phys. A181 (1972) 545-565.
[113] A.B.Smith, J.F.Whalen, Fast-neutron total and scattering cross sections ofBismuth Nucl. Sci. and Eng. 41 (1970) 63-69.
[114] R.O.Owens, J.H.Towle, The level density of the deformed rare-earth nucleiNucl. Phys. A112 (1968) 337-359.
[115] L.Cranberg, T.A.Oliphant, J.Levin, C.D.Zafiratos, Fast-neutron scatteringfrom nuclides in the lead region Phys. Rev. vol.159 4(1967).
[116] R.M.Wilenzick, K.K.Seth, P.R.Bevington, H.W.Lewis, Elastic and inelasticscattering of 6 MeV neutrons Nucl. Phys. 62 (1965) 511-525.
[117] P.H.Stelson, R.L.Robinson, H.J.Kim, J.Rapaport, G.R.Satchler, Excitation ofcollective states by the inelastic scattering of 14 MeV neutrons Nucl. Phys. 68(1965) 97-140.
[118] D.B.Thomson, Nuclear level densities and reaction mechanisms from inelasticneutron scattering Phys. rev. vol.129 4(1963).
[119] L.Rosen, L.Stewart, Neutron emission probabilities from the interaction of14 MeV neutrons with Be, Ta, and Bi Phys. Rev. vol.107 3(1957).

204 Bibliography
[120] L.Cranberg, J.S.Levin, Neutron scattering at 2.45 MeV by a time-of-flightmethod Phys. Rev. vol.103 2(1956).
[121] J.Rethmeier, C.C.Jonker, M.Rodenburg, J.W.Hovenier, D.R.v.d.Meulen, Dif-ferential cross sections for d-t neutrons by time of flight methods Nucl.Instr.and Meth 17 (1962) 273-285.
[122] J.B.Weddell, Scattering of 4.4 MeV neutrons by Aluminum, Calcium,Chromium, and Bismuth Phys. Rev. vol.104 4(1956).
[123] V.E.Scherrer, B.A.Allison, W.R.Faust, Gamma radiation from interaction of3.2 MeV neutrons with various materials Phys. Rev. vol.96 2(1954).
[124] H.B.Levy, I.Perlman, Long-lived isomer of RaE (210Bi) Phys. Rev. vol.941(1953).
[125] E.A.Eliot, D.Hicks, L.E.Beghian, H.Halban, Inelastic scattering of neutronsPhys. Rev. vol.94 1(1953).
[126] R.M.Laszewski, P.Axel, Interaction of photons with 208Pb and neighboringisotopes at energies below the neutron emmission threshold, Phys. Rev. C19,no.2-342 (1979).
[127] L.R.Vesser, E.D.Arthur, P.G.Young, Cross sections for (n,2n) and (n,3n) re-actions above 14 MeV, Phys. Rev. C 16, no.5 - 1792 (1977).
[128] A.Adam, P.Hrasko, G.Palla, P.Quittner, The mechanism of the (n,2n) reac-tion, Nucl. Phys. 49 (1963) 489-495
[129] V.J.Ashby, H.C.Catron, L.L.Newkirk, C.J.Taylor, Absolute measurement of(n,2n) cross-sections at 14.1 MeV Phys. Rev. vol. 111, no.2 - 616 (1958).
[130] EXFOR files, www.nndc.bnl.gov
[131] ENSDF files, www.nndc.bnl.gov
[132] R.M.Laszewski, P.Axel, Interaction of photons with 208Pb and neighboringisotopes at energies below the neutron emmission threshold, Phys. Rev. C19,no.2-342 (1979).
[133] H.Zhou, X.Wang, C.Wang, M.Hua, G.Huang, G.Fan, T.Lu, S.Bartel, Discretegamma radiation in interaction of 14.9 MeV neutrons with natural Lead Nucl.Sci. and Eng. 134 (2000) 106-113
[134] S.F.Hicks, J.M.Hanly, S.E.Hicks, G.R.Shen, M.T.McEllistrem, Neutron scat-tering cross sections for 204,206Pb and neutron and proton amplitudes of E2 andE3 excitations Phys. Rev. C 49, no.1 (1994).
[135] J.K.Dickens, Gamma-ray transitions among levels of 206Pb Phys. Rev. C 28,no.2 (1983).

6th January 2006 L.C.Mihailescu 205
[136] T.Yamamoto, Y.Hino, S.Itagaki, K.Sugiyama, Gamma-ray production crosssections for interactions of 14.8 MeV neutrons with O, Na, Al, Cl, Cr, Fe, Ni,Cu and Pb J. of Nucl. Sci. and Technol. 15[11] (1978) 797-805.
[137] G.N.Salaita, P.K.Eapen, Isomeric cross sections for (n, 2n) reactions in Thal-lium, Lead and Bismuth at 14.8 MeV J. inorg. nucl. Chem. 35, (1973) 2139-2143.
[138] L.Cranberg, T.A.Oliphant, J.Levin, C.D.Zafiratos, Fast-neutron scatteringfrom nuclides in the Lead region Phys. Rev. 159, no.4 (1967).
[139] L.Cranberg, C.D.Zafiratos, Excitation of a 3-collective state by low-energyneutron scattering Phys. Rev. 142, no.3 (1966).
[140] S.G.Buccino, C.E. Hollandsworth, H.W.Lewis, P.R.Bevington, Inelastic scat-tering of neutrons from medium and heavy nuclei Nucl. Phys. 60, (1964) 17-34.
[141] D.B.Thomson, Nuclear level densities and reaction mechanisms from inelasticneutron scattering Phys. Rev. 129, no.4 (1963).
[142] J.W.Boring, M.T.McEllistrem, Differentialcross sections for (n,n’γ) reactionsin several nuclei Phys. Rev. 124, no.5 (1961).
[143] H.H.Landon, A.J.Elwyn, G.N.Glasoe, S.Oleksa, Neutron scattering at2.2 MeV by time of flight Phys. Rev. 112, no.4 (1958).
[144] R.B.Day, Gamma rays from neutron inelastic scattering Phys. Rev. 102, no.3(1956).
[145] R.M.Kiehn, C.Goodman, Neutron inelastic scattering Phys. Rev. 95, no.4(1954).
[146] D.J.Horen, J.A.Harvey and N.W.Hill 206Pb+n resonances fro E=600-900 keV:Neutron strength functions Phys. Rev. C24, 1961-1968 (1981).
[147] T.Yamamoto, Y.Hino, S.Itagaki, K.Sugiyama, Gamma-ray production crosssections for interactions of 14.8 MeV neutrons with O, Na, Al, Cl, Cr, Fe, Ni,Cu and Pb J. of Nucl. Sci. and Technol. 15[11] (1978) 797-805.
[148] L.Cranberg, T.A.Oliphant, J.Levin, C.D.Zafiratos, Fast-neutron scatteringfrom nuclides in the Lead region Phys. Rev. 159, no.4 (1967).
[149] R.B.Day, Gamma rays from neutron inelastic scattering Phys. Rev. 102, no.3(1956).
[150] H.Vonach, A.Pavlik, M.B.Chadwick, R.C.Haight, R.O.Nelson, S.A.Wender,P.G.Young 207,208Pb(n,xnγ) reactions for neutron energies from 3 to 200 MeV,Phys. Rev. C 50, no. 4 1952 (1994).
[151] D.J.Horen, J.A.Harvey and N.W.Hill Doorway staes in s-, p-, and d-waveentrance channels in 207Pb+n reaction Phys. Rev. C 18, 722-735 (1978).

206 Bibliography
[152] H.Vonach, A.Pavlik, M.B.Chadwick, R.C.Haight, R.O.Nelson, S.A.Wender,P.G.Young 207,208Pb(n,xnγ) reactions for neutron energies from 3 to 200 MeV,Phys. Rev. C 50, 1952 (1994).
[153] H.Zhou, X.Wang, C.Wang, M.Hua, G.Huang, G.Fan, T.Lu, S.Bartel, Discretegamma radiation in interaction of 14.9 MeV neutrons with natural Lead Nucl.Sci. and Eng. 134 (2000) 106-113
[154] S.Hlavac, P.Oblozinsky, L.Dostal, I.Turzo, V.Vonach, A.Pavlik, S.SomakovStudy of gamma radiation from interaction of 14.7 MEv neutrons with 208PbNucl. Sci. and Eng. 119 (1995) 195-202
[155] M.Yeh, P.E.Garretr, C.A.McGrath, S.W.Yates, T.Belgya Search for a2485 keV γ ray in 208Pb with the inelastic neutron scattering reaction, Phys.Rev. C 54, 942 (1996)
[156] M.Yeh, P.E.Garretr, C.A.McGrath, S.W.Yates, T.Belgya Two phonon octu-pole excitation in 208Pb, Phys. Rev. Lett 76, 1208 (1996)
[157] R.W.Finlay, J.R.M.Annand, T.S.Cheema, J.Rapaport, F.S.Dietricht Energydependence of neutron scattering from 208Pb in the energy range 7-50 MeVPhys. Rev. C 30, 796 (1984)
[158] F.S.Dietrich, R.W.Finlay, S.Mellema, G.Randers-Pehrson, F.Petrovich Isospindependence of the microscopic optical model for nucleon scattering Phys. Rev.Lett 51, 1629 (1983)
[159] P.P.Guss, C.E.Floyd, K.Murphy, C.R.Howell et al. Spin-orbit deformationsdeduced from analysing powers fro inelastic neutron scattering from 54Fe, 56Fe,58Ni, 60Ni, 120Sn and 208Pb Phys. Rev. C 25, 2854 (1982)
[160] D.E.bainum, R.W.Finlay, J.Rapaport, J.D.Carlson, W.G.Love Excitation oflow-lying collective states in 40Ca and 208Pb by inelastci neutron scatteringPhys. Rev. C 16, 1377 (1977)
[161] J.K.Dickens Neutron-induced gamma-ray production in Lead-208 for incident-neutron energies between 4.9 and 8.0 MeV and in Bismuth-209 for an incident-neutron energy of 5.4 MeV.,Nucl. Sci. and Eng. 63 (1977) 101-109.
[162] D.O.Nellis, I.L.Morgan, E.L.Hudspeth Neutron induced gamma-ray produc-tion in 208 Phys. Rev. C 9, 1972 (1974)
[163] J.H.Towle, W.B.Gilboy Inelastic neutron scattering in 208Pb, Nucl.Phys. 44(1963) 256-267
[164] V.L.Glagolev, P.A.Yampolskii An investigation of (n,2n) reactions leading toisomer formation Sov.Phys. JETP 13, no. 3, 520 (1961)
[165] R.Prasad, D.C.Sarkar Measurement of (n,2n) reaction cross-sections at14.8 MeV Nucl.Phys. 88 (1966) 349-352

6th January 2006 L.C.Mihailescu 207
[166] O.Hausser, F.C.Khanna, D.Ward Gamma decay of low-lying states near the208Pb closed shell, Nucl.Phys. A194 (1972) 113-139

208 Bibliography

Acknowledgements
I would like to thank several people who, in different ways, contributed to the
accomplishement of this Ph.D.
Firstly, I have to thank the promotor of this thesis, Prof.Dr. D.Bucurescu, for
his support and relevent advice. This work would have not been possible without
the daily supervion of Dr. A.J.M.Plompen who helped me significantly in the de-
velopement of this work. Moreover, I have to thank Prof. P.Rullhusen for accepting
me as a fellow at IRMM.
I am grateful to Dr. C.Borcea for many fruitful discussions and advice during
our daily collaboration.
A special thank should go to J.Gonzalez for his help and advice in setting up the
data acquisition system. I thank to V.Fitsch and the Informatics Unit Helpdesk for
their continuous help in solving many PC-related problems. I appreciated also the
help of W.Shubert during the short period in which we had the chance to collaborate.
I want to mention especially Dr. W.Mondelaers and all the operators of GELINA
and all the colleagues of NP unit for the support during these three years at IRMM.
I really appreciated the friendship of A.Porada, L.D.Smet, S.Vermote, A.Borrela,
M.Flaska, I.Ivailov, P.Siegler, K.Volev and R.Wynants, who made more pleasant my
stay in Belgium.
I would also like to thank everyone else who I have not mentioned personally
and contributed to this work.
Finally but the most important I have to thank my family for their continuous
support during these three years and not only. From my family, special thanks go
to my wife Mihaela Mihailescu for her continuos support and understanding.
209

210 Acknowledgements
Summary
The present work was motivated by the need of precise nuclear data for applications.The transmutation of long lived nuclear waste in subcritical reactors as the Acceler-ator Driven System (ADS) is one of the current application to which a large amountof research is dedicated. Precise calculation of the reactor parameters requires com-plete and precise nuclear data sets. Such nuclear data cannot be produced only withthe present nuclear codes and experimental data are still needed for the validationof these codes.
The (n,xnγ) reactions (x=1,2,3) are important nuclear processes that have to beconsidered in the reactor calculations for their influence on the neutron propagationcalculations in the reactor. These reactions have an impact also for the dosimetrycalculation and shielding design because γ-rays are emitted. In the (n,xnγ) reactionson the materials present in the reactor an important amount of energy is lost by theincident neutrons.
To answer to the needs of the nuclear applications, the neutron (n,xnγ) cross-sections (x=1,2,3) were measured for five different nuclei 52Cr, 209Bi and 206,207,208Pb.52Cr is present in the stainless steels used as structure materials of the new gener-ations of reactors. Bi and Pb are considered for the spallation target and for thecooling system of the ADS as Pb-Bi eutectic alloy.
A new experimental setup was developed at GELINA for the measurementsof the (n,xnγ) reaction cross-sections (x=1,2,3) from the threshold up to 20 MeVneutron energy using the (n,xnγ)-technique. The experimental setup was placedat 200 m flight length. The (n,xnγ)-technique involves the detection of the γ-raysfrom the (n,xn) reactions. Large volume HPGe detectors were used for the γ-raydetection. The advantage of these detectors consists of their very good energyresolution that allows the γ-ray identification in complex spectra and the increaseddetection efficiency. The time resolution for the present setup was 8 ns for all HPGedetectors. The neutron energy resolution that resulted from this time resolution was1.1 keV at 1 MeV (35 keV at 10 MeV).
Up to four large volume HPGe detectors were used in the experimental setup.The detectors are placed at 110o and 150o with respect to the beam directions. Theseangles are the roots of the fourth order Legendre polynomial and allowed preciseangle integration through a Gauss quadrature. The neutron flux was measured witha multilayer 235U fission chamber. In this way, the measured cross-sections werenormalized to the standard 235U neutron induced fission cross-section.
The data acquisition system used for the HPGe detectors was based on con-ventional electronics, with standard NIM modules. No γ-γ coincidence was done
211
212 Summary
between the HPGe detectors. The HPGe data were recorded simultaneously withthe data from the fission chamber to avoid any systematic errors from the neutronflux fluctuations. The dead time of the data acquisition systems for both HPGe de-tectors and fission chamber was negligible. Special care was taken for the absoluteefficiency determination of the HPGe detectors.
Highly enriched isotopic samples were used in the present experiments to reducethe number of peaks in the γ-ray spectrum and to easily separate different (n,xnγ)reactions in the sample. To achieve a small total uncertainty of about 5 % for themost intense γ-rays, samples with diameters between 5 cm and 8 cm and thicknessesof several mm were used. Therefore, the measured data had to be corrected forneutron attenuation and multiple scattering in the sample.
The good precision in measuring the (n,xnγ) cross-sections (good neutron energyresolution and small total uncertainty) was obtained by extended runs of minimum500 hours of data acquisition. To reduce the time for the data acquisition, specialattention was given for the increase in of the detection efficiency. The data acqui-sition system based on conventional electronics has two limitations regarding thedetection efficiency. Firstly, at neutron sources as GELINA, a γ-flash from the ac-celerator target arrives at the measurement station before every neutron burst andthis γ-flash produces a variable dead time in the conventional acquisition system.To avoid this situation, an inhibit signal was created to reject all the neutron burstsin which a γ-flash induced event was detected in the HPGe detectors. The secondlimitation of the conventional acquisition system is due to the use of the Slow RiseTime Rejection (SRTR) function of the Constant Fraction Discriminator (CFD)module. This function gives a very good time resolution, but at the expense of adecrease of efficiency, especially at low energies.
One solution for solving these two limitations of the conventional acquisitionsystem and to increase the detection efficiency of the present experimental setup isa new data acquisition system based on fast digitizers. Therefore, a commerciallyavailable fast digitizer with 12-bits and 420 MSPS was tested for use in time-of-flight measurement at GELINA with large volume HPGe detectors. The difficultyof implementing such data acquisition is coming from the diversity of signal shapesin the large volume HPGe detectors. With the increase of the detector volume, thechanges in the pulse shape and in the pulse rise time from the preamplifier of theHPGe detector are even more important. Different time and amplitude algorithmswere tested and compared off-line, on the same data sets recorded with the fastdigitizer. The algorithms with the best performances were implemented for anonline data acquisition.
To prove the digitizer performances in real conditions, the(n,xnγ) cross-sectionsof 206Pb and 208Pb nuclei were measured in parallel with both acquisition systems,with the conventional electronics and with the fast digitizer. The output signalsfrom the HPGe detectors were split and given simultaneously to both systems. Af-ter the analysis of the data from both systems the same values were obtained forthe differential gamma production cross-sections of 206Pb and 208Pb. From the com-parison between the differential gamma production cross-sections obtained with thetwo different acquisition systems it resulted that the fast digitizer can be success-

6th January 2006 L.C.Mihailescu 213
fully used for the (n,xnγ) cross-sections measurements (x=1,2,3) with large volumeHPGe detectors at GELINA. The conventional acquisition system can be replacedcompletely by the fast digitizer. The advantage of the fast digitizer compared withthe conventional data acquisition system is the increased efficiency especially at lowγ-ray energies, below 500 keV. The fast digitizer has almost the same time and γ-rayenergy resolution as the system based on conventional electronics. Moreover, theelectronic scheme of the setup is much simplified when the fast digitizer is used.
The detailed results for the (n,xnγ) cross-sections measurements (x=1,2,3) forthe five nuclei which were studied in this project, 52Cr, 209Bi and 206,207,208Pb, arepresented in Chapter 5. These results were obtained only with the conventional dataacquisition system. The data from the digitizer were not used here. One differentsection was dedicated to every nucleus.
The differential gamma production cross-sections at 110o and 150o were the pri-mary measured quantities in the present experiments. From these quantities, theangle integrated gamma production cross-sections were obtained through a Gaussquadrature. Based on the evaluated level scheme of the every nucleus and on theintegral gamma production cross-sections, the total inelastic and the inelastic levelcross-sections were constructed. For each nucleus, at least one gamma ray wasobserved from the decay of the levels up to about 3.5-4 MeV excitation energy.Therefore, above this energy, the total inelastic and the level cross-sections con-structed here are lower and respectively higher limits because of the decay that wasneglected from higher excited levels.
In the present experiments, the gamma production cross-section was measuredfor a minimum of 12 γ-rays (in 52Cr) and a maximum of 39 γ-rays (in 209Bi) frominelastic reaction channel. For the (n,2n) reaction channel, the gamma productioncross-section was measured for at least two γ-rays in each nucleus. The (n,3n)gamma production cross-section was measured only for one γ-ray from 208Pb nucleus.
The (n,xnγ) cross-sections were measured from the threshold up to 20 MeV,in one long run for each sample, with unprecedented neutron energy resolution andtotal uncertainty. The present results were compared with the existing experimentaldata and with calculations performed with the Talys code with the default inputparameters. Compared with the present results, the previous measured data arescarse and sometimes not in agreement with each other. For a default calculation,the Talys code describes well the present measured values.
Shortly, the (n,xnγ) cross-sections (x=1,2,3) were measured for five different nu-clei 52Cr, 209Bi and 206,207,208Pb on the full neutron energy range, from the thresholdup to 20 MeV in only one run for every nucleus. In these measurements, an extensiveset of precise cross-sections data was obtained. The precision of the data consist ofneutron energy resolution and total relative uncertainty of about 5% for the mostintense γ-rays and for the total inelastic cross-section. These data will be sent to thedatabases as EXFOR file and part of them are already available for online access.
Special attention was given to the increase of the detection efficiency of the ex-perimental setup. As a result, a new data acquisition system based on a fast digitizerwas implemented for online acquisition. This fast digitizer can replace completelythe system based on conventional electronics in the further experiments. The present
214 Summary
acquisition system based on the fast digitizer is one of the first experiments were afast digitizer is used with large volume HPGe detectors for time-of-flight measure-ments and comparable time and amplitude resolutions were obtained as in the caseof the conventional electronics.

Rezumat
Aceasta lucrare a fost motivata de nevoia de date nucleare precise pentru diferiteaplicatii. Transmutarea deseurilor radioactive cu timpi de viata lungi in reactorisubcritici precum Accelerator Driven System (ADS) este una din aplicatiile curentecareia ıi este dedicata o mare parte din cercetarea curenta ın domeniul nuclear.Calculele precise de reactori nucleari necesita seturi complete si precise de datenucleare. Astfel de date nucleare nu pot fi produse numai cu ajutorul codurilornucleare actuale si ınca este nevoie de date experimentale care sa valideze rezultatelecodurilor.
Reactiile (n,xnγ) cu x=1,2,3 sunt procese nucleare importante care trebuie con-siderate ın calculele de reactori pentru modul ın care influenteaza propagarea neu-tronilor ın reactor. In reactiile (n,xnγ) pe materiale prezente ıntr-un reactor nu-clear, neutronul incident pierde o importanta cantitate de energie ıntr-o sigurainteractie si mai mult, sectiunile acestor reactii reprezinta o fractiune importantadin sectiunea neutronica totala. Aceste reactii sunt considerate de asemenea ın cal-culele de dozimetrie si de proiectare a sistemelor de ecranare si de radioprotectiepentru faptul ca ın urma acestor reactii sunt emise radiatii γ.
Pentru a raspunde cerintelor aplicatiilor nucleare, ın cadrul proiectului prezentatın aceasta lucrare am masurat sectiunile pentru reactiile (n,xnγ) cu x=1,2,3 pen-tru cinci nuclee diferite: 52Cr, 209Bi si 206,207,208Pb. 52Cr este prezent ın otelurileinoxidabile folosite ın materialele de structura ale noii generatii de reactori nucleari.Bismutul si plumbul sunt materiale ce ar putea fi folosite ın aliaj eutectic Pb-Bipentru tinta de spalatie si pentru sistemul de racire ale ADS.
Pentru aceste masuratori de sectiuni de reactie (n,xnγ) (x=1,2,3) de la pragpana la aproximativ 20 MeV a fost creat un nou aranjament experimental la sursade neutroni GELINA. Aranjamentul experimental a fost amplasat la 200 m distantade zbor. Sectiunile de reactie au fost masurate prin tehnica (n,xnγ), care presupunedetectia radiatiilor γ emise ın urma reactiilor (n,xn). pentru detectia γ au fostfolositi detectori de volum mare de tip HPGe. Avantajul acestor detectori constaıntr-o rezolutie energetica foarte buna care permite identificarea precisa a picurilorγ ın spectre complexe si ın acelasi timp acesti detectori au o eficacitate de detectiesporita. Pentru detectorii de tip HPGe folositi ın acest experiment am folosit orezolutie temporala de 8 ns. Aceasta rezolutie temporala ımpreuna cu baza de zborde 200 m conduc la o rezolutie ın energie a neutronilor incidenti de 1.1 keV la 1 MeV(35 keV la 10 MeV).
In prezentul aranjament experimental au fost folositi maximum 4 detectori devolum mare (eficacitate relativa de detectie ıntre 80 % si 104 %) de tip HPGe. Acesti
215
216 Rezumat
detectori au fost asezati la unghiuri de 110o si respectiv 150o de grade fata de directiafasciculului incident de neutroni. Aceste doua unghiuri reprezinta radacinile poli-nomului Legendre de ordinul 4 si permit integrarea unghiulara precisa a sectiunilor,printr-o cuadratura Gauss. Fluxul de neutroni a fost masurat cu o camera de fisiunecu 235U. In acest fel sectiunile masurate au fost normate la sectiunea standard defisiune indusa de neutroni a 235U.
Achizitia datelor a fost facuta cu un sistem de achizitie bazat pe electronica de tipNIM cu module conventionale. In aceste experimente nu au fost facute masuratoride coincidenta γ-γ ıntre detectorii de tip HPGe. Datele de la acestia din urma au fostınregistrate simultan cu datele de la camera de fisiune pentru a evita posibilele erorisistematice introduse de fluctuatiile in fluxul de neutroni. Atat pentru achizitiadetectorilor de germaniu cat si pentru cea a camerei de fisiune timpul mort deachizitie a fost neglijabil. O atentie sporita a fost acordata determinarii eficacitatiide detectie a detectorilor de tip HPGe.
In experimentele descrise ın aceasta lucrare au fost folosite tinte ımbogatite pen-tru a reduce numarul de picuri ın spectrele γ si pentru a facilita separarea diferitelorreactii (n,xnγ) ın fiecare tinta. Pentru a obtine o eroare totala de aproximativ 5 %pentru cele mai intense tranzitii γ, am folosit tinte cu diametrul cuprins ıntre 5 cm si8 cm si grosimea de cativa mm. De aceea sectiunile de reactie masurate ın eceste ex-perimente au fost corectate pentru atenuarea si ımprastierea multipla a neutronilorın tinta.
Pentru a obtine o buna precizie a masuratorilor de sectiuni (n,xnγ), prin aceastaıntelegand o buna rezolutie ın energie a neutronilor incidenti si o eroare totala mica,cel putin 500 de ore de achizitie efectiva de date au fost necesare. Pentru a reducetimpul necesar achizitiei de date, am acordat o atentie speciala cresterii eficacitatii dedetectie. Sistemul de achizitie bazat pe electronica conventionala are doua limitariprivind eficacitatea de dectie. Mai ıntai, la sursele de neutroni precum GELINA,fiecare puls de neutroni este precedat de un ”flash” γ, care poate introduce un timpmort ın sistemul de achizitie. Pentru a evita aparitia unui astfel de timp mortvariabil ın sistemul de achizitie am creat un semnal de inhibit pentru a eliminatoate pulsurile de neutroni ın care a fost detectat un eveniment indus de γ-flash.Cea de-a doua limitare a sistemului de achizitie bazat pe electronica conventionala sedatoreaza folosirii functiei Slow Rise Time Rejection (SRTR) a modulelor ConstantFraction Discriminator (CFD). Cu aceasta functie se obtine o rezolutie temporalafoarte buna, dar cu pretul unei scaderi ın eficienta.
O solutie pentru rezolvarea acestor doua limitari ale sistemului de achizitieconventional si pentru a mari eficacitatea de detectie a aranjamentului experimentaleste un nou sistem de achizitie bazat pe un digitizer rapid. Pentru aceasta, am testatun digitizer rapid, cu 12-biti si 420 MSPS pentru a fi folosit ın masuratori de timp dezbor la GELINA cu detectori de volum mare de tip HPGe. Dificultatea folosirii unuiastfel de digitizer rapid provine din diversitatea de forme a semnalelor de iesire dela preamplificatorii detectorilor de volum mare de tip HPGe. Schimbarile ın formasi ın timpii de crestere ale pulsurilor de la detectorii de tip HPGe se accentueazacu cresterea volumului detectorilor. Diferiti algoritmi pentru determinarea timpuluisi amplitudinii pulsurilor de la preamplificator au fost comparati off-line, pe ace-
6th January 2006 L.C.Mihailescu 217
leasi seturi de date ınregistrate cu digitizerul rapid. Algoritmii cu cele mai buneperformante au fost implementati pentru o achizitie de date online.
Pentru a dovedi performantele digitizerului rapid ın conditii reale, sectiunile(n,xnγ) pentru 206Pb and 208Pb au fost masurate ın paralel cu ambele siteme deachizitie. Semnalele de iesire de la detectorii de germaniu au fost ımpartite si datesimultan la cele doua sisteme de achizitie. Valorile pentru sectiunile diferentialede productie gama pentru 206Pb si 208Pb obtinute ın paralel cu cele doua sistemede achizitie sunt ıntr-o concordanta foarte buna. Din aceasta comparatie ıntrerezultatele obtinute ın paralel cu cele doua sisteme de achizitie a rezultat ca dig-itizerul rapid poate fi folosit cu succes la GELINA pentru masuratori de sectiuniın reactiile (n,xnγ) (x=1,2,3) cu detectori de volum mare de tip HPGe. Sistemulde achizitie conventional poate fi ınlocuit ın experimentele viitoare cu sistemul deachizitie bazat pe digitzerul rapid. Avantajul acestui digitizer comparat cu sistemulde achizitie bazat pe electronica conventionala consta ın eficacitatea de detectiesporita, ın special la energii gama joase, sub 500 keV. Rezolutiile temporala si ener-getica ale digitizerului rapid sunt comparabile cu cele obtinute cu module electron-ice conventionale. Mai mult schema electronica a aranjamentului experimental estemult simplificata ın cazul ın care digitizerul rapid este folosit.
Rezultatele detaliate ale masuratorilor de sectiuni ın reactiile (n,xnγ) pentrux=1,2,3 sunt prezentate ın Capitolul 5 pentru toate cele 5 nuclee studiate: 52Cr,209Bi si 206,207,208Pb. In fiecare din cele 5 sectiuni ale acestui capitol este prezentatcate un nucleu. Aceste rezultate au fost obtinute numai cu sistemul de achizitiebazat pe electronica conventionala. Datele ınregistrate cu digitizerul rapid nu aufost folosite aici.
Sectiunile diferentiale de productie gama la 110o si 150o au fost marimile primaredeterminate ın aceste experimente. Din aceste sectiuni au fost obtinute sectiunileintegrate dupa unghi printr-o integrare de cuadratura Gauss. Pe baza schemelor denivele evaluate ale acestor nuclee si folosind sectiunile de productie gama integraleau fost construite sectiunea totala inelastica si sectiunile nivelelor excitate inelastice.Pentru fiecare nucleu a fost observata cel putin o tranzitie gama din dezintegrareafiecarui nivel pana la 3.5-4 MeV energie de excitare. De aceea, deasupra acesteienergii, sectiunea totala inelastica si sectiunile de nivel prezentate aici sunt limiteinferioare si respectiv superioare pentru ca dezintegrarile de pe nivelele superioareau fost neglijate.
In aceste experimente sectiunile inelastice de productie gama au fost masuratepentru cel putin 12 tranzitii γ pentru 52Cr si maximum 39 tranzitii pentru 209Bi.Pentru canalul de reactie (n,2n), sectiunile de productie gama au fost masuratepentru cel putin 2 tranzitii gama ın fiecare nucleu. In cazul reactiei (n,3n) sectiuneade productie gama a fost masurata doar pentru o tranzitie gama din nucleul 208Pb.
Sectiunile de reactie (n,xnγ) au fost masurate de la energia de prag a neutron-ilor incidenti pana la 20 MeV, ıntr-un sigur experiment pentru fiecare nucleu, cuo rezolutie ın energie a neutronilor incidenti fara precedent si cu o eroare relativetotala mica. Rezultatele acestor experimente au fost comparate cu rezultate ex-perimentale existente si cu calcule facute cu codul Talys cu parametrii de intrareinitiali. In comparatie cu rezultatele prezentate ın aceasta lucrare, rezultatele gasite

218 Rezumat
ın literatura sunt foarte putine si uneori nu sunt ın concordanta ıntre ele. Calculelede sectiuni de reactie facute cu Talys descriu bine rezultatele masuratorilor actualetinand cont de faptul de ın calcule au fost folositi parametrii initiali ai codului.
In concluzie, sectiunile ın reactiile (n,xnγ) (x=1,2,3) au fost masurate pentru 5nuclee diferite 52Cr, 209Bi si 206,207,208Pb pe ıntreaga scala de energie a neutronilorincidenti, de la energia de prag pana la 20 MeV, ıntr-un singur experiment pentrufiecare nucleu. Din aceste masuratori au rezultat un set mare de sectiuni de reactiimasurate cu precizie. Precizia datelor consta ın rezolutia energetica a neutronilorincidenti si ın eroarea totala de aproximativ 5 % pentru sectiunea de productie acelor mai intense tranzitii γ si pentru sectiunile totale inelastice. Aceste date vorfi trimise la bazele de date nucleare ın format EXFOR si deja o parte din ele suntaccesibile online.
In cadrul acestui proiect a fost acordata atentie deosebita cresterii eficienteide detectie a aranjamentului experimental. Ca rezultat al acestor eforturi a fostcreat un nou sistem de achizitie bazat pe un digitizer rapid care va ınlocui sistemulde achizitie actual bazat pe electronica conventionala ın urmatoarele experimente.Acest sistem de achizitie bazat pe un digitizer rapid reprezinta unul dintre primeleexperimente ın care un digitizer rapid a fost folosit ımpreuna cu detectori de volummare de tip HPGe ın masuratori de timp de zbor si au fost obtinute rezolutii tem-porale si de amplitudine comparabile cu cele ale electronicii conventionale.


European Commission
EUR 22343 EN – DG Joint Research Centre, Institute for Reference Materials and Measurements
Title: Neutron (n,xnγ) cross-section measurements for 52Cr, 209Bi and 206,207,208Pb from threshold up to 20 MeV
Authors: Liviu Cristian Mihailescu Luxembourg: Office for Official Publications of the European Communities 2006 – 236 pp. – 29.7 x 20.9 cm EUR - Scientific and Technical Research series; ISSN 1018-5593 ISBN 92-79-02885-5
Abstract
The present report contains the thesis prepared by the author to obtain the degree of Doctor of Science from the University of Bucharest, Faculty of Physics. The work presented in this thesis was carried out at the GELINA facility and in the Neutron Physics Unit of the IRMM in Geel, Belgium. The work was performed while the author was employed as a JRC grant holder (contract number 20207) under the supervision of A. Plompen. This work received financial support from the EUROTRANS Integrated Project under contract number 22390.

The mission of the JRC is to provide customer-driven scientific and technical support for the conception, development, implementation and monitoring of EU policies. As a service of the European Commission, the JRC functions as a reference centre of science and technology for the Union. Close to the policy-making process, it serves the common interest of the Member States, while being independent of special interests, whether private or national.
LA- N
A- 22343- E
N- C