
Deciziilor Manageriale-Bazele Matematice Ale Deciziilor Manageriale
Upload
amariei-mihaiCategory
view
213download
1description
Highway Capacity Manual 2000
4-i Chapter 4 - Decision Making
CHAPTER 4
DECISION MAKING
CONTENTS
I. INTRODUCTION ....................................................................................................... 4-1II. DECISION MAKING .................................................................................................. 4-1
Types of Decisions to Which the HCM Applies .................................................. 4-1Operational ................................................................................................. 4-1Design ......................................................................................................... 4-2Planning ...................................................................................................... 4-2
Roles of Performance, Effectiveness, and Service Measures and LOS ............ 4-2III. PRESENTING RESULTS TO FACILITATE INTERPRETATION.............................. 4-3
Selecting Appropriate Measures ........................................................................ 4-3Understanding Sensitivity of Measures .............................................................. 4-4Graphic Representation of Results .................................................................... 4-4
IV. REFERENCES .......................................................................................................... 4-6
EXHIBITS
Exhibit 4-1. Example of a Graphic Display of LOS......................................................... 4-4Exhibit 4-2. Example of a Thematic Graphic Display of LOS ......................................... 4-5Exhibit 4-3. Example of a Cost-Effectiveness Graph ..................................................... 4-5

Highway Capacity Manual 2000
4-1 Chapter 4 - Decision MakingIntroduction
I. INTRODUCTION
This chapter explains how to use the results of the Highway Capacity Manual(HCM) analyses in making decisions for planning, designing, and operatingtransportation facilities. It begins with the types of decisions to which the HCM usuallyis applied; discusses the role of measures of effectiveness (MOEs), level of service(LOS), and other performance measures; and concludes with some guidelines andexamples on the presentation of results to facilitate interpretation.
II. DECISION MAKING
TYPES OF DECISIONS TO WHICH THE HCM APPLIES
Chapter 3 has described the analysis levels of operational, design, and planning.This section now turns to the types of decisions frequently associated with each of theselevels. Combining service measures with performance measures allows the user to matchthe evaluation process to the problem at hand. However, decisions related to safetycannot be made effectively using the methodologies and performance measures in theHCM.
Operational
Operational analyses generally identify the existence and nature of a problem.Therefore, in making any decision, an analyst first considers whether a given element,facility, area, or system has a potential problem requiring study. In this case, the analystsimply decides if there is or will be a problem. This is what highway needs studies do.The prediction models of the HCM can be used even if the performance cannot bedirectly measured in the field. The analyst often uses the HCM as a framework todocument a problem about which the agency has been alerted by the public or by otheragencies.
However, operational analyses often do not end with the confirmation of a problem.They usually also entail a decision on how the problem might be remedied (i.e., throughcountermeasures). Typically, several alternatives for improvement are proposed, leadingto the next decision. One alternative must be selected as the recommended plan. TheHCM can be used to predict the change in performance measures for each alternative, tohelp in selecting and recommending a plan.
Examples of decisions forwhich the HCM can be usedDecisions that use results from the HCM include choosing among alternatives for
intersection controls, for signal phasing and timing arrangements, and for minor changesto control and marking (e.g., location of parking and bus stops, reconfiguring the numberand the use of lanes, frequency of bus service, and relocating or eliminating streetfurniture for pedestrians), as well as choosing among a combination of actions.
There also may be a need to decide on the feasibility of a proposed operationalimprovement. The addition of exclusive turning lanes or the extension of existing turninglanes can be considered at intersections. Another example is that a bicycle lane or a high-occupancy vehicle lane might be recommended for placement within the current right-of-way of an urban street. HCM analyses can determine if the space lost to other modes oftravel (i.e., pedestrians and other vehicles) will result in an unacceptably low LOS,making the alternative unfeasible.
HCM methods are used to estimate performance measures for assessing alternativeactions. Combined with other factors as desired, these then can assist decision makers incomparing alternatives and choosing the most appropriate course.
Highway Capacity Manual 2000
Chapter 4 - Decision Making 4-2Decision Making
Design
Design determinations for which the HCM is used most commonly involve decisionson the number of lanes, or the amount of space, needed to operate a facility at a desiredLOS. For example, if a basic freeway segment is to be designed for an LOS with aservice flow rate of 2,000 passenger cars per hour per lane (pc/h/ln) and the demand flowrate is 4,500 pc/h, the number of lanes required is calculated as 2.25 (from 4,500/2,000).Based on this information only, the analyst might choose to design the segment with threelanes. However, the segment may be one of several alternative designs underconsideration. Others might have better geometrics, closer to base conditions, and mightresult in a higher service flow rate, indicating a need for only two lanes.
This is the simplest form of design determination found in the HCM. Therelationship between service flow rate and geometrics and controls is much morecomplex for other facility types covered—computing the number of lanes required is nota simple matter. The HCM can be used to select among alternative designs either bycomparing the LOS at which each alternative would operate or by finding the attributes ofthe design that result in a targeted LOS.
PlanningProblem identification HCM analyses are useful for such planning decisions as determining the need to
improve a system (e.g., a highway network). This kind of analysis is similar to anoperational analysis, except that it requires less detail for the inputs and uses a greaternumber of default values. The decision not only involves whether improvements areneeded, but if so, what type and where. This is determined by testing a series ofalternatives and comparing their performance measures. The measures produced by theHCM methodologies either will play a role as criteria for decision making, or they willact as interim inputs to a planning model that will generate its own performancemeasures. Ultimately, the HCM methods produce results that support decision making.
Alternative analyses anddesign determination Planning decisions involving the HCM often relate to the feasibility of a new
commercial or residential development. For example, if a shopping center is proposedfor a location, the HCM analyses can be used to decide if the traffic generated by thedevelopment would result in an undesirable quality of service. This decision involves thedetermination of service measures, LOS, and other appropriate performance measures(e.g., v/c ratio and queue lengths). If the development is found unfeasible as proposed,due to an unacceptable impact on street or intersection operation, the HCM also can beused to assess alternative improvements to make it feasible. In this way, the HCM can beused in deciding what should be required of a new commercial or residential developmentas well as cost-sharing for any public improvements in conjunction with the development.For example, the developer might be required to change the location, number, orgeometrics of access points based on tests made using the HCM.
Planning decisions Planning analyses also can be performed to decide on the feasibility of a proposedpolicy. For example, if a city is considering a policy to provide special lanes for bicyclesor high-occupancy vehicles, scenarios can be tested to allow decision makers to arrive atthe most appropriate requirements for the policy.
ROLES OF PERFORMANCE, EFFECTIVENESS, AND SERVICE MEASURESAND LOS
As described in Chapter 2, operations on each facility type or element of the overalltransportation system can be characterized by a set of performance measures, bothqualitative and quantitative. Quantitative measures estimated using the analyticalmethods of this manual are termed measures of effectiveness (MOEs). For each facilitytype, a single MOE has been identified as the service measure that defines the operatingLOS for the specific facility. (More than one MOE is used in the LOS determination fortransit facilities and for two-lane highways).
Highway Capacity Manual 2000
4-3 Chapter 4 - Decision MakingDecision Making
LOS is only one of severalways to evaluate operationalconditions
Analysis and decision making using the HCM methods almost always involvesestimating or determining a service measure and the related LOS. Parts III and IVprovide methods for generating performance measures in addition to the specific servicemeasure; these can be useful inputs in decision making. In some cases, performancemeasures can be more important to the decision than the LOS rating. An example is thelength of queue caused by oversaturation. If the analysis predicts a problem due to aqueue backup into an upstream intersection, the next steps are to generate and selectalternatives to resolve the problem. Another example is the volume/capacity (v/c) ratiofor signalized intersections. Although delay is used to establish the LOS, the v/c ratiosometimes can indicate potential problems, even when the LOS is acceptable.
Each of the methodological chapters provides a different set of performancemeasures, summarized in Chapter 9. Users of this manual should become familiar withthe performance measures that can be estimated using the HCM, and with how theperformance measures can enhance decision making.
III. PRESENTING RESULTS TO FACILITATE INTERPRETATION
SELECTING APPROPRIATE MEASURESPerformance measuresselected should be related tothe problem being addressed
Several performance measures can result from HCM analyses. Determining the mostappropriate measures to use for a decision depends on the particular case. However,decision-making situations generally can be divided into those involving the public (e.g.,city councils or community groups) and those involving technicians (e.g., state or localengineering staff or transit planners).
The HCM is highly technical and complex. The results of the analyses can bedifficult for people to interpret for decision making, unless the data are carefullyorganized and presented. In general, the results should be presented as simply aspossible. This might include using a small set of performance measures and providingthe data in an aggregate form, without losing the ability to relate to the underlyingvariations and factors that have generated the results.
The LOS concept was created, in part, to make the presentation of results easier tounderstand than if the numerical values of the MOEs and service measures were reporteddirectly. It is easier to understand a grading scale similar to that of the traditional schoolreport card than to deal with measures such as density and v/c ratio. Although there arelimitations to their usefulness, LOS ratings remain a part of the HCM because of theiracceptance by the public and elected officials. Decision makers who are not analyticallyoriented often prefer to have a single number or letter represent a condition. It isgenerally not effective to provide representatives of the public with a large set of differingmeasures or with a frequency distribution for a specific performance measure. If theanalyst has several measures available, it is preferable to select the one that best fits thesituation and keep the others in reserve until needed.
Decision makers who represent the public usually prefer measures that theirconstituents can understand; the public can relate to LOS grades. Unit delay (e.g.,seconds per vehicle) and travel speed also are readily understood. However, v/c, density,percent time spent following, and vehicle hours of travel are not measures to which thepublic easily relates. When selecting the measures to present, therefore, it is importantfor the analyst to recognize the orientation of the decision maker and the context in whichthe decision will be made. In general, these measures can be differentiated as system-user or system-manager oriented. When making a presentation to technical members of apublic agency, such as highway engineers and planners, it might be necessary to use more
Highway Capacity Manual 2000
Chapter 4 - Decision Making 4-4Presenting Results to Facilitate Interpretation
than one performance measure, especially when providing both the system-user andsystem-manager perspectives.
UNDERSTANDING SENSITIVITY OF MEASURESEvaluate how resultschange with inputassumptions
Once one or more performance measures have been selected for reporting analysisresults, decision making can be improved by demonstrating how the numerical values (orthe LOS letter grade) change when one or more of the assumed input values change. Itcan be important for the decision maker to know how an assumed increase of 15 percentin future traffic volume (compared with the standard forecast volume) will affect delayand LOS at a signalized intersection. By providing a central value along with valuesbased on upward and downward assumptions on key input variables (especially volume),the analyst ensures that decision making is based on a full understanding of sensitivities.The Traffic Engineering Handbook (1) provides examples of tabular presentations ofsensitivity results for signalized intersections.
GRAPHIC REPRESENTATION OF RESULTS
Historically, data and analysis results have been presented primarily in tables.However, results sometimes are best presented as pictures and only supplemented asnecessary with the underlying numbers. Graphs and charts should not be used to decoratedata or to make dull data entertaining; they should be conceived and fashioned to aid inthe interpretation of the meaning behind the numbers (2).
Present results to makethem very plain (obvious)to the audience
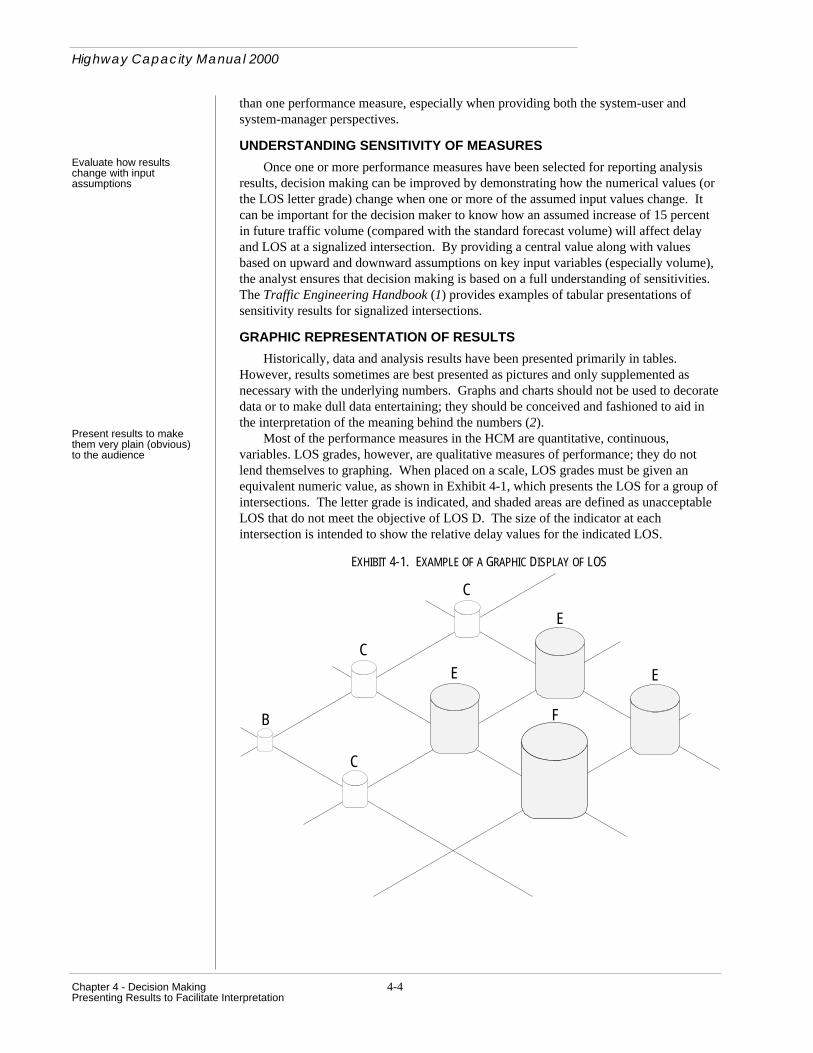
Most of the performance measures in the HCM are quantitative, continuous,variables. LOS grades, however, are qualitative measures of performance; they do notlend themselves to graphing. When placed on a scale, LOS grades must be given anequivalent numeric value, as shown in Exhibit 4-1, which presents the LOS for a group ofintersections. The letter grade is indicated, and shaded areas are defined as unacceptableLOS that do not meet the objective of LOS D. The size of the indicator at eachintersection is intended to show the relative delay values for the indicated LOS.
EXHIBIT 4-1. EXAMPLE OF A GRAPHIC DISPLAY OF LOS
C
C
E
E
E
F
C
B
Highway Capacity Manual 2000
4-5 Chapter 4 - Decision MakingPresenting Results to Facilitate Interpretation
The issue is whether the change in value between successive grades of LOS (i.e., theinterval) should all be shown as equal. For instance, is it appropriate for the LOS GradesA through F to be converted to a scale of 0 through 5? Should the numerical equivalentassigned to the difference of the thresholds between LOS A and B be the same as thedifference between LOS E and F? These questions have not been addressed in theresearch. Furthermore, LOS F is not given an upper bound. Therefore, a graph of LOSshould be considered ordinal, not interval, because the numeric differences betweenlevels of service would not appear significant.
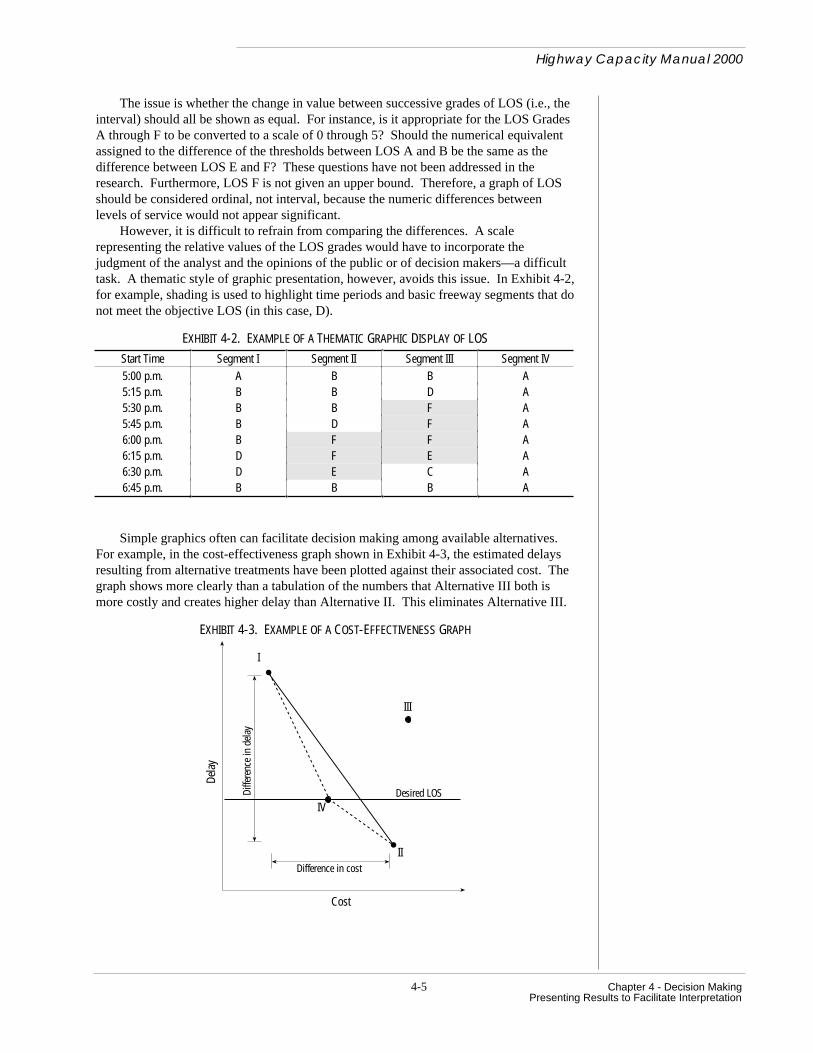
However, it is difficult to refrain from comparing the differences. A scalerepresenting the relative values of the LOS grades would have to incorporate thejudgment of the analyst and the opinions of the public or of decision makers—a difficulttask. A thematic style of graphic presentation, however, avoids this issue. In Exhibit 4-2,for example, shading is used to highlight time periods and basic freeway segments that donot meet the objective LOS (in this case, D).
EXHIBIT 4-2. EXAMPLE OF A THEMATIC GRAPHIC DISPLAY OF LOS
Start Time Segment I Segment II Segment III Segment IV
5:00 p.m. A B B A5:15 p.m. B B D A5:30 p.m. B B F A5:45 p.m. B D F A6:00 p.m. B F F A6:15 p.m. D F E A6:30 p.m. D E C A6:45 p.m. B B B A
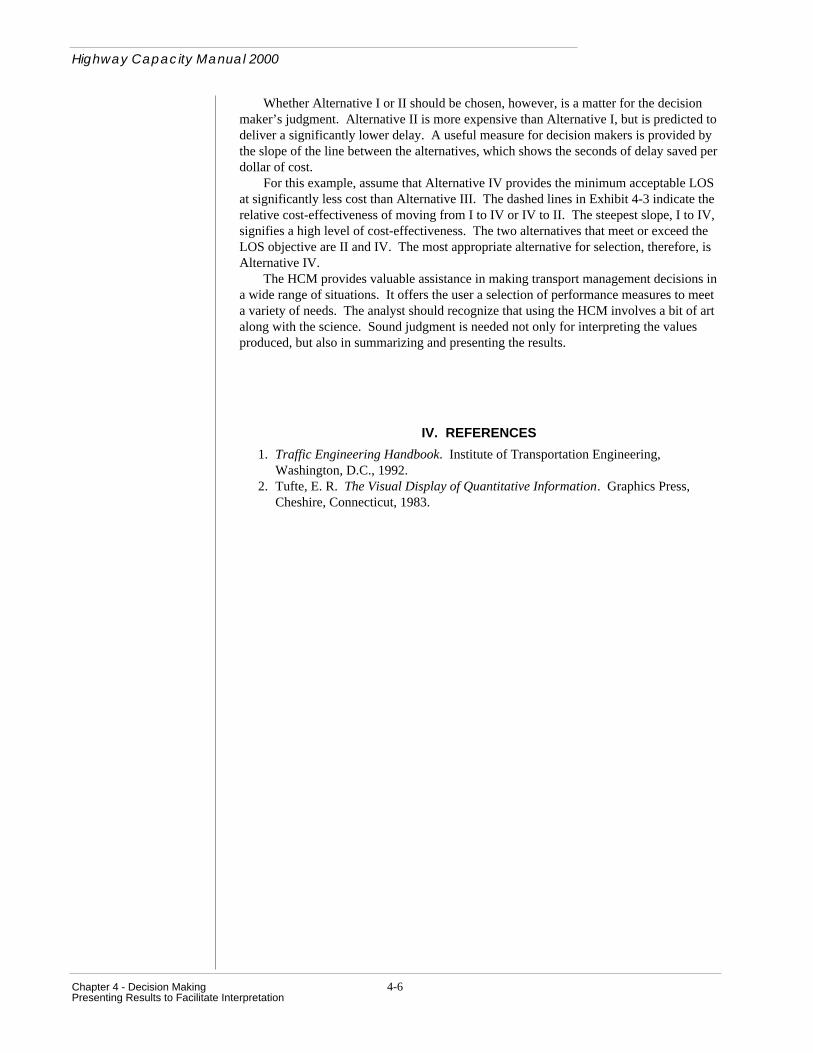
Simple graphics often can facilitate decision making among available alternatives.For example, in the cost-effectiveness graph shown in Exhibit 4-3, the estimated delaysresulting from alternative treatments have been plotted against their associated cost. Thegraph shows more clearly than a tabulation of the numbers that Alternative III both ismore costly and creates higher delay than Alternative II. This eliminates Alternative III.
EXHIBIT 4-3. EXAMPLE OF A COST-EFFECTIVENESS GRAPH
Cost
Dela
y
Difference in cost
Diffe
renc
e in
del
ay
I
II
III
IVDesired LOS
Highway Capacity Manual 2000
Chapter 4 - Decision Making 4-6Presenting Results to Facilitate Interpretation
Whether Alternative I or II should be chosen, however, is a matter for the decisionmaker’s judgment. Alternative II is more expensive than Alternative I, but is predicted todeliver a significantly lower delay. A useful measure for decision makers is provided bythe slope of the line between the alternatives, which shows the seconds of delay saved perdollar of cost.
For this example, assume that Alternative IV provides the minimum acceptable LOSat significantly less cost than Alternative III. The dashed lines in Exhibit 4-3 indicate therelative cost-effectiveness of moving from I to IV or IV to II. The steepest slope, I to IV,signifies a high level of cost-effectiveness. The two alternatives that meet or exceed theLOS objective are II and IV. The most appropriate alternative for selection, therefore, isAlternative IV.
The HCM provides valuable assistance in making transport management decisions ina wide range of situations. It offers the user a selection of performance measures to meeta variety of needs. The analyst should recognize that using the HCM involves a bit of artalong with the science. Sound judgment is needed not only for interpreting the valuesproduced, but also in summarizing and presenting the results.
IV. REFERENCES
1. Traffic Engineering Handbook. Institute of Transportation Engineering,Washington, D.C., 1992.
2. Tufte, E. R. The Visual Display of Quantitative Information. Graphics Press,Cheshire, Connecticut, 1983.