Faculty of Food Processing Technology - UPT€¦ · Timisoara Faculty of Food Processing Technology...
147
HABILITATION THESIS Mariana-Atena POIANĂ Timisoara Banat’s University of Agricultural Sciences and Veterinary Medicine „King Mihai I of Romania” from Timisoara Faculty of Food Processing Technology
Transcript of Faculty of Food Processing Technology - UPT€¦ · Timisoara Faculty of Food Processing Technology...
HABILITATION THESIS
Mariana-Atena POIANĂ
Timisoara
Banat’s University of Agricultural Sciences and Veterinary
Medicine „King Mihai I of Romania” from Timisoara
Faculty of Food Processing Technology
Universitatea de Ştiinţe Agricole şi Medicină Veterinară a
Banatului „Regele Mihai I al României” din Timişoara
Facultatea de Tehnologia Produselor Agroalimentare
TEZĂ DE ABILITARE
Mariana-Atena POIANĂ
Timişoara
HABILITATION THESIS
Bioactive compounds in food technology, with a special focus on their
contribution to antioxidant properties and color stability
Mariana-Atena POIANĂ
Timisoara
Banat’s University of Agricultural Sciences and Veterinary
Medicine „King Mihai I of Romania” from Timisoara
Faculty of Food Processing Technology
Assoc. Prof. Dr. Mariana-Atena POIANĂ
Banat’s University of Agricultural Sciences and Veterinary Medicine „King Mihai I of Romania” from
Timisoara
Faculty of Food Processing Technology
Food Technology Department
Calea Aradului no. 119, 300-645 Timişoara, ROMANIA
Tel.: +40/256/277308
Tel: +40/726239838
E-mail: [email protected]; [email protected]
Habilitation Thesis
Bioactive compounds in food technology, with a special focus on their
contribution to antioxidant properties and color stability
Teză de abilitare
Compuşi bioactivi în tehnologia produselor alimentare, cu un accent special
pe contribuţia lor la proprietăţile antioxidante şi stabilitatea culorii
Acknowledgements
I tried to look in my memories for people who have contributed to my achievements
and to sit them in order. It was impossible! Because there are so many people in my life
who have a huge role to all my achievements. Actually, I’m the result of everything that I
have lived. Words are so poor to express the thanks that I owe to my colleagues who I have
worked with over the years and all who have contributed to my evolution: teachers,
mentors, students. I’m sure that without their help my achievements wouldn’t have existed.
I would like to thank to my family for the absolute confidence in me over the years. They
are my roots and the foundation of what I am today. I would like to express all my gratitude
and warm thanks to my husband and my son for their understanding during these years.
Sorry that I wasn’t as I would have liked to be: a much better person.
Above all, I thank God for all the help he blessed me with, for his guidance without
which I would never be able to write my habilitation thesis. For me, this work is like a
puzzle and the pieces there are not the articles, books and so on, and rather, all the
experiences that led to the defining of my professional identity. I always thought that the
most important thing is to have a good direction and also to work for the fulfilment of the
proposed objectives. For this reason, I think that this thesis is just a form of experience
gained by me over the years, it’s just a step in my career, it’s the natural course of this
journey. As for the future plans, I can say that they are hidden pieces in this game because
the future can be unpredictable but I hope that I will have enough time, energy, power,
vision and, not at least, chance to do a lot more in this life.
Table of content
Habilitation Thesis
Abstract.................................................................................................................................................... i
Rezumat.................................................................................................................................................... iii List of abbreviations…………………………………………………………………………………….. v
PART I. SCIENTIFIC, PROFESSIONAL AND ACADEMIC
ACHIEVEMENT…………………………………………………………………………………..
1
INTRODUCTION............................................................................................................................ 2
SECTION I. SCIENTIFIC ACHIEVEMENTS………………………………………… 5
1. Scientific achievements concerning the effect of bottle aging on chromatic and
antioxidant properties of red wines………………….…………….............................
5
1.1. Background……………………………………………………………………………… 5 1.2. The influence of aging time on color and antioxidant properties of Cabernet
Sauvignon red wine…………………………………………………………………….
14 1.2.1. Aim………………………………………………………………………………. 14 1.2.2. Results and Discussion…………………………………………………………... 15 1.2.3. Conclusions………………………………………………………………………. 18 1.3. The effect of bottle aging on chromatic properties of Merlot and Pinot Noir red
wines………………………………………………………………………………………
19 1.3.1. Aim………………………………………………………………………………. 19 1.3.2. Results and Discussion…………………………………………………………... 19 1.3.3. Conclusions……………………………………………………………………… 23 1.4. Scientific contributions of the author to the actual state-of-knowledge……………... 24
2. Scientifical achievements concerning the impact of processing and storage on
antioxidant characteristics and color quality of fruit and gelled fruit products...
26
2.1. Background……………………………………………………………………………… 26 2.2. Impact of freezing and long-term frozen storage on antioxidant properties,
bioactive compounds and color indices of berries……………………………………..
33 2.2.1. Aim………………………………………………………………………………. 33 2.2.2. Results and Discussion………………………………………………………….. 34 2.2.3. Conclusions………………………………………………………………………. 37 2.3. Processing and storage impact on antioxidant properties and color of strawberry,
sweet cherry and sour cherry jam……………………………..………………………..
38 2.3.1. Aim………………………………………………………………………………. 38 2.3.2. Results and Discussion…………………………………………………………... 38 2.3.3. Conclusions……………………………………………………………………… 43 2.4. The effect of processing and storage on antioxidant properties and color of low-
sugar bilberry jam with different pectin concentrations ………………...…………...
43 2.4.1. Aim………………………………………………………………………………. 44 2.4.2. Results and Discussion…………………………………………………………... 44 2.4.3. Conclusions……………………………………………………………………… 50 2.5. The impact of pectin type and dose on color quality and antioxidant properties of
blackberry jam…………………………………………………………….......................
50
2.5.1. Aim………………………………………………………………………………. 51 2.5.2. Results and Discussion…………………………………………………………... 51 2.5.3. Conclusions………………………………………………………………………. 61 2.6. Scientific contributions of the author to the actual state-of-knowledge……………... 62
3. Scientific achievements concerning the capitalization of some by-products from
food processing………………………………………………………………………………...
64
3.1. Background....................................................................................................................... 64
3.2. Obtaining and antioxidant properties investigation of some natural extracts from
wine industry by-products...............................................................................................
69
3.3. Assessment of inhibitory effect of grape seeds extract on lipid oxidation occurring
in sunflower oil during some thermal applications…....................................................
71
3.3.1. Aim……………………………………………………………………………… 71
3.3.2. Results and Discussion………………………………………………………….. 71
3.3.3. Conclusions……………………………………………………………………… 80
3.4. Assessing the antioxidant properties and some bioactive compounds of fruit kernel
oils obtained from fruit processing by-products………………………………………
80
3.4.1. Aim……………………………………………………………………………… 80
3.4.2. Results and Discussion………………………………………………………….. 81
3.4.3. Conclusions……………………………………………………………………… 86
3.5. Scientific contributions of the author to the actual state-of-knowledge…………….. 86
4. Scientific achievements concerning the use of some natural bioactive
compounds for prevention and control of mycotoxins production in cereals……
89
4.1. Background…………………………………………………………………………….. 89
4.2. Impact of treatment with natural extracts from wine industry by-products on
ochratoxin A production in wheat grain……………………………………………….
95
4.2.1. Aim……………………………………………………………………………… 95
4.2.2. Results and Discussion………………………………………………………….. 96
4.2.3. Conclusions……………………………………………………………………… 99
4.3. The effect of treatment with essential oils on Fusarium mycotoxins production in
wheat grain…………………………….………………………………………………...
99
4.3.1. Aim……………………………………………………………………………… 100
4.3.2. Results and Discussion………………………………………………………….. 100
4.3.3. Conclusions……………………………………………………………………… 103
4.4 Scientific contributions of the author to the actual state-of-knowledge…………….. 104
SECTION II. PROFESSIONAL AND ACADEMIC ACHIEVEMENTS…….. 105
PART II. CAREER EVOLUTION AND DEVELOPMENT PLANS…………. 112
1. Plans for scientific evolution and development ……………………………………….. 113
2. Plans for professional and academic evolution and development ...……………….. 118
PART III. REFERENCES……………………………………………………………………… 120
Cuprins
TEZĂ DE ABILITARE Abstract..................................................................................................................................................... i Rezumat.................................................................................................................................................... iii Lista de abrevieri………………………………………………………………………………………... v
PARTEA I. REALIZĂRI ŞTIINŢIFICE, PROFESIONALE ŞI
ACADEMICE………………………………………………………………………………………
1
INTRODUCERE.............................................................................................................................. 2
SECŢIUNEA I. REALIZĂRI ŞTIINŢIFICE…………………………………………… 5
1. Realizări ştiinţifice privind efectul procesului de învechire în butelii asupra
proprietăţilor cromatice şi antioxidante ale vinurilor roşii..........................................
5
1.1. Context……………………………………………………………………………………. 5
1.2. Impactul duratei de învechire asupra stabilităţii culorii şi caracteristicilor
antioxidante ale vinului Cabernet Sauvignon....................................................................
14
1.2.1. Scop.......................................................................................................................... 14
1.2.2. Rezultate şi discuţii................................................................................................... 15
1.2.3. Concluzii................................................................................................................... 18
1.3. Modificarea profilului cromatic al vinurilor roşii Merlot şi Pinot Noir ca efect al
învechirii în butelii......................................................................................................
19
1.3.1. Scop........................................................................................................................... 19
1.3.2. Rezultate şi discuţii................................................................................................... 19
1.3.3. Concluzii................................................................................................................... 23
1.4. Contribuţii ştiinţifice ale autorului la stadiul actual al cunoaşterii……………... 24
2. Realizări ştiinţifice privind efectul procesării şi depozitării asupra
caracteristicilor antioxidante şi calităţii culorii unor fructe şi produse gelificate
din fructe.......................................................................................................................................
26
2.1. Context................................................................................................................................... 26
2.2. Impactul congelării şi depozitării de lungă durată asupra proprietăţilor
antioxidante, conţinutului de compuşi bioactivi şi indicilor de culoare ai fructelor de
pădure...................................................................................................................................
33
2.2.1. Scop........................................................................................................................... 33
2.2.2. Rezultate şi discuţii................................................................................................... 34
2.2.3. Concluzii................................................................................................................... 37
2.3. Impactul tratamentului termic şi depozitării asupra proprietăţilor antioxidante şi
culorii gemului de căpşuni, cireşe şi vişine.......................................................................
38
2.3.1. Scop.......................................................................................................................... 38
2.3.2. Rezultate şi discuţii.................................................................................................. 38
2.3.3. Concluzii.................................................................................................................. 43
2.4. Influenţa procesării şi depozitării asupra caracteristicilor antioxidante şi culorii
gemului de afine obtinut cu diferite doze de pectină.......................................................
43
2.4.1. Scop........................................................................................................................... 44
2.4.2. Rezultate şi discuţii................................................................................................... 44
2.4.3. Concluzii................................................................................................................... 50
2.5. Impactul tipului şi dozei de pectină asupra stabilităţii culorii şi proprietăţilor
antioxidante ale gemului de mure………………………………………………………..
50
2.5.1. Scop................................................................................................................ 51
2.5.2. Rezultate şi discuţii........................................................................................... 51
2.5.3. Concluzii......................................................................................................... 61
2.6. Contribuţii ştiinţifice ale autorului la stadiul actual al cunoaşterii……………... 62
3. Realizări ştiinţifice privind valorificarea unor subproduse rezultate din
procesarea alimentară......................................................................................................
64
3.1. Context....................................................................................................................... 64
3.2. Obţinerea şi evaluarea proprietăţilor antioxidante ale unor extracte naturale din
subproduse rezultate în vinificaţie...............................................................................
69
3.3. Evaluarea efectului inhibitor al extractului din seminţe de struguri împotriva
oxidării lipidelor dn uleiul de floarea soarelui în timpul unor aplicaţii termice ……...
71
3.3.1. Scop................................................................................................................ 71
3.3.2. Rezultate şi discuţii........................................................................................... 71
3.3.3. Concluzii......................................................................................................... 80
3.4. Evaluarea proprietăţilor antioxidante şi a unor compuşi bioactivi în uleiuri din
sâmburi de fructe obţinute din subproduse rezultate la procesarea fructelor………...
80
3.4.1. Scop................................................................................................................ 80
3.4.2. Rezultate şi discuţii........................................................................................... 81
3.4.3. Concluzii......................................................................................................... 86
3.5. Contribuţii ştiinţifice ale autorului la stadiul actual al cunoaşterii……………... 86
4. Realizări ştiinţifice privind utilizarea unor compuşi naturali bioactivi pentru
prevenirea şi controlul producerii de micotoxine în cereale.........................................
89
4.1. Context……………………………………………………………………………………. 89
4.2. Efectul tratamentului cu extracte naturale din subproduse rezultate la vinificaţie
asupra producerii de ochratoxină A în grâu……………...……………………………..
95
4.2.1. Scop……………………………………………………………………………….. 95
4.2.2. Rezultate şi discuţii……………………………………………………………….. 96
4.2.3. Concluzii…………………………………………………………………………... 99
4.3. Efectul tratamentului cu uleiuri esenţiale asupra mixotoxinelor produse de
Fusarium în grâu…………………………………………………………………………..
99 4.3.1. Scop………………………………………………………………………………... 100 4.3.2. Rezultate şi discuţii………………………………………………………………... 100 4.3.3. Concluzii…………………………………………………………………………... 103 4.4. Contribuţii ştiinţifice ale autorului la stadiul actual al cunoaşterii……..........………... 104
SECŢIUNEA II. REALIZĂRI ACADEMICE ŞI PROFESIONALE………... 105
PARTEA II. PLANURI DE EVOLUŢIE ŞI DEZVOLTARE A CARIEREI.. 112
1. Planuri de evoluţie şi dezvoltare stiintifică....................................................................... 113
2. Planuri de evoluţie şi dezvoltare profesională şi academică ........................................ 118
PARTEA III. BIBLIOGRAFIE................................................................................................ 120
Mariana-Atena POIANA Habilitation Thesis
i
Abstract
The present habilitation thesis consists of three main parts: (I) Scientific, academic and
professional achievements, (II) Career evolution and development plans and (III) References,
related to the content of the first two parts.
Part I (divided in two sections: Section I. Scientific achievements and Section II.
Professional and academic achievements) is the core of the thesis, in which are described the
most important scientific results, proving the originality and relevance, published in 10 selected
papers (ISI quoted) and the main professional and academic achievements, all referring to the
interval 2003-2013, which corresponds to the period after defending the PhD thesis (November
2002) and confirmed by the Ministry of Education and Research (April 2003).
In Section I are presented the main topics addressed in research activity during all this
time, as follows: (1) The effect of bottle aging on chromatic and antioxidant properties of red
wines; (2) The impact of processing and storage on antioxidant characteristic and color of
fruit and gelled fruit products; (3) The capitalization of some by-products from food
processing; (4) Use of some natural bioactive compounds for prevention and control of
mycotoxins production in cereals.
Research activity in the field of red wine analysis has been directed towards the
following topics: (i) red wine color analysis during aging using selective UV-VIS methods,
including also the evaluation of indices expressing the wine “chemical age” and “the degree of
ionization of anthocyanins”; (ii) assessment the contribution of copigmentation and polymeric
pigments to the red wine color stabilization during aging; (iii) evaluating the changes of
antioxidant properties in response to aging of bottled wines. On this subject, I published in 2008
the book entitled “The analysis of red wine color” and a book chapter entitled ”Phenolics
compounds with antioxidant activity in grapes and wine”. Also, I have published 2 articles in
ISI quoted journals, 8 articles in other national and international journals and 3 papers were
presented at international conferences. 2 of these ISI quoted papers (selected papers 1 and 2)
were presented in detail in Section I/1. Related to this direction I have taught 4 courses (2 of
them to bachelor and 2 to Master). In this field, I wrote 3 course books and 2 practical work
textbooks and also, I participated in 2 national programs related to antioxidant compounds in
some various vegetal products which included also, grapes and wine.
In the field of fruit/gelled fruit products I have contributed with studies on the following
topics: (i) impact of Individual Quick Freezing (IQF) and long-term storage of frozen fruit on
their color stability and antioxidant properties; (ii) effect of thermal processing and storage on
antioxidant characteristics and color quality of some low-sugar jam from various fruit rich in
antocyanins; (iii) improving the color stability and increasing the amount of antioxidants retained
in gelled products using different doses and types of pectin (high and low-esterified, amidated).
The funding for this study was supported by a research project with the private sector,
coordinated by me as director. In this field, I have published 5 articles in ISI quoted journals, 2
articles in other international journals and 2 papers were presented at international conferences. 4
of these papers (selected papers 3-6) were presented in detail in Section I/2. Also, I participated
in 2 national reseach projects focused on the nutritional benefits offered by a diet rich in
antioxidant compounds from vegetables and fruis.
In the field of by-products derived from food processing, I approached the following
topics: (i) obtaining of crude freeze-dried extracts rich in polyphenolic compounds from pomace
and grape seeds; (ii) assessment of inhibitory potential of freeze-dried grape seeds extract on
Mariana-Atena POIANA Habilitation Thesis
ii
oxidative lipid degradation occurring in sunflower oil used in some food thermal applications;
(iii) obtaining and characterization of some oils from by-products of fruits processing. On this
topic, I have published 3 articles in ISI quoted journals, 2 papers in national journal included in
international data basis and a paper was presented at an international conference. 2 of these
papers (selected papers 7 and 8) were included in this thesis, Section I/3.
The interest for the fourth research direction, regarding the prevention and control of
mycotoxins production in cereals using natural bioactive compounds has started since 2004
when I was involved in a national grant focused on reducing of fungal mycotoxin content from
cereal products by food processing. Work on this topic has stagnated from 2006 to 2010, when I
worked in a project funded by National Bank regarding the obtaining and characterization
dietetic floury products (there are some notable achievements of us in this fild: 3 trademarks
registered to OSIM, a book to which I’m co-author and a book in which I wrote a chapter). The
research activity on this topic was resumed starting from 2010 when I participated in the team of
an international project from Regional Program of Cooperation with South-East Europe (ReP-
SEE). In the realisation of this project I have contributed with studies on the following topics: (i)
assessing the mycotoxin contamination of cereals and medicinal herbs in west aria of Romania;
(ii) investigating the inhibitory potential of some natural extracts and essential oils on
mycotoxins production in cereals. On this topic, I was co-author for 2 chapters in a book
published in English in partnership with teams from Serbia and Croatia. I have published 3
articles in ISI quoted journals and other 2 papers were presented at international conferences. 2
of these ISI quoted papers (selected papers 9 and 10) were detailed in Section I/4.
Apart from these key directions in the last two years I have performed studies concerning
the use of Fourrier Transform Infrared (FT-IR) spectroscopy, as a rapid, non-destructive method,
for detection of olive oil adulteration and degradation. This research topic has started since 2012
when I won a Bilateral Project Romania-Greece. This co-operation is focused on strengthening
the relation between the two teams (from Romania and Greece) with complementary skills and
establishing a framework for further collaboration. During this project, I organized 2 lectures
with international participation, I have published 3 articles with international partnership and
also, we performed mobilities in Greece.
Section II briefly presents the main professional and academic achievements after the
Ph.D. Overall, in this period I published 23 articles in ISI quoted journals (10 as first author, 1 as
corresponding author and 12 as co-author), 7 books to CNCSIS recognized publishing houses, 4
book chapters and 2 practical work textbooks. Also, I coordinated as director 2 research projects
(a bilateral project Romania-Greece, won by competition and a project funded by private sector).
I participated as researcher in the team of 7 national projects, one international research project
and I have been short-term expert, responsible for curriculum analysis, in a POSDRU project.
Part II shows the plans for career evolution and development. For this purpose are
presented the research topics that will be continue or will be developed. Also, are presented the
main indicators to quantify the professional and academic development as well as the future
actions that will be performed in order to fulfill the proposed objectives. Based on the activities
developed so far, an extensive set of activities in my interest fields, both at national and
international level, are expected. The results could be significantly enhanced if the research team
will be consolidated by including of Master students and PhD students. It have to be underlined
that my active role will continuously increase in the future and the main indicators to quantify
my career evolution and development will be researches, lectures and applicative works
developed in the mentioned directions.
Part III groups the bibliographic references associated to the content of the first two
parts.
Mariana-Atena POIANA Habilitation Thesis
iii
Rezumat
Teza de abilitare este alcătuită din trei părţi principale: (I) Realizări ştiinţifice,
academice şi profesionale, (II) Planuri de evoluţie şi dezvoltare a carierei şi (III) Referinţe
bibliografice asociate conţinutului primelor două părţi.
Partea I (împărţită în 2 secţiuni): Secţiunea 1. Realizări ştiinţifice şi Secţiunea 2.
Realizări profesionale şi academice este nucleul tezei, în care sunt descrise cele mai importante
rezultate ştiinţifice, probând originalitate şi relevanţă, publicate în 10 lucrări selectate (cotate
ISI) precum şi principalele realizări profesionale şi academice, toate referindu-se la intervalul
2003-2013, care corespunde cu perioada după susţinerea tezei de doctorat (noiembrie 2002) şi
confirmată de Ministrul Educaţiei şi Cercetării (aprilie 2003).
În Secţiunea I sunt prezentate principalele direcţii de cercetare care au fost abordate în
tot acest timp, după cum urmează: (1) Efectul învechirii în butelii asupra proprietăţilor
cromatice şi antioxidante ale vinurilor roşii; (2) Impactul procesării şi depozitării asupra
caracteristicilor antioxidante şi culorii fructelor şi produselor gelificate din fructe; (3)
Valorificarea unor subproduse rezultate din procesarea alimentară; (4) Utilizarea unor
compuşi bioactivi naturali în prevenirea şi controlul producerii de micotoxine în cereale.
Activitatea de cercetare în domeniul analizei vinului roşu a fost direcţionată spre
următoarele subiecte: (i) analiza culorii vinului roşu utilizând metode UV-VIS selective,
incluzând de asemenea, evaluarea indicilor care exprimă “vârsta chimică” a vinului şi “gradul
de ionizare a antocianilor”; (ii) evaluarea contribuţiei copigmentării şi a pigmenţilor polimeri la
stabilizarea culorii vinului roşu pe parcursul procesului de învechire; (iii) evaluarea modificărilor
proprietăţilor antioxidante ca efect al învechirii vinului. Pe această tematică am publicat în 2008
o carte intitulată “Analiza culorii vinului roşu” şi un capitol intitulat “Compuşi fenolici cu
activitate antioxidantă în struguri şi vin”. De asemenea, am publicat 2 articole în reviste cotate
ISI, 8 articole în alte reviste naţionale şi internaţionale iar 3 lucrări au fost prezentate la
conferinţe internaţionale. 2 din aceste lucrări cotate ISI (lucrările selectate 1 şi 2) au fost
prezentate în detaliu în Secţiunea I/1. Pe această direcţie, predau cursurile a 4 discipline (două
dintre acestea la programe de licenţă şi 2 la programe de masterat). În acest domeniu am scris 3
cărţi de curs, 2 îndrumătoare de lucrări practice şi am participat la 2 proiecte de cercetare
naţionale care au abordat aspecte referitoare la compuşii antioxidanţi din diverse produse
vegetale printre care, strugurii şi vinul.
În domeniul fructelor, respectiv produselor gelificate din fructe am contribuit cu studii
privind următoarele subiecte: (i) impactul congelării Individual Quick Freezing (IQF) şi al
depozitării de lungă durată a fructelor congelate asupra stabilităţii culorii şi proprietăţiilor lor
antioxidante; (ii) efectul procesării termice şi depozitării asupra caracteristicilor antioxidante şi
calităţii culorii unor gemuri cu conţinut scăzut de zahăr obţinute din fructe bogate în compuşi
antocianici; (iii) îmbunătăţirea stabilităţii culorii şi creşterea conţinutului de antioxidanţi reţinuţi
în gem prin utilizarea unor diferite doze şi tipuri de pectină (înalt şi slab esterificată, amidată).
Finanţarea pentru acest studiu a fost asigurată dintr-un proiect de cercetare cu sectorul privat pe
care l-am coordonat în calitate de director. În acest domeniu, am publicat 5 lucrări în reviste
cotate ISI, 2 articole în alte reviste internaţionale iar 2 lucrări au fost prezentate la conferinte
internaţionale. 4 din aceste lucrări (lucrările selectate 3-6) au fost prezentate detaliat în Secţinea
I/2. De asemenea, am participat la 2 proiecte naţionale de cercetare care au abordat subiecte
referitoare la beneficiile nutriţionale oferite de o dietă bogată în compuşi antioxidanţi proveniţi
din legume şi fructe.
În domeniul subproduselor rezultate din procesarea alimentară, am abordat următoarele
subiecte: (i) obţinerea unor extracte brute liofilizate bogate în compuşi polifenolici din tescovină
şi din seminţe de struguri; (ii) evaluarea efectului inhibitor al extractului liofilizat din seminţe de
struguri asupra degradării oxidative a lipidelor din uleiul de floarea soarelui supus unor aplicaţii
Mariana-Atena POIANA Habilitation Thesis
iv
termice specifice industriei alimentare; (iii) obţinerea şi caracterizarea unor uleiuri din
subproduse rezultate la procesarea fructelor. Pe această temă am publicat 3 articole în reviste
cotate ISI, 2 lucrări în jurnale incluse în baze de date internaţionale iar o lucrare a fost prezentată
la o conferinţă internaţională. 2 din aceste lucrări (lucrările selectate 7 şi 8) au fost incluse în
această teză, Secţiunea I/3.
Interesul pentru a patra direcţie de cercetare, privind prevenirea şi controlul producerii de
micotoxine în cereale prin utilizarea unor compuşi bioactivi naturali a început încă din 2004 când
am lucrat pentru un grant naţional axat pe reducerea conţinutului de micotoxine fungice din
produsele cerealiere prin procesare alimentară. Cercetarea pe această direcţie a stagnat între 2006
şi 2010, fiind implicată într-un proiect finanţat de Banca Mondială referitor la obţinerea şi
caracterizarea unor produse dietetice făinoase (există unele realizări notabile în acest domeniu: 3
mărci înregistrate la OSIM, o carte la care sunt coautor şi o carte în care am scris un capitol).
Activitatea pe această temă a fost reluată din 2010 când am participat în echipa unui proiect
internaţional din Programul de Cooperare regională cu sud-estul Europei (ReP-SEE). În
realizarea acestui proiect am contribuit cu studii privind următoarele subiecte: (i) evaluarea
contaminării cu micotoxine a cerealelor şi plantelor medicinale din zona de vest a României; (ii)
investigarea potenţialului inhibitor al unor extracte naturale şi uleiuri esenţiale asupra producerii
de micotoxine în cereale. Pe această temă de cercetare sunt coautorul a 2 capitole într-o carte
publicată în limba engleză în parteneriat cu echipele din Serbia şi Croaţia. De asemenea, am
publicat 3 lucrări în reviste cotate ISI iar alte 2 lucrări au fost prezentate la conferinţe
internaţionale. Două din aceste lucrări ISI (lucrările selectate 9 şi 10) au fost prezentate în
detaliu în Secţiunea 1/4.
Pe lângă aceste direcţii cheie, în ultimii 2 ani am realizat studii privind utilizarea
spectroscopiei în infraroşu cu transformată Fourier (FT-IR), ca metodă rapidă, nedistructivă,
pentru detectarea falsificării şi degradării uleiului de măsline. Acestă temă de cercetare a început
din 2012 când am obţinut prin competiţie un proiect bilateral România-Grecia. Această
cooperare s-a axat pe consolidarea relaţiilor între echipa de cercetare din România şi cea din
Grecia, având competenţe complementare, şi stabilirea unui cadru pentru colaborări viitoare. În
timpul derulării acestui proiect am organizat 2 prelegeri cu participare internaţională, am publicat
3 lucrări în parteneriat şi am efectuat mobilităţi în Grecia.
Secţiunea II prezintă pe scurt principalele realizări profesionale şi academice după
obţinerea titlului de doctor. În ansamblu, in această perioadă am publicat 23 de articole în
reviste cotate ISI (10 ca prim autor, 1 ca autor corespondent, 12 ca şi coautor), 7 cărţi în edituri
recunoscute de CNCSIS, 4 capitole în cărţi şi 2 îndrumătoare de laborator. De asemenea, am
coordonat în calitate de director 2 proiecte de cercetare (un proiect bilaterat Romania-Grecia,
câştigat prin competiţie şi un proiect finanţat de sectorul privat). Am participat ca cercetător în
echipa a 7 proiecte naţionale, un proiect de cercetare internaţional şi am fost expert pe termen
scurt, responsabil cu analiza curiculară, într-un proiect POSDRU.
Partea a II-a prezintă planuri pentru evoluţia şi dezvoltarea carierei. În acest scop sunt
prezentate subiectele de cercetare care vor fi continuate precum şi cele care vor fi dezvoltate. De
asemenea, sunt prezentaţi principalii indicatori utilizaţi pentru a cuantifica dezvoltarea mea
profesională şi academică precum şi acţiunile viitoare care vor fi întreprinse pentru îndeplinirea
obiectivelor propuse. Pe baza activităţilor desfăşurate până în prezent, se preconizează un set
extins de activităţi în domeniile mele de interes, atât la nivel naţional cât şi internaţional.
Rezultatele ar putea fi semnificativ îmbunătăţite în cazul în care echipa de cercetare va fi
consolidată prin includerea de masteranzi şi doctoranzi. Trebuie subliniat faptul că rolul meu
activ va creşte continuu în viitor iar principalii indicatori utilizaţi pentru a cuantifica evoluţia şi
dezvoltarea carierei vor fi cercetările, prelegerile şi lucrările aplicative dezvoltate pe direcţiile
menţionate.
Partea a III-a grupează referinţele bibliografice asociate conţinutului primelor două
părţi.
Mariana-Atena POIANA Habilitation Thesis
v
List of abbreviations
A420 The absorbance at wavelength 420 nm LMAP Low-methoxyl amidated pectin
A520 The absorbance at wavelength 520 nm LMP Low-methoxyl pectin
A620 The absorbance at wavelength 620 nm LPP Large polymeric pigments
aw Water activity MA (%) The contribution of monomeric
anthocyanins to the total red wine color
ANOVA Analysis of variance NIR
spectroscopy
Near-infrared spectroscopy
AU Absorbance Units O1 Essential oil from Melissa officinalis L.
BHA Butylated hydroxianisole O2 Essential oil from Salvia officinalis L.
BHT Butylated hydroxytoluene O3 Essential oil from
Coriandrum sativum L.
C Control, untreated sample O4 Essential oil from Thymus vulgaris L.
CA Copigmented anthocyanins O5 Essential oil from Mentha piperita L.
CA (%) The contribution of copigmented
anthocyanins to the total red wine color
O6 Essential oil from
Cinnamomum zeylanicum L.
CD Color density OTA Ochratoxin A
CDs Conjugated dienes p-AV P-anisidine value
CTs Conjugated trienes PV Peroxide value
DA Degree of amidation PC polymeric color
DE Degree of esterification PC (%) Percentage of polymeric color
DON Deoxynivalenol PP Polymeric pigments
DPPH 2,2-diphenyl-1-picrylhydrazyl PP (%) The contribution of polymeric
pigments to the total red wine color
ELISA Enzyme-linked immunosorbent assay R Pearson’s correlation coefficient
F Fischer’s variance ratio RP-HPLC Reversed Phase High-Performance
Liquid Chromatography
FRAP Ferric reducing antioxidant power SO2 Sulfur dioxid
FT-IR
spectroscopy
Fourier Transform Infrared
spectroscopy SO2 – stable “Stable” or not bleachable in the presence
of the sulfite ions
FUMO Fumonisin SPP Small polymeric pigments
FW Fresh weight T Color tonality or hue
GAE Gallic acid equivalent TC Total color of red wine
GPE Grape pomace extract TMA Total monomeric anthocyanins
GSE Grape seeds extract TOTOX Total oxidation value
HMP High-methoxyl pectin TP Total phenolics
HPLC High-Performance Liquid Chromatography TSS Total soluble solids
I1 The first index for expressing the
“chemical age” of wine ZON Zearalenone
I2 The second index for expressing the
“chemical age” of wine α (%) The “degree of ionization of
anthocyanins”
IO (%) Inhibition of oil oxidation α–T α–Tocopherol
IQF Individual Quick Freezing β–T β–Tocopherol
K232 Specific extinction value at 232 nm γ–T γ–Tocopherol
K268 Specific extinction value at 268 nm δ–T δ–Tocopherol
L-AsAc L-ascorbic acid
Mariana-Atena POIANA Habilitation Thesis
1
PART I
Scientific, professional and academic achievements
Mariana-Atena POIANA Habilitation Thesis
2
Introduction
This habilitation thesis summarizes my activity performed after defending the PhD thesis
(November 2002), and confirmed by the Ministry of Education and Research, on the basis of
Order no. 3896, dated 24.04.2003, over a period of 10 years.
The research activity covers some topics specific to phenolics bioactive compounds
involved in food technology, antioxidant properties and color stability.
The scientifical achievements presented here are developed in four main thematic
directions illustrated in the following 10 selected papers (P1-P10). The research directions I, III
and IV are covered by 2 ISI quoted papers on each direction and the direction II includes 4 ISI
papers, as follows:
I. The effect of bottle aging on chromatic and antioxidant properties of red wines
P1. Poiana M.A., Dobrei A., Stoin D., Ghita A. The influence of viticultural region and the
ageing process on the color structure and antioxidant profile of Cabernet Sauvignon red
wines. Journal of Food, Agriculture and Environment. 2008, 6(3&4):104-108. Additional information: ISSN 1459-0255, http://world-food.net/download/journals/2008-issue_3_4/f22.pdf.
P2. Dobrei A., Poiana M.A., Sala F., Ghita A., Gergen I. Changes in the chromatic properties
of red wines from Vitis vinifera L. Cv. Merlot and Pinot Noir during the course of aging in
bottle. Journal of Food, Agriculture and Environment. 2010, 8(2): 20-24. Additional information: ISSN 1459-0255, http://world-food.net/download/journals/2010-issue_2/f3.pdf.
II. The impact of processing and storage on antioxidant characteristics and color of fruit and
gelled fruit products
P3. Poiana M.A., Moigradean D., Raba D., Alda L., Popa M. The effect of long-term frozen
storage on the nutraceutical compounds, antioxidant properties and color indices of
different kinds of berries. Journal of Food, Agriculture and Environment. 2010, 8(1):54-58,
ISSN 1459-0255. Additional information: ISSN 1459-0255, http://world-food.net/download/journals/2010-issue_1/12.pdf.
P4. Poiana M.A., Moigradean D., Dogaru D., Mateescu C., Raba D., Gergen I. Processing and
storage impact on the antioxidant properties and color quality of some low sugar fruit
jams. Romanian Biotechnological Letters. 2011, 16(5):6504-6512. Additional information: ISSN 1224-5984, http://www.rombio.eu/rbl5vol16/6%20POIANA%20M.pdf.
P5. Poiana M.A., Alexa E., Mateescu C. Tracking antioxidant properties and color changes in
low-sugar bilberry jam as effect of processing, storage and pectin concentration. Chemistry
Central Journal, 2012, 6:4. Additional information: doi:10.1186/1752-153X-6-4, Published: 16 January 2012, ISSN 1752-153X,
http://journal.chemistrycentral.com/content/6/1/4.
Mariana-Atena POIANA Habilitation Thesis
3
P6. Poiana M.A., Munteanu M.F., Bordean D.M., Gligor R., Alexa E. Assessing the effects of
different pectins addition on color quality and antioxidant properties of blackberry jam.
Chemistry Central Journal 2013, 7:121. Additional information: doi:10.1186/1752-153X-7-121, Published: 15 July 2013, ISSN 1752-153X,
http://journal.chemistrycentral.com/content/7/1/121.
III. The capitalization of some by-products from food processing
P7. Poiana M.A. Enhancing oxidative stability of sunflower oil during convective and
microwave heating using grape seed extract. International Journal of Molecular Sciences.
2012, 13(7): 9240-9259. Additional information: doi:10.3390/ijms13079240, ISSN: 1422-0067, http://www.mdpi.com/1422-
0067/13/7/9240.
P8. Popa V.M., Bele C., Poiana M.A., Dumbrava D., Raba D.N., Jianu C. Evaluation of
bioactive compounds and of antioxidant properties of some oils obtained from food industry
by-products. Romanian Biotechnological Letters, 2011, 16(3):6234-6241. Additional information: ISSN 1224-5984, http://www.rombio.eu/rbl3vol16/12%20Mirela%20Popa.pdf.
IV. The use of natural bioactive compounds for prevention and control of mycotoxins
production in cereals
P9. Alexa E., Poiana M.A., Sumalan R.M. Mycoflora and ochratoxin A control in wheat grain
using natural extracts obtained from wine industry by-products. International Journal of
Molecular Sciences. 2012, 13(4):4949-4967. Additional information: doi:10.3390/ijms13044949, ISSN: 1422-0067, http://www.mdpi.com/1422-
0067/13/4/4949.
P10. Sumalan R.M., Alexa E., Poiana M.A. Assessment of inhibitory potential of essential oils
on natural mycoflora and Fusarium mycotoxins production in wheat. Chemistry Central
Journal. 2013, 7:32. Additional information: doi:10.1186/1752-153X-7-32, ISSN 1752-153X,
http://journal.chemistrycentral.com/content/7/1/32.
"Bioactive compounds" are extranutritional constituents that usually are found in small
amounts in foods. They are components of food that possess biological activity in addition to
their nutritional value. Also, they have antioxidant properties and many works on this topic have
demonstrated their beneficial health effects. These compounds widely can differ in their chemical
structure and function. In the last decades, they were extensively studied to evaluate their effects
on health. Therefore, it can be said, there is sufficient evidence to recommend consuming of food
rich in bioactive compounds.
Phenolic compounds are bioactice compounds that have been studied detailed in fruits and
vegetables. The first thing I notice about the phenolics bioactive components from natural sources
or food products is that they can became inactive by reactions with oxygen or other food
components, or as a result of processing methods or conditions. First of all, if food processing
means all treatment of foodstuffs from harvest to consumption, more than 90% of our food may
be considered as being processed. The processes and reactions occuring during food processing
Mariana-Atena POIANA Habilitation Thesis
4
and storage are complicated due to the complex chemical heterogeneity of foods and,
accordingly, due to the complex reactions and processes that take place in this conditions. Many
bioactive compounds are unstable during processing and storage. They undergo various chemical
reactions such as oxidation, hydrolysis and thermal degradation resulting in a reduction in their
bioactivity. In the same time, processing can generate new bioactive compounds that have been
found to have a beneficial contribution on human health. But in mostly cases, food processing
and storage lead to some reduction in the nutritional value of foods.
From a practical perspective, the reasons that led me to address these research directions
are given by the following reasons:
development the knowledge regarding the factors that affect the antioxidant properties and
color stability during processing and storage;
identification of some ways to improve the retention of color and bioactive compounds in
thermally processed fruit products;
exploiting the potential of some by-products as a source of bioactive compounds with
potential applications to improve the nutritional and biological value of food;
the need to investigate the use of natural bioactive compounds to control the mycotoxin
production in cereals.
This work contains much information about current interests on the effect of processing on
bioactive compounds, with a special focus on phenolic compounds, involved in red wine color
and various fruit/pectin-gelled fruit products, as well as regarding some ways to exploit the
potential of by-products resulted from food processing.
In order to provide a clear view and coherent flow of this document, as well as to facilitate
the reading of habilitation thesis, I follow a similar structure during every reseach direction,
namely: (i) Background, that shows a condensed state-of-knowledge on the research topic, other
approaches addressing on the each topic and the research problem statement; (ii) Our studies, as
solutions to the problem, having unitary structure: aim, results and discussion, conclusions; (iii)
Scientific contributions of the author to the actual state-of-knowledge.
Mariana-Atena POIANA Habilitation Thesis
5
Section I
Scientific achievements
1. Scientific achievements concerning the effect of bottle aging on chromatic
and antioxidant properties of red wines
1.1. Background
Color is the most important attribute used, along with other variables, as an indicator to
assess the red wine quality. This characteristic is directly dependent on the phenolics content and
composition of the juice and the anthocyanins present in the grape skin (Wrolstad et al., 2005).
Wine phenolic compounds consist of flavonoids and non flavonoids extracted from grape berries
during winemaking. These compounds undergo several chemical transformations, which lead to
change of organoleptic properties, particularly color, astringency, and bitterness during wine
aging (Ribéreau-Gayon, 1983).
The polyphenolic contents of wine is strongly influenced by grape variety, viticultural and
environmental factors (i.e. vineyard location, cultivation system, climate, and soil type, vine
cultivation practices, harvesting time) and enological factors such as production process, and
aging (Villano et al., 2006). The polyphenolic molecules have a functional role as antioxidants
against the free radicals and increase the antioxidant capacity in the human body after red wine
consumption. Also, moderate consumption of wine seems to reduce the risk of cardiovascular
diseases and cancer (Perez et al., 2002).
The antioxidant capacity and free radical scavenging activity of wines has been proved in
biological systems “in vitro” and “in vivo”, being attributed to some bioactive compounds such as
polyphenols (Roussis et al., 2005; Villano, et al., 2005; Li et al., 2009).
Wine color is a main parameter in red wine analysis. However, it has proven to be one of
the most poorly understood. Although its color can be meaningfully measured easily by spectral
techniques, the composition of the color is more difficult to determine because the red wine color
is controlled by many factors such as the grape variety and the number of winemaking practices
and environmental conditions. The red wine color is the result of a complex mixture of several
components, including free monomeric anthocyanins, the enhancement of their color due to
copigmentation with other noncolored phenolics (Boulton, 2001), and polymeric pigments
(Somers and Evans, 1974). The color components of wine are the important parameters that
contribute to the sensory characteristics (color and astringency) as well as the antioxidant
properties of wine (Monagas et al., 2006).
Nowadays, there is the concept of red wine color analysis, very well set and implemented
to the international level. This concept supposes a set of spectral determination based on which
can be evaluated the contribution of all anthocyanins pigments categories that participates to the
total red wine color.
In young red wines, free monomeric anthocyanins are the principal source of red color,
but these compounds are not particularly stable. The red wine color continues to change during its
Mariana-Atena POIANA Habilitation Thesis
6
life, and can be strongly affected by anthocyanins content and composition as well as conditions
of maturation and aging processes. During red wines aging, these free or monomeric
anthocyanins are gradually incorporated into derived pigments (Poiana, 2008). Also, the
formation of various anthocyanin-tannin complexes during aging process has been well
investigated (Monagas et al., 2006; Versari et al., 2007), and it has also been proved that these
compounds newly formed help to stabilize the red wine color and contribute to a progressive shift
of the red-purple color of young red wines towards the more red-orange color which is specific to
aged red wines (He et al., 2012).
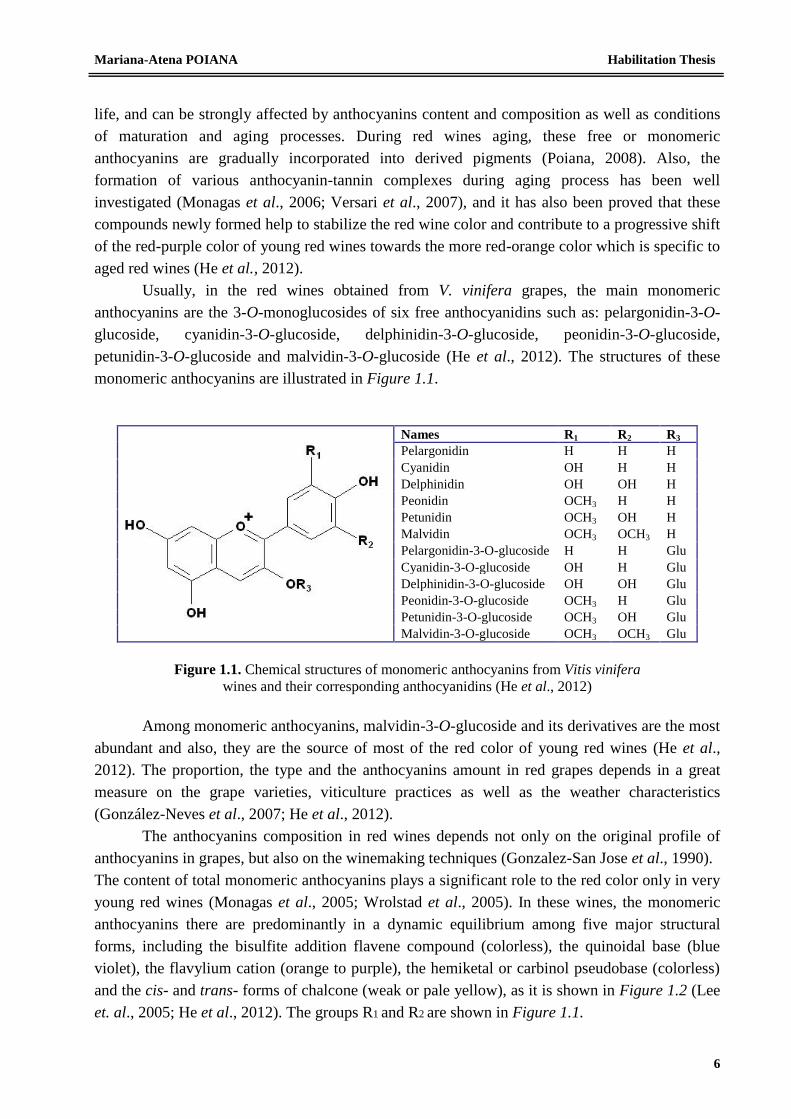
Usually, in the red wines obtained from V. vinifera grapes, the main monomeric
anthocyanins are the 3-O-monoglucosides of six free anthocyanidins such as: pelargonidin-3-O-
glucoside, cyanidin-3-O-glucoside, delphinidin-3-O-glucoside, peonidin-3-O-glucoside,
petunidin-3-O-glucoside and malvidin-3-O-glucoside (He et al., 2012). The structures of these
monomeric anthocyanins are illustrated in Figure 1.1.
Figure 1.1. Chemical structures of monomeric anthocyanins from Vitis vinifera
wines and their corresponding anthocyanidins (He et al., 2012)
Among monomeric anthocyanins, malvidin-3-O-glucoside and its derivatives are the most
abundant and also, they are the source of most of the red color of young red wines (He et al.,
2012). The proportion, the type and the anthocyanins amount in red grapes depends in a great
measure on the grape varieties, viticulture practices as well as the weather characteristics
(González-Neves et al., 2007; He et al., 2012).
The anthocyanins composition in red wines depends not only on the original profile of
anthocyanins in grapes, but also on the winemaking techniques (Gonzalez-San Jose et al., 1990).
The content of total monomeric anthocyanins plays a significant role to the red color only in very
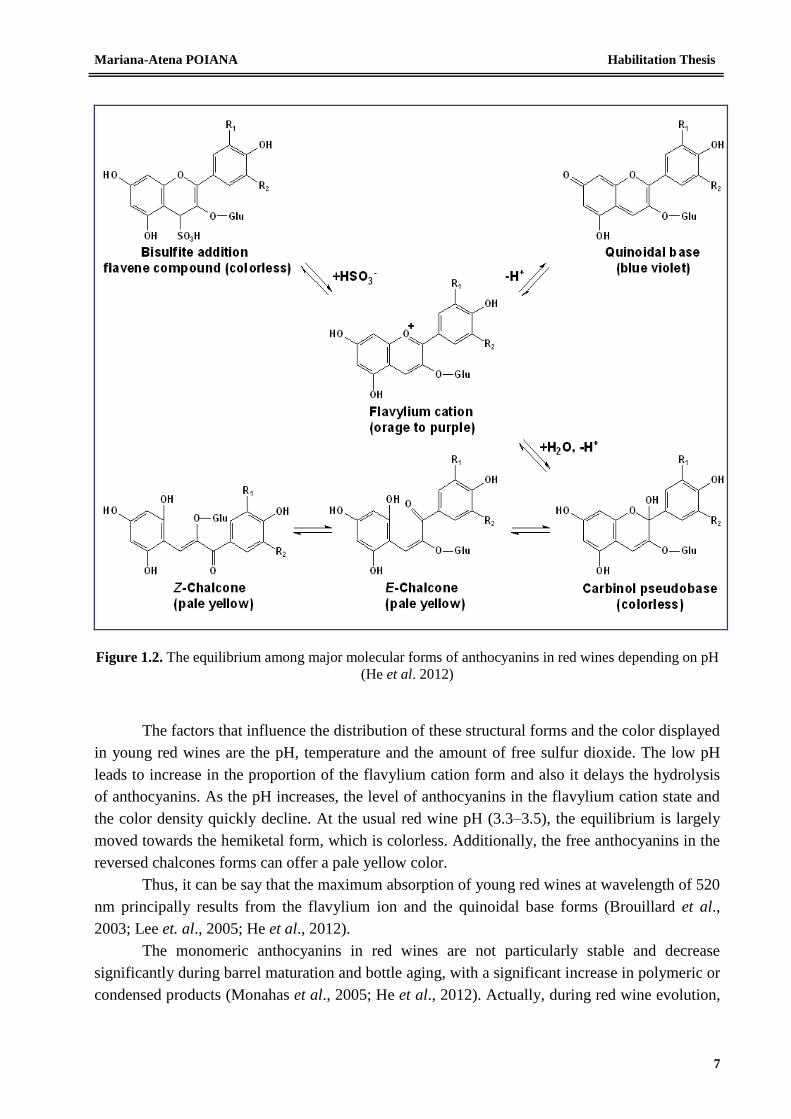
young red wines (Monagas et al., 2005; Wrolstad et al., 2005). In these wines, the monomeric
anthocyanins there are predominantly in a dynamic equilibrium among five major structural
forms, including the bisulfite addition flavene compound (colorless), the quinoidal base (blue
violet), the flavylium cation (orange to purple), the hemiketal or carbinol pseudobase (colorless)
and the cis- and trans- forms of chalcone (weak or pale yellow), as it is shown in Figure 1.2 (Lee
et. al., 2005; He et al., 2012). The groups R1 and R2 are shown in Figure 1.1.
Names R1 R2 R3
Pelargonidin H H H
Cyanidin OH H H
Delphinidin OH OH H
Peonidin OCH3 H H
Petunidin OCH3 OH H
Malvidin OCH3 OCH3 H
Pelargonidin-3-O-glucoside H H Glu
Cyanidin-3-O-glucoside OH H Glu
Delphinidin-3-O-glucoside OH OH Glu
Peonidin-3-O-glucoside OCH3 H Glu
Petunidin-3-O-glucoside OCH3 OH Glu
Malvidin-3-O-glucoside OCH3 OCH3 Glu
Mariana-Atena POIANA Habilitation Thesis
7
Figure 1.2. The equilibrium among major molecular forms of anthocyanins in red wines depending on pH
(He et al. 2012)
The factors that influence the distribution of these structural forms and the color displayed
in young red wines are the pH, temperature and the amount of free sulfur dioxide. The low pH
leads to increase in the proportion of the flavylium cation form and also it delays the hydrolysis
of anthocyanins. As the pH increases, the level of anthocyanins in the flavylium cation state and
the color density quickly decline. At the usual red wine pH (3.3–3.5), the equilibrium is largely
moved towards the hemiketal form, which is colorless. Additionally, the free anthocyanins in the
reversed chalcones forms can offer a pale yellow color.
Thus, it can be say that the maximum absorption of young red wines at wavelength of 520
nm principally results from the flavylium ion and the quinoidal base forms (Brouillard et al.,
2003; Lee et. al., 2005; He et al., 2012).
The monomeric anthocyanins in red wines are not particularly stable and decrease
significantly during barrel maturation and bottle aging, with a significant increase in polymeric or
condensed products (Monahas et al., 2005; He et al., 2012). Actually, during red wine evolution,
Mariana-Atena POIANA Habilitation Thesis
8
most of these free anthocyanins will react with other phenolic compounds to form more complex
and stable pigments, while a small part of them is destroyed through oxidation or precipitation.
After several years of aging in bottle, although the wines’ color is red, the monomeric
anthocyanins are present in a very low amount. This fact is due to the polymerization or other
reactions between monomeric anthocyanins and other compounds from red wines, as well as the
breakdown reactions of a part of them (He et al., 2012).
The stability of free or monomeric anthocyanins in red wines depends on various factors,
such as their chemical structure, pH value, the storage temperature and time, light exposure, the
presence of sugars, sulfites, cofactors and different metallic ions (Monagas et al., 2005; Hillmann
et al., 2011; He at al. 2012).
Anthocyanins are more stable at lower pH values than to higher pH. Also, the stability of
anthocyanins is greater at lower temperatures and at higher concentrations (Bordignon-Luiz et al.,
2007). The exposure of red wine to light promotes the degradation of anthocyanins (Bordignon-
Luiz et al., 2007). Also, the presence of ascorbic acid, sugar and their degradation products
contributes in a great extent to the decreasing of the anthocyanins stability (He et al., 2012).
In red wines can appear intramolecular copigmentation between anthocyanin molecules or
between an anthocyanin and other colorless chemicals, named intermolecular copigmentation
(Boulton, 2001). It can be argued that the copigmentation of anthocyanins in wines is a
competitive equilibrium involving several anthocyanins and many cofactors. In young red wines,
anthocyanins exist as weak complexes with themselves named self-associations, or with other
compounds, named cofactors, resulting in the formation of copigmented anthocyanins (Boulton,
2001). Self-association is as a special form of copigmentation in which, the copigments are even
anthocyanins. Contrary to the classical copigmentation between anthocyanins and other cofactors,
self-association might produce a hypsochromic shift (the maximum absorption wavelength is
shifted toward the lower values) (Miniati et al., 1992; Boulton, 2001; González-Manzano et al.,
2008). Therefore, compared with self-association, copigmentation process is more important
concerning the color modification displayed in young red wines. Both of these associantions are
formed by processes that involve stacked molecular aggregation by hydrophobic interaction
(Boulton, 2001). As a result of these processes the color density of red wines can be significantly
increased by hyperchromic effect, exhibited by a shift towards higher intensities and a
bathochromic effect exhibited by an increase in the maximum absorption wavelength with 5 – 20
nm (Mirabel at al., 1999, Boulton, 2001, Gauche et al., 2010). In the same time, the color tonality
may be affected because a bathochromic effect provides more purple hue to young red wines as a
result of moving the anthocyanin equilibria towards their colored forms. This fact can explain
many issues regarding the color expression in young red wines (Mirabel at al., 1999).
As stated by Boulton (2001), Cavalcanti et al. (2011), copigmentation is one of the most
significant phenomenons with a significant impact on the red wines color. The understanding of
this process that appears in very young red wines could help to predict the color properties of
these red wines based on phenolic profiles of processed grapes. Copigmentation is of a great
importance in understanding the relationship between grapes composition and wine color, the
variation in color and pigments concentration between wines, and in all reactions involving
anthocyanins during oak and bottle aging. Copigmented anthocyanins are the complexes that
Mariana-Atena POIANA Habilitation Thesis
9
result by reactions between anthocyanins and copigments molecules or cofactors. Cofactors are
colorless compounds that when added to a solution containing anthocyanins will act to enhance
the color of the solution. Thus, the copigmentation determines the pigments to exhibit a greater
color than would be expected based on their concentration. The main cofactors in young red
wines are expected to be the flavan-3-ols and flavanols, hydroxycinnamic acids and
hydroxycinnamoyl derivatives, oligomeric proanthocyanidins and in the case of self-association
even the antocyanins molecules can react as copigments (Mirabel at al., 1999; Boulton, 2001;
Gauche et al., 2010).
The levels and ratios of the cofactors are considered one of the moust important factors
that can affect the copigmentation phenomenon. The variation of the relative proportion of these
cofactors among wines obtained from various grape varieties, vintages and winemaking
techniques may result in red wines with different profiles of color (Schwarz et al., 2005; Soto et
al., 2010). The sandwich configuration of the anthocyanins stacks occurring in the
copigmentation complexes resulted in limiting of water access to the chromaphore of the
anthocyanins, thus being limited the formation of chalcone or carbinol pseudobase which are
colorless hydrated forms (Santos-Buelga, 2009). Therefore, copigmentation can result in a higher
color intensity of anthocyanin solutions than could be expected from its anthocyanin level and the
pH value.
The free anthocyanidins are more sensitive to the oxidative reactions resulting in
irreversible losses of color and browning (Ribéreau-Gayon et al., 2005). From this point of view,
the copigmentation plays a significant role in the protection of anthocyanins color. This
phenomenon has the both results: wine color stabilization and enhancement.
Copigmentation has not previously been taken into account in traditional wine color
measures, in the relationship between color and pigment analysis, or in spectrophotometric assays
for anthocyanin content. Copigmentation is typical for young wines, which can account for 30
and 50% of their color, being primarily influenced by the levels of several specific, noncolored
phenolic components or cofactors (Boulton, 1996; Mirabel et al., 1999; Boulton, 2001). Ther
wines obtained from grapes rich in cofactors and/or with a high level of acylated forms of the
non-malvidin pigments may have a higher level of copigmentation (Boulton, 2001). This is one
of the reasons for the weak copigmentation in the Sangiovese wines, which are noticed a lack of
the acylated pigments while red wines from Merlot and Cabernet Sauvignon grape varieties
contain high levels of acylated anthocyanins.
There is an equilibrium that exists between the free anthocyanins and cofactors from
grapes and the copigmented stacks. As the cofactors and the anthocyanins associate to form
copigmented stacks, the equilibrium is shifted to favor extraction of both free anthocyanins and
free cofactors. Thus, the copigmentation permits a greater extractability of anthocyanins and
cofactors from the grape skins.
The copigmented stacks also act as a reservoir for free flavylium ion, and it can see a
decrease in the contribution of copigmentation to red wine color over time. Once the red wine
aging, the free anthocyanins react to form polymeric pigments, and this fact leads to shift the
equilibrium to replenish free anthocyanins by releasing them from the copigmented
Mariana-Atena POIANA Habilitation Thesis
10
stacks. Therefore, in the aging time, the stacks tend to break-up and copigmentation decreases as
a result of this equilibrium (Boulton, 1996; Boulton, 2001).
The structure and concentration of cofactors and pigments as well as pH, value are the
main factors which influence the copigmentation process (Boulton, 2001). The pH suitable for
copigmentation is around pH 3.5. Temperature has a crucial role in the development of
copigmentation process. Fermentation at low levels of temperature can favor the copigmentation
and also, can delay the dissociation of the colored complexes. High temperatures used for
improving the color extraction in the case of thermovinification techniques cand obstruct the
formation of self-associations or copigmentation process (He et al., 2012). The vinification
technique can affect the copigmentation throught the amount of poyphenolics extracted from
pomace. If the polyphenolic compounds are extracted in insufficient quantities, significant color
losses can occur, due to both poor copigmentation and poor formation of polymeric pigments.
Thus, in the case of young red wines with the same anthocyanin level, the wines with low
cofactors content will show larger color losses than that would be expected based on their
anthocyanins content due to the weak stability of the colored complexes. Therefore, it is an
obvious need for more studies concerning the impact of maceration, wood and bottles aging on
red wine color.
Bottle aging of red wine is the result of many chemical processes, mostly anaerobic,
involving the copigmentation phenomenon and polymerisation of anthocyanins reaction, even
though some oxygen is still present initially (Somers and Pocock, 1990). Over 25 years ago
Somers and Evans (1986) observed that the aged red wines went through various changes in
spectral characteristics. Malvidin-3-glucoside, the most abundant anthocyanin, principally
responsible for wine's red color strongly decline over time (Harbertson et al., 2003; Monagas et
al., 2006). The remaining colored compounds had unknown structures but were defined by their
ability to resist against bleaching bisulfite and are known as polymeric pigments (PP). Many
studies over the last 20 years which have tried to define the chemical structures of polymeric
pigments (PP) have led to very few conclusive results. Some of these results have demonstrated
that anthocyanins are not lost during wine aging; actually, the anthocyanins form covalent
adducts with tannin, undergo derivatization by keto-acids, and are linked to tannins by
acetaldehyde. During aging, the monomeric anthocyanins turn into polymeric anthocyanins with
different molecular mass. In practice, the phenomenon of red wine color evolution is called wine
aging. Polymeric pigments are known to have different characteristics than monomeric
anthocyanins. They are resistant to bisulfite bleaching and are not as pH dependent as monomeric
forms. Due to these two combined features it can be say that PP contribute to the “stable color”
of red wines (Giusti and Wrolstad, 2005; Alcalde-Eon et al., 2006).
Somers and Evans (1986) estimated that PP retained more than 50% of their maximum
color at wine pH, whereas monomeric or free anthocyanins only about 23% of their color. This
detail demonstrates that at wine pH, a significant proportion of the red color is coming from PP.
According to molecular mass, PP are classified in large polymeric pigments (LPP) and small
polymeric pigments (SPP). It was proved that grapes contain very little LPP, while the
corresponding wines have large amounts of LPP. As wine ages, the tannins continue to
polymerize, and LPP are formed by the expense of SPP (Harbertson et al., 2003). In contrast, the
Mariana-Atena POIANA Habilitation Thesis
11
color due to SPP is mostly contributed by the grape berries, since the levels in the grape are
nearly the same as in the finished wine. As regards the monomeric anthocyanins, the levels tend
to be higher in grapes, than in the corresponding wines.
Objective measurement of the red wine color components is an essential part of the
modern concept called in the modern winemaking “red wine color management”. Standard
spectroscopic method are useful in routine analysis of red wine for assessing the chromatic
parameter such as color density (CD) and hue, or wine tonality (T) but not provide information
regarding the contribution of different anthocyanin pigments to wine color. For solving this issue,
different methods were developed by Somers and Evans method (1977), Boulton (1996) and
Mercurrio (2007). These selective spectrophotometric assays have the ability to provide more
data about in changes in red wine color as a result of different changes occurred in structure of
antocyanins pigments. The spectrophotometric assays developed so far, are based on the
assumption that PP are much less sensitive than the anthocyanins to sulfur dioxide (SO2) as well
as to the changes recorded in pH value. Based on understanding of the pH equilibrium and the
different bleaching effect of SO2 on monomeric and polymeric anthocyanins, as well as the
preferential binding of SO2 with acetaldehyde rather than anthocyanins, Somers and Evans (1974,
1977) have developed a set of spectrophotometric measures to determine CD, total monomeric
anthocyanins (TMA), SO2 resistant pigments called PP, “chemical age” and “the degree of
ionization of anthocyanins” or “the degree of pigment coloration”, α (%). Somers and Evans
(1977) established a criterion for quantification of red wines “chemical age” based on the gradual
conversion of monomeric anthocyanins to polymeric form. Thus, the “chemical age” is quantified
by two indices (I1 and I2) and gives a measure of the extent to which polymeric pigments have
replaced monomeric anthocyanins during wine aging. I1 represent the ratio of polymeric color to
the color of polymeric pigments together with the color of free anthocyanins. I2 is calculated as
ratio of polymeric color to the color of monomeric anthocyanins brought in the flavyllium form
by addition of acid solution together with the color of polymeric pigments. These ratios are close
to zero in very young red wine, but increase to about 1.0 and 0.9, respectively, for wines older
than 10 years. The parameter “α” gives a measure of the amount of pigments in colored form.
This parameter represents the percentage of free colored anthocyanins that can be decolorized by
sulfur dioxide (Somers and Evans, 1977). As reported by Somers (1974) strong positive
correlations have been made between wine color density and wine quality. The main shortcoming
is that, this method is unable to assess the contribution of copigmented fraction to the wine color.
Other method described by Boulton (1996) and Mercurrio (2007) have the ability to
provide information on the contribution of all types of pigments to the red wine color.
This method was developed based on chemical properties of anthocyanins, as follows:
By bleaching a wine sample with an excess SO2 (represented by potassium metabisulpite
solution), the bisulphite ions react selective with free monomeric antocyanins and
copigmented anthocyanins (CA) to form the colorless compounds (this property explains
the lost of a part of the red wine color after addition of SO2). The color displayed in red
wine after bleaching with SO2, due to SO2 non-bleachable pigments is attributed to
polymeric pigments (PP). The percentage of SO2 non-bleachable pigments is a
comparison of the wine color before and after addition of bisulfite solution. This method,
Mariana-Atena POIANA Habilitation Thesis
12
to measure the wine color after addition of excess bisulfite, enables the identification of
the color provided by pigments that are stable to SO2 bleaching (the color SO2-stable).
The bleaching effect of free SO2 in a wine sample can be abolished by addition of
acetaldehyde. This effect relies on the fact that SO2 binds more strongly to acetaldehyde
than of anthocyanins. Thus, by addition of acetaldehyde, the color measured at 520 nm
represents the total wine color (TC);
The copigmented anthocyanins are destroyed in a strong alcoholic medium, so the
remained color is due to MA and PP. By subtracting the color corresponding to PP can be
assessed the color of monomeric anthoxyanin (MA). The ratios between the color given
by MA, CA, respectively PP and TC represent the contribution of monomeric
anthocyanins, copigmented anthocyanins and polymeric pigments to the total red wine
color: MA (%), CA (%) and PP (%). The percentage PP (%) measurement is an indicator
of how much color is provided by SO2 – stable pigments.
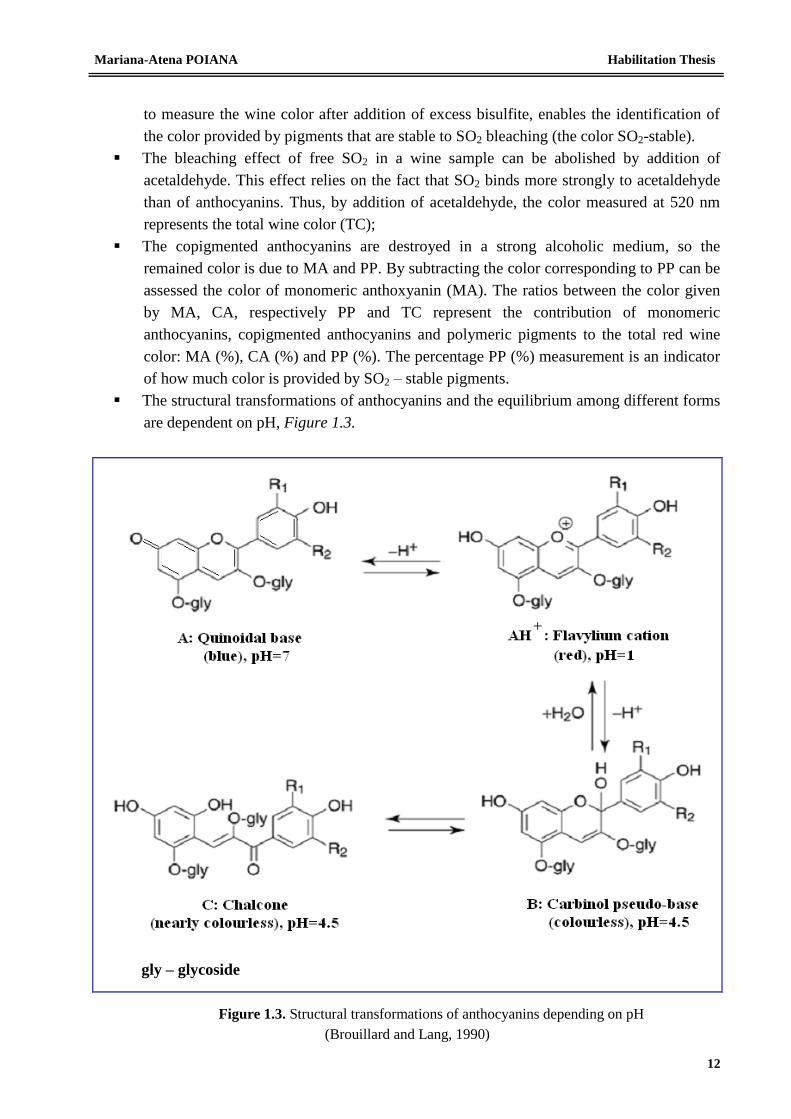
The structural transformations of anthocyanins and the equilibrium among different forms
are dependent on pH, Figure 1.3.
gly – glycoside
Figure 1.3. Structural transformations of anthocyanins depending on pH
(Brouillard and Lang, 1990)
Mariana-Atena POIANA Habilitation Thesis
13
Nowadays, there is an obvious interest to quantify the changes occurring in red wine color
over time in connection with red wines antioxidant characteristics because it is well documented
that monomeric anthocyanins have a high antioxidant capacity due to their chemical structure
specially adapted for this purpose. Also, it is known that the different anthocyanins pigments
have not the same antioxidant properties. Thus, it is expected to be changes in antioxidant status
of red wine as a result of dynamic changes in the content and profile of anthocyanin pigments.
The studies performed on this topic suggested that exists a strong correlation between
color structure and antioxidant properties of red wine (Fernandez-Pachon et al., 2004; De Beer et
al., 2005; Maletic et al., 2009). In agreement with study conducted by Tsai et al. (2004), the
ferric reducing ability of plasma (FRAP) decreased during bottle aging of red wine and there was
recorded a strong correlation between FRAP values and TMA content. Contrary, the radical
scavenging ability of red wine, assessed by 2,2-diphenyl-1-picrylhydrazyl (DPPH) assay
increased and was highly correlated with the formation of polymeric pigments. Based on the
results of these studies, it is easy to see that, during wine evolution, anthocyanin pigments and
other polyphenolic compounds participate in many reactions that promote changes in the color
with a great impact on antioxidant properties. Bottle aging is receiving a lot of attention today,
unlike in the past because is a very important step in the red wine evolution and greatly affects its
physico-chemical properties. For the wine industry, interest in high-quality products with a clear
geographical origin is increasing. Nowadays, in this sector there is a growing focus for
geographical identity preservation. The red wine color could be influenced by vineyard location,
grape variety, age, but also by the proportion of anthocyanins and anthocyanins-derived
pigments. The previously information highlighted the need for wine researchers and the wine
industry to better understand the color properties of wine pigments during aging.
The effect of bottle aging on antioxidant activity of red wines and the relation between
color changes and their antioxidant activity is not very well documented. Also, the level of
monomeric anthocyanins during the aging of bottled red wines should receive a great attention to
fully explain their contribution to the total color expression as well as to their antioxidant activity.
More information is, however, needed regarding the effect of aging time on antioxidant
properties of red wines prior to consumption. The red wines color stabilization during aging by
polymeric pigments formation seems to be important in protection against loss of total
antioxidant activity. As wines are not usually consumed immediately after production and some
decreases in their antioxidant activity could occur even under favorable storage conditions (15-
18°C) after one year, the use of total antioxidant activity values for analysis of market wines
should be treated with a great careful. This is the main reason for that I have approached this
research direction.
In line with the current concerns on this topic, the goal of the first study performed by
Poiana et al. (2008) and presented in selected paper 1, was to obtain correlated information
about the changes occurred in the color of dry red wines originating from Recas and Minis
vineyards related to the change in their antioxidant properties as a result to bottle aging for 30
months.
Mariana-Atena POIANA Habilitation Thesis
14
The second study, conducted by Dobrei et al. (2010) and presented in selected paper 2,
was performed for assessing the impact of grape variety on the changes in the color structure of
dry red wines Merlot and Pinot Noir from Recas vineyard, related to bottle aging for 24 months .
The study presented in selected paper 1 was designed and coordinated by me as first
author, while in the research belonging to the selected paper 2, I was involved as co-author.
The information obtained from these studies provides a substantial basis for future
researches on the red wine color topic. Also, they provide information about the stabilization of
red wines color during bottle aging and the evolution of their antioxidant activity.
The objectives followed by this research direction are:
- Development of knowledge concerning the factors that contribute to red wine color change
throughout its evolution;
- Identifying the causes and understanding the mechanisms that lead to changes in the
antioxidant properties of red wine during its evolution;
- Obtaining of knowledge in order to predict how it will behave the wine color and its
antioxidant profile during aging;
- Setting of some correlations between different categories of anthocyanin pigments and
antioxidant capacity of wine.
1.2. The influence of aging time on color and antioxidant properties of
Cabernet Sauvignon red wine
1.2.1. Aim
This study was an attempt to assess the changes occurred in color structure and
antioxidant properties of dry red wines from Vitis vinifera L. cv. Cabernet Sauvignon (CS) grapes
(2004 harvest year) from two viticultural regions of the Western part of Romania (Minis and
Recas vineyards) during 30 months of bottle aging. For this purpose, young red wines (0-CS-R,
0-CS-M), as well as aged in bottles for 6, 12, 18, 24 and 30 months (6-CS-R, 6-CS-M; 12-CS-R,
12-CS-M; 18-CS-R, 18-CS-M; 24-CS-R, 24-CS-M; 30-CS-R, 30-CS-M) have been investigated.
Bottles were kept in a dark storage room at 18°C horizontally on their side to moist the cork. This
way, oxygen will have no chance of entering the bottle and the red wine will not oxidize. The
wine samples were analysed in terms of color structure, expressed by contribution of monomeric,
copigmented and polymeric pigments (MA, CA and PP) to the total wine color (TC) using the
methods described by (Glories, 1984), as well as the content of total monomeric antocyanins
(TMA), following the pH-differential method (Giusti and Wrolstad, 2005). Antioxidant profile of
red wines was assessed on the base of total antioxidant activity using the FRAP assay (ferric
reducing antioxidant power) as described by Benzie and Strain (1996) and free radical scavenger
Mariana-Atena POIANA Habilitation Thesis
15
activity determined by 2,2-diphenyl-1-picrylhydrazyl (DPPH) assay (Rivero-Perez et al., 2007).
The analyses were presented in detail in selected paper 1.
In performing of this research I worked closely with Prof. dr. Alin Dobrei [[email protected]]
, Assoc. Prof. dr. Daniela Stoin [[email protected]]
and Lecturer dr. Alina
Ghita [[email protected]]
.
1.2.2. Results and Discussion
This study was carried out for assessing the changes occurring in the color of red wine
Cabernet Sauvignon related to aging time and vineyard of origin. Red wine color measurements
were done after addition of acetaldehyde in order to abolish the bleaching effect of free SO2 in
red wine samples. The color measured at 520 nm at pH 3.6, represents the total wine color (TC)
expressed in absorbance units (AU). TC is the color given by all pigments caterories such as:
monomeric or free anthocyanins (MA), copigmented anthocyanins (CA) and polymeric pigments
(PP). The color measured after addition of excess bisulfite solution was provided by pigments
that are SO2 – stable. The color of red wine remaining post-SO2 bleaching is called ”SO2 - stable
color” and is assigned to polymeric pigments (PP). Evaluating of SO2 - stable wine color is of
particular importance in aged wines as the content of monomeric anthocyanins is minimal. SO2 -
stable color is a measure of the anthocyanin-derived pigments that are stable to bleaching
(Somers and Evans, 1977). The copigmented anthocyanins are destroyed in strong alcoholic
medium and the remained color is assigned to MA and PP. Based on this measurements it was
possible to quantified the contribution of MA(%), CA(%) and PP(%) to the total wine color. In
Table 1.1 are shown the values recorded for TC and the chromatic profile of red wines. Also, in
Table 1.1 are summarized the data obtained for TMA, “chemical age” indices and α.
The Recas and Minis vineyards, located in the Western part of Romania, possess high
heliothermic resources, which favor the accumulation of important amounts of polyphenolic
compounds in grapes. From this point of view, Recas and Minis are known as vineyards with a
high degree of favorability for obtaining of red wines rich in anthocyanins. Based on data
mentioned in selected paper 1 it can be noted that Minis vineyard has a greater favourability for
accumulation of anthocyanin pigments than Recas vineyard, reflected in TMA content recorded
in young red wines (TMA was higher in 0-CS-M than in 0-CS-R).
From Table 1.1 it is easy to see that TC decreased throughout the bottle aging. In regard
to the color structure, expressed by contribution of MA, CA and PP to the total wine color, it was
noticed that MA participate mostly in defining of young red wine color, while the anthocyanins in
polymeric form have a relatively reduced contribution to the color of young wine. In respect to
the contribution of CA to TC, it was registered higher values for wine samples originating from
Minis than for similar samples from Recas. This difference, in favour of wine samples from
Minis, partially explains the color more intense recorded in very young red wine of these wines.
Here, the copigmentation phenomenon comes to explain the enhancement of color.
Copigmentation is due to molecular associations between pigments and other, usually non-
colored, organic molecules in solution. Due to these associations, the pigments exhibit a greater
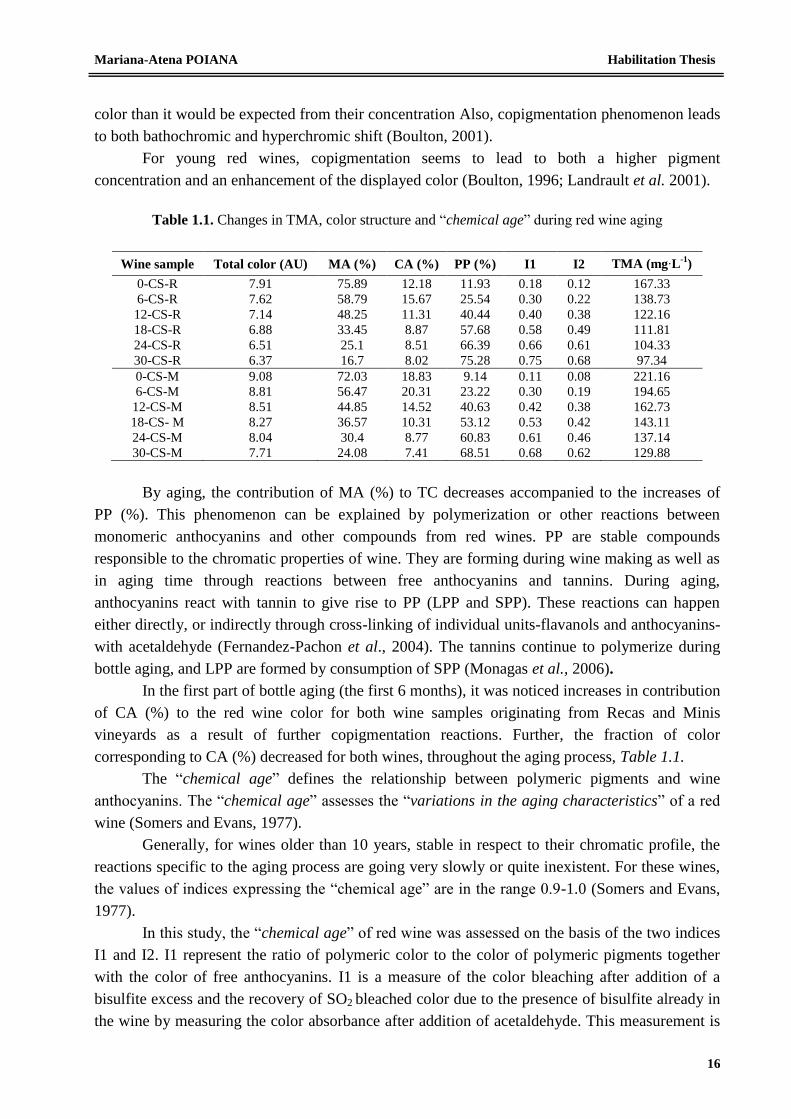
Mariana-Atena POIANA Habilitation Thesis
16
color than it would be expected from their concentration Also, copigmentation phenomenon leads
to both bathochromic and hyperchromic shift (Boulton, 2001).
For young red wines, copigmentation seems to lead to both a higher pigment
concentration and an enhancement of the displayed color (Boulton, 1996; Landrault et al. 2001).
Table 1.1. Changes in TMA, color structure and “chemical age” during red wine aging
By aging, the contribution of MA (%) to TC decreases accompanied to the increases of
PP (%). This phenomenon can be explained by polymerization or other reactions between
monomeric anthocyanins and other compounds from red wines. PP are stable compounds
responsible to the chromatic properties of wine. They are forming during wine making as well as
in aging time through reactions between free anthocyanins and tannins. During aging,
anthocyanins react with tannin to give rise to PP (LPP and SPP). These reactions can happen
either directly, or indirectly through cross-linking of individual units-flavanols and anthocyanins-
with acetaldehyde (Fernandez-Pachon et al., 2004). The tannins continue to polymerize during
bottle aging, and LPP are formed by consumption of SPP (Monagas et al., 2006).
In the first part of bottle aging (the first 6 months), it was noticed increases in contribution
of CA (%) to the red wine color for both wine samples originating from Recas and Minis
vineyards as a result of further copigmentation reactions. Further, the fraction of color
corresponding to CA (%) decreased for both wines, throughout the aging process, Table 1.1.
The “chemical age” defines the relationship between polymeric pigments and wine
anthocyanins. The “chemical age” assesses the “variations in the aging characteristics” of a red
wine (Somers and Evans, 1977).
Generally, for wines older than 10 years, stable in respect to their chromatic profile, the
reactions specific to the aging process are going very slowly or quite inexistent. For these wines,
the values of indices expressing the “chemical age” are in the range 0.9-1.0 (Somers and Evans,
1977).
In this study, the “chemical age” of red wine was assessed on the basis of the two indices
I1 and I2. I1 represent the ratio of polymeric color to the color of polymeric pigments together
with the color of free anthocyanins. I1 is a measure of the color bleaching after addition of a
bisulfite excess and the recovery of SO2 bleached color due to the presence of bisulfite already in
the wine by measuring the color absorbance after addition of acetaldehyde. This measurement is
Wine sample Total color (AU) MA (%) CA (%) PP (%) I1 I2 TMA (mg∙L-1
)
0-CS-R 7.91 75.89 12.18 11.93 0.18 0.12 167.33
6-CS-R 7.62 58.79 15.67 25.54 0.30 0.22 138.73
12-CS-R 7.14 48.25 11.31 40.44 0.40 0.38 122.16
18-CS-R 6.88 33.45 8.87 57.68 0.58 0.49 111.81
24-CS-R 6.51 25.1 8.51 66.39 0.66 0.61 104.33
30-CS-R 6.37 16.7 8.02 75.28 0.75 0.68 97.34
0-CS-M 9.08 72.03 18.83 9.14 0.11 0.08 221.16
6-CS-M 8.81 56.47 20.31 23.22 0.30 0.19 194.65
12-CS-M 8.51 44.85 14.52 40.63 0.42 0.38 162.73
18-CS- M 8.27 36.57 10.31 53.12 0.53 0.42 143.11
24-CS-M 8.04 30.4 8.77 60.83 0.61 0.46 137.14
30-CS-M 7.71 24.08 7.41 68.51 0.68 0.62 129.88
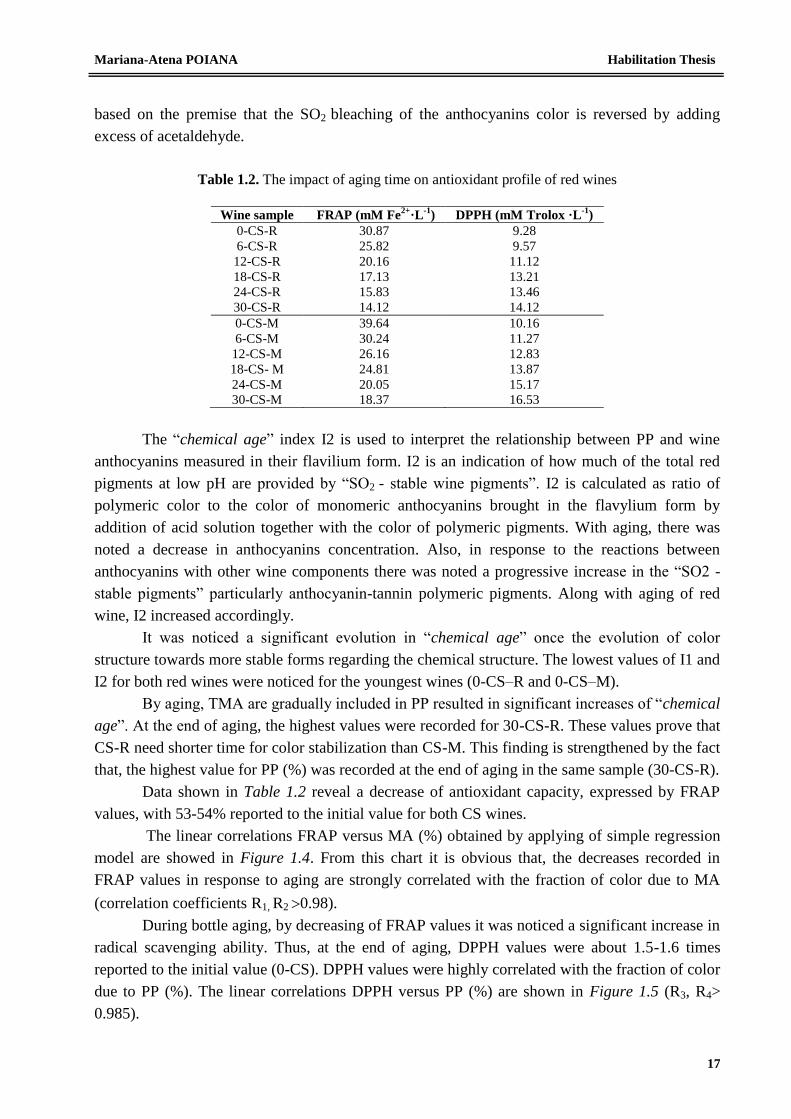
Mariana-Atena POIANA Habilitation Thesis
17
based on the premise that the SO2 bleaching of the anthocyanins color is reversed by adding
excess of acetaldehyde.
Table 1.2. The impact of aging time on antioxidant profile of red wines
Wine sample FRAP (mM Fe
2+·L
-1) DPPH (mM Trolox ·L
-1)
0-CS-R 30.87 9.28
6-CS-R 25.82 9.57
12-CS-R 20.16 11.12
18-CS-R 17.13 13.21
24-CS-R 15.83 13.46
30-CS-R 14.12 14.12
0-CS-M 39.64 10.16
6-CS-M 30.24 11.27
12-CS-M 26.16 12.83
18-CS- M 24.81 13.87
24-CS-M 20.05 15.17
30-CS-M 18.37 16.53
The “chemical age” index I2 is used to interpret the relationship between PP and wine
anthocyanins measured in their flavilium form. I2 is an indication of how much of the total red
pigments at low pH are provided by “SO2 - stable wine pigments”. I2 is calculated as ratio of
polymeric color to the color of monomeric anthocyanins brought in the flavylium form by
addition of acid solution together with the color of polymeric pigments. With aging, there was
noted a decrease in anthocyanins concentration. Also, in response to the reactions between
anthocyanins with other wine components there was noted a progressive increase in the “SO2 -
stable pigments” particularly anthocyanin-tannin polymeric pigments. Along with aging of red
wine, I2 increased accordingly.
It was noticed a significant evolution in “chemical age” once the evolution of color
structure towards more stable forms regarding the chemical structure. The lowest values of I1 and
I2 for both red wines were noticed for the youngest wines (0-CS–R and 0-CS–M).
By aging, TMA are gradually included in PP resulted in significant increases of “chemical
age”. At the end of aging, the highest values were recorded for 30-CS-R. These values prove that
CS-R need shorter time for color stabilization than CS-M. This finding is strengthened by the fact
that, the highest value for PP (%) was recorded at the end of aging in the same sample (30-CS-R).
Data shown in Table 1.2 reveal a decrease of antioxidant capacity, expressed by FRAP
values, with 53-54% reported to the initial value for both CS wines.
The linear correlations FRAP versus MA (%) obtained by applying of simple regression
model are showed in Figure 1.4. From this chart it is obvious that, the decreases recorded in
FRAP values in response to aging are strongly correlated with the fraction of color due to MA
(correlation coefficients R1, R2 0.98).
During bottle aging, by decreasing of FRAP values it was noticed a significant increase in
radical scavenging ability. Thus, at the end of aging, DPPH values were about 1.5-1.6 times
reported to the initial value (0-CS). DPPH values were highly correlated with the fraction of color
due to PP (%). The linear correlations DPPH versus PP (%) are shown in Figure 1.5 (R3, R4>
0.985).
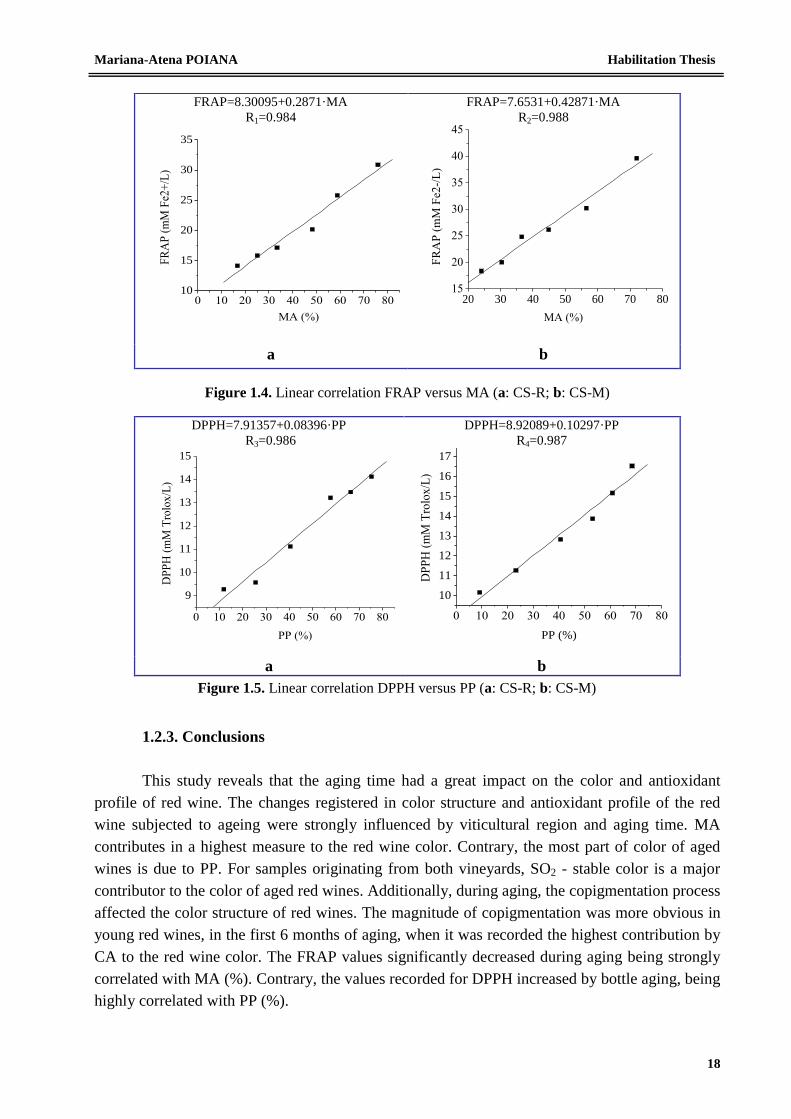
Mariana-Atena POIANA Habilitation Thesis
18
Figure 1.4. Linear correlation FRAP versus MA (a: CS-R; b: CS-M)
Figure 1.5. Linear correlation DPPH versus PP (a: CS-R; b: CS-M)
1.2.3. Conclusions
This study reveals that the aging time had a great impact on the color and antioxidant
profile of red wine. The changes registered in color structure and antioxidant profile of the red
wine subjected to ageing were strongly influenced by viticultural region and aging time. MA
contributes in a highest measure to the red wine color. Contrary, the most part of color of aged
wines is due to PP. For samples originating from both vineyards, SO2 - stable color is a major
contributor to the color of aged red wines. Additionally, during aging, the copigmentation process
affected the color structure of red wines. The magnitude of copigmentation was more obvious in
young red wines, in the first 6 months of aging, when it was recorded the highest contribution by
CA to the red wine color. The FRAP values significantly decreased during aging being strongly
correlated with MA (%). Contrary, the values recorded for DPPH increased by bottle aging, being
highly correlated with PP (%).
FRAP=8.30095+0.2871·MA
R1=0.984
0 10 20 30 40 50 60 70 8010
15
20
25
30
35
FR
AP
(m
M F
e2+
/L)
MA (%)
FRAP=7.6531+0.42871·MA
R2=0.988
20 30 40 50 60 70 8015
20
25
30
35
40
45
FR
AP
(m
M F
e2-/
L)
MA (%)
a b
DPPH=7.91357+0.08396·PP
R3=0.986
0 10 20 30 40 50 60 70 80
9
10
11
12
13
14
15
DP
PH
(m
M T
rolo
x/L
)
PP (%)
DPPH=8.92089+0.10297·PP
R4=0.987
0 10 20 30 40 50 60 70 80
10
11
12
13
14
15
16
17
DP
PH
(m
M T
rolo
x/L
)
PP (%)
a b
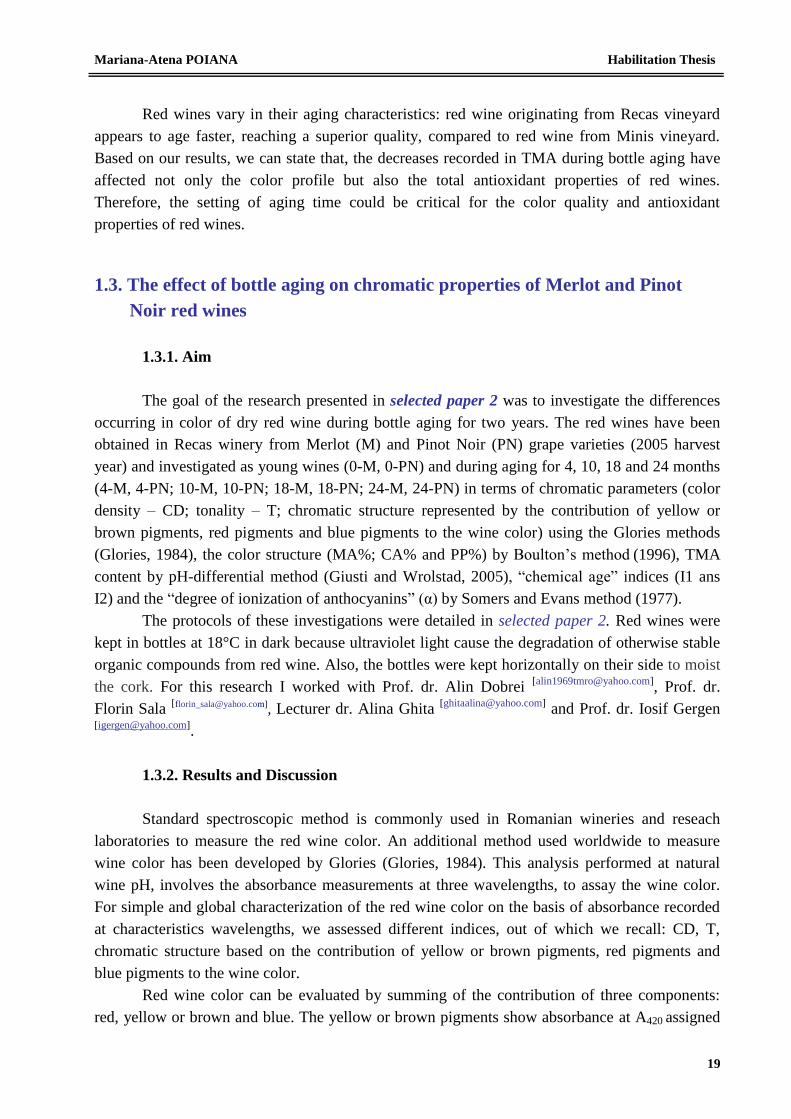
Mariana-Atena POIANA Habilitation Thesis
19
Red wines vary in their aging characteristics: red wine originating from Recas vineyard
appears to age faster, reaching a superior quality, compared to red wine from Minis vineyard.
Based on our results, we can state that, the decreases recorded in TMA during bottle aging have
affected not only the color profile but also the total antioxidant properties of red wines.
Therefore, the setting of aging time could be critical for the color quality and antioxidant
properties of red wines.
1.3. The effect of bottle aging on chromatic properties of Merlot and Pinot
Noir red wines
1.3.1. Aim
The goal of the research presented in selected paper 2 was to investigate the differences
occurring in color of dry red wine during bottle aging for two years. The red wines have been
obtained in Recas winery from Merlot (M) and Pinot Noir (PN) grape varieties (2005 harvest
year) and investigated as young wines (0-M, 0-PN) and during aging for 4, 10, 18 and 24 months
(4-M, 4-PN; 10-M, 10-PN; 18-M, 18-PN; 24-M, 24-PN) in terms of chromatic parameters (color
density – CD; tonality – T; chromatic structure represented by the contribution of yellow or
brown pigments, red pigments and blue pigments to the wine color) using the Glories methods
(Glories, 1984), the color structure (MA%; CA% and PP%) by Boulton’s method (1996), TMA
content by pH-differential method (Giusti and Wrolstad, 2005), “chemical age” indices (I1 ans
I2) and the “degree of ionization of anthocyanins” (α) by Somers and Evans method (1977).
The protocols of these investigations were detailed in selected paper 2. Red wines were
kept in bottles at 18°C in dark because ultraviolet light cause the degradation of otherwise stable
organic compounds from red wine. Also, the bottles were kept horizontally on their side to moist
the cork. For this research I worked with Prof. dr. Alin Dobrei [[email protected]]
, Prof. dr.
Florin Sala [[email protected]]
, Lecturer dr. Alina Ghita [[email protected]]
and Prof. dr. Iosif Gergen [[email protected]]
.
1.3.2. Results and Discussion
Standard spectroscopic method is commonly used in Romanian wineries and reseach
laboratories to measure the red wine color. An additional method used worldwide to measure
wine color has been developed by Glories (Glories, 1984). This analysis performed at natural
wine pH, involves the absorbance measurements at three wavelengths, to assay the wine color.
For simple and global characterization of the red wine color on the basis of absorbance recorded
at characteristics wavelengths, we assessed different indices, out of which we recall: CD, T,
chromatic structure based on the contribution of yellow or brown pigments, red pigments and
blue pigments to the wine color.
Red wine color can be evaluated by summing of the contribution of three components:
red, yellow or brown and blue. The yellow or brown pigments show absorbance at A420 assigned
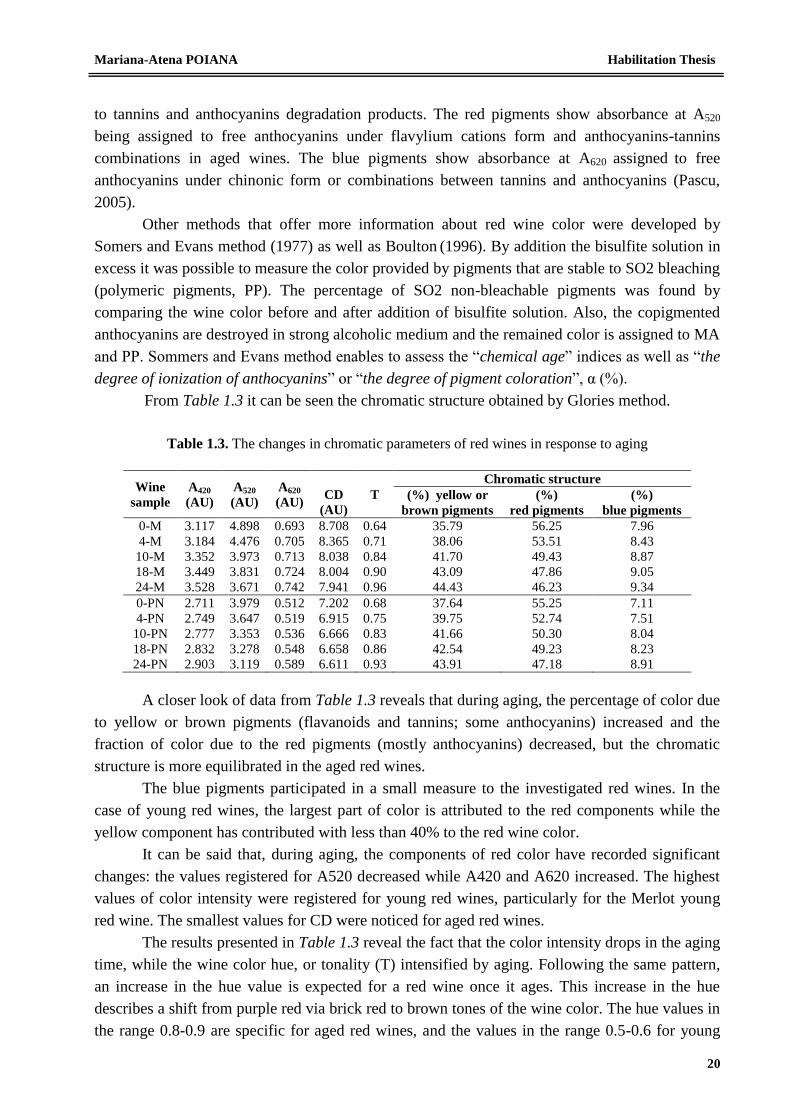
Mariana-Atena POIANA Habilitation Thesis
20
to tannins and anthocyanins degradation products. The red pigments show absorbance at A520
being assigned to free anthocyanins under flavylium cations form and anthocyanins-tannins
combinations in aged wines. The blue pigments show absorbance at A620 assigned to free
anthocyanins under chinonic form or combinations between tannins and anthocyanins (Pascu,
2005).
Other methods that offer more information about red wine color were developed by
Somers and Evans method (1977) as well as Boulton (1996). By addition the bisulfite solution in
excess it was possible to measure the color provided by pigments that are stable to SO2 bleaching
(polymeric pigments, PP). The percentage of SO2 non-bleachable pigments was found by
comparing the wine color before and after addition of bisulfite solution. Also, the copigmented
anthocyanins are destroyed in strong alcoholic medium and the remained color is assigned to MA
and PP. Sommers and Evans method enables to assess the “chemical age” indices as well as “the
degree of ionization of anthocyanins” or “the degree of pigment coloration”, α (%).
From Table 1.3 it can be seen the chromatic structure obtained by Glories method.
Table 1.3. The changes in chromatic parameters of red wines in response to aging
Wine
sample
A420
(AU)
A520
(AU)
A620
(AU)
CD
(AU)
T
Chromatic structure
(%) yellow or
brown pigments
(%)
red pigments
(%)
blue pigments
0-M 3.117 4.898 0.693 8.708 0.64 35.79 56.25 7.96
4-M 3.184 4.476 0.705 8.365 0.71 38.06 53.51 8.43
10-M 3.352 3.973 0.713 8.038 0.84 41.70 49.43 8.87
18-M 3.449 3.831 0.724 8.004 0.90 43.09 47.86 9.05
24-M 3.528 3.671 0.742 7.941 0.96 44.43 46.23 9.34
0-PN 2.711 3.979 0.512 7.202 0.68 37.64 55.25 7.11
4-PN 2.749 3.647 0.519 6.915 0.75 39.75 52.74 7.51
10-PN 2.777 3.353 0.536 6.666 0.83 41.66 50.30 8.04
18-PN 2.832 3.278 0.548 6.658 0.86 42.54 49.23 8.23
24-PN 2.903 3.119 0.589 6.611 0.93 43.91 47.18 8.91
A closer look of data from Table 1.3 reveals that during aging, the percentage of color due
to yellow or brown pigments (flavanoids and tannins; some anthocyanins) increased and the
fraction of color due to the red pigments (mostly anthocyanins) decreased, but the chromatic
structure is more equilibrated in the aged red wines.
The blue pigments participated in a small measure to the investigated red wines. In the
case of young red wines, the largest part of color is attributed to the red components while the
yellow component has contributed with less than 40% to the red wine color.
It can be said that, during aging, the components of red color have recorded significant
changes: the values registered for A520 decreased while A420 and A620 increased. The highest
values of color intensity were registered for young red wines, particularly for the Merlot young
red wine. The smallest values for CD were noticed for aged red wines.
The results presented in Table 1.3 reveal the fact that the color intensity drops in the aging
time, while the wine color hue, or tonality (T) intensified by aging. Following the same pattern,
an increase in the hue value is expected for a red wine once it ages. This increase in the hue
describes a shift from purple red via brick red to brown tones of the wine color. The hue values in
the range 0.8-0.9 are specific for aged red wines, and the values in the range 0.5-0.6 for young
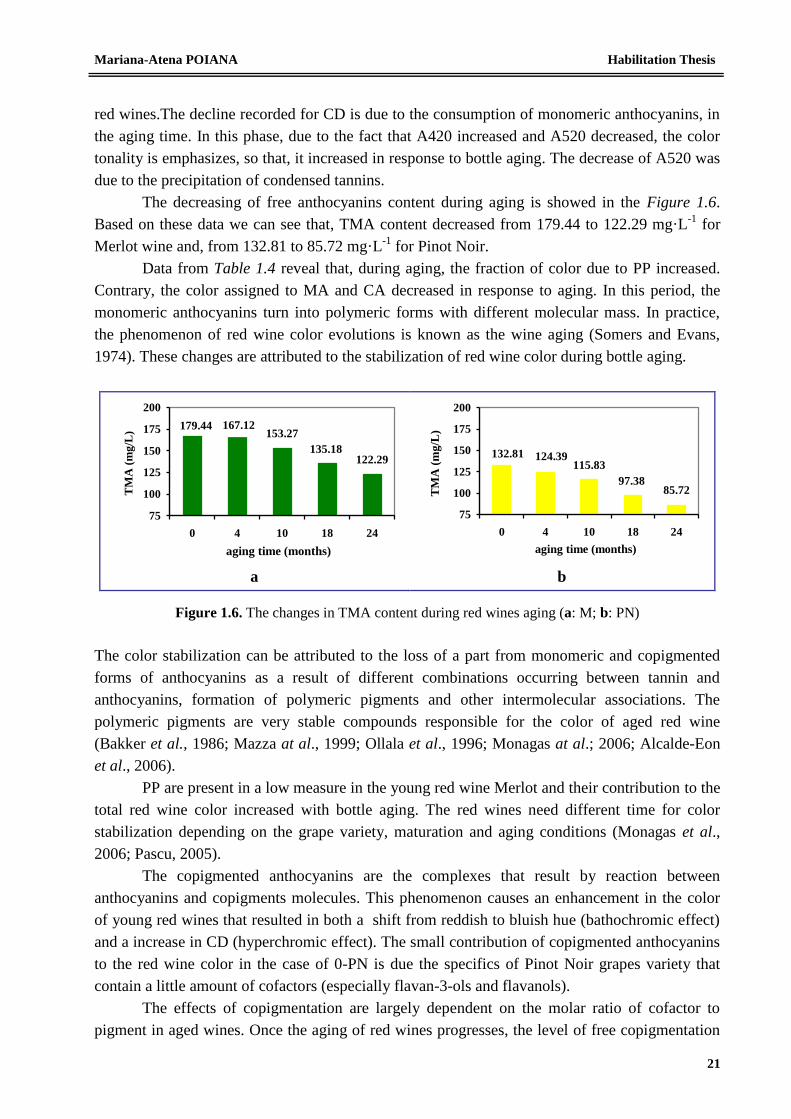
Mariana-Atena POIANA Habilitation Thesis
21
red wines.The decline recorded for CD is due to the consumption of monomeric anthocyanins, in
the aging time. In this phase, due to the fact that A420 increased and A520 decreased, the color
tonality is emphasizes, so that, it increased in response to bottle aging. The decrease of A520 was
due to the precipitation of condensed tannins.
The decreasing of free anthocyanins content during aging is showed in the Figure 1.6.
Based on these data we can see that, TMA content decreased from 179.44 to 122.29 mg·L-1
for
Merlot wine and, from 132.81 to 85.72 mg·L-1
for Pinot Noir.
Data from Table 1.4 reveal that, during aging, the fraction of color due to PP increased.
Contrary, the color assigned to MA and CA decreased in response to aging. In this period, the
monomeric anthocyanins turn into polymeric forms with different molecular mass. In practice,
the phenomenon of red wine color evolutions is known as the wine aging (Somers and Evans,
1974). These changes are attributed to the stabilization of red wine color during bottle aging.
122.29135.18
153.27179.44 167.12
75
100
125
150
175
200
0 4 10 18 24
aging time (months)
TM
A (
mg
/L)
85.7297.38
115.83132.81 124.39
75
100
125
150
175
200
0 4 10 18 24
aging time (months)
TM
A (
mg
/L)
a b
Figure 1.6. The changes in TMA content during red wines aging (a: M; b: PN)
The color stabilization can be attributed to the loss of a part from monomeric and copigmented
forms of anthocyanins as a result of different combinations occurring between tannin and
anthocyanins, formation of polymeric pigments and other intermolecular associations. The
polymeric pigments are very stable compounds responsible for the color of aged red wine
(Bakker et al., 1986; Mazza at al., 1999; Ollala et al., 1996; Monagas at al.; 2006; Alcalde-Eon
et al., 2006).
PP are present in a low measure in the young red wine Merlot and their contribution to the
total red wine color increased with bottle aging. The red wines need different time for color
stabilization depending on the grape variety, maturation and aging conditions (Monagas et al.,
2006; Pascu, 2005).
The copigmented anthocyanins are the complexes that result by reaction between
anthocyanins and copigments molecules. This phenomenon causes an enhancement in the color
of young red wines that resulted in both a shift from reddish to bluish hue (bathochromic effect)
and a increase in CD (hyperchromic effect). The small contribution of copigmented anthocyanins
to the red wine color in the case of 0-PN is due the specifics of Pinot Noir grapes variety that
contain a little amount of cofactors (especially flavan-3-ols and flavanols).
The effects of copigmentation are largely dependent on the molar ratio of cofactor to
pigment in aged wines. Once the aging of red wines progresses, the level of free copigmentation
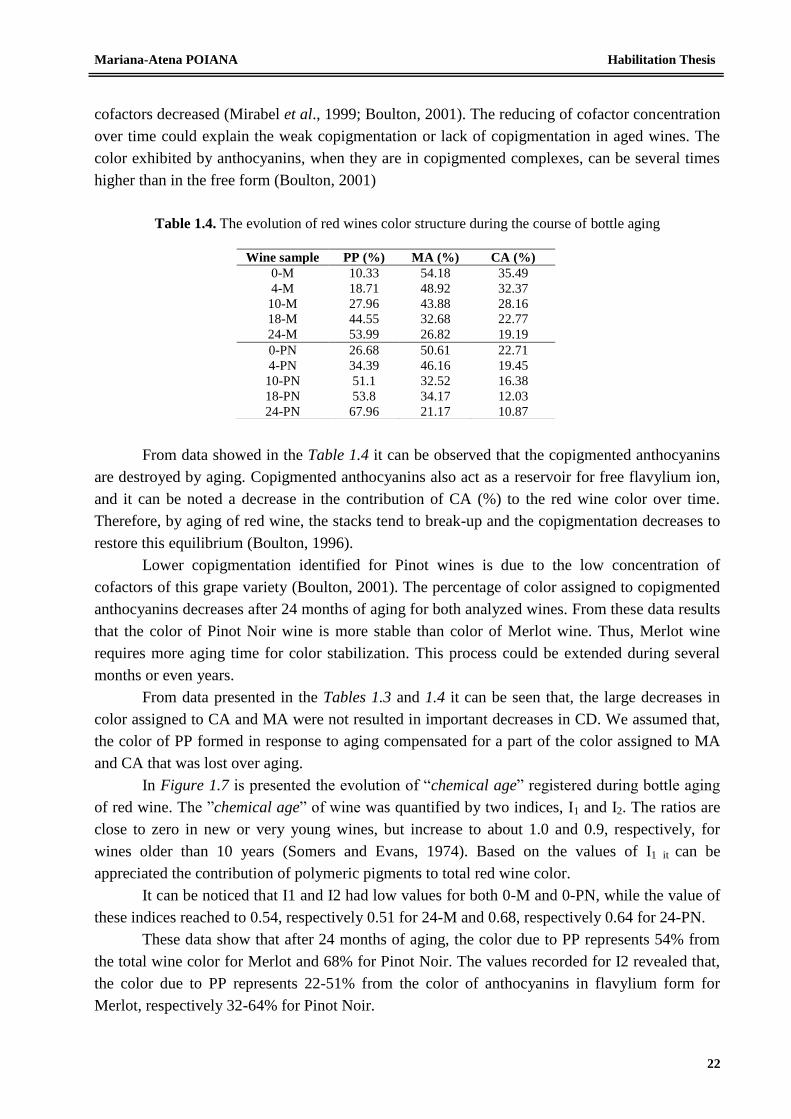
Mariana-Atena POIANA Habilitation Thesis
22
cofactors decreased (Mirabel et al., 1999; Boulton, 2001). The reducing of cofactor concentration
over time could explain the weak copigmentation or lack of copigmentation in aged wines. The
color exhibited by anthocyanins, when they are in copigmented complexes, can be several times
higher than in the free form (Boulton, 2001)
Table 1.4. The evolution of red wines color structure during the course of bottle aging
From data showed in the Table 1.4 it can be observed that the copigmented anthocyanins
are destroyed by aging. Copigmented anthocyanins also act as a reservoir for free flavylium ion,
and it can be noted a decrease in the contribution of CA (%) to the red wine color over time.
Therefore, by aging of red wine, the stacks tend to break-up and the copigmentation decreases to
restore this equilibrium (Boulton, 1996).
Lower copigmentation identified for Pinot wines is due to the low concentration of
cofactors of this grape variety (Boulton, 2001). The percentage of color assigned to copigmented
anthocyanins decreases after 24 months of aging for both analyzed wines. From these data results
that the color of Pinot Noir wine is more stable than color of Merlot wine. Thus, Merlot wine
requires more aging time for color stabilization. This process could be extended during several
months or even years.
From data presented in the Tables 1.3 and 1.4 it can be seen that, the large decreases in
color assigned to CA and MA were not resulted in important decreases in CD. We assumed that,
the color of PP formed in response to aging compensated for a part of the color assigned to MA
and CA that was lost over aging.
In Figure 1.7 is presented the evolution of “chemical age” registered during bottle aging
of red wine. The ”chemical age” of wine was quantified by two indices, I1 and I2. The ratios are
close to zero in new or very young wines, but increase to about 1.0 and 0.9, respectively, for
wines older than 10 years (Somers and Evans, 1974). Based on the values of I1 it can be
appreciated the contribution of polymeric pigments to total red wine color.
It can be noticed that I1 and I2 had low values for both 0-M and 0-PN, while the value of
these indices reached to 0.54, respectively 0.51 for 24-M and 0.68, respectively 0.64 for 24-PN.
These data show that after 24 months of aging, the color due to PP represents 54% from
the total wine color for Merlot and 68% for Pinot Noir. The values recorded for I2 revealed that,
the color due to PP represents 22-51% from the color of anthocyanins in flavylium form for
Merlot, respectively 32-64% for Pinot Noir.
Wine sample PP (%) MA (%) CA (%)
0-M 10.33 54.18 35.49
4-M 18.71 48.92 32.37
10-M 27.96 43.88 28.16
18-M 44.55 32.68 22.77
24-M 53.99 26.82 19.19
0-PN 26.68 50.61 22.71
4-PN 34.39 46.16 19.45
10-PN 51.1 32.52 16.38
18-PN 53.8 34.17 12.03
24-PN 67.96 21.17 10.87
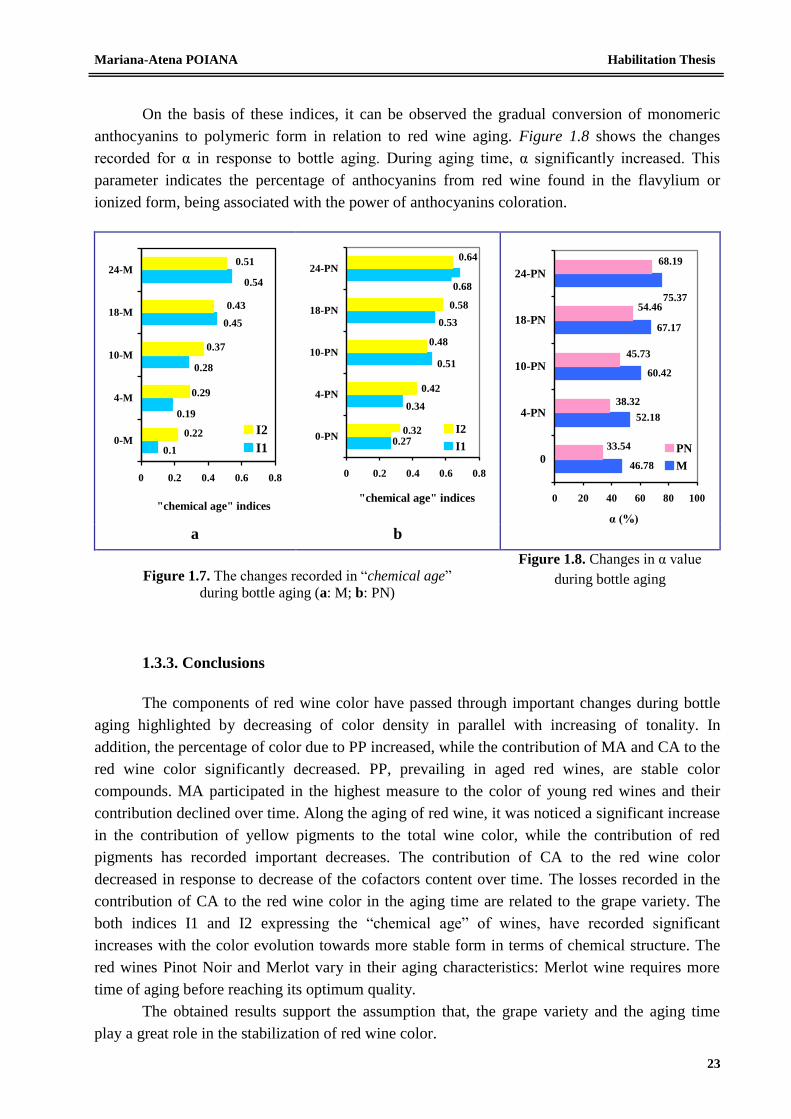
Mariana-Atena POIANA Habilitation Thesis
23
On the basis of these indices, it can be observed the gradual conversion of monomeric
anthocyanins to polymeric form in relation to red wine aging. Figure 1.8 shows the changes
recorded for α in response to bottle aging. During aging time, α significantly increased. This
parameter indicates the percentage of anthocyanins from red wine found in the flavylium or
ionized form, being associated with the power of anthocyanins coloration.
0.54
0.45
0.28
0.1
0.19
0.51
0.43
0.37
0.29
0.22
0 0.2 0.4 0.6 0.8
0-M
4-M
10-M
18-M
24-M
"chemical age" indices
I2
I1
0.34
0.27
0.51
0.53
0.68
0.32
0.42
0.48
0.58
0.64
0 0.2 0.4 0.6 0.8
0-PN
4-PN
10-PN
18-PN
24-PN
"chemical age" indices
I2
I1
75.37
67.17
60.42
46.78
52.18
68.19
54.46
45.73
38.32
33.54
0 20 40 60 80 100
0
4-PN
10-PN
18-PN
24-PN
α (%)
PN
M
a b
Figure 1.7. The changes recorded in “chemical age”
during bottle aging (a: M; b: PN)
Figure 1.8. Changes in α value
during bottle aging
1.3.3. Conclusions
The components of red wine color have passed through important changes during bottle
aging highlighted by decreasing of color density in parallel with increasing of tonality. In
addition, the percentage of color due to PP increased, while the contribution of MA and CA to the
red wine color significantly decreased. PP, prevailing in aged red wines, are stable color
compounds. MA participated in the highest measure to the color of young red wines and their
contribution declined over time. Along the aging of red wine, it was noticed a significant increase
in the contribution of yellow pigments to the total wine color, while the contribution of red
pigments has recorded important decreases. The contribution of CA to the red wine color
decreased in response to decrease of the cofactors content over time. The losses recorded in the
contribution of CA to the red wine color in the aging time are related to the grape variety. The
both indices I1 and I2 expressing the “chemical age” of wines, have recorded significant
increases with the color evolution towards more stable form in terms of chemical structure. The
red wines Pinot Noir and Merlot vary in their aging characteristics: Merlot wine requires more
time of aging before reaching its optimum quality.
The obtained results support the assumption that, the grape variety and the aging time
play a great role in the stabilization of red wine color.
Mariana-Atena POIANA Habilitation Thesis
24
1.4. Scientific contributions of the author to the actual state-of-knowledge
Regarding the subjects presented above and based on the studies done by the author and
the obtained results on this topic, the personal contributions include:
According to the candidate knowledge, the presented works done in the field of red wine
color changes as result of aging process are the first studies conducted for red wines
obtained in two famous wineries from Western Romania. Moreover, the two indices
expressing the “chemical age” related to the grape variety, vineyard and aging time were
for the first time evaluated in Romania;
Meanwhile, the author being extremely interested in the red wine color analysis published
in 2008 a book entitled “The analysis of red wine color” (published in Romanian) at
EUROBIT Publishing House (ISBN 978-973-620-378-7, 181 pp.). This is a modest
attempt to focus different aspects on this topic, such as: the opportunity to use some
selective spectrophotometric methods for red wine color assessment, the influence of
copigmentation on red wine color quality, the factors contributing to the change in red
wine color over the time and development of some correlations between different
anthocyanin pigments and antioxidant profile of red wine;
Grape variety and the aging time are playing a great role in the red wine color
stabilization. Also, the aging time has a great impact on the color and antioxidant profile
of red wine. The red wine color passes through important changes during aging evidenced
by decreasing of CD accompanied by increasing in its hue or tonality. An increase in the
hue value is expected for a red wine as it ages. This increase describes a shift from purple
red via brick red to brown tones of the wine color. The changes of chromatic parameters
CD and T were strongly dependent on the viticultural region, aging time and grape
variety;
Wine pigments contribute with different amounts to wine color, depending not only on the
age, grape variety, as well of the proportion and presence of anthocyanins and
anthocyanins-derived pigments;
The change in SO2-stable color and the change in the percentage of SO2-stable red wine
pigments were related to the change in wine color during aging;
The anthocyanins polymerization was prevailed among the reactions of anthocyanins
occurring during aging. The stabilization of red wine color during aging involves the
formation of PP on the base of free or monomeric anthocyanins consumption;
TMA participated in a higher measure to the young red wine color as well as to their
antioxidant properties. Contrary, the color of aged wines is due to PP that are stable color
compounds, responsible for their antiradicalic properties. SO2 - stable wine color is a
major contributor to the color of aged red wine. Therefore, the color of PP may be the
driving force which is behind the color density of aged wine;
Once the aging of red wines progresses, the contribution of copigmented anthocyanins
decreases. The weak copigmentation in aged wines could be explained by reducing in
Mariana-Atena POIANA Habilitation Thesis
25
cofactor concentration over time. The significance of copigmentation was still relevant
after two years of bottle aging;
Both indices I1 and I2 expressing the “chemical age” of wine, significantly increase with
the color evolutions towards more stable form in terms of chemical structure;
The chemical index I2 values indicated that for young red wine, the major contributor to
wine color were the pH-dependent wine pigments, while the SO2-stable wine pigments
provided only a minor contribution. For aged red wine, the situation was contrary;
Red wines vary in their aging characteristics depending on the grape variety and vineyard:
some wines appear to age faster, reaching a superior quality, while others require more
time of aging before reaching their optimum quality;
The selective UV-VIS methods used for red wine color measurements represent a
valuable opportunity for winemakers that have not been considered in traditional wine
color analysis; these methods offers some advantages over standard method used in the
routine analysis of red wine color because they are able to provide more information
about the red color structure, as well as concerning their aging characteristics. It may be
advanced the idea that, the chromatic profile of red wines can be directed by setting of
aging time.
The original elements of this research consits in the obtaining of a real image regarding
the evolution of anthocyanic pigments and antioxidant profile of red wine during bottle aging,
the extension of modern wine color analysis and interpretation of the wine color variations in
relation to its antioxidant properties, the development of scientifically-based color profiles of
red wines. Also, the obtained results are important in order to predict the evolution of red wine
color during bottle aging.
Knowledge of the color pigments contribution to wine color will enable winemakers to
manipulate various techniques and factors to achieve optimized color for their red wines.
Mariana-Atena POIANA Habilitation Thesis
26
2. Scientifical achievements concerning the impact of processing and storage
on antioxidant characteristics and color of fruit and gelled fruit products
The studies on this direction were carried out for solving the objectives of research project
no. 637/21.01.2009 with theme: Studies regarding the impact of technological treatments on
antioxidant characteristics of some products obtained from wild berries, developed between
Banat’s University of Agricultural Sciences and Veterinary Medicine from Timisoara and SC
Etco Europe Trade Company from Sebis (Arad County) in the period 2009-2011 and coordinated
by me as director.
2.1. Background
As a result of increased attention paid by consumers to the health and nutritional aspects
of fruit products, the significance of fruit phenolics as dietary antioxidants has recently been
suggested by several research groups. Small fruits as different berries, sweet and sour cherries
contain significant levels of phytochemicals with important biological properties (Moyer et al.,
2002; Scalzo et al., 2005). Most people will associate the berries consumption with the idea of
healthy food. In addition to being a delicious part of any diet, consumption of small fruits has
been associated with diverse health benefits, these fruits are known for their bioactive properties
such as antioxidant activity, cardiovascular protection, antidiabetic properties and inhibition of
carcinogenesis, mutagenesis and other degenerative or age-related diseases (Bachgi et al., 2004;
Schmidt et al., 2005). These beneficial effects could mostly be due to their high concentrations of
natural antioxidants (Bachgi et al., 2004; Pantelidis et al., 2007) including phenolic compounds
and ascorbic acid. Berries have a complex mixture of anthocyanins which may fortify blood
vessel walls, induced increase in flexibility of the capillaries, improve blood flow and maintain
good circulation (Kalt et al., 2000; Zafra-Stone et al., 2007).
Blueberries, bilberries, raspberries, blackberries are very important natural resource
possessing a high level of antioxidant properties which are closely linked to the levels of phenolic
compounds such as ellagic acid, tannins, ellagitannins, quercetin, gallic acid, anthocyanins and
cyanidins (Pantelidis et al., 2007). Thus, these berries are an excellent source of phytochemicals
that are proven to have significant biological activity (Prior et al., 1998; Schmidt et al., 2005).
Due to the high contents of health-promoting compounds, these fruits have long been considered
super foods, being often referred to as natural functional products (Joeph et al., 2000). During the
last decade, much interest has been focused on berries due to their high levels of anthocyanins
and antioxidant capacity. Prior et al. (1998) reported a significant correlation between the
antioxidant capacity and the total content of anthocyanins and phenolics among blueberries. Also,
the results reported by Moyer et al. (2002) and Koca et al. (2008) are found significant
differences in the anthocyanins, phenolics, and antioxidant capacity phenolic content among the
different species of berries. Additionally, polyphenolic compounds including anthocyanins and
proanthocyanidins are not completely stable. After harvest these compounds can change during
food processing and storage, which may reduce related biological activity (Klopotek et al., 2005;
Schmidt et al., 2005).
Mariana-Atena POIANA Habilitation Thesis
27
The berries harvest season in Romania as well as in the most part of Central Europe is
short, lasting from July to September. Considering that berries are extremely perishable, only a
small percentage of berries are marketed fresh, most berries end up frozen or canned. Frozen
berries can be further processed into various shelf-life products such as jams, purees, jellies and
juices available to consumers all year round (Lohachoompol et al., 2004; Schmidt et al., 2005).
Freezing has been successfully employed for the long-term preservation of many fruit,
providing a significantly extended shelf life. It can be said that freezing and frozen storage is one
of the best ways of preserving, resulting in increase the flexibility for consumers by extending the
length of time in which fruits are available. Frozen fruit are available year round, and are often
less expensive than their “fresh” counterparts. In frozen berries place changes in antioxidant
content and color as a result of oxidation-reduction reactions occurring in fruits. These changes
will be influenced by: the initial quality of berries, raw material processing prior to freezing,
freezing methods, storage conditions (temperature and relative humidity), storage time of frozen
berries and quality of container (Mullen et al., 2002; Scibisz and Mitek, 2007).
Due to the high antioxidant levels found in berries, fruit processors are seeking effective
processing techniques such as IQF (Individual Quick Freezing) to further optimize the amount of
antioxidants retained in the final product. Freezing of berries will increase flexibility for
consumers by extending the length of time in which fruits are available. IQF is one of the
simplest and least time-consuming ways to preserve berries, but the long-them frozen storage
might affect anthocyanins, polyphenols, vitamin C, color quality and antioxidant effects of
berries.
The literature provides several studies about the effects of freezing and frozen storage on
the retention of antioxidants in different berries (Ancos et al., 2000; Kampuse et al., 2002;
Gonzalez et al. 2003; Lohachoompol et al., 2004; Mullen et al., 2002; Scibisz and Mitek, 2007).
At some point, it was obvious that the content of bioactive compounds in frozen fruit is greatly
affected by storage time. In this respect there are little information about the effect of long-term
frozen storage on antioxidant properties, total phenolics, color indices and other bioactive
compounds of different kind of berries. Considering that during frozen storage, the levels of
antioxidants compounds from berries may be altered resulting in a change in antioxidant
properties, the goal of the first study on this research direction performed by Poiana et al. (2010)
was to investigate how freezing and long-term storage can affect the retention of antioxidant
properties and bioactive compounds in berries. This study is presented in selected paper 3.
Recently, an increased interest in the identification of valuable possibilities for preserving
the antioxidant properties of products obtained by thermal processing of fruits rich in bioactive
compounds can be noticed. The increasing demand for food with antioxidant action has focused
interest on fruit products as a good source of biologically active compounds with considerable
antioxidant potential. Among various products for long-term preservation of fruits, one of the
most popular, produced by both home canners and commercial processors is jam (Amakura et al.,
2000; Savikin et al., 2009; Howard et al., 2010). The preservation of fruits by jam making is a
major direction of the fruits processing but the antioxidant and sensorial characteristics of final
products are strongly affected by various factors (Chaovanalikit and Wrolstad, 2004;
Brownmiller et al., 2008). Raw material quality, products formulation, processing methods
Mariana-Atena POIANA Habilitation Thesis
28
varying in the number and type of unit operations, heating temperature, processing time and
storage conditions can significantly affect the amount of bioactive compound preserved in fruit
products and finally, their antioxidant properties (Patras et al., 2010; Rababah et al., 2011).
As a result of health benefits and medical restriction an increasing number of consumers
are turning to fruit products with low-sugar content due to their high nutritional value (Moura et
al., 2012). Low sugar jams were originally developed for diabetics and people with specific
health problems. These products offer an important opportunity to create a healthy, seasonally
independent and mixed diet. The food industry has been confronted with a new challenge for
satisfying the consumers concretized in the development of low-calorie products with acceptable
sensorial characteristics and competitive prices, by preferably employing the conventional
processing equipment. One question that arises is whether the high quality low-sugar jams could
represent a good source of bioactive compounds as fresh fruit does. In this regard, an extensive
analysis is necessary in terms of thermal processed products behavior in relation to various
factors. During jam processing, the fruits are subjected to a long heating at high temperature. A
significant issue we face during jam processing in households, small-scale or industrial sectors is
the negative impact of thermal treatment on the bioactive compounds and consequently, on the
antioxidant properties displayed by the obtained products.
The researches conducted by Rommel et al. (1992), Patras et al. (2009, 2010), Srivastava
et al., (2007), Brownmiller et al. (2008), Howard et al. (2010), Rababah et al. (2011),
Syamaladevi et al. (2012) have shown that various processing methods of fruits cause serious
alterations in their antioxidant properties due to the loss of anthocyanins and phenolic
compounds. In fruit jams, anthocyanins represent both a source of natural antioxidants and a key
parameter for color quality, affecting their acceptance by the consumers (Gimenez et al., 2001).
The anthocyanins content in fruit products derived from original fruits being much
smaller than the original anthocyanin content in the raw material because the anthocyanins are
highly unstable pigments, easily susceptible to degradation.
The manufacturing of berry products leads to deterioration of anthocyanins and the color
of the final products. Moreover, during storage the color of berry products is degraded further.
Thus, the choice of a processing method immensely affects the color quality of the food products.
Besides its nutritional properties, the jam color is an important factor influencing consumer
acceptability, thus minimizing of the anthocyanins losses during processing and storage is one of
the primary concerns (Scibisz and Mitek, 2007). However, obtaining a strong and stable color of
different fruit products is problematic during processing and storage. Anthocyanins content has a
critical role in the color quality of many fresh and processed fruits. The color deterioration is
associated with the loss of anthocyanin pigments or formation of brown pigments (Brownmiller
et al., 2008).
The results reported by Sadilova et al. (2007) have revealed that during heating, the
anthocyanins degradation generally cause the pigments discoloration having a great impact on
color quality and also, on their in vitro antioxidant capacity. Pinto et al., (2007) showed that
anthocyanins are very sensitive to temperature, and a combined time/temperature process can
greatly reduce the level of pigments in the obtained products. Anthocyanins losses are probably
due to complexation with co-occurring compounds during jam processing.
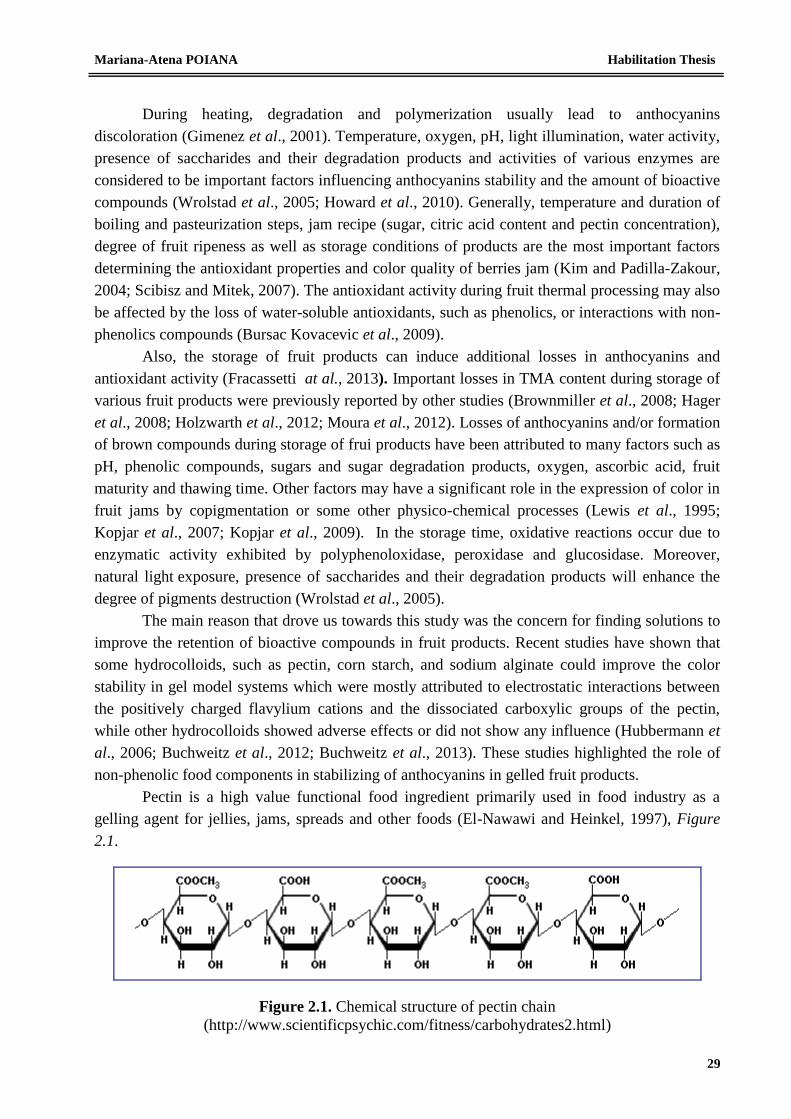
Mariana-Atena POIANA Habilitation Thesis
29
During heating, degradation and polymerization usually lead to anthocyanins
discoloration (Gimenez et al., 2001). Temperature, oxygen, pH, light illumination, water activity,
presence of saccharides and their degradation products and activities of various enzymes are
considered to be important factors influencing anthocyanins stability and the amount of bioactive
compounds (Wrolstad et al., 2005; Howard et al., 2010). Generally, temperature and duration of
boiling and pasteurization steps, jam recipe (sugar, citric acid content and pectin concentration),
degree of fruit ripeness as well as storage conditions of products are the most important factors
determining the antioxidant properties and color quality of berries jam (Kim and Padilla-Zakour,
2004; Scibisz and Mitek, 2007). The antioxidant activity during fruit thermal processing may also
be affected by the loss of water-soluble antioxidants, such as phenolics, or interactions with non-
phenolics compounds (Bursac Kovacevic et al., 2009).
Also, the storage of fruit products can induce additional losses in anthocyanins and
antioxidant activity (Fracassetti at al., 2013). Important losses in TMA content during storage of
various fruit products were previously reported by other studies (Brownmiller et al., 2008; Hager
et al., 2008; Holzwarth et al., 2012; Moura et al., 2012). Losses of anthocyanins and/or formation
of brown compounds during storage of frui products have been attributed to many factors such as
pH, phenolic compounds, sugars and sugar degradation products, oxygen, ascorbic acid, fruit
maturity and thawing time. Other factors may have a significant role in the expression of color in
fruit jams by copigmentation or some other physico-chemical processes (Lewis et al., 1995;
Kopjar et al., 2007; Kopjar et al., 2009). In the storage time, oxidative reactions occur due to
enzymatic activity exhibited by polyphenoloxidase, peroxidase and glucosidase. Moreover,
natural light exposure, presence of saccharides and their degradation products will enhance the
degree of pigments destruction (Wrolstad et al., 2005).
The main reason that drove us towards this study was the concern for finding solutions to
improve the retention of bioactive compounds in fruit products. Recent studies have shown that
some hydrocolloids, such as pectin, corn starch, and sodium alginate could improve the color
stability in gel model systems which were mostly attributed to electrostatic interactions between
the positively charged flavylium cations and the dissociated carboxylic groups of the pectin,
while other hydrocolloids showed adverse effects or did not show any influence (Hubbermann et
al., 2006; Buchweitz et al., 2012; Buchweitz et al., 2013). These studies highlighted the role of
non-phenolic food components in stabilizing of anthocyanins in gelled fruit products.
Pectin is a high value functional food ingredient primarily used in food industry as a
gelling agent for jellies, jams, spreads and other foods (El-Nawawi and Heinkel, 1997), Figure
2.1.
Figure 2.1. Chemical structure of pectin chain
(http://www.scientificpsychic.com/fitness/carbohydrates2.html)
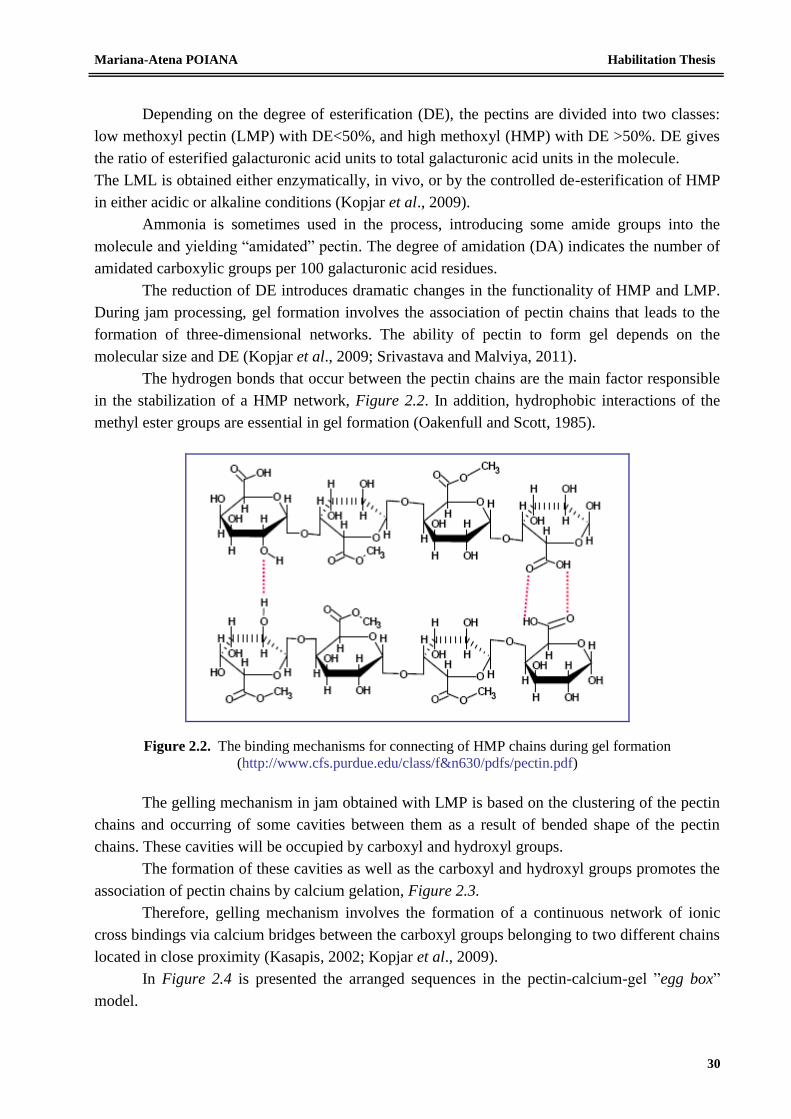
Mariana-Atena POIANA Habilitation Thesis
30
Depending on the degree of esterification (DE), the pectins are divided into two classes:
low methoxyl pectin (LMP) with DE<50%, and high methoxyl (HMP) with DE >50%. DE gives
the ratio of esterified galacturonic acid units to total galacturonic acid units in the molecule.
The LML is obtained either enzymatically, in vivo, or by the controlled de-esterification of HMP
in either acidic or alkaline conditions (Kopjar et al., 2009).
Ammonia is sometimes used in the process, introducing some amide groups into the
molecule and yielding “amidated” pectin. The degree of amidation (DA) indicates the number of
amidated carboxylic groups per 100 galacturonic acid residues.
The reduction of DE introduces dramatic changes in the functionality of HMP and LMP.
During jam processing, gel formation involves the association of pectin chains that leads to the
formation of three-dimensional networks. The ability of pectin to form gel depends on the
molecular size and DE (Kopjar et al., 2009; Srivastava and Malviya, 2011).
The hydrogen bonds that occur between the pectin chains are the main factor responsible
in the stabilization of a HMP network, Figure 2.2. In addition, hydrophobic interactions of the
methyl ester groups are essential in gel formation (Oakenfull and Scott, 1985).
Figure 2.2. The binding mechanisms for connecting of HMP chains during gel formation
(http://www.cfs.purdue.edu/class/f&n630/pdfs/pectin.pdf)
The gelling mechanism in jam obtained with LMP is based on the clustering of the pectin
chains and occurring of some cavities between them as a result of bended shape of the pectin
chains. These cavities will be occupied by carboxyl and hydroxyl groups.
The formation of these cavities as well as the carboxyl and hydroxyl groups promotes the
association of pectin chains by calcium gelation, Figure 2.3.
Therefore, gelling mechanism involves the formation of a continuous network of ionic
cross bindings via calcium bridges between the carboxyl groups belonging to two different chains
located in close proximity (Kasapis, 2002; Kopjar et al., 2009).
In Figure 2.4 is presented the arranged sequences in the pectin-calcium-gel ”egg box”
model.
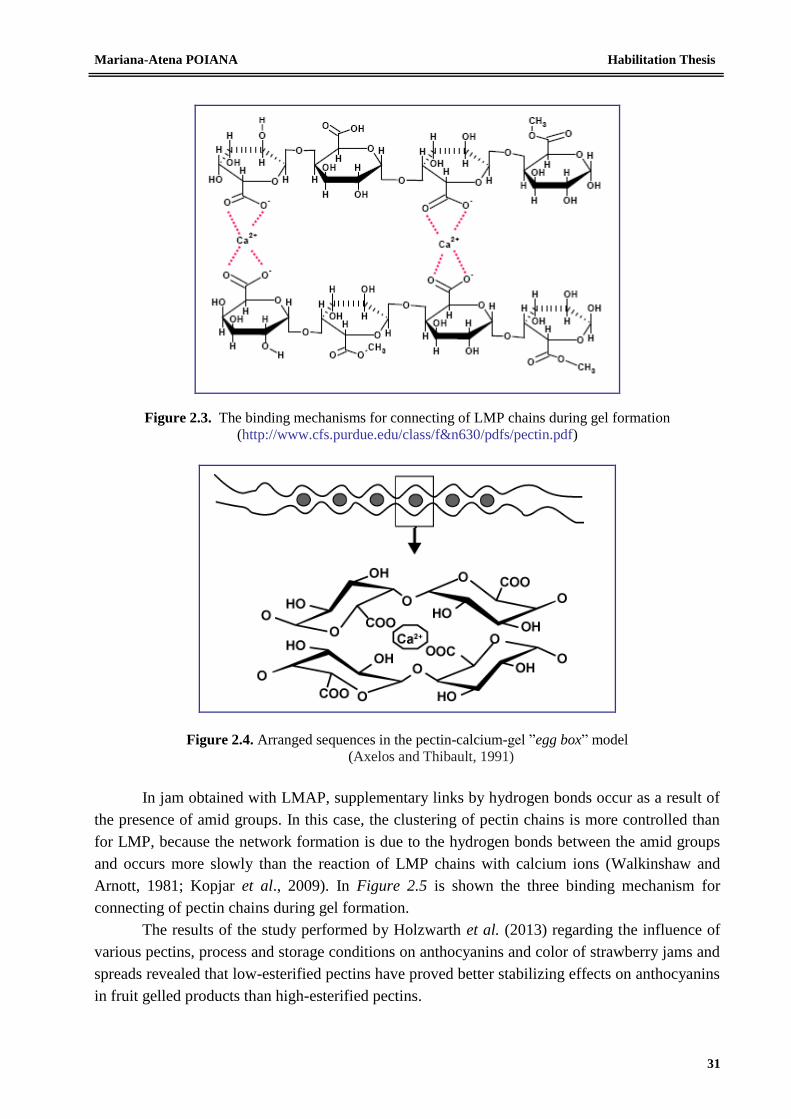
Mariana-Atena POIANA Habilitation Thesis
31
Figure 2.3. The binding mechanisms for connecting of LMP chains during gel formation
(http://www.cfs.purdue.edu/class/f&n630/pdfs/pectin.pdf)
Figure 2.4. Arranged sequences in the pectin-calcium-gel ”egg box” model
(Axelos and Thibault, 1991)
In jam obtained with LMAP, supplementary links by hydrogen bonds occur as a result of
the presence of amid groups. In this case, the clustering of pectin chains is more controlled than
for LMP, because the network formation is due to the hydrogen bonds between the amid groups
and occurs more slowly than the reaction of LMP chains with calcium ions (Walkinshaw and
Arnott, 1981; Kopjar et al., 2009). In Figure 2.5 is shown the three binding mechanism for
connecting of pectin chains during gel formation.
The results of the study performed by Holzwarth et al. (2013) regarding the influence of
various pectins, process and storage conditions on anthocyanins and color of strawberry jams and
spreads revealed that low-esterified pectins have proved better stabilizing effects on anthocyanins
in fruit gelled products than high-esterified pectins.
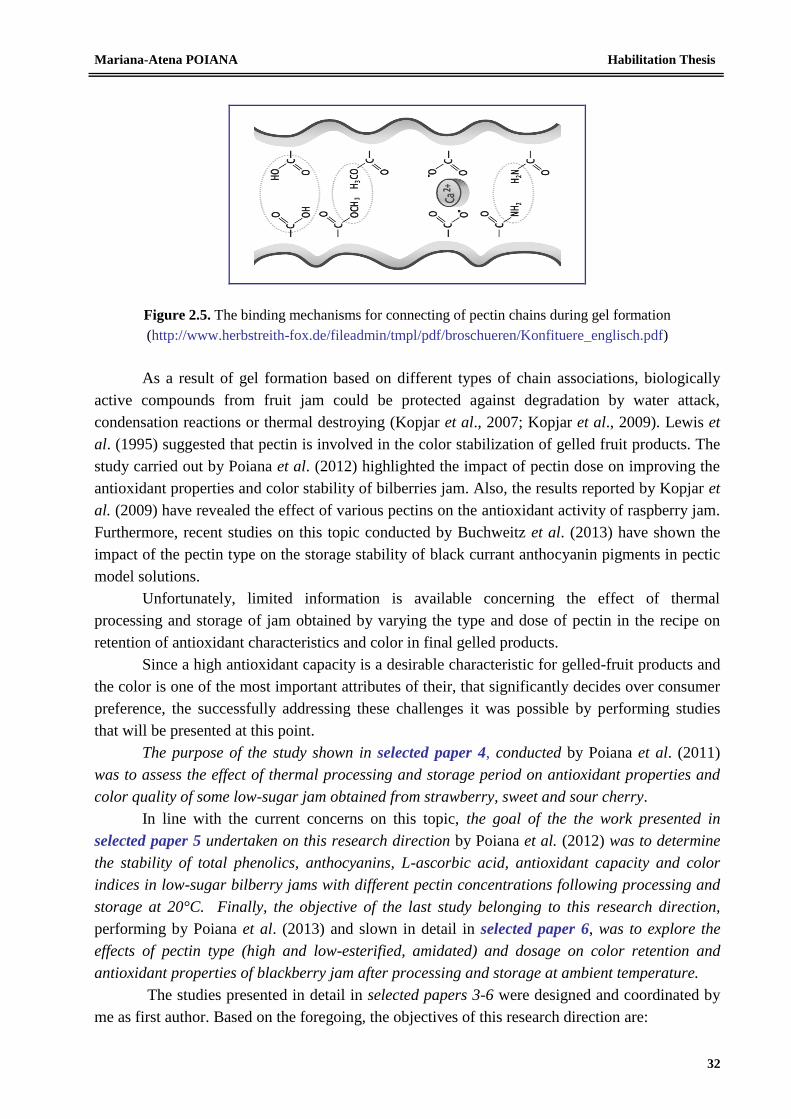
Mariana-Atena POIANA Habilitation Thesis
32
Figure 2.5. The binding mechanisms for connecting of pectin chains during gel formation
(http://www.herbstreith-fox.de/fileadmin/tmpl/pdf/broschueren/Konfituere_englisch.pdf)
As a result of gel formation based on different types of chain associations, biologically
active compounds from fruit jam could be protected against degradation by water attack,
condensation reactions or thermal destroying (Kopjar et al., 2007; Kopjar et al., 2009). Lewis et
al. (1995) suggested that pectin is involved in the color stabilization of gelled fruit products. The
study carried out by Poiana et al. (2012) highlighted the impact of pectin dose on improving the
antioxidant properties and color stability of bilberries jam. Also, the results reported by Kopjar et
al. (2009) have revealed the effect of various pectins on the antioxidant activity of raspberry jam.
Furthermore, recent studies on this topic conducted by Buchweitz et al. (2013) have shown the
impact of the pectin type on the storage stability of black currant anthocyanin pigments in pectic
model solutions.
Unfortunately, limited information is available concerning the effect of thermal
processing and storage of jam obtained by varying the type and dose of pectin in the recipe on
retention of antioxidant characteristics and color in final gelled products.
Since a high antioxidant capacity is a desirable characteristic for gelled-fruit products and
the color is one of the most important attributes of their, that significantly decides over consumer
preference, the successfully addressing these challenges it was possible by performing studies
that will be presented at this point.
The purpose of the study shown in selected paper 4, conducted by Poiana et al. (2011)
was to assess the effect of thermal processing and storage period on antioxidant properties and
color quality of some low-sugar jam obtained from strawberry, sweet and sour cherry.
In line with the current concerns on this topic, the goal of the the work presented in
selected paper 5 undertaken on this research direction by Poiana et al. (2012) was to determine
the stability of total phenolics, anthocyanins, L-ascorbic acid, antioxidant capacity and color
indices in low-sugar bilberry jams with different pectin concentrations following processing and
storage at 20°C. Finally, the objective of the last study belonging to this research direction,
performing by Poiana et al. (2013) and slown in detail in selected paper 6, was to explore the
effects of pectin type (high and low-esterified, amidated) and dosage on color retention and
antioxidant properties of blackberry jam after processing and storage at ambient temperature.
The studies presented in detail in selected papers 3-6 were designed and coordinated by
me as first author. Based on the foregoing, the objectives of this research direction are:
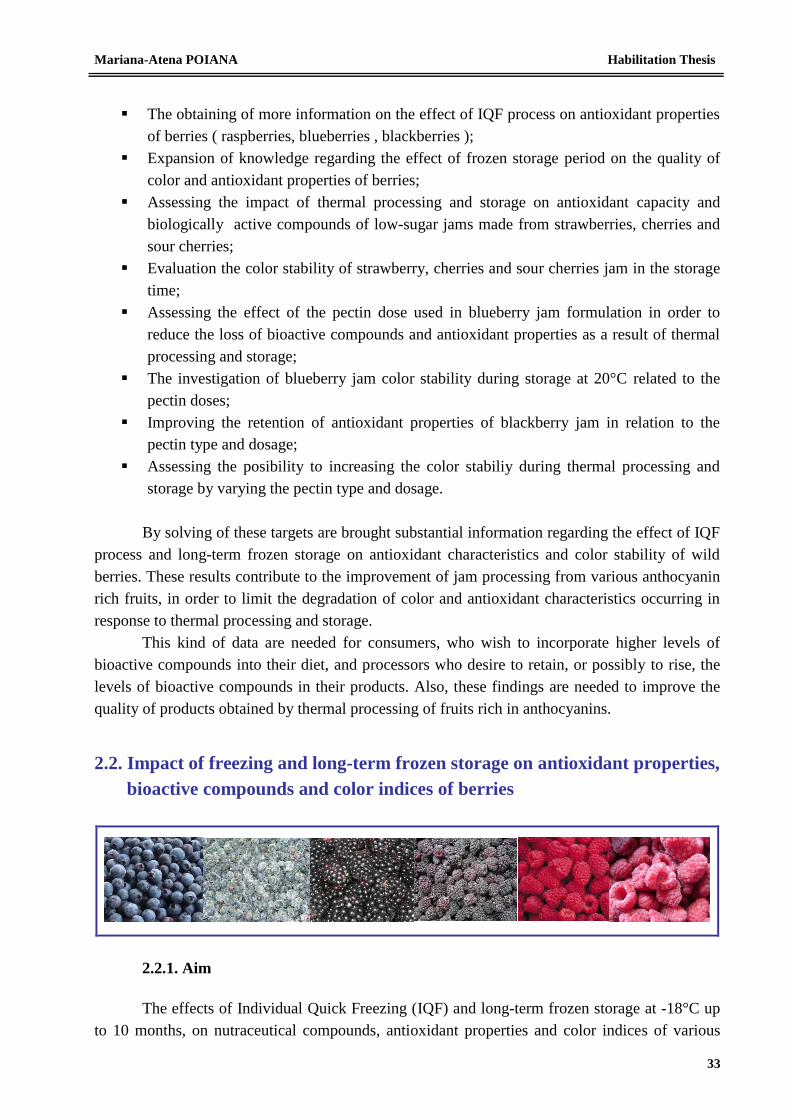
Mariana-Atena POIANA Habilitation Thesis
33
The obtaining of more information on the effect of IQF process on antioxidant properties
of berries ( raspberries, blueberries , blackberries );
Expansion of knowledge regarding the effect of frozen storage period on the quality of
color and antioxidant properties of berries;
Assessing the impact of thermal processing and storage on antioxidant capacity and
biologically active compounds of low-sugar jams made from strawberries, cherries and
sour cherries;
Evaluation the color stability of strawberry, cherries and sour cherries jam in the storage
time;
Assessing the effect of the pectin dose used in blueberry jam formulation in order to
reduce the loss of bioactive compounds and antioxidant properties as a result of thermal
processing and storage;
The investigation of blueberry jam color stability during storage at 20°C related to the
pectin doses;
Improving the retention of antioxidant properties of blackberry jam in relation to the
pectin type and dosage;
Assessing the posibility to increasing the color stabiliy during thermal processing and
storage by varying the pectin type and dosage.
By solving of these targets are brought substantial information regarding the effect of IQF
process and long-term frozen storage on antioxidant characteristics and color stability of wild
berries. These results contribute to the improvement of jam processing from various anthocyanin
rich fruits, in order to limit the degradation of color and antioxidant characteristics occurring in
response to thermal processing and storage.
This kind of data are needed for consumers, who wish to incorporate higher levels of
bioactive compounds into their diet, and processors who desire to retain, or possibly to rise, the
levels of bioactive compounds in their products. Also, these findings are needed to improve the
quality of products obtained by thermal processing of fruits rich in anthocyanins.
2.2. Impact of freezing and long-term frozen storage on antioxidant properties,
bioactive compounds and color indices of berries
2.2.1. Aim
The effects of Individual Quick Freezing (IQF) and long-term frozen storage at -18°C up
to 10 months, on nutraceutical compounds, antioxidant properties and color indices of various
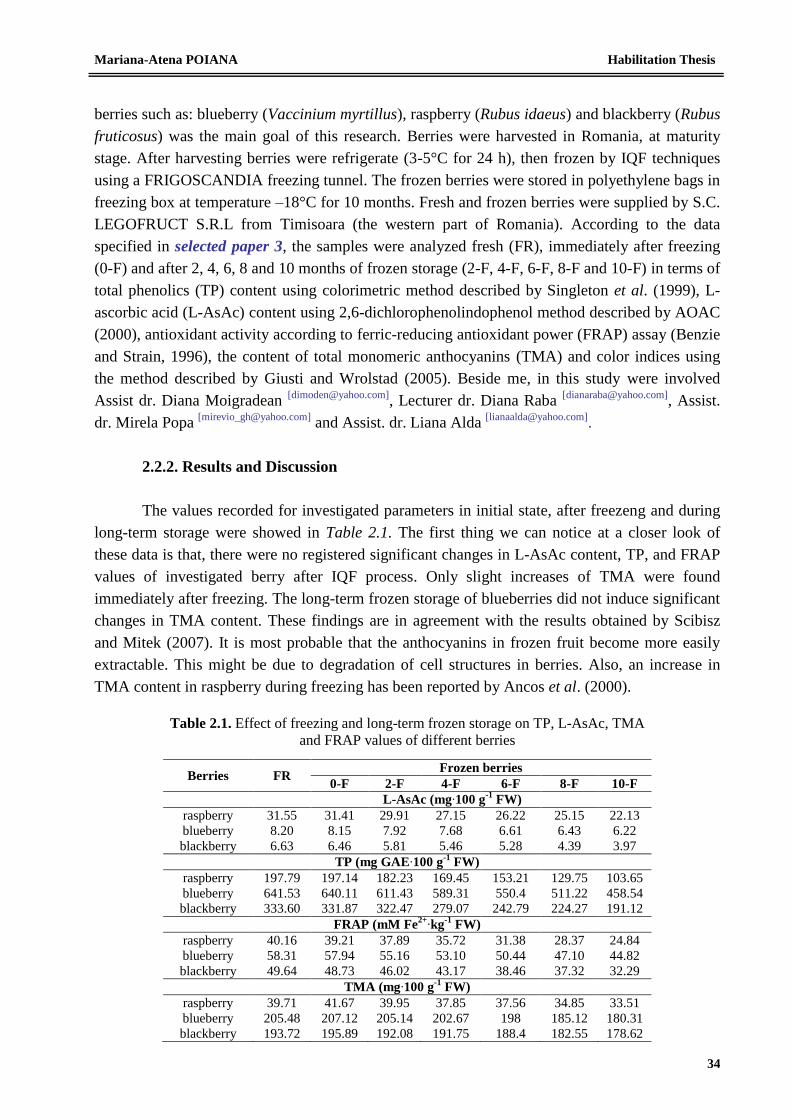
Mariana-Atena POIANA Habilitation Thesis
34
berries such as: blueberry (Vaccinium myrtillus), raspberry (Rubus idaeus) and blackberry (Rubus
fruticosus) was the main goal of this research. Berries were harvested in Romania, at maturity
stage. After harvesting berries were refrigerate (3-5°C for 24 h), then frozen by IQF techniques
using a FRIGOSCANDIA freezing tunnel. The frozen berries were stored in polyethylene bags in
freezing box at temperature –18°C for 10 months. Fresh and frozen berries were supplied by S.C.
LEGOFRUCT S.R.L from Timisoara (the western part of Romania). According to the data
specified in selected paper 3, the samples were analyzed fresh (FR), immediately after freezing
(0-F) and after 2, 4, 6, 8 and 10 months of frozen storage (2-F, 4-F, 6-F, 8-F and 10-F) in terms of
total phenolics (TP) content using colorimetric method described by Singleton et al. (1999), L-
ascorbic acid (L-AsAc) content using 2,6-dichlorophenolindophenol method described by AOAC
(2000), antioxidant activity according to ferric-reducing antioxidant power (FRAP) assay (Benzie
and Strain, 1996), the content of total monomeric anthocyanins (TMA) and color indices using
the method described by Giusti and Wrolstad (2005). Beside me, in this study were involved
Assist dr. Diana Moigradean [[email protected]]
, Lecturer dr. Diana Raba [[email protected]]
, Assist.
dr. Mirela Popa [[email protected]]
and Assist. dr. Liana Alda [[email protected]]
.
2.2.2. Results and Discussion
The values recorded for investigated parameters in initial state, after freezeng and during
long-term storage were showed in Table 2.1. The first thing we can notice at a closer look of
these data is that, there were no registered significant changes in L-AsAc content, TP, and FRAP
values of investigated berry after IQF process. Only slight increases of TMA were found
immediately after freezing. The long-term frozen storage of blueberries did not induce significant
changes in TMA content. These findings are in agreement with the results obtained by Scibisz
and Mitek (2007). It is most probable that the anthocyanins in frozen fruit become more easily
extractable. This might be due to degradation of cell structures in berries. Also, an increase in
TMA content in raspberry during freezing has been reported by Ancos et al. (2000).
Table 2.1. Effect of freezing and long-term frozen storage on TP, L-AsAc, TMA
and FRAP values of different berries
Berries FR Frozen berries
0-F 2-F 4-F 6-F 8-F 10-F
L-AsAc (mg∙100 g-1
FW)
raspberry 31.55 31.41 29.91 27.15 26.22 25.15 22.13
blueberry 8.20 8.15 7.92 7.68 6.61 6.43 6.22
blackberry 6.63 6.46 5.81 5.46 5.28 4.39 3.97
TP (mg GAE∙100 g-1
FW)
raspberry 197.79 197.14 182.23 169.45 153.21 129.75 103.65
blueberry 641.53 640.11 611.43 589.31 550.4 511.22 458.54
blackberry 333.60 331.87 322.47 279.07 242.79 224.27 191.12
FRAP (mM Fe2+
∙kg-1
FW)
raspberry 40.16 39.21 37.89 35.72 31.38 28.37 24.84
blueberry 58.31 57.94 55.16 53.10 50.44 47.10 44.82
blackberry 49.64 48.73 46.02 43.17 38.46 37.32 32.29
TMA (mg∙100 g-1
FW)
raspberry 39.71 41.67 39.95 37.85 37.56 34.85 33.51
blueberry 205.48 207.12 205.14 202.67 198 185.12 180.31
blackberry 193.72 195.89 192.08 191.75 188.4 182.55 178.62
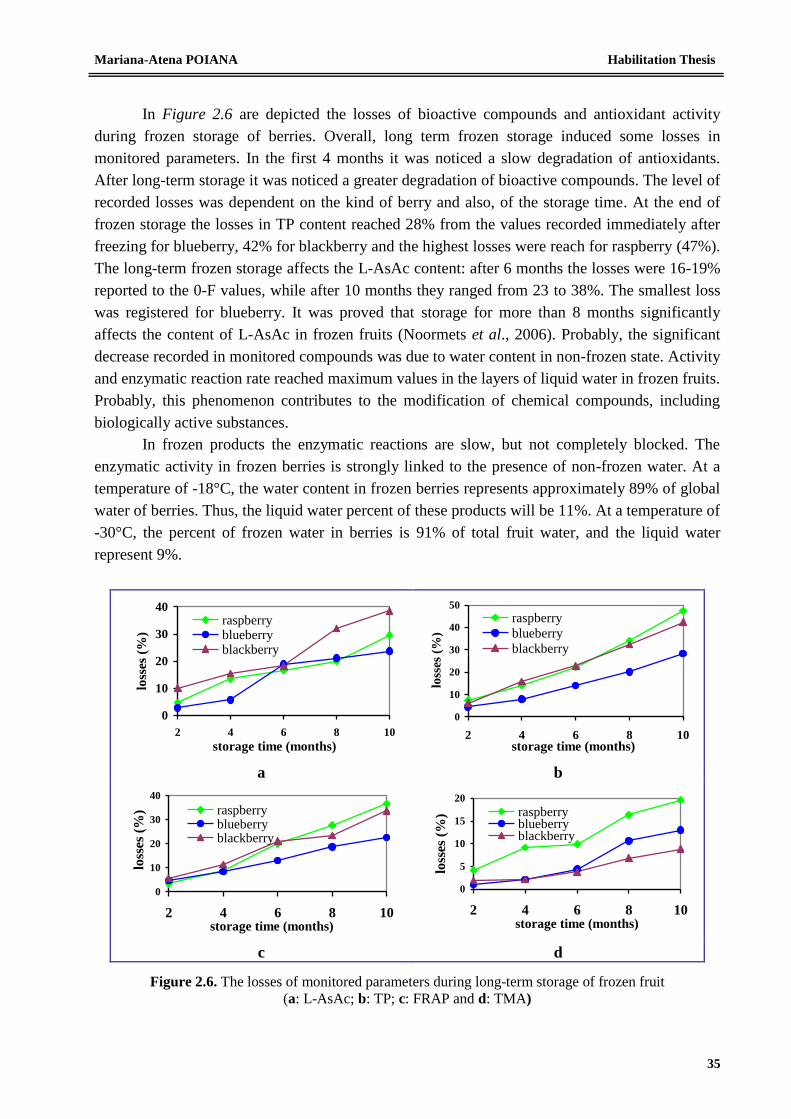
Mariana-Atena POIANA Habilitation Thesis
35
In Figure 2.6 are depicted the losses of bioactive compounds and antioxidant activity
during frozen storage of berries. Overall, long term frozen storage induced some losses in
monitored parameters. In the first 4 months it was noticed a slow degradation of antioxidants.
After long-term storage it was noticed a greater degradation of bioactive compounds. The level of
recorded losses was dependent on the kind of berry and also, of the storage time. At the end of
frozen storage the losses in TP content reached 28% from the values recorded immediately after
freezing for blueberry, 42% for blackberry and the highest losses were reach for raspberry (47%).
The long-term frozen storage affects the L-AsAc content: after 6 months the losses were 16-19%
reported to the 0-F values, while after 10 months they ranged from 23 to 38%. The smallest loss
was registered for blueberry. It was proved that storage for more than 8 months significantly
affects the content of L-AsAc in frozen fruits (Noormets et al., 2006). Probably, the significant
decrease recorded in monitored compounds was due to water content in non-frozen state. Activity
and enzymatic reaction rate reached maximum values in the layers of liquid water in frozen fruits.
Probably, this phenomenon contributes to the modification of chemical compounds, including
biologically active substances.
In frozen products the enzymatic reactions are slow, but not completely blocked. The
enzymatic activity in frozen berries is strongly linked to the presence of non-frozen water. At a
temperature of -18°C, the water content in frozen berries represents approximately 89% of global
water of berries. Thus, the liquid water percent of these products will be 11%. At a temperature of
-30°C, the percent of frozen water in berries is 91% of total fruit water, and the liquid water
represent 9%.
0
10
20
30
40
2 4 6 8 10
storage time (months)
loss
es (
%)
raspberryblueberryblackberry
0
10
20
30
40
50
2 4 6 8 10storage time (months)
loss
es (
%)
raspberry
blueberry
blackberry
a b
0
10
20
30
40
2 4 6 8 10storage time (months)
loss
es (
%) raspberry
blueberryblackberry
0
5
10
15
20
2 4 6 8 10storage time (months)
loss
es (
%) raspberry
blueberryblackberry
c d
Figure 2.6. The losses of monitored parameters during long-term storage of frozen fruit
(a: L-AsAc; b: TP; c: FRAP and d: TMA)
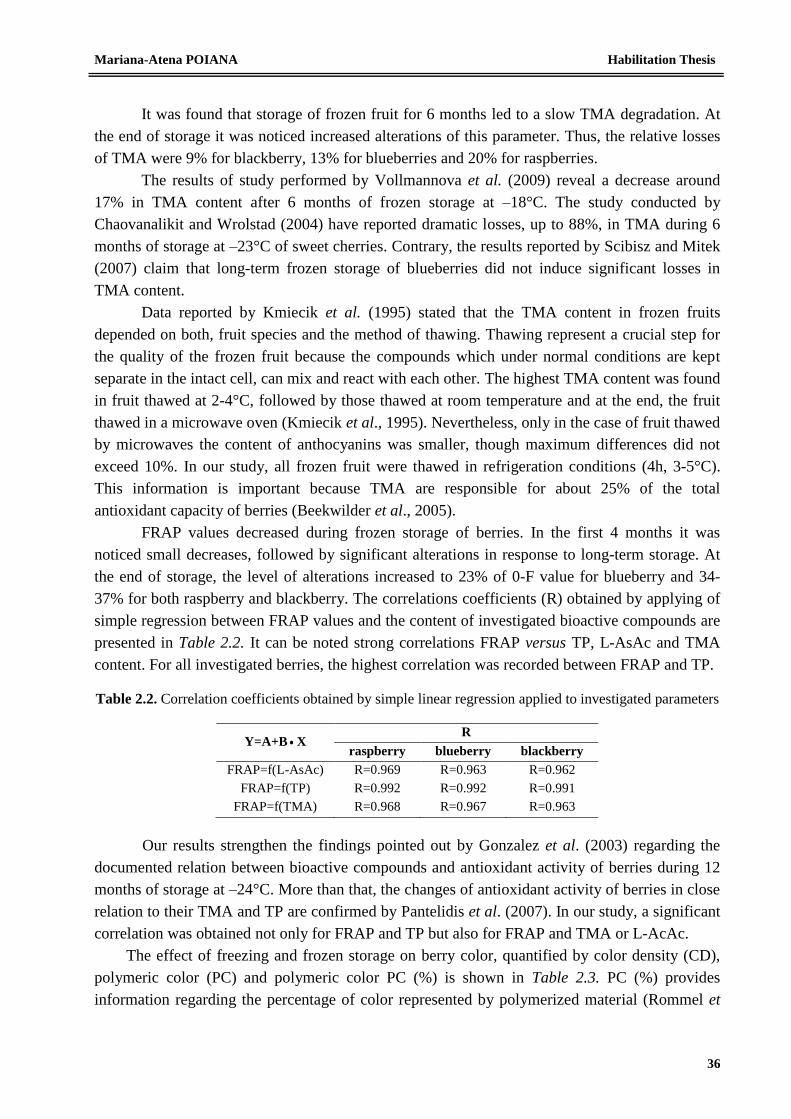
Mariana-Atena POIANA Habilitation Thesis
36
It was found that storage of frozen fruit for 6 months led to a slow TMA degradation. At
the end of storage it was noticed increased alterations of this parameter. Thus, the relative losses
of TMA were 9% for blackberry, 13% for blueberries and 20% for raspberries.
The results of study performed by Vollmannova et al. (2009) reveal a decrease around
17% in TMA content after 6 months of frozen storage at –18°C. The study conducted by
Chaovanalikit and Wrolstad (2004) have reported dramatic losses, up to 88%, in TMA during 6
months of storage at –23°C of sweet cherries. Contrary, the results reported by Scibisz and Mitek
(2007) claim that long-term frozen storage of blueberries did not induce significant losses in
TMA content.
Data reported by Kmiecik et al. (1995) stated that the TMA content in frozen fruits
depended on both, fruit species and the method of thawing. Thawing represent a crucial step for
the quality of the frozen fruit because the compounds which under normal conditions are kept
separate in the intact cell, can mix and react with each other. The highest TMA content was found
in fruit thawed at 2-4°C, followed by those thawed at room temperature and at the end, the fruit
thawed in a microwave oven (Kmiecik et al., 1995). Nevertheless, only in the case of fruit thawed
by microwaves the content of anthocyanins was smaller, though maximum differences did not
exceed 10%. In our study, all frozen fruit were thawed in refrigeration conditions (4h, 3-5°C).
This information is important because TMA are responsible for about 25% of the total
antioxidant capacity of berries (Beekwilder et al., 2005).
FRAP values decreased during frozen storage of berries. In the first 4 months it was
noticed small decreases, followed by significant alterations in response to long-term storage. At
the end of storage, the level of alterations increased to 23% of 0-F value for blueberry and 34-
37% for both raspberry and blackberry. The correlations coefficients (R) obtained by applying of
simple regression between FRAP values and the content of investigated bioactive compounds are
presented in Table 2.2. It can be noted strong correlations FRAP versus TP, L-AsAc and TMA
content. For all investigated berries, the highest correlation was recorded between FRAP and TP.
Table 2.2. Correlation coefficients obtained by simple linear regression applied to investigated parameters
Y=A+B X R
raspberry blueberry blackberry
FRAP=f(L-AsAc) R=0.969 R=0.963 R=0.962
FRAP=f(TP) R=0.992 R=0.992 R=0.991
FRAP=f(TMA) R=0.968 R=0.967 R=0.963
Our results strengthen the findings pointed out by Gonzalez et al. (2003) regarding the
documented relation between bioactive compounds and antioxidant activity of berries during 12
months of storage at –24°C. More than that, the changes of antioxidant activity of berries in close
relation to their TMA and TP are confirmed by Pantelidis et al. (2007). In our study, a significant
correlation was obtained not only for FRAP and TP but also for FRAP and TMA or L-AcAc.
The effect of freezing and frozen storage on berry color, quantified by color density (CD),
polymeric color (PC) and polymeric color PC (%) is shown in Table 2.3. PC (%) provides
information regarding the percentage of color represented by polymerized material (Rommel et
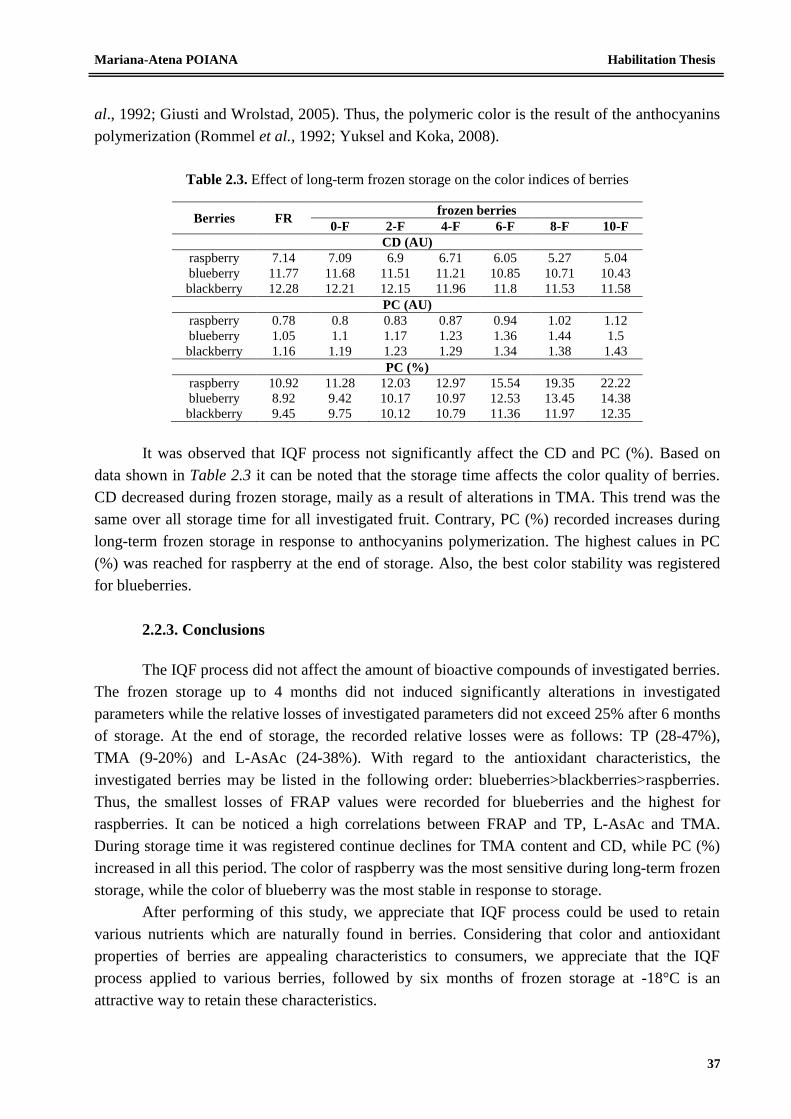
Mariana-Atena POIANA Habilitation Thesis
37
al., 1992; Giusti and Wrolstad, 2005). Thus, the polymeric color is the result of the anthocyanins
polymerization (Rommel et al., 1992; Yuksel and Koka, 2008).
Table 2.3. Effect of long-term frozen storage on the color indices of berries
Berries FR frozen berries
0-F 2-F 4-F 6-F 8-F 10-F
CD (AU)
raspberry 7.14 7.09 6.9 6.71 6.05 5.27 5.04
blueberry 11.77 11.68 11.51 11.21 10.85 10.71 10.43
blackberry 12.28 12.21 12.15 11.96 11.8 11.53 11.58
PC (AU)
raspberry 0.78 0.8 0.83 0.87 0.94 1.02 1.12
blueberry 1.05 1.1 1.17 1.23 1.36 1.44 1.5
blackberry 1.16 1.19 1.23 1.29 1.34 1.38 1.43
PC (%)
raspberry 10.92 11.28 12.03 12.97 15.54 19.35 22.22
blueberry 8.92 9.42 10.17 10.97 12.53 13.45 14.38
blackberry 9.45 9.75 10.12 10.79 11.36 11.97 12.35
It was observed that IQF process not significantly affect the CD and PC (%). Based on
data shown in Table 2.3 it can be noted that the storage time affects the color quality of berries.
CD decreased during frozen storage, maily as a result of alterations in TMA. This trend was the
same over all storage time for all investigated fruit. Contrary, PC (%) recorded increases during
long-term frozen storage in response to anthocyanins polymerization. The highest calues in PC
(%) was reached for raspberry at the end of storage. Also, the best color stability was registered
for blueberries.
2.2.3. Conclusions
The IQF process did not affect the amount of bioactive compounds of investigated berries.
The frozen storage up to 4 months did not induced significantly alterations in investigated
parameters while the relative losses of investigated parameters did not exceed 25% after 6 months
of storage. At the end of storage, the recorded relative losses were as follows: TP (28-47%),
TMA (9-20%) and L-AsAc (24-38%). With regard to the antioxidant characteristics, the
investigated berries may be listed in the following order: blueberries>blackberries>raspberries.
Thus, the smallest losses of FRAP values were recorded for blueberries and the highest for
raspberries. It can be noticed a high correlations between FRAP and TP, L-AsAc and TMA.
During storage time it was registered continue declines for TMA content and CD, while PC (%)
increased in all this period. The color of raspberry was the most sensitive during long-term frozen
storage, while the color of blueberry was the most stable in response to storage.
After performing of this study, we appreciate that IQF process could be used to retain
various nutrients which are naturally found in berries. Considering that color and antioxidant
properties of berries are appealing characteristics to consumers, we appreciate that the IQF
process applied to various berries, followed by six months of frozen storage at -18°C is an
attractive way to retain these characteristics.
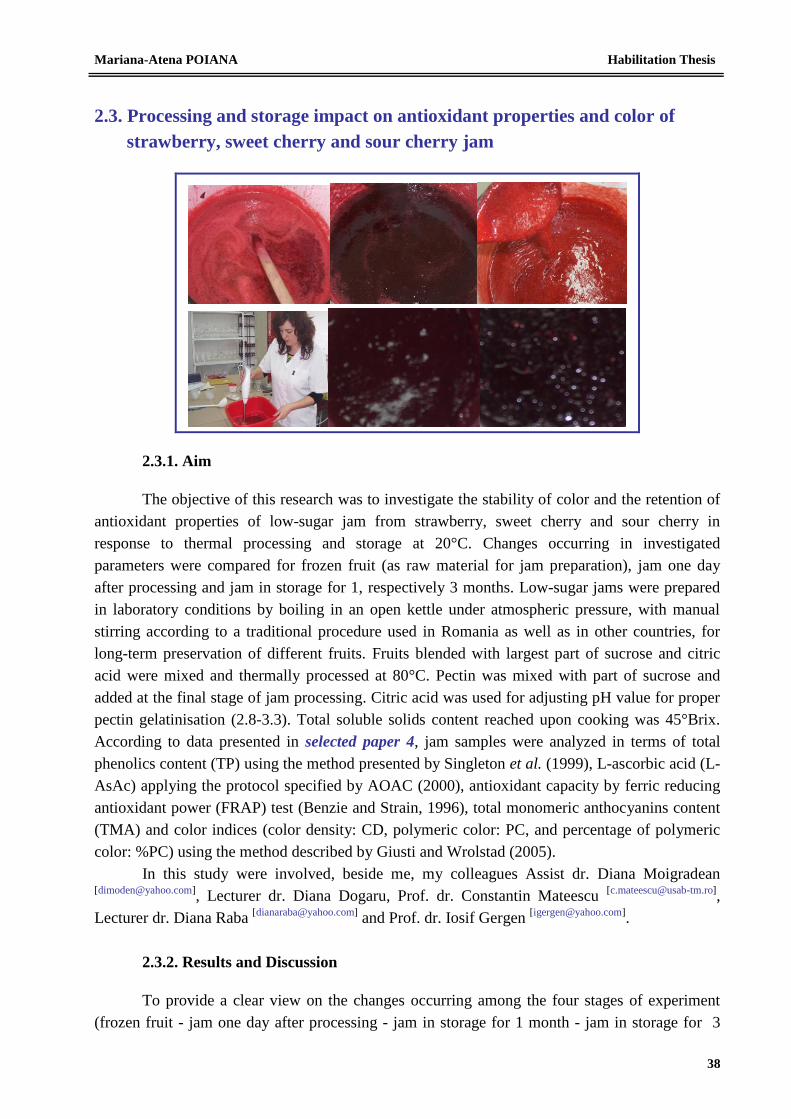
Mariana-Atena POIANA Habilitation Thesis
38
2.3. Processing and storage impact on antioxidant properties and color of
strawberry, sweet cherry and sour cherry jam
2.3.1. Aim
The objective of this research was to investigate the stability of color and the retention of
antioxidant properties of low-sugar jam from strawberry, sweet cherry and sour cherry in
response to thermal processing and storage at 20°C. Changes occurring in investigated
parameters were compared for frozen fruit (as raw material for jam preparation), jam one day
after processing and jam in storage for 1, respectively 3 months. Low-sugar jams were prepared
in laboratory conditions by boiling in an open kettle under atmospheric pressure, with manual
stirring according to a traditional procedure used in Romania as well as in other countries, for
long-term preservation of different fruits. Fruits blended with largest part of sucrose and citric
acid were mixed and thermally processed at 80°C. Pectin was mixed with part of sucrose and
added at the final stage of jam processing. Citric acid was used for adjusting pH value for proper
pectin gelatinisation (2.8-3.3). Total soluble solids content reached upon cooking was 45°Brix.
According to data presented in selected paper 4, jam samples were analyzed in terms of total
phenolics content (TP) using the method presented by Singleton et al. (1999), L-ascorbic acid (L-
AsAc) applying the protocol specified by AOAC (2000), antioxidant capacity by ferric reducing
antioxidant power (FRAP) test (Benzie and Strain, 1996), total monomeric anthocyanins content
(TMA) and color indices (color density: CD, polymeric color: PC, and percentage of polymeric
color: %PC) using the method described by Giusti and Wrolstad (2005).
In this study were involved, beside me, my colleagues Assist dr. Diana Moigradean [[email protected]]
, Lecturer dr. Diana Dogaru, Prof. dr. Constantin Mateescu [[email protected]]
,
Lecturer dr. Diana Raba [[email protected]]
and Prof. dr. Iosif Gergen [[email protected]]
.
2.3.2. Results and Discussion
To provide a clear view on the changes occurring among the four stages of experiment
(frozen fruit - jam one day after processing - jam in storage for 1 month - jam in storage for 3
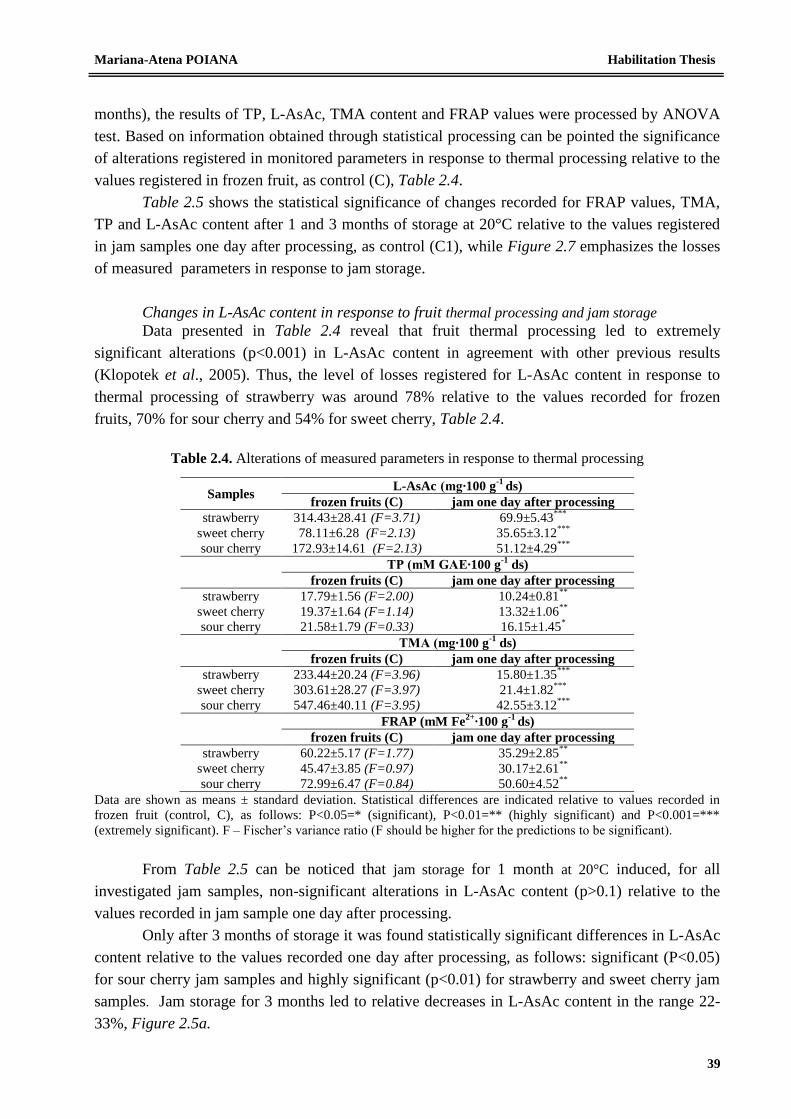
Mariana-Atena POIANA Habilitation Thesis
39
months), the results of TP, L-AsAc, TMA content and FRAP values were processed by ANOVA
test. Based on information obtained through statistical processing can be pointed the significance
of alterations registered in monitored parameters in response to thermal processing relative to the
values registered in frozen fruit, as control (C), Table 2.4.
Table 2.5 shows the statistical significance of changes recorded for FRAP values, TMA,
TP and L-AsAc content after 1 and 3 months of storage at 20°C relative to the values registered
in jam samples one day after processing, as control (C1), while Figure 2.7 emphasizes the losses
of measured parameters in response to jam storage.
Changes in L-AsAc content in response to fruit thermal processing and jam storage
Data presented in Table 2.4 reveal that fruit thermal processing led to extremely
significant alterations (p<0.001) in L-AsAc content in agreement with other previous results
(Klopotek et al., 2005). Thus, the level of losses registered for L-AsAc content in response to
thermal processing of strawberry was around 78% relative to the values recorded for frozen
fruits, 70% for sour cherry and 54% for sweet cherry, Table 2.4.
Table 2.4. Alterations of measured parameters in response to thermal processing
Samples L-AsAc (mg∙100 g
-1 ds)
frozen fruits (C) jam one day after processing
strawberry 314.43±28.41 (F=3.71) 69.9±5.43***
sweet cherry 78.11±6.28 (F=2.13) 35.65±3.12***
sour cherry 172.93±14.61 (F=2.13) 51.12±4.29***
TP (mM GAE∙100 g
-1 ds)
frozen fruits (C) jam one day after processing
strawberry 17.79±1.56 (F=2.00) 10.24±0.81**
sweet cherry 19.37±1.64 (F=1.14) 13.32±1.06**
sour cherry 21.58±1.79 (F=0.33) 16.15±1.45*
TMA (mg∙100 g
-1 ds)
frozen fruits (C) jam one day after processing
strawberry 233.44±20.24 (F=3.96) 15.80±1.35***
sweet cherry 303.61±28.27 (F=3.97) 21.4±1.82***
sour cherry 547.46±40.11 (F=3.95) 42.55±3.12***
FRAP (mM Fe
2+∙100 g
-1 ds)
frozen fruits (C) jam one day after processing
strawberry 60.22±5.17 (F=1.77) 35.29±2.85**
sweet cherry 45.47±3.85 (F=0.97) 30.17±2.61**
sour cherry 72.99±6.47 (F=0.84) 50.60±4.52**
Data are shown as means ± standard deviation. Statistical differences are indicated relative to values recorded in
frozen fruit (control, C), as follows: P<0.05=* (significant), P<0.01=** (highly significant) and P<0.001=***
(extremely significant). F – Fischer’s variance ratio (F should be higher for the predictions to be significant).
From Table 2.5 can be noticed that jam storage for 1 month at 20°C induced, for all
investigated jam samples, non-significant alterations in L-AsAc content (p>0.1) relative to the
values recorded in jam sample one day after processing.
Only after 3 months of storage it was found statistically significant differences in L-AsAc
content relative to the values recorded one day after processing, as follows: significant (P<0.05)
for sour cherry jam samples and highly significant (p<0.01) for strawberry and sweet cherry jam
samples. Jam storage for 3 months led to relative decreases in L-AsAc content in the range 22-
33%, Figure 2.5a.
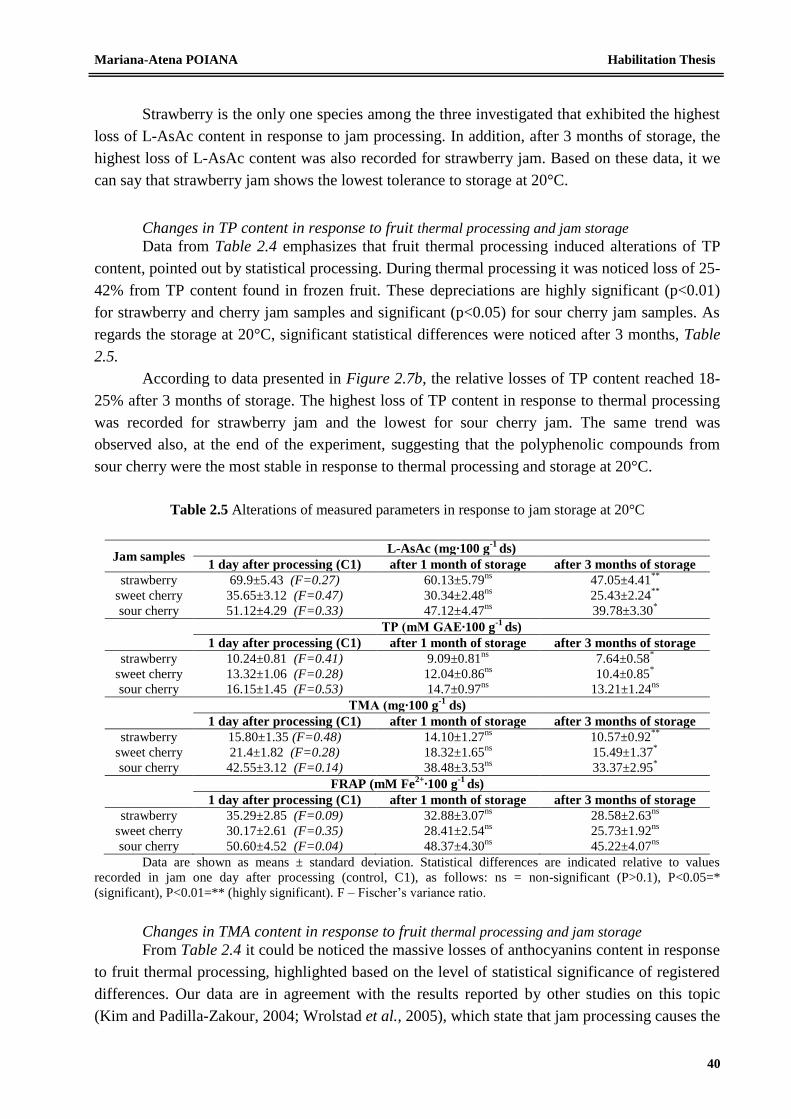
Mariana-Atena POIANA Habilitation Thesis
40
Strawberry is the only one species among the three investigated that exhibited the highest
loss of L-AsAc content in response to jam processing. In addition, after 3 months of storage, the
highest loss of L-AsAc content was also recorded for strawberry jam. Based on these data, it we
can say that strawberry jam shows the lowest tolerance to storage at 20°C.
Changes in TP content in response to fruit thermal processing and jam storage
Data from Table 2.4 emphasizes that fruit thermal processing induced alterations of TP
content, pointed out by statistical processing. During thermal processing it was noticed loss of 25-
42% from TP content found in frozen fruit. These depreciations are highly significant (p<0.01)
for strawberry and cherry jam samples and significant (p<0.05) for sour cherry jam samples. As
regards the storage at 20°C, significant statistical differences were noticed after 3 months, Table
2.5.
According to data presented in Figure 2.7b, the relative losses of TP content reached 18-
25% after 3 months of storage. The highest loss of TP content in response to thermal processing
was recorded for strawberry jam and the lowest for sour cherry jam. The same trend was
observed also, at the end of the experiment, suggesting that the polyphenolic compounds from
sour cherry were the most stable in response to thermal processing and storage at 20°C.
Table 2.5 Alterations of measured parameters in response to jam storage at 20°C
Jam samples L-AsAc (mg∙100 g
-1 ds)
1 day after processing (C1) after 1 month of storage after 3 months of storage
strawberry 69.9±5.43 (F=0.27) 60.13±5.79ns
47.05±4.41**
sweet cherry 35.65±3.12 (F=0.47) 30.34±2.48ns
25.43±2.24**
sour cherry 51.12±4.29 (F=0.33) 47.12±4.47ns
39.78±3.30*
TP (mM GAE∙100 g-1
ds)
1 day after processing (C1) after 1 month of storage after 3 months of storage
strawberry 10.24±0.81 (F=0.41) 9.09±0.81ns
7.64±0.58*
sweet cherry 13.32±1.06 (F=0.28) 12.04±0.86ns
10.4±0.85*
sour cherry 16.15±1.45 (F=0.53) 14.7±0.97ns
13.21±1.24ns
TMA (mg∙100 g-1
ds)
1 day after processing (C1) after 1 month of storage after 3 months of storage
strawberry 15.80±1.35 (F=0.48) 14.10±1.27ns
10.57±0.92**
sweet cherry 21.4±1.82 (F=0.28) 18.32±1.65ns
15.49±1.37*
sour cherry 42.55±3.12 (F=0.14) 38.48±3.53ns
33.37±2.95*
FRAP (mM Fe2+
∙100 g-1
ds)
1 day after processing (C1) after 1 month of storage after 3 months of storage
strawberry 35.29±2.85 (F=0.09) 32.88±3.07ns
28.58±2.63ns
sweet cherry 30.17±2.61 (F=0.35) 28.41±2.54ns
25.73±1.92ns
sour cherry 50.60±4.52 (F=0.04) 48.37±4.30ns
45.22±4.07ns
Data are shown as means ± standard deviation. Statistical differences are indicated relative to values
recorded in jam one day after processing (control, C1), as follows: ns = non-significant (P>0.1), P<0.05=*
(significant), P<0.01=** (highly significant). F – Fischer’s variance ratio.
Changes in TMA content in response to fruit thermal processing and jam storage
From Table 2.4 it could be noticed the massive losses of anthocyanins content in response
to fruit thermal processing, highlighted based on the level of statistical significance of registered
differences. Our data are in agreement with the results reported by other studies on this topic
(Kim and Padilla-Zakour, 2004; Wrolstad et al., 2005), which state that jam processing causes the
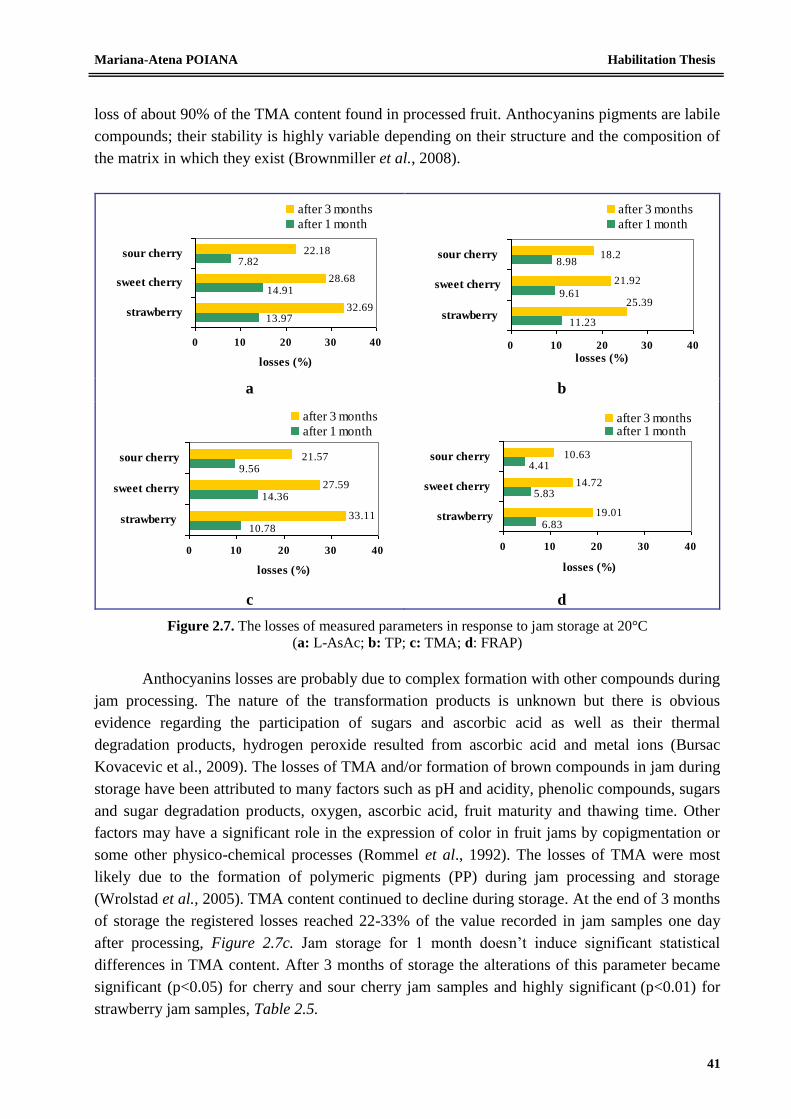
Mariana-Atena POIANA Habilitation Thesis
41
loss of about 90% of the TMA content found in processed fruit. Anthocyanins pigments are labile
compounds; their stability is highly variable depending on their structure and the composition of
the matrix in which they exist (Brownmiller et al., 2008).
32.69
28.68
13.97
14.91
7.8222.18
0 10 20 30 40
strawberry
sweet cherry
sour cherry
losses (%)
after 3 months
after 1 month
21.92
11.23
8.98
9.6125.39
18.2
0 10 20 30 40
strawberry
sweet cherry
sour cherry
losses (%)
after 3 months
after 1 month
a b
33.11
27.59
9.56
14.36
10.78
21.57
0 10 20 30 40
strawberry
sweet cherry
sour cherry
losses (%)
after 3 months
after 1 month
19.01
14.725.83
6.83
4.4110.63
0 10 20 30 40
strawberry
sweet cherry
sour cherry
losses (%)
after 3 monthsafter 1 month
c d
Figure 2.7. The losses of measured parameters in response to jam storage at 20°C
(a: L-AsAc; b: TP; c: TMA; d: FRAP)
Anthocyanins losses are probably due to complex formation with other compounds during
jam processing. The nature of the transformation products is unknown but there is obvious
evidence regarding the participation of sugars and ascorbic acid as well as their thermal
degradation products, hydrogen peroxide resulted from ascorbic acid and metal ions (Bursac
Kovacevic et al., 2009). The losses of TMA and/or formation of brown compounds in jam during
storage have been attributed to many factors such as pH and acidity, phenolic compounds, sugars
and sugar degradation products, oxygen, ascorbic acid, fruit maturity and thawing time. Other
factors may have a significant role in the expression of color in fruit jams by copigmentation or
some other physico-chemical processes (Rommel et al., 1992). The losses of TMA were most
likely due to the formation of polymeric pigments (PP) during jam processing and storage
(Wrolstad et al., 2005). TMA content continued to decline during storage. At the end of 3 months
of storage the registered losses reached 22-33% of the value recorded in jam samples one day
after processing, Figure 2.7c. Jam storage for 1 month doesn’t induce significant statistical
differences in TMA content. After 3 months of storage the alterations of this parameter became
significant (p<0.05) for cherry and sour cherry jam samples and highly significant (p<0.01) for
strawberry jam samples, Table 2.5.
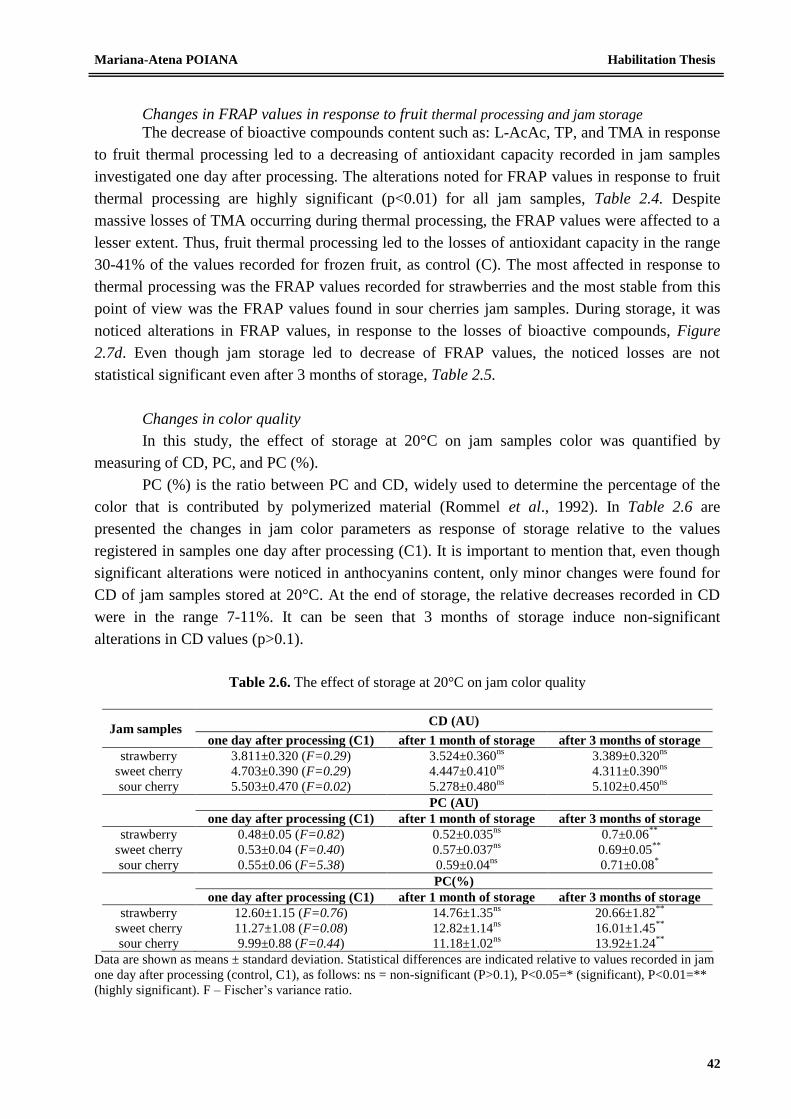
Mariana-Atena POIANA Habilitation Thesis
42
Changes in FRAP values in response to fruit thermal processing and jam storage
The decrease of bioactive compounds content such as: L-AcAc, TP, and TMA in response
to fruit thermal processing led to a decreasing of antioxidant capacity recorded in jam samples
investigated one day after processing. The alterations noted for FRAP values in response to fruit
thermal processing are highly significant (p<0.01) for all jam samples, Table 2.4. Despite
massive losses of TMA occurring during thermal processing, the FRAP values were affected to a
lesser extent. Thus, fruit thermal processing led to the losses of antioxidant capacity in the range
30-41% of the values recorded for frozen fruit, as control (C). The most affected in response to
thermal processing was the FRAP values recorded for strawberries and the most stable from this
point of view was the FRAP values found in sour cherries jam samples. During storage, it was
noticed alterations in FRAP values, in response to the losses of bioactive compounds, Figure
2.7d. Even though jam storage led to decrease of FRAP values, the noticed losses are not
statistical significant even after 3 months of storage, Table 2.5.
Changes in color quality
In this study, the effect of storage at 20°C on jam samples color was quantified by
measuring of CD, PC, and PC (%).
PC (%) is the ratio between PC and CD, widely used to determine the percentage of the
color that is contributed by polymerized material (Rommel et al., 1992). In Table 2.6 are
presented the changes in jam color parameters as response of storage relative to the values
registered in samples one day after processing (C1). It is important to mention that, even though
significant alterations were noticed in anthocyanins content, only minor changes were found for
CD of jam samples stored at 20°C. At the end of storage, the relative decreases recorded in CD
were in the range 7-11%. It can be seen that 3 months of storage induce non-significant
alterations in CD values (p>0.1).
Table 2.6. The effect of storage at 20°C on jam color quality
Jam samples CD (AU)
one day after processing (C1) after 1 month of storage after 3 months of storage
strawberry 3.811±0.320 (F=0.29) 3.524±0.360ns
3.389±0.320ns
sweet cherry 4.703±0.390 (F=0.29) 4.447±0.410ns
4.311±0.390ns
sour cherry 5.503±0.470 (F=0.02) 5.278±0.480ns
5.102±0.450ns
PC (AU)
one day after processing (C1) after 1 month of storage after 3 months of storage
strawberry 0.48±0.05 (F=0.82) 0.52±0.035ns
0.7±0.06**
sweet cherry 0.53±0.04 (F=0.40) 0.57±0.037ns
0.69±0.05**
sour cherry 0.55±0.06 (F=5.38) 0.59±0.04ns
0.71±0.08*
PC(%)
one day after processing (C1) after 1 month of storage after 3 months of storage
strawberry 12.60±1.15 (F=0.76) 14.76±1.35ns
20.66±1.82**
sweet cherry 11.27±1.08 (F=0.08) 12.82±1.14ns
16.01±1.45**
sour cherry 9.99±0.88 (F=0.44) 11.18±1.02ns
13.92±1.24**
Data are shown as means ± standard deviation. Statistical differences are indicated relative to values recorded in jam
one day after processing (control, C1), as follows: ns = non-significant (P>0.1), P<0.05=* (significant), P<0.01=**
(highly significant). F – Fischer’s variance ratio.
Mariana-Atena POIANA Habilitation Thesis
43
Progressive increases of PC (%) and the corresponding losses of TMA in response to
storage were most likely due to extensively polymerization phenomena (Wrolstad et al., 2000).
After 1 month of storage the relative increases in PC (%) were marked as non-significant (P>0.1),
while 3 months of storage led to highly significant increases (P<0.01), located in the range 39-
63%. The most relevant increases of PC (%) were obtained for strawberries jam. Thereby, no
significant differences were noticed for PC (%) of sweet and sour cherries jam samples. Even
though highly significant increases of PC (%) were noticed, there were not observed significant
alterations in CD. This fact proves the stability of jam color throughout 3 months of storage.
Although TP and L-AsAc are the major potential candidates as a selection criterion for
antioxidant properties of fruit jams, antioxidant activity is not limited just to them (Klopotek et
al., 2005; Bursac Kovacevic et al., 2009). Previous data reporded by Tsai et al. (2004) and
Brownmiller et al. (2008) pointed out that PP show antioxidant properties, which compensate for
the loss of a part of FRAP value assigned to TMA affected by storage. Also, it has been proven
that some degradation products of anthocyanins have antioxidant capacity (Tsai and Huang,
2004). The obtained data revealed that, after 3 months of storage at 20°C, the FRAP values of
fruit jam samples recorded lower depreciations than the content of investigated bioactive
compounds. This is confirmed by the results of statistical test, which prove that, at the end of 3
months of storage, the changes recorded in FRAP values were not statistically significant.
2.3.3. Conclusions
Thermal processing of fruits led to statistical significant alterations for all measured
parameters. The most important losses, reported to the values corresponding to frozen fruit, were
recorded for TMA (92-93%), L-AsAc (54-78%), FRAP values (30-41%) and TP (25-43%). Jam
storage induced additionally alterations of measured parameters. One month of jam storage at
20°C resulted in not statistically significant alterations, while three months of storage led to
significant and highly significant alterations. At the end of storage, it was noticed significant
increases in PC (%) in the range of 39-63% relative to the values recorded one day after
processing, while the alterations recorded for CD didn’t show any statistical significance. The
best retention of antioxidant properties and color was recorded for sour cherry jam.
Our data suggest that investigated low-sugar jams may still represent an excellent source
of compounds with antioxidant potential.
2.4. The effect of processing and storage on antioxidant properties and color of
low-sugar bilberry jam with different pectin concentrations
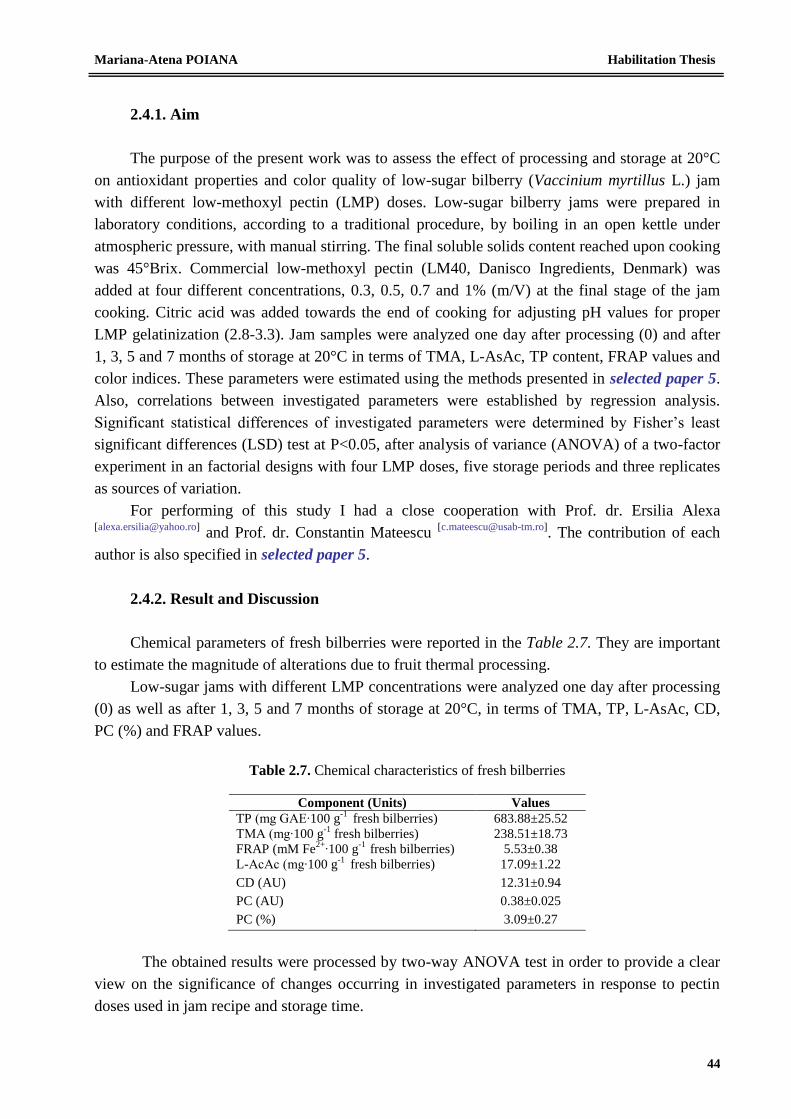
Mariana-Atena POIANA Habilitation Thesis
44
2.4.1. Aim
The purpose of the present work was to assess the effect of processing and storage at 20°C
on antioxidant properties and color quality of low-sugar bilberry (Vaccinium myrtillus L.) jam
with different low-methoxyl pectin (LMP) doses. Low-sugar bilberry jams were prepared in
laboratory conditions, according to a traditional procedure, by boiling in an open kettle under
atmospheric pressure, with manual stirring. The final soluble solids content reached upon cooking
was 45°Brix. Commercial low-methoxyl pectin (LM40, Danisco Ingredients, Denmark) was
added at four different concentrations, 0.3, 0.5, 0.7 and 1% (m/V) at the final stage of the jam
cooking. Citric acid was added towards the end of cooking for adjusting pH values for proper
LMP gelatinization (2.8-3.3). Jam samples were analyzed one day after processing (0) and after
1, 3, 5 and 7 months of storage at 20°C in terms of TMA, L-AsAc, TP content, FRAP values and
color indices. These parameters were estimated using the methods presented in selected paper 5.
Also, correlations between investigated parameters were established by regression analysis.
Significant statistical differences of investigated parameters were determined by Fisher’s least
significant differences (LSD) test at P<0.05, after analysis of variance (ANOVA) of a two-factor
experiment in an factorial designs with four LMP doses, five storage periods and three replicates
as sources of variation.
For performing of this study I had a close cooperation with Prof. dr. Ersilia Alexa [[email protected]]
and Prof. dr. Constantin Mateescu [[email protected]]
. The contribution of each
author is also specified in selected paper 5.
2.4.2. Result and Discussion
Chemical parameters of fresh bilberries were reported in the Table 2.7. They are important
to estimate the magnitude of alterations due to fruit thermal processing.
Low-sugar jams with different LMP concentrations were analyzed one day after processing
(0) as well as after 1, 3, 5 and 7 months of storage at 20°C, in terms of TMA, TP, L-AsAc, CD,
PC (%) and FRAP values.
Table 2.7. Chemical characteristics of fresh bilberries
Component (Units) Values
TP (mg GAE∙100 g-1
fresh bilberries) 683.88±25.52
TMA (mg∙100 g-1
fresh bilberries) 238.51±18.73
FRAP (mM Fe2+
∙100 g-1
fresh bilberries) 5.53±0.38
L-AcAc (mg∙100 g-1
fresh bilberries) 17.09±1.22
CD (AU) 12.31±0.94
PC (AU) 0.38±0.025
PC (%) 3.09±0.27
The obtained results were processed by two-way ANOVA test in order to provide a clear
view on the significance of changes occurring in investigated parameters in response to pectin
doses used in jam recipe and storage time.
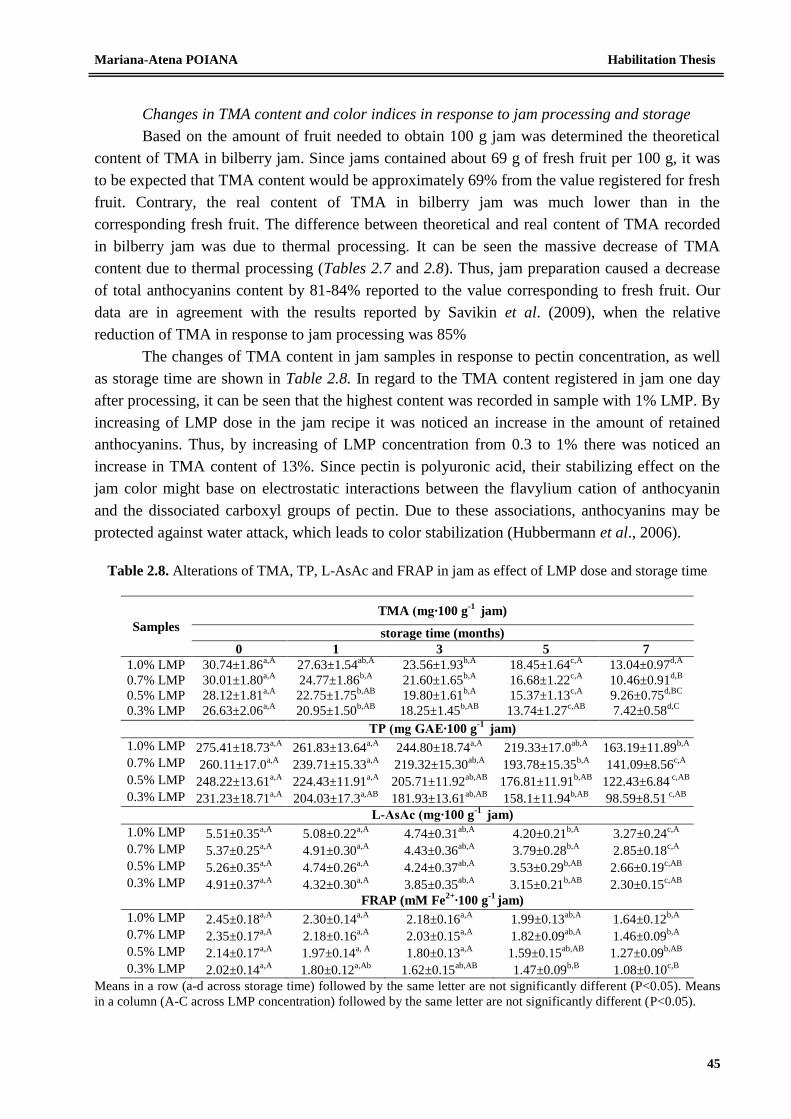
Mariana-Atena POIANA Habilitation Thesis
45
Changes in TMA content and color indices in response to jam processing and storage
Based on the amount of fruit needed to obtain 100 g jam was determined the theoretical
content of TMA in bilberry jam. Since jams contained about 69 g of fresh fruit per 100 g, it was
to be expected that TMA content would be approximately 69% from the value registered for fresh
fruit. Contrary, the real content of TMA in bilberry jam was much lower than in the
corresponding fresh fruit. The difference between theoretical and real content of TMA recorded
in bilberry jam was due to thermal processing. It can be seen the massive decrease of TMA
content due to thermal processing (Tables 2.7 and 2.8). Thus, jam preparation caused a decrease
of total anthocyanins content by 81-84% reported to the value corresponding to fresh fruit. Our
data are in agreement with the results reported by Savikin et al. (2009), when the relative
reduction of TMA in response to jam processing was 85%
The changes of TMA content in jam samples in response to pectin concentration, as well
as storage time are shown in Table 2.8. In regard to the TMA content registered in jam one day
after processing, it can be seen that the highest content was recorded in sample with 1% LMP. By
increasing of LMP dose in the jam recipe it was noticed an increase in the amount of retained
anthocyanins. Thus, by increasing of LMP concentration from 0.3 to 1% there was noticed an
increase in TMA content of 13%. Since pectin is polyuronic acid, their stabilizing effect on the
jam color might base on electrostatic interactions between the flavylium cation of anthocyanin
and the dissociated carboxyl groups of pectin. Due to these associations, anthocyanins may be
protected against water attack, which leads to color stabilization (Hubbermann et al., 2006).
Table 2.8. Alterations of TMA, TP, L-AsAc and FRAP in jam as effect of LMP dose and storage time
Samples
TMA (mg∙100 g-1
jam)
storage time (months)
0 1 3 5 7
1.0% LMP 30.74±1.86a,A
27.63±1.54ab,A
23.56±1.93b,A
18.45±1.64c,A
13.04±0.97d,A
0.7% LMP 30.01±1.80a,A
24.77±1.86b,A
21.60±1.65b,A
16.68±1.22c,A
10.46±0.91d,B
0.5% LMP 28.12±1.81a,A
22.75±1.75b,AB
19.80±1.61b,A
15.37±1.13c,A
9.26±0.75d,BC
0.3% LMP 26.63±2.06a,A
20.95±1.50b,AB
18.25±1.45b,AB
13.74±1.27c,AB
7.42±0.58d,C
TP (mg GAE∙100 g-1
jam)
1.0% LMP 275.41±18.73a,A
261.83±13.64a,A
244.80±18.74a,A
219.33±17.0ab,A
163.19±11.89b,A
0.7% LMP 260.11±17.0a,A
239.71±15.33a,A
219.32±15.30ab,A
193.78±15.35b,A
141.09±8.56c,A
0.5% LMP 248.22±13.61a,A
224.43±11.91a,A
205.71±11.92ab,AB
176.81±11.91b,AB
122.43±6.84 c,AB
0.3% LMP 231.23±18.71a,A
204.03±17.3a,AB
181.93±13.61ab,AB
158.1±11.94b,AB
98.59±8.51 c,AB
L-AsAc (mg∙100 g-1
jam)
1.0% LMP 5.51±0.35a,A
5.08±0.22a,A
4.74±0.31ab,A
4.20±0.21b,A
3.27±0.24c,A
0.7% LMP 5.37±0.25a,A
4.91±0.30a,A
4.43±0.36ab,A
3.79±0.28b,A
2.85±0.18c,A
0.5% LMP 5.26±0.35a,A
4.74±0.26a,A
4.24±0.37ab,A
3.53±0.29b,AB
2.66±0.19c,AB
0.3% LMP 4.91±0.37a,A
4.32±0.30a,A
3.85±0.35ab,A
3.15±0.21b,AB
2.30±0.15c,AB
FRAP (mM Fe2+
∙100 g-1
jam)
1.0% LMP 2.45±0.18a,A
2.30±0.14a,A
2.18±0.16a,A
1.99±0.13ab,A
1.64±0.12b,A
0.7% LMP 2.35±0.17a,A
2.18±0.16a,A
2.03±0.15a,A
1.82±0.09ab,A
1.46±0.09b,A
0.5% LMP 2.14±0.17a,A
1.97±0.14a, A
1.80±0.13a,A
1.59±0.15ab,AB
1.27±0.09b,AB
0.3% LMP 2.02±0.14a,A
1.80±0.12a,Ab
1.62±0.15ab,AB
1.47±0.09b,B
1.08±0.10c,B
Means in a row (a-d across storage time) followed by the same letter are not significantly different (P<0.05). Means
in a column (A-C across LMP concentration) followed by the same letter are not significantly different (P<0.05).
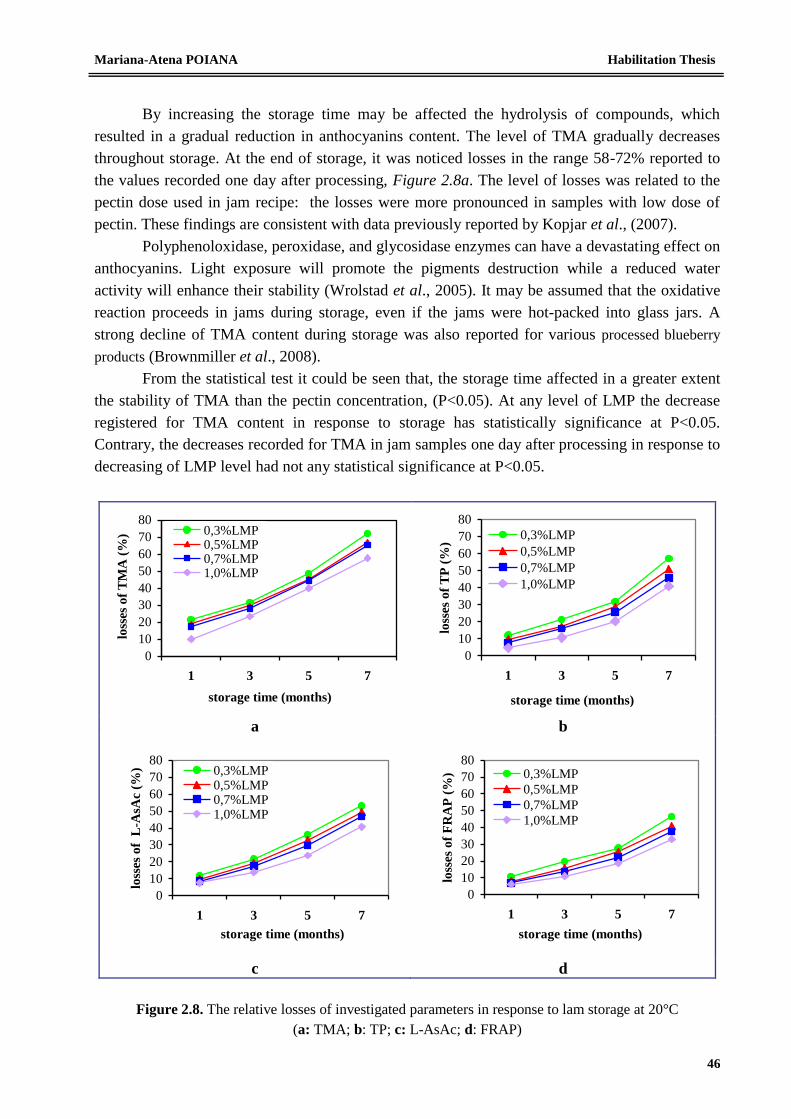
Mariana-Atena POIANA Habilitation Thesis
46
By increasing the storage time may be affected the hydrolysis of compounds, which
resulted in a gradual reduction in anthocyanins content. The level of TMA gradually decreases
throughout storage. At the end of storage, it was noticed losses in the range 58-72% reported to
the values recorded one day after processing, Figure 2.8a. The level of losses was related to the
pectin dose used in jam recipe: the losses were more pronounced in samples with low dose of
pectin. These findings are consistent with data previously reported by Kopjar et al., (2007).
Polyphenoloxidase, peroxidase, and glycosidase enzymes can have a devastating effect on
anthocyanins. Light exposure will promote the pigments destruction while a reduced water
activity will enhance their stability (Wrolstad et al., 2005). It may be assumed that the oxidative
reaction proceeds in jams during storage, even if the jams were hot-packed into glass jars. A
strong decline of TMA content during storage was also reported for various processed blueberry
products (Brownmiller et al., 2008).
From the statistical test it could be seen that, the storage time affected in a greater extent
the stability of TMA than the pectin concentration, (P<0.05). At any level of LMP the decrease
registered for TMA content in response to storage has statistically significance at P<0.05.
Contrary, the decreases recorded for TMA in jam samples one day after processing in response to
decreasing of LMP level had not any statistical significance at P<0.05.
0
10
20
30
40
50
60
70
80
1 3 5 7
storage time (months)
loss
es o
f T
MA
(%
) 0,3%LMP0,5%LMP0,7%LMP1,0%LMP
0
10
20
30
40
50
60
70
80
1 3 5 7
storage time (months)
loss
es o
f T
P (
%)
0,3%LMP
0,5%LMP
0,7%LMP
1,0%LMP
a b
0
10
20
30
40
50
60
70
80
1 3 5 7
storage time (months)
loss
es o
f L
-AsA
c (%
) 0,3%LMP0,5%LMP0,7%LMP1,0%LMP
0
10
20
30
40
50
60
70
80
1 3 5 7
storage time (months)
loss
es o
f F
RA
P (
%) 0,3%LMP
0,5%LMP
0,7%LMP
1,0%LMP
c d
Figure 2.8. The relative losses of investigated parameters in response to lam storage at 20°C
(a: TMA; b: TP; c: L-AsAc; d: FRAP)
Mariana-Atena POIANA Habilitation Thesis
47
The effect of processing, LMP concentration and storage for 7 months at 20°C on bilberry
jam color was quantified by measuring the following color indices: CD, PC and PC (%).
The changes recorded in color parameters in response to LMP concentration and storage
time were presented in Table 2.9. It can be noticed that PC (%) increased in response to jam
processing depending on LMP level. The increases recorded for PC (%) were consistent with
losses of TMA content registered in result of processing. In addition to the formation of PP, the
losses of TMA occurring in response to processing may be associated with enzymatic and
thermal degradation (Brownmiller et al., 2008; Yuksel and Koka, 2008). Exposure of berries to
elevated temperatures during jam processing and pasteurization most likely contributed to TMA
losses, because the anthocyanins degradation is time and temperature dependent (Rommel et al.,
1992; Brownmiller et al., 2008). It has been demonstrated that the level of polymeric pigments
increases with storage time, this fact having a great impact on color stability in juices and red
wines (Wrolstad et al., 2005).
It was noted that the rate of loss recorded for CD is much slower than the rate of TMA
degradation. For major losses of TMA only minor changes were found for CD, proving the
stability of the jam color during long-term storage. This fact proves the stability of PP formed in
response to storage. These compounds are a source of “stable color” (Wrolstad et al., 2005;
Yuksel and Koka, 2008), they compensated for the loss of color due to the significant degradation
of TMA during jam storage.
Pectin acts differently on the variety of anthocyanins from berries. In some cases, pectin
acts as a copigment, thus increasing the color (Lewis et al., 1995; Kopjar et al., 2009). Thus, the
effect of pectin level on jam color is still not accurately known.
Table 2.9. Changes of jam color as effect of LMP concentration and storage time
Samples
storage time (months)
0 1 3 5 7
CD (AU)
1.0% LMP 11.82±0.88a,A
11.64±0.62a,A
11.21±0.77a,A
10.53±0.86a,A
10.07±0.77a,A
0.7% LMP 11.68±0.83a,A
11.28±0.78a,A
10.92±0.80a,A
10.24±0.78a,A
9.81±0.78a,A
0.5% LMP 11.47±0.64a,A
11.03±0.68a,A
10.37±0.62a,A
9.95±0.70a,A
9.55±0.82a,A
0.3% LMP 11.25±0.81a,A
10.51±0.86a,A
10.08±0.83a,A
9.52±0.65a,A
9.31±0.73a,A
Samples PC (AU)
1.0% LMP 1.18±0.09a,A
1.27±0.10a,A
1.46±0.12a,A
1.79±0.15b,A
2.23±0.17c,A
0.7% LMP 1.25±0.10a,A
1.36±0.12a,A
1.57±0.11a,A
2.14±0.16b,A
2.38±0.15c,A
0.5% LMP 1.37±0.11a,A
1.51±0.12a,A
1.73±0.14a,A
2.37±0.16b,AB
2.71±0.18c,AB
0.3% LMP 1.55±0.13a,B
1.73±0.14a,B
1.97±0.12a,B
2.71±0.20b,B
3.12±0.24c,B
Samples PC (%)
1.0% LMP 9.98±0.65a,A
10.91±0.65a,A
13.02±0.71b,A
17.00±0.78c,A
22.14±1.21d,A
0.7% LMP 10.70±0.85a,A
12.07±0.72a,A
14.38±0.64b,A
20.90±1.15c,B
24.26±1.12d,A
0.5% LMP 11.94±0.87a,A
13.69±0.70a,B
16.68±0.78b,B
23.82±0.98c,C
28.38±1.33d,B
0.3% LMP 13.78±1.11a,B
16.46±0.86a,C
19.54±0.93b,C
28.47±1.44c,D
33.51±1.77d,C
Means in a row (a-d across storage time) followed by the same letter are not significantly different (P<0.05). Means
in a column (A-D across LMP concentration) followed by the same letter are not significantly different (P<0.05).
The decrease of LMP concentration from 1 to 0.3% resulted in increase of PC (%) in
samples analysed one day after processing. For jam samples obtained with the same dose of
pectin, PC (%) progressively increased during storage. At the end of storage, the highest values
Mariana-Atena POIANA Habilitation Thesis
48
of PC (%) were obtained for jam samples with the lowest LMP doses. During storage it was
noted a tendency towards slowing of increase in PC (%) values by increasing of LMP dose in the
jam recipe. This fact could be due to associantions formed as a result of interactions between the
flavilium cation of anthocyanins and the dissociated carboxilic grups of pectin. Due to this
stabilising effect, anthocyanins may be protected of condensation reactions occurring among
anthocyanins and procyanidins. The crosslinks formed between anthocyanins and procyanidins
are no more stable than those existing between anthocyanins and pectin.
From the results of statistical test it may be noted that the LMP dose did not exert a major
impact on PC (%) recorded immediately after jam processing, but its effect has become
statistically significant by increasing of storage time (P<0.05). CD decreased as effect of fruit
thermal processing. It can be observed that CD undergoes minor changes by increasing the LMP
dose from 0.3 to 1%. CD registered slight decreases in the storage time. The results of statistical
processing pointed out that, the LMP level and storage time induced non-significant changes in
CD (Table 2.9), proving that this parameter was not stable only in response to processing but
were also stable during long-term storage.
Changes in TP content in response to jam processing and storage
By analysis of data reported in Tables 2.7 and 2.8, regarding the content of TP, it can be
noted that thermal processing of wild bilberries led to major alterations of TP content located in
the range 42-51% reported to the value corresponding to fresh fruit. Previous studies on this topic
reported significant losses in TP content in response to thermal processing of various berries
(Schmidt et al., 2005; Savikin et al., 2009; Howard et al., 2010). The largest loss in TP content in
response to fruit thermal processing was noted in jam sample with 0.3% pectin, and the highest in
jam with 1% pectin.
In addition to the losses occurring as a result of thermal processing, the storage for 7
months at 20°C induced significant alterations of TP registered in jam samples (P<0.05). At the
end of storage the losses of TP reached 41-47% of the values recorded one day after jam
processing, Figure 2.8b. Our data suggest that, the polyphenolic compounds had a better stability
in jam samples with high doses of LMP than in those obtained with low pectin doses.
Changes in L-AsAc content in response to jam processing and storage
At a closer look of data shown in Tables 2.7 and 2.8 related to the content of L-AsAc
could be observed that fruit thermal processing induced significant alterations of this parameter,
located in the range 53-58% reported to the value corresponding to fresh fruit. The highest degree
of L-AsAc alteration in response to fruit thermal processing was noted in jam sample with the
lowest dose of pectin. Contrary, the highest level of pectin provided the best protection of L-
AsAc content in response to jam processing.
Storage at room temperature also influenced the amount of L-AsAc and the effect was
more expressed in jam with 0.3% LMP than in jams with 0.7-1% LMP. It was found that 7
months of storage resulted in significant alterations (p<0.05) in L-AsAc content. At the end of
storage period, the recorded losses reached 41-53% reported to the values recorded one day after
Mariana-Atena POIANA Habilitation Thesis
49
processing, Figure 2.8c. L-AsAc was more stable in jam samples with high LMP doses in
response of both processing and long-term storage at 20°C.
Changes in FRAP value in response to jam processing and storage
Data from Tables 2.7 and 2.8 related to FRAP values show that 36-47% of the antioxidant
capacity corresponding to fresh fruit was lost during jam processing. Our data are consistent with
the results reported by Schmidt et al. (2005), Savikin et al. (2009), Howard et al. (2010). The
alterations noted in FRAP values can be attributed to the decrease in the content of TMA, TP, L-
AsAc, as well as other bioactive compounds in response to thermal treatment. The thermal
treatment has the lowest negative impact on FRAP value recorded in jam sample with the highest
concentration of pectin. The FRAP values declined by decreasing the LMP dose in jam
formulation, Table 2.8. In terms of storage impact on FRAP values, it was found that the increase
of storage time resulted in depreciations of antioxidant activity of jam samples, depending on
LMP concentration. The losses noted in FRAP values at the end of storage period were located in
the range 33-46% reported to the value recorded one day after processing, Figure 2.8d. The
results of statisitical processing highlighted that, after 7 months of storage at 20°C, the alterations
of FRAP values were statistically significant (p<0.05) for all LMP levels. Also, the alterations of
this parameter have increased by decreasing of pectin dose in the jam recipe as well as by
extending of storage time.
Correlations among investigated parameters
A high positive correlation “FRAP values versus TP content” it was noted during storage
(R>0.99), Table 2.10. In addition, FRAP was highly correlated with TMA content (R>0.98) and
L-AsAc content (R>0.99). Also, a positive correlation “TP versus TMA content” (R>0.97) was
observed, which confirm once again that the anthocyanins are the most important phenolic
compounds present in bilberry (Moyer et al., 2002). A significant negative correlation was found
between TMA and PC (%), which means that, more polymeric pigments will be accumulated in
jam samples in response to TMA degradation. Also, our results indicate that FRAP and PC (%)
were negatively correlated (R>0.96). In jam obtained from various berries, wherein phenolic
compounds and, more specifically, anthocyanins, have a major contribution to the total
antioxidant activity, simple colorimetric tests such as Folin-Ciocalteu test (Singleton et al., 1999)
for phenolics measurement or the protocol described by Giusti and Wrolstad for TMA
determination (2005) can be very useful to estimate the changes in antioxidant activity occurring
during jam storage.
Table 2.10. Correlation coefficients obtained by simple regression applied to investigated parameters
Y=A+B·X R
1% LMP 0.7% LMP 0.5% LMP 0.3% LMP
FRAP=f(TP) 0.996 0.999 0.999 0.998
FRAP=f(TMA) 0.989 0.994 0.995 0.995
FRAP=f(L-AsAc) 1.00 0.999 0.999 0.994
TP=f(TMA) 0.977 0.989 0.997 0.990
TMA=f(%PC) -0.985 -0,973 -0,974 -0,974
FRAP= f(%PC) -0,992 -0,976 -0,985 -0,966
Mariana-Atena POIANA Habilitation Thesis
50
Prior et al. (1998) noted that phytochemicals responsible for the antioxidant activity in
berries are most likely to be phenolic acids, anthocyanins, and other flavonoid compounds.
TP and L-AsAc have a major contribution to the antioxidant characteristics of bilberry
jams but in the expression of antioxidant activity are involved also, other compounds (Klopotek
et al., 2005; Bursac Kovacevic et al., 2009). Previous results reported by Tsai et al. (2004) and
Brownmiller et al. (2008) proved that PP display antioxidant activity, which compensates for the
loss of a part of antioxidant activity as a result of monomeric anthocyanins degradation. Also, it
has been proven that some degradation products of anthocyanins have the antioxidant properties
(Tsai and Huang, 2004). After 7 months of storage it was noticed lower depreciation in FRAP
values than the content of investigated bioactive compounds. This is confirmed by the results of
ANOVA test. More studies are required for assessing the contribution of polymeric pigments to
the antioxidant activity of bilberry jam during storage.
2.4.3. Conclusions
Based on aforementioned results, it can be concluded that thermal processing of wild
bilberries into low-sugar jams resulted in significant losses of investigated parameters, reported to
the values corresponding to fresh fruit, as follows: TMA: (81-84%), L-AsAc: (53-58%, TP: 42-
51% and FRAP values: 36-47%. Moreover, jam storage at 20°C induced additional alterations of
investigated compounds. Thus, jam storage for 7 months resulted in severe relative losses, as
follows: TMA: 58-72%; L-AsAc: 40-53%: TP: 41-57% and FRAP: 33-46%. LMP dose used in
jam recipe affected the antioxidant properties as well as the color stability of bilberry jams. By
increasing of LMP dose from 0.3 to 1% it was recorded an increase in retained bioactive
compounds and FRAP values. Also, the increases in PC (%) during storage were higher in jam
samples processed with low pectin level. The increases recorded for PC (%) were consistent with
losses of TMA content registered in result of processing. Our data suggest that, both antioxidant
properties as well as the color had a better stability in jam samples with high doses of LMP than
in those obtained with low pectin doses. Overall, the obtained results indicated that the bilberry
jams are still excellent sources of nutritional substances with antioxidant potential, although
compared to the fresh fruit, important losses seem to occur.
2.5. The impact of pectin type and dose on color quality and antioxidant
properties of blackberry jam
Mariana-Atena POIANA Habilitation Thesis
51
2.5.1. Aim
In the last years pectin and other hydrocolloids were tested for improving the color
stability and the retention of bioactive compounds in gelled fruit products. In line with these
concerns, the study shown in selected paper 6 has been directed to quantify the changes in
antioxidant status and color indices of blackberry jam obtained with various types of pectin
(degree of esterification: DE; degree of amidation: DA) and doses in response to processing and
storage for 1, 3 and 6 months at 20°C. Blackberry jam was obtained by a traditional procedure
used in households or small-scale systems with various types of commercial pectins (HMP: high-
methoxyl pectin, LMP: low-methoxyl pectin and LMAP: low-methoxyl amidated pectin) added
to three concentrations (0.3, 0.7 and 1.0%). The pectins were separately added under continuous
stirring at the final stage of the jam cooking. The pH of mixture was adjusted with citric acid to
2.90±0.05 (for jams with HMP) and 3.3±0.05 (for jams with LMAP and LMP). Additionally,
calcium chloride dihydrate was added in jam formulations with LMP and LMAP. The calcium
ions dose/g pectin was established according to manufacturer's recommendations depending on
the pectin type. Jam samples were investigated, according to the protocols specified in selected
paper 6, in terms of TMA, FRAP values, TP, CD and PC (%).
In performing of this research I worked closely together with Lecturer dr. Melania-Florina
Munteanu [[email protected]]
, Lecturer dr. Despina-Maria Bordean [[email protected]]
,
Lecturer dr. Ramona Gligor [[email protected]]
and Prof. dr. Ersilia Alexa [[email protected]]
. The
contribution of each author is shown in selected paper 6.
2.5.2. Results and Discussion
Blackberry jam obtained with various types of pectin (DE, DA) applied at three levels were
analyzed one day post-processing (0) and after 1, 3 and 6 months of storage at 20°C in terms of
TMA, CD, PC (%), TP and FRAP values. In Table 2.11 are shown the main chemical parameters
of fresh fruit used for jam preparation. The content of TMA, TP and FRAP values recorded in
jam after processing were assimilated with the real values of these parameters.
Table 2.11. Chemical characteristics of fresh blackberries
Component (Units) Values
TP (mg GAE∙100 g-1
FW) 521.8±12.8
TMA (mg∙100 g-1
FW) 190.1±8.1
FRAP (mM Fe2+
∙100 g-1
FW) 4.4±0.3
TSS (°Brix) 14.0±0.6
CD (AU) 9.9±0.7
PC (%) 6.0±0.4
Data resulted from mass balance performed to jam processing revealed that about 68 g fresh
fruit were needed to obtain 100 g jam with 45°Bx. This information is useful to evaluate the
theoretical content of investigated compounds in obtained jams. We assumed that the differences
between theoretical and real content of investigated parameters were caused by fruit thermal
treatment. The obtained results were processed by one-way ANOVA test to highlight the
Mariana-Atena POIANA Habilitation Thesis
52
significance of changes occuring in assessed parameters in response to storage, reported to the
values recorded one day post-processing (as control, C), Also, to represent the variation of the
studied parameters during storage we have used star charts which plot the values of each category
along a separate axis that starts in the center of the chart and ends on the outer ring. Star charts
are a useful way to display multivariate observations with an arbitrary number of variables
(Chambers et al., 1983). Neighbor-Joining Cluster analysis was performed by using Past
Software Packages (Hammer et al., 2001) for clustering of jam samples based on TMA, TP and
FRAP to identify the best methods for jam processing in order to maintain the highest levels of
antioxidant parameters. Usually, this analysis is used as a clustering method for the creation of
phenograms, but it can also be used as a classification method to identify the best methods from a
set of multiple procedures involving multiple variables (Saitou and Nei, 1987).
Changes recorded in TMA content
In Table 2.12 is presented the TMA content from blackberry jam after processing and
storage. Considering the values reported in Tables 2.11 and 2.12 related to TMA content, can be
assessed the losses registered in response to fruit thermal processing.
Table 2.12. The impact of storage at 20°C on TMA content of blackberry jam
Jam
samples
TMA (mg∙100 g-1
jam)
1 day (0) 1 month 3 months 6 months
LMP1 36.8±0.9 34.1±1.3ns
29.6±1.1**
22.4±1.0***
LMP2 34.0±1.2 31.2±0.9*
26.8±1.2**
20.0±1.0***
LMP3 31.9±0.9 26.9±0.5*
23.9±0.8**
17.3±0.8***
LMAP4 40.7±1.6 38.8±1.3ns
34.2±1.3**
28.2±0.9***
LMAP5 39.1±1.3 36.6±1.2ns
32.5±1.4*
25.6±1.2***
LMAP6 35.8±0.7 31.2±1.1*
28.0±1.3**
20.9±0.8***
HMP7 28.0±0.9 24.7±1.1*
20.1±1.1**
15.2±0.9***
HMP8 26.2±0.9 22.41±0.8*
19.8±0.7**
13.3±0.8***
HMP9 23.3±0.9 19.0±0.9*
15.4±0.7**
10.2±0.8***
Statistical differences are indicated as follows: ns – non-significant, P>0.1; * – significant, P<0.05;
** – highly significant, P<0.01 and *** – extremely significant, P<0.001.
Legend:
LMP1: LMP 1%; LMP2: LMP 0.7%; LMP3: LMP 0.3%; LMAP4: LMAP 1%; LMAP5: LMAP 0.7%; LMAP6:
LMAP 0.3%; HMP7: HMP 1%; HMP8: HMP 0.7% and HMP9: HMP 0.3%.
Our data revealed that thermal processing of fresh fruit induced significant losses in TMA
content, in the range 69-82% reported to the values corresponding to fresh fruit. The TMA
content in jam samples one day after processing revealed that this parameter was affected by the
pectin type as well as by the dosage used in jam recipe. These results are consistent with other
that reported losses in TMA content during jam processing from various wild berries in the range
70-85% (Amakura et al., 2000; Savikin et al., 2009, Poiana et al., 2012). Anthocyanins exhibit a
high sensitivity to temperature (Gimenez et al., 2001). Thermal treatments of fruit, especially
those involving prolonged exposure at high temperature, cause dramatic alterations of TMA due
to oxidation, cleavage of covalent bonds or enhanced oxidation reactions (Zhang et al., 2012).
Also, thermal processing leads to complexation reactions between anthocyanins and other
compounds resulted in response to high temperature exposure. Apart from these, the losses of
Mariana-Atena POIANA Habilitation Thesis
53
TMA could be due to formation of anthocyanin polymers or condensation between anthocyanins
and procyanidins or other phenolic compounds (Patras et al., 2010; Moura et al., 2012).
By using of LMAP, LMA and HMP the losses recorded in TMA content were in the
ranges: 71-75%, 69-71%, 78-82% reported to the values corresponding to fresh fruit. These data
revealed that anthocyanin pigments were better retained in jam samples obtained with low-
esterified pectin than in samples with high-esterified pectin. Among the jams obtained with
pectins having similar DE, the best retention was noticed by using of amidated pectin. Moreover,
the increasing of pectin dose resulted in improvement of TMA retention in jam. This fact could
be explained by interactions between anthocyanins and pectin chains.
Holzwarth et al. (2013), Kopjar et al. (2007) and Buchweitz et al. (2013) reported that the
pectin type has a great impact on its functionality. The mechanism of gel formation during jam
processing is of a great importance to explain our results. The different types of associations that
occur between the pectin chains are determined by its type (DE, DA) (Hubbermann et al., 2006;
Kopjar et al., 2007; Buchweitz et al., 2013). LMP and LMAP probably interact more easily with
anthocyanins because they have fewer methoxyl groups than HMP (Hubbermann et al., Kopjar et
al., 2009). The improved stability of pigments in jams prepared with LMAP might be due to the
formation of additional hydrogen bonds between the hydroxyl groups of anthocyanins and the
amide groups of pectin (Holzwarth et al., 2013). In result, anthocyanins can be protected against
water attack or condensation reactions among anthocyanins and procyanidins (Hubbermann et
al., 2006). Thus, it can be suggest that it is possible to control the content of TMA in gelled fruit
products by pectin type and dose. As presented in Table 2.12, TMA content significantly
decreased during jam storage. At the end of storage the relative losses in TMA content were in
the range 31-56%, Figure 2.9a. Anthocyanins stability during storage strongly depended on the
pectin type and dosage used in jam formulation. After 6 months of storage, the best retention of
TMA was noticed in samples with LMAP and the lowest in jams with HMP. Among the jams
prepared with low-esterefied pectin, anthocyanins stability was better in samples obtained with
pectin having similar DE and amidation. More researches are needed to study individual
anthocyanins to assess if there are any differences in their degradation pattern and stability during
jam processing and storage in relation with pectin type and its dosage.
In Figure 2.10a is shown the variation of TMA content in response to storage. The
highest value of TMA corresponds to LMAP4.0 and the lowest to HMP9.6. Statistical analysis
reveals that the changes of TMA content were greatly affected by storage period. After 6 months,
the changes in TMA content became extremely significant for all jam samples (P<0.001).
Changes recorded in color indices
The color quality was quantified by CD and PC (%). It was noticed a certain sensibility of
CD to pectin type and dose used for jam preparation. Thus, one day post-processing, jam samples
prepared with various types or different doses of pectin presented different values of CD, Figure
2.11a. Samples with HMP had lower values of CD than samples with LMP or LMAP. Also, it
can be seen that samples with LMAP had slightly higher values of CD than samples with LMP.
This tendency remained during 6 months of storage. It could be noticed that CD exhibited a good
stability in response to long-term storage.
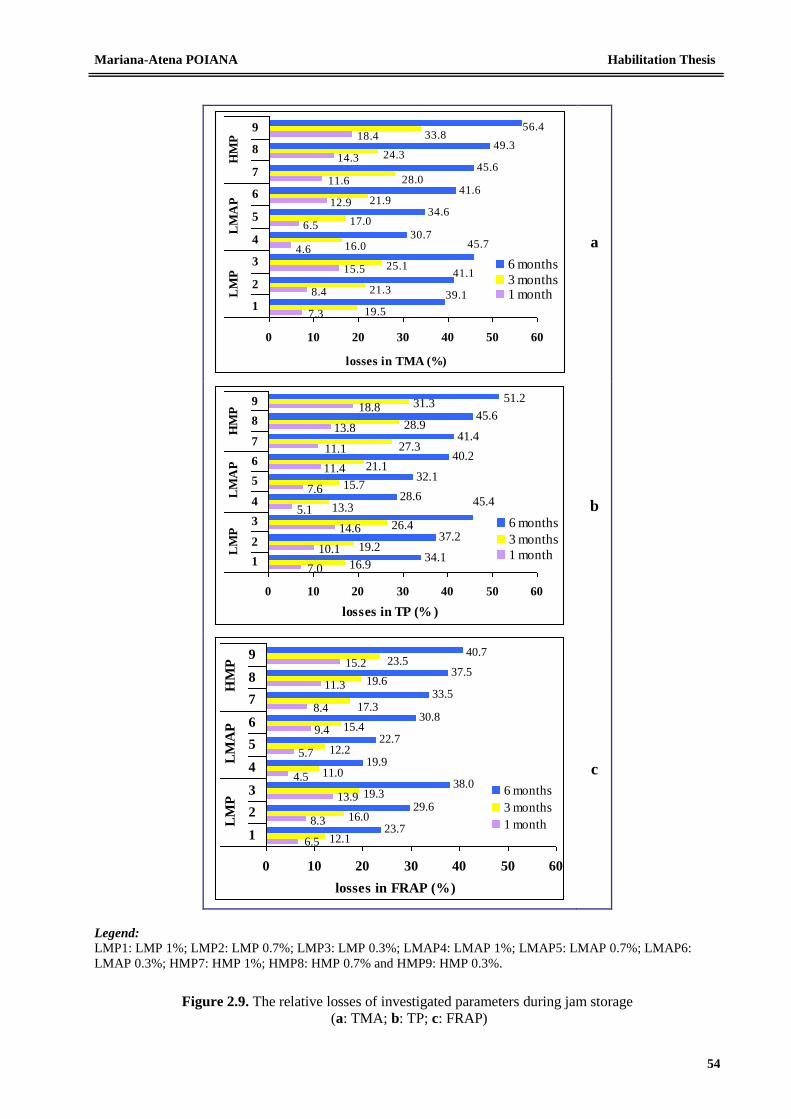
Mariana-Atena POIANA Habilitation Thesis
54
30.7
34.6
41.6
45.6
49.3
7.3
8.4
15.5
4.6
6.5
12.9
11.6
14.3
18.4
25.1
21.3
19.5
16.0
17.0
21.9
28.0
24.3
33.8
39.1
41.1
56.4
45.7
0 10 20 30 40 50 60
1
2
3
4
5
6
7
8
9
LM
PL
MA
PH
MP
losses in TMA (%)
6 months
3 months1 month
a
34.1
37.2
28.6
32.1
40.2
41.4
45.6
7.0
10.1
14.6
5.1
7.6
11.4
11.1
13.8
18.8
26.4
19.2
16.9
13.3
15.7
21.1
27.3
28.9
31.3 51.2
45.4
0 10 20 30 40 50 60
1
2
3
4
5
6
7
8
9
LM
PL
MA
PH
MP
losses in TP (% )
6 months
3 months
1 month
b
23.7
29.6
38.0
19.9
22.7
30.8
33.5
37.5
6.5
8.3
13.9
4.5
5.7
9.4
8.4
11.3
15.2
19.3
16.0
12.1
11.0
12.2
15.4
17.3
19.6
23.540.7
0 10 20 30 40 50 60
1
2
3
4
5
6
7
8
9
LM
PL
MA
PH
MP
losses in FRAP (%)
6 months
3 months
1 month
c
Legend: LMP1: LMP 1%; LMP2: LMP 0.7%; LMP3: LMP 0.3%; LMAP4: LMAP 1%; LMAP5: LMAP 0.7%; LMAP6:
LMAP 0.3%; HMP7: HMP 1%; HMP8: HMP 0.7% and HMP9: HMP 0.3%.
Figure 2.9. The relative losses of investigated parameters during jam storage
(a: TMA; b: TP; c: FRAP)
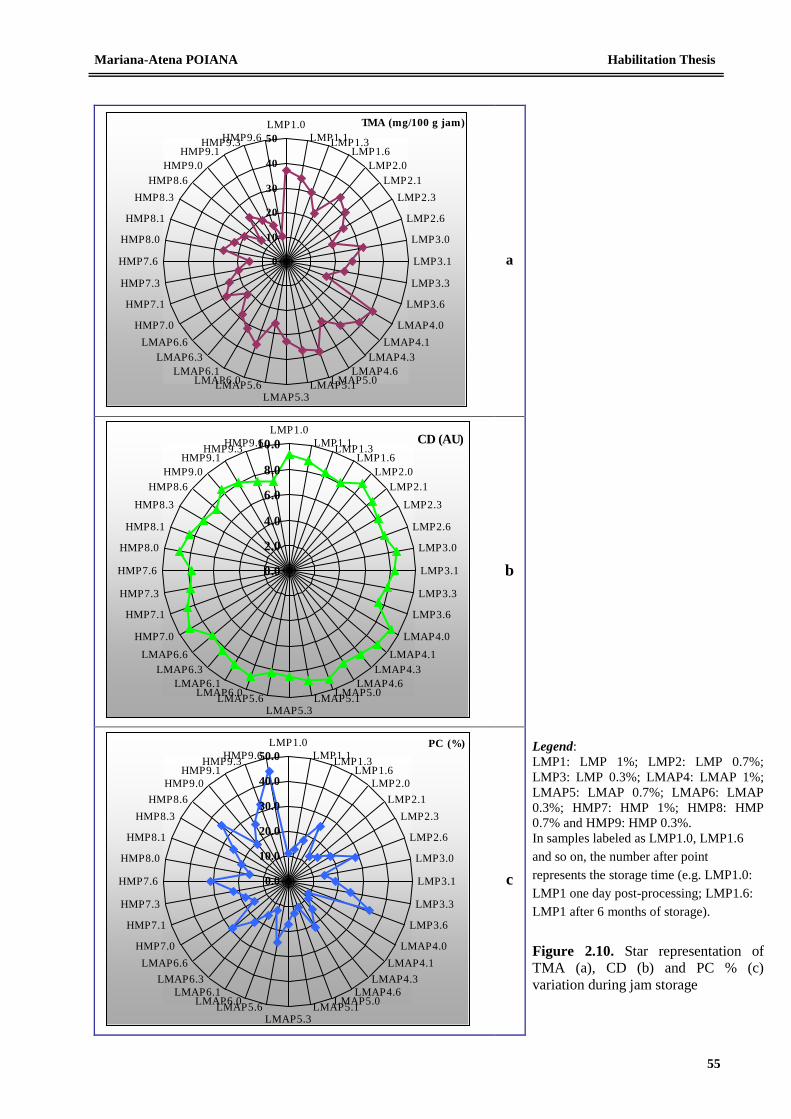
Mariana-Atena POIANA Habilitation Thesis
55
TMA (mg/100 g jam)
0
10
20
30
40
50
LMP1.0
LMP1.1LMP1.3
LMP1.6
LMP2.0
LMP2.1
LMP2.3
LMP2.6
LMP3.0
LMP3.1
LMP3.3
LMP3.6
LMAP4.0
LMAP4.1
LMAP4.3
LMAP4.6LMAP5.0LMAP5.1
LMAP5.3LMAP5.6LMAP6.0
LMAP6.1
LMAP6.3
LMAP6.6
HMP7.0
HMP7.1
HMP7.3
HMP7.6
HMP8.0
HMP8.1
HMP8.3
HMP8.6
HMP9.0
HMP9.1HMP9.3
HMP9.6
a
Legend:
LMP1: LMP 1%; LMP2: LMP 0.7%;
LMP3: LMP 0.3%; LMAP4: LMAP 1%;
LMAP5: LMAP 0.7%; LMAP6: LMAP
0.3%; HMP7: HMP 1%; HMP8: HMP
0.7% and HMP9: HMP 0.3%.
In samples labeled as LMP1.0, LMP1.6
and so on, the number after point
represents the storage time (e.g. LMP1.0:
LMP1 one day post-processing; LMP1.6:
LMP1 after 6 months of storage).
Figure 2.10. Star representation of
TMA (a), CD (b) and PC % (c)
variation during jam storage
CD (AU)
0.0
2.0
4.0
6.0
8.0
10.0
LMP1.0
LMP1.1LMP1.3
LMP1.6
LMP2.0
LMP2.1
LMP2.3
LMP2.6
LMP3.0
LMP3.1
LMP3.3
LMP3.6
LMAP4.0
LMAP4.1
LMAP4.3
LMAP4.6LMAP5.0
LMAP5.1LMAP5.3
LMAP5.6LMAP6.0
LMAP6.1
LMAP6.3
LMAP6.6
HMP7.0
HMP7.1
HMP7.3
HMP7.6
HMP8.0
HMP8.1
HMP8.3
HMP8.6
HMP9.0
HMP9.1HMP9.3
HMP9.6
b
PC (%)
0.0
10.0
20.0
30.0
40.0
50.0
LMP1.0
LMP1.1LMP1.3
LMP1.6
LMP2.0
LMP2.1
LMP2.3
LMP2.6
LMP3.0
LMP3.1
LMP3.3
LMP3.6
LMAP4.0
LMAP4.1
LMAP4.3
LMAP4.6LMAP5.0
LMAP5.1LMAP5.3
LMAP5.6LMAP6.0
LMAP6.1
LMAP6.3
LMAP6.6
HMP7.0
HMP7.1
HMP7.3
HMP7.6
HMP8.0
HMP8.1
HMP8.3
HMP8.6
HMP9.0
HMP9.1HMP9.3
HMP9.6
c
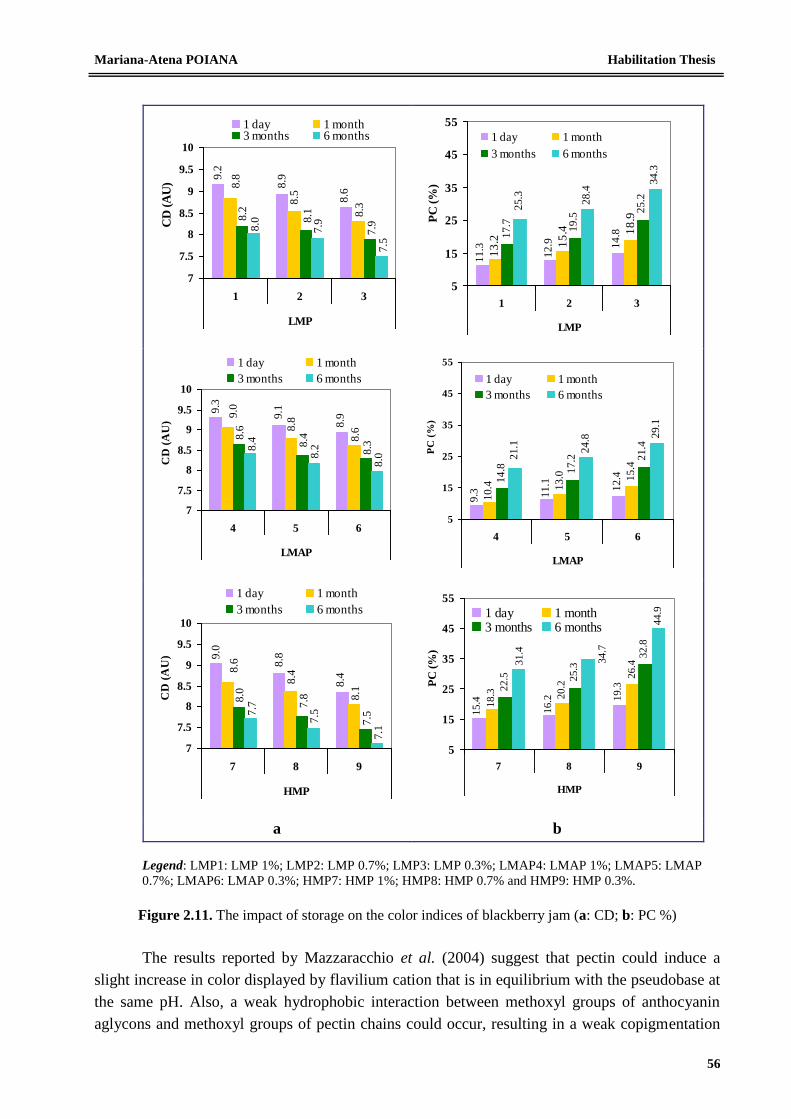
Mariana-Atena POIANA Habilitation Thesis
56
9.2
8.6
8.9
8.8
8.3
8.5
7.9
8.18.2
7.5
7.98.0
7
7.5
8
8.5
9
9.5
10
1 2 3
LMP
CD
(A
U)
1 day 1 month3 months 6 months
12
.9 14
.8
11
.3 15
.4 18
.9
13
.21
7.7 19
.5
25.2
25
.3
28
.4
34
.3
5
15
25
35
45
55
1 2 3
LMP
PC
(%
)
1 day 1 month
3 months 6 months
9.1
8.9
9.3
8.8
8.6
9.0
8.6
8.4
8.38.4
8.2
8.0
7
7.5
8
8.5
9
9.5
10
4 5 6
LMAP
CD
(A
U)
1 day 1 month
3 months 6 months
9.3
12
.4
11
.1
10
.4
15
.4
13
.0
21
.4
17
.2
14
.8
29
.1
24
.8
21
.15
15
25
35
45
55
4 5 6
LMAP
PC
(%
)
1 day 1 month
3 months 6 months
8.8
8.4
9.0
8.4
8.1
8.6
8.0
7.8
7.57
.7
7.5
7.1
7
7.5
8
8.5
9
9.5
10
7 8 9
HMP
CD
(A
U)
1 day 1 month
3 months 6 months
16.2 1
9.3
15.4
20.2
26.4
18.3
22.5 25.3
32.8
31.4
34.7
44.9
5
15
25
35
45
55
7 8 9
HMP
PC
(%
)
1 day 1 month3 months 6 months
a b
Legend: LMP1: LMP 1%; LMP2: LMP 0.7%; LMP3: LMP 0.3%; LMAP4: LMAP 1%; LMAP5: LMAP
0.7%; LMAP6: LMAP 0.3%; HMP7: HMP 1%; HMP8: HMP 0.7% and HMP9: HMP 0.3%.
Figure 2.11. The impact of storage on the color indices of blackberry jam (a: CD; b: PC %)
The results reported by Mazzaracchio et al. (2004) suggest that pectin could induce a
slight increase in color displayed by flavilium cation that is in equilibrium with the pseudobase at
the same pH. Also, a weak hydrophobic interaction between methoxyl groups of anthocyanin
aglycons and methoxyl groups of pectin chains could occur, resulting in a weak copigmentation
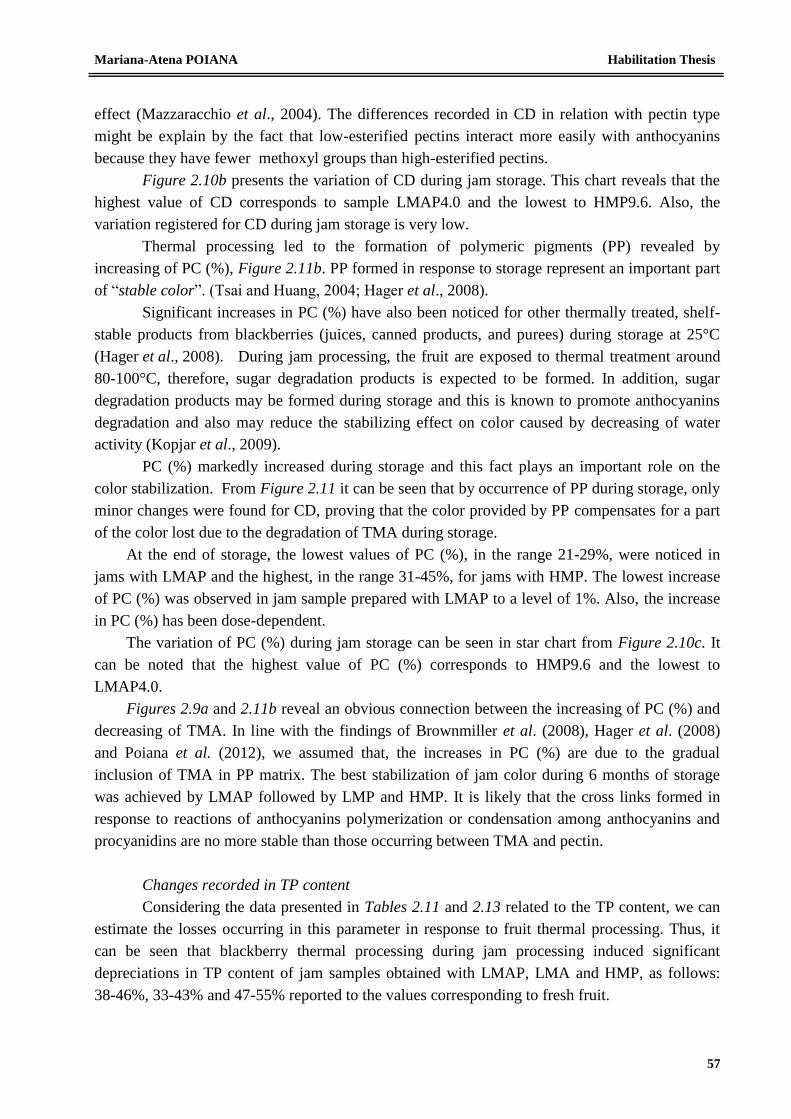
Mariana-Atena POIANA Habilitation Thesis
57
effect (Mazzaracchio et al., 2004). The differences recorded in CD in relation with pectin type
might be explain by the fact that low-esterified pectins interact more easily with anthocyanins
because they have fewer methoxyl groups than high-esterified pectins.
Figure 2.10b presents the variation of CD during jam storage. This chart reveals that the
highest value of CD corresponds to sample LMAP4.0 and the lowest to HMP9.6. Also, the
variation registered for CD during jam storage is very low.
Thermal processing led to the formation of polymeric pigments (PP) revealed by
increasing of PC (%), Figure 2.11b. PP formed in response to storage represent an important part
of “stable color”. (Tsai and Huang, 2004; Hager et al., 2008).
Significant increases in PC (%) have also been noticed for other thermally treated, shelf-
stable products from blackberries (juices, canned products, and purees) during storage at 25°C
(Hager et al., 2008). During jam processing, the fruit are exposed to thermal treatment around
80-100°C, therefore, sugar degradation products is expected to be formed. In addition, sugar
degradation products may be formed during storage and this is known to promote anthocyanins
degradation and also may reduce the stabilizing effect on color caused by decreasing of water
activity (Kopjar et al., 2009).
PC (%) markedly increased during storage and this fact plays an important role on the
color stabilization. From Figure 2.11 it can be seen that by occurrence of PP during storage, only
minor changes were found for CD, proving that the color provided by PP compensates for a part
of the color lost due to the degradation of TMA during storage.
At the end of storage, the lowest values of PC (%), in the range 21-29%, were noticed in
jams with LMAP and the highest, in the range 31-45%, for jams with HMP. The lowest increase
of PC (%) was observed in jam sample prepared with LMAP to a level of 1%. Also, the increase
in PC (%) has been dose-dependent.
The variation of PC (%) during jam storage can be seen in star chart from Figure 2.10c. It
can be noted that the highest value of PC (%) corresponds to HMP9.6 and the lowest to
LMAP4.0.
Figures 2.9a and 2.11b reveal an obvious connection between the increasing of PC (%) and
decreasing of TMA. In line with the findings of Brownmiller et al. (2008), Hager et al. (2008)
and Poiana et al. (2012), we assumed that, the increases in PC (%) are due to the gradual
inclusion of TMA in PP matrix. The best stabilization of jam color during 6 months of storage
was achieved by LMAP followed by LMP and HMP. It is likely that the cross links formed in
response to reactions of anthocyanins polymerization or condensation among anthocyanins and
procyanidins are no more stable than those occurring between TMA and pectin.
Changes recorded in TP content
Considering the data presented in Tables 2.11 and 2.13 related to the TP content, we can
estimate the losses occurring in this parameter in response to fruit thermal processing. Thus, it
can be seen that blackberry thermal processing during jam processing induced significant
depreciations in TP content of jam samples obtained with LMAP, LMA and HMP, as follows:
38-46%, 33-43% and 47-55% reported to the values corresponding to fresh fruit.
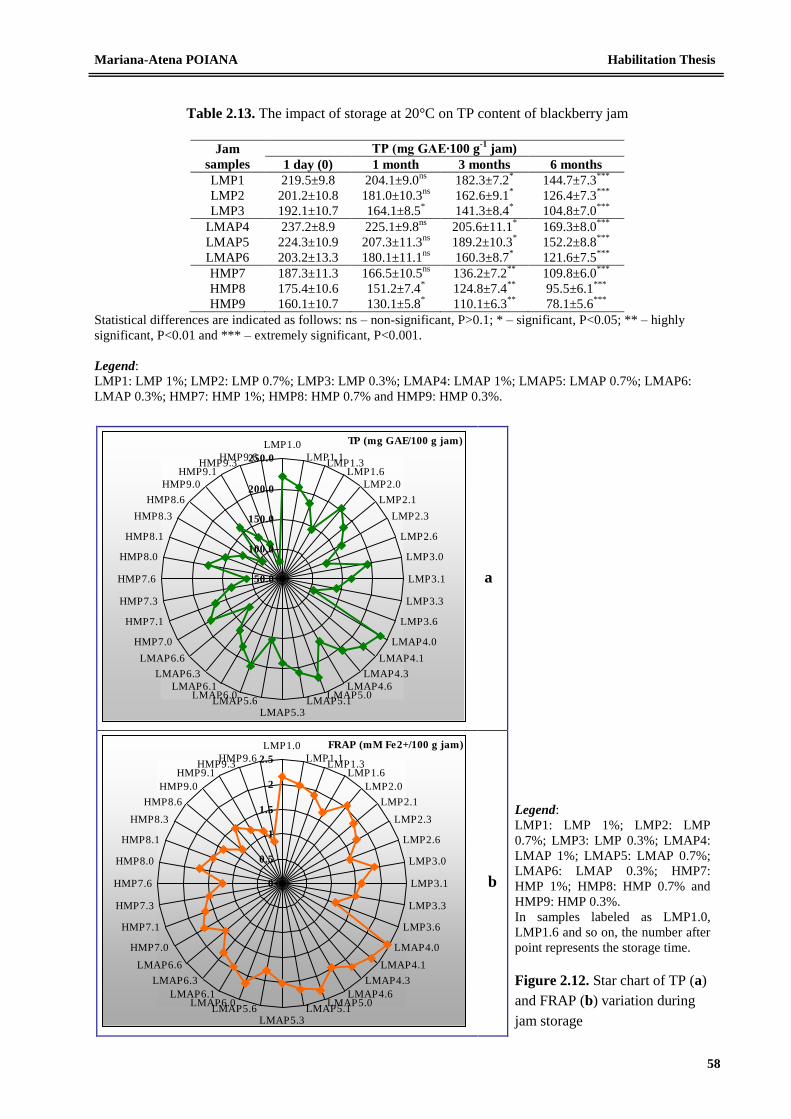
Mariana-Atena POIANA Habilitation Thesis
58
Table 2.13. The impact of storage at 20°C on TP content of blackberry jam
Jam
samples
TP (mg GAE∙100 g-1
jam)
1 day (0) 1 month 3 months 6 months
LMP1 219.5±9.8 204.1±9.0ns
182.3±7.2*
144.7±7.3***
LMP2 201.2±10.8 181.0±10.3ns
162.6±9.1*
126.4±7.3***
LMP3 192.1±10.7 164.1±8.5*
141.3±8.4*
104.8±7.0***
LMAP4 237.2±8.9 225.1±9.8ns
205.6±11.1*
169.3±8.0***
LMAP5 224.3±10.9 207.3±11.3ns
189.2±10.3*
152.2±8.8***
LMAP6 203.2±13.3 180.1±11.1ns
160.3±8.7*
121.6±7.5***
HMP7 187.3±11.3 166.5±10.5ns
136.2±7.2**
109.8±6.0***
HMP8 175.4±10.6 151.2±7.4*
124.8±7.4**
95.5±6.1***
HMP9 160.1±10.7 130.1±5.8*
110.1±6.3**
78.1±5.6***
Statistical differences are indicated as follows: ns – non-significant, P>0.1; * – significant, P<0.05; ** – highly
significant, P<0.01 and *** – extremely significant, P<0.001.
Legend:
LMP1: LMP 1%; LMP2: LMP 0.7%; LMP3: LMP 0.3%; LMAP4: LMAP 1%; LMAP5: LMAP 0.7%; LMAP6:
LMAP 0.3%; HMP7: HMP 1%; HMP8: HMP 0.7% and HMP9: HMP 0.3%.
TP (mg GAE/100 g jam)
50.0
100.0
150.0
200.0
250.0
LMP1.0
LMP1.1LMP1.3
LMP1.6
LMP2.0
LMP2.1
LMP2.3
LMP2.6
LMP3.0
LMP3.1
LMP3.3
LMP3.6
LMAP4.0
LMAP4.1
LMAP4.3
LMAP4.6LMAP5.0
LMAP5.1LMAP5.3
LMAP5.6LMAP6.0
LMAP6.1
LMAP6.3
LMAP6.6
HMP7.0
HMP7.1
HMP7.3
HMP7.6
HMP8.0
HMP8.1
HMP8.3
HMP8.6
HMP9.0
HMP9.1HMP9.3
HMP9.6
a
Legend:
LMP1: LMP 1%; LMP2: LMP
0.7%; LMP3: LMP 0.3%; LMAP4:
LMAP 1%; LMAP5: LMAP 0.7%;
LMAP6: LMAP 0.3%; HMP7:
HMP 1%; HMP8: HMP 0.7% and
HMP9: HMP 0.3%.
In samples labeled as LMP1.0,
LMP1.6 and so on, the number after
point represents the storage time.
Figure 2.12. Star chart of TP (a)
and FRAP (b) variation during
jam storage
FRAP (mM Fe2+/100 g jam)
0
0.5
1
1.5
2
2.5
LMP1.0
LMP1.1LMP1.3
LMP1.6
LMP2.0
LMP2.1
LMP2.3
LMP2.6
LMP3.0
LMP3.1
LMP3.3
LMP3.6
LMAP4.0
LMAP4.1
LMAP4.3
LMAP4.6LMAP5.0
LMAP5.1LMAP5.3
LMAP5.6LMAP6.0
LMAP6.1
LMAP6.3
LMAP6.6
HMP7.0
HMP7.1
HMP7.3
HMP7.6
HMP8.0
HMP8.1
HMP8.3
HMP8.6
HMP9.0
HMP9.1HMP9.3
HMP9.6
b
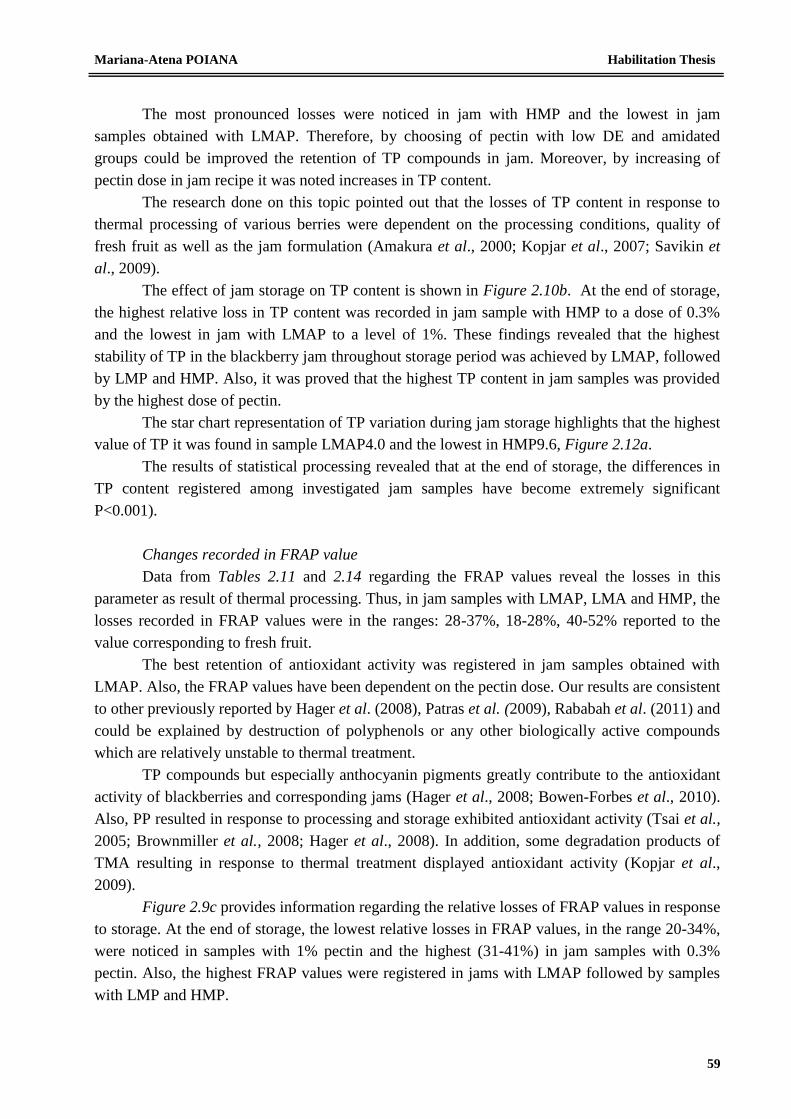
Mariana-Atena POIANA Habilitation Thesis
59
The most pronounced losses were noticed in jam with HMP and the lowest in jam
samples obtained with LMAP. Therefore, by choosing of pectin with low DE and amidated
groups could be improved the retention of TP compounds in jam. Moreover, by increasing of
pectin dose in jam recipe it was noted increases in TP content.
The research done on this topic pointed out that the losses of TP content in response to
thermal processing of various berries were dependent on the processing conditions, quality of
fresh fruit as well as the jam formulation (Amakura et al., 2000; Kopjar et al., 2007; Savikin et
al., 2009).
The effect of jam storage on TP content is shown in Figure 2.10b. At the end of storage,
the highest relative loss in TP content was recorded in jam sample with HMP to a dose of 0.3%
and the lowest in jam with LMAP to a level of 1%. These findings revealed that the highest
stability of TP in the blackberry jam throughout storage period was achieved by LMAP, followed
by LMP and HMP. Also, it was proved that the highest TP content in jam samples was provided
by the highest dose of pectin.
The star chart representation of TP variation during jam storage highlights that the highest
value of TP it was found in sample LMAP4.0 and the lowest in HMP9.6, Figure 2.12a.
The results of statistical processing revealed that at the end of storage, the differences in
TP content registered among investigated jam samples have become extremely significant
P<0.001).
Changes recorded in FRAP value
Data from Tables 2.11 and 2.14 regarding the FRAP values reveal the losses in this
parameter as result of thermal processing. Thus, in jam samples with LMAP, LMA and HMP, the
losses recorded in FRAP values were in the ranges: 28-37%, 18-28%, 40-52% reported to the
value corresponding to fresh fruit.
The best retention of antioxidant activity was registered in jam samples obtained with
LMAP. Also, the FRAP values have been dependent on the pectin dose. Our results are consistent
to other previously reported by Hager et al. (2008), Patras et al. (2009), Rababah et al. (2011) and
could be explained by destruction of polyphenols or any other biologically active compounds
which are relatively unstable to thermal treatment.
TP compounds but especially anthocyanin pigments greatly contribute to the antioxidant
activity of blackberries and corresponding jams (Hager et al., 2008; Bowen-Forbes et al., 2010).
Also, PP resulted in response to processing and storage exhibited antioxidant activity (Tsai et al.,
2005; Brownmiller et al., 2008; Hager et al., 2008). In addition, some degradation products of
TMA resulting in response to thermal treatment displayed antioxidant activity (Kopjar et al.,
2009).
Figure 2.9c provides information regarding the relative losses of FRAP values in response
to storage. At the end of storage, the lowest relative losses in FRAP values, in the range 20-34%,
were noticed in samples with 1% pectin and the highest (31-41%) in jam samples with 0.3%
pectin. Also, the highest FRAP values were registered in jams with LMAP followed by samples
with LMP and HMP.
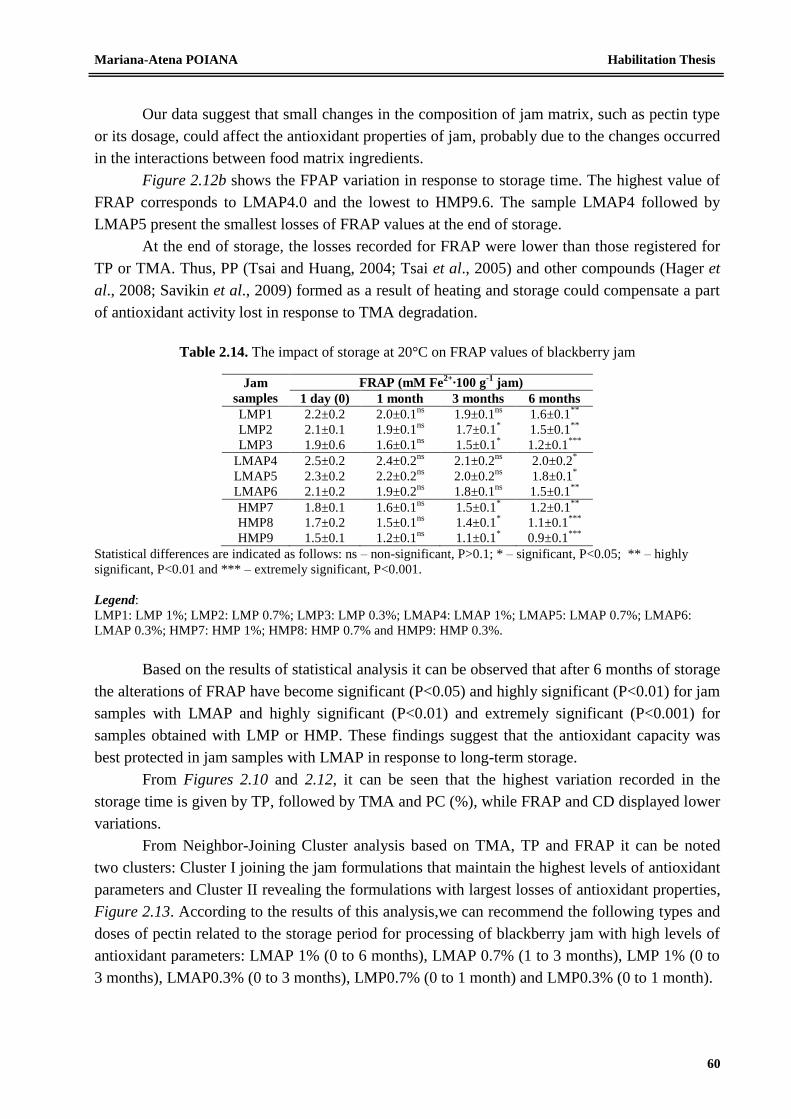
Mariana-Atena POIANA Habilitation Thesis
60
Our data suggest that small changes in the composition of jam matrix, such as pectin type
or its dosage, could affect the antioxidant properties of jam, probably due to the changes occurred
in the interactions between food matrix ingredients.
Figure 2.12b shows the FPAP variation in response to storage time. The highest value of
FRAP corresponds to LMAP4.0 and the lowest to HMP9.6. The sample LMAP4 followed by
LMAP5 present the smallest losses of FRAP values at the end of storage.
At the end of storage, the losses recorded for FRAP were lower than those registered for
TP or TMA. Thus, PP (Tsai and Huang, 2004; Tsai et al., 2005) and other compounds (Hager et
al., 2008; Savikin et al., 2009) formed as a result of heating and storage could compensate a part
of antioxidant activity lost in response to TMA degradation.
Table 2.14. The impact of storage at 20°C on FRAP values of blackberry jam
Jam
samples
FRAP (mM Fe2+
∙100 g-1
jam)
1 day (0) 1 month 3 months 6 months
LMP1 2.2±0.2 2.0±0.1ns
1.9±0.1ns
1.6±0.1**
LMP2 2.1±0.1 1.9±0.1ns
1.7±0.1*
1.5±0.1**
LMP3 1.9±0.6 1.6±0.1ns
1.5±0.1*
1.2±0.1***
LMAP4 2.5±0.2 2.4±0.2ns
2.1±0.2ns
2.0±0.2*
LMAP5 2.3±0.2 2.2±0.2ns
2.0±0.2ns
1.8±0.1*
LMAP6 2.1±0.2 1.9±0.2ns
1.8±0.1ns
1.5±0.1**
HMP7 1.8±0.1 1.6±0.1ns
1.5±0.1*
1.2±0.1**
HMP8 1.7±0.2 1.5±0.1ns
1.4±0.1*
1.1±0.1***
HMP9 1.5±0.1 1.2±0.1ns
1.1±0.1*
0.9±0.1***
Statistical differences are indicated as follows: ns – non-significant, P>0.1; * – significant, P<0.05; ** – highly
significant, P<0.01 and *** – extremely significant, P<0.001.
Legend:
LMP1: LMP 1%; LMP2: LMP 0.7%; LMP3: LMP 0.3%; LMAP4: LMAP 1%; LMAP5: LMAP 0.7%; LMAP6:
LMAP 0.3%; HMP7: HMP 1%; HMP8: HMP 0.7% and HMP9: HMP 0.3%.
Based on the results of statistical analysis it can be observed that after 6 months of storage
the alterations of FRAP have become significant (P<0.05) and highly significant (P<0.01) for jam
samples with LMAP and highly significant (P<0.01) and extremely significant (P<0.001) for
samples obtained with LMP or HMP. These findings suggest that the antioxidant capacity was
best protected in jam samples with LMAP in response to long-term storage.
From Figures 2.10 and 2.12, it can be seen that the highest variation recorded in the
storage time is given by TP, followed by TMA and PC (%), while FRAP and CD displayed lower
variations.
From Neighbor-Joining Cluster analysis based on TMA, TP and FRAP it can be noted
two clusters: Cluster I joining the jam formulations that maintain the highest levels of antioxidant
parameters and Cluster II revealing the formulations with largest losses of antioxidant properties,
Figure 2.13. According to the results of this analysis,we can recommend the following types and
doses of pectin related to the storage period for processing of blackberry jam with high levels of
antioxidant parameters: LMAP 1% (0 to 6 months), LMAP 0.7% (1 to 3 months), LMP 1% (0 to
3 months), LMAP0.3% (0 to 3 months), LMP0.7% (0 to 1 month) and LMP0.3% (0 to 1 month).
Mariana-Atena POIANA Habilitation Thesis
61
Legend:
LMP1: LMP 1%; LMP2: LMP 0.7%; LMP3: LMP 0.3%; LMAP4: LMAP 1%; LMAP5: LMAP 0.7%; LMAP6:
LMAP 0.3%; HMP7: HMP 1%; HMP8: HMP 0.7% and HMP9: HMP 0.3%. In samples labeled as LMP1.0, LMP1.6
and so on, the number after point represents the storage time.
Cluster I
LMAP4.0>LMAP5.0>LMAP4.1>LMP1.0>LMAP5.1>LMAP6.0>LMAP4.3>LMP1.1>LMP2.0>LMAP5.3>
LMP3.0>LMAP6.1>LMP2.1>LMP1.3>LMAP4.6>LMAP6.3>HMP7.0>LMP3.1
Cluster II
LMP2.3>HMP8.0>LMAP5.6>HMP7.1>LMP3.3>HMP9.0>HMP8.1>LMP1.6>LMAP6.6> HMP7.3> LMP2.6>
HMP8.3>HMP9.1>LMP3.6>HMP9.3>HMP7.6>HMP8.6>HMP9.6
Figure 2.13. Representation of Neighbor-Joining Cluster analysis of jams based on
TMA, TP and FRAP
2.5.3. Conclusions
The extent of losses for analysed parameters recorded in response to jam processing and
storage were closely related to the pectin type and dosage. The losses recorded in response to
processing, reported to the values corresponding to fresh fruit were as follows: TMA (69-82%),
TP (33-55%) and FRAP (18-52%). Biologically active compounds and color were best retained
in jams with LMAP followed by samples with LMP and HMP. Storage for 6 months brings along
additional dramatic losses reported to the values recorded one day post-processing, as follows:
TMA (31-56%), TP (29-51%) and FRAP (20-41%). Both processing and storage resulted in
significant increases in PC (%). Over 6 months of storage, the best color retention and the highest
TMA, TP and FRAP were achieved by LMAP, followed by LMP and HMP. In addition, a high
level of bioactive compounds in jam could be related to a high dose of pectin. Our results suggest
that the retention of bioactive compounds and jam color stability were strongly dependent on
pectin type and dosage. We can conclude that LMAP to a level of 1% is the most indicated for
processing of blackberry jam with the highest antioxidant properties and color stability.
Mariana-Atena POIANA Habilitation Thesis
62
2.6. Scientific contributions of the author to the actual state-of-knowledge
As respects the subjects presented above and based on the results obtained by the author
as a result of four studies done on this topic, the following remarks could be considered that bring
some contributions to the actual state-of-knowledge:
Regarding the effect of IQF process and long term frozen storage
The IQF process did not affect the bioactive compounds amount of investigated wild
berries. Contrary, the long-term frozen storage had a great impact on nutraceutical
compounds and color stability of berries;
The relative losses of TMA, TP, L-AsAc did not exceed 25% over six months of frozen
storage. After 10 month of frozen storage, the smallest losses of antioxidant activity were
recorded for blueberries and the largest for raspberrie;
According to their antioxidant characteristics, the analyzed berries may be listed in the
following order: blueberries>blackberries>raspberries;
The color of raspberries was the most sensitive to long-term frozen storage while the
color of blueberry and blackberry was more stable in response to freezing and long-term
frozen storage;
6 months of storage at -18°C of berries packed in polyethylene bags or plastic boxes is
reasonable for keeping the antioxidant properties and color of frozen fruit to a high level.
Regarding the effect of jam processing and storage
Fruit thermal processing led to pronounced deterioration of L-AsAc, TP and FRAP
values. Additionally, jam storage at 20°C brings along dramatic alterations of antioxidant
properties. Anthocyanin pigments from berries were massive degraded in response to
thermal processing and storage with a great impact on colour quality and antioxidant
properties.
The extent of losses recorded in response to fruit thermal processing and jam storage was
closely related to the fruit species and jam formulation (pectin type and dosage);
Among strawberry, cherry and sour cherry, the first one exhibited the highest losses of
bioactive compounds in response to jam processing. Moreover, strawberry jam showed
the lowest tolerance to storage conditions in terms of investigated properties. The best
retention of antioxidant properties and color in response to jam processing and storage
was recorded for sour cherry jam;
TMA and CD decreased with increasing of storage time whereas the percent of polymeric
color increased. The same trends were observed in all investigates jam samples;
There is an obvious connection between the increasing of PC(%) and the decreasing of
TMA due to their gradual inclusion in polymeric pigments matrix during jam storage;
It is remarkable that the rate of the color loss is much slower than the rate of TMA
degradation suggesting that the polymeric pigments occurring in response to storage
compensated for a part of the loss of color due to anthocyanins degradation;
Although TP and L-AsAc are the major potential candidates as a selection criterion for
antioxidant properties of fruits jams, antioxidant activity is not limited to these. We
Mariana-Atena POIANA Habilitation Thesis
63
suppose that PP show antioxidant properties, which compensate a part of antioxidant
capacity assigned to monomeric anthocyanins lost in response to storage. Although this
research does not completely confirm the antioxidant properties of PP, it can be used as a
basis for further studies required to clarify this effect;
Jam formulation is very important considering that the composition of the matrix strongly
affects its antioxidant properties due to the changes occurred in interactions between
matrix constituents. The type and dosage of pectin are very influential factors for limiting
the alterations occurring in response to thermal processing and storage;
The mechanism of gel formation during jam processing is important in explaining of our
results. The different types of associations that occur between chains are determined by
the pectin type (DE, DA). LMP and LMAP probably interact with anthocyanins more
easily because they have fewer methoxyl groups than HMP. The improving of
anthocyanins stability in jam might be explained by the fact that pectins are polyuronic
acids and their ability to retain anthocyanins is attributed to electrostatic interactions
between the dissociated carboxylic groups of pectin and the flavylium cations of the
pigments. The improved stability of pigments in blackberry jam prepared with amidated
pectin might be due to the formation of additional hydrogen bonds between the hydroxyl
groups of the anthocyanins and the amide groups of pectin. Due to these associations,
anthocyanins can be protected against water attack or condensation reactions among
anthocyanins and procyanidins. Based on the aforementioned remarks it might be
suggested that is possible to control the content of TMA retained in gelled fruit products
by pectin type and dose;
Small changes in the jam matrix composition, such as pectin type or its dosage, greatly
affect the jam quality;
The retention of bioactive compounds and jam color stability were strongly dependent on
the pectin type and dosage. A high level of bioactive compounds in jam could be related
to a high dose of pectin. By a proper selection of pectin type and dose in the formulation
could be improved the degree of bioactive compounds retention in the fruit-gelled
products, thus, being limited the losses recorded in response to processing and storage.
LMAP to a level of 1% is the most indicated for processing of bilberry and blackberry
jam with the highest antioxidant properties and color stability;
Fruit jams are still an excellent source of nutritional substances with antioxidant potential,
although compared to the fresh fruit, important losses seem to occur;
The derived knowledge will be very useful to optimize the processing of pectin-gelled
fruit products and storage conditions, to adopt new concepts and technologies that offer
advantages over conventional systems for improving the health promoting properties of
products. These findings will be useful to fruit processors wishing to improve the final
content of polyphenolic compounds, color retention and antioxidant capacity in their
products. From the aforementioned, it is logical for fruit processing industry to reevaluate
the existing thermal treatments based on studies that demonstrate a dramatic degradation
of polyphenolic compounds, especially anthocyanin pigments.
Mariana-Atena POIANA Habilitation Thesis
64
3. Scientific achievements concerning the capitalization of some by-products
from food processing
3.1. Background
Food industry is marked by the high volume of produced waste. Nowadays, the
management of agro-food industry by-products for capitalizing their potential is an important
issue for the economics. The processing of fruits results in high amounts of waste materials such
as peels, seeds, stones and oilseed meals representing a great problem for industries due to their
large production, year after year, and, in the same time, agricultural wastes have a limited
exploitation. Recently, there is a pressing need for obtaining of supplements with nutritional
value and in the same time with more benefits on health. Based on these reasons, the reutilization
of agro-food industry by-products as sources of bioactive compounds represents nowadays an
inexpensive, efficient and environmentally friendly means for their capitalization as natural
additives for food industry, cosmetics or pharmaceuticals. Thus, the possibility to use these
wastes as by-products for further exploitation in order to obtain potential food additives or
supplements with high nutritional value have gained an increasing interest because these are
high-value products and their recovery is economically attractive.
Agro-industrial wastes obtained by fruit processing contain some quantities of valuable
compounds (Shrikhande, 2000) whose extraction conditions and antioxidant properties have been
the subject of several works (Moure et. al., 2001).
This research direction discusses the potential of the most important by-products of wine
industry and fruit processing as a source of valuable compounds. While the wine industry by-
products can create great environmental problems, the concentrated waste could be more easily
introduced into the food cycle in form of natural additives and ingredients. Recently there is a
considerable interest in the development and evaluation of natural antioxidants from plant
materials that are rich in flavanoids and other polyphenolic compounds (Burns et al., 2001).
Grapes are one of the most popular fruit in the world. About 80% of the total grapes are
used in wine making (Mazza & Miniati, 1993) and pomace represents approx. 20% of the weight
of the raw processed grapes. Grape pomace represents the skin, pulp and seed remaining from
wine industry after grapes processing. Thus, the wine industry generates, every year, huge
amounts of grape pomace. Nowadays, grape pomace is considered, rightly, a great source of
different compounds such as polyphenols, pigments, sugars, tartrate, fibers, oils and ethanol
(Nerantzis and Tataridis, 2005).
Grape skins and seeds represent about 13% of the amount of processed berries (Torres
and Bobet, 2001) and constitute a rich source of health-promoting polyphenols with high
antioxidant properties that may have applications as food additives with nutritional benefits
(Torres and Bobet, 2001; Lapornik et al., 2005). The improving of the grape seeds utilization has
a major importance in order to be use as a source of natural food additives, ingredients, and
supplements (Soong and Barlow, 2004). Currently, grape pomace represents a valuable low-cost
raw material for the extraction of value-added compounds such as polyphenols especially
flavonoids (catechin, epicatechin), anthocyanins and procyanidins, phenolic acids that include
Mariana-Atena POIANA Habilitation Thesis
65
gallic acid and ellagic acid and stilbenes such as resveratrol and piceid (Yilmaz and Toledo,
2006) with potential as food additives or nutraceuticals. These compounds collectively are
referred to as phenolic compounds, possess antibacterial, antiviral, anti-inflammatory, anti-
cancerogenic properties and can prevent cardiovascular diseases (Shrikhande, 2000). Also, the
phenolic compounds of these extracts are responsible for their antioxidant activity and have been
reported to possess biological properties such as anti-carcinogenic, anti-mutagenic, anti-
inflammatory and antimicrobial properties (Jayaprakasha 2003; Yilmaz and Toledo, 2004).
Resveratrol, which is found in grape skins, has been proven to possess many functions in
modulating physiological and pathological reactions of the body, such as anti-cancer, anti-
mutagenesis, and cardioprotection (Yilmaz and Toledo, 2004).
In this regard, grape pomace has become an ideal candidate as a cost-effective product
with natural and high value-added polyphenolic phytochemicals (Guendez et al., 2005).
Increasing knowledge about the health promoting impact of antioxidants in everyday foods,
together with the assumption that a number of common synthetic preservatives may have
hazardous effects, led to considerate grape pomace as an economical source of demanded
compounds. Grape pomace would be beneficial for the use as a source of natural food additives,
ingredients, and supplements (Soong and Barlow, 2004).
Based on these statements, different approaches were exposed and investigated in this
thesis, in order to assess the potential applications of natural extracts obtained from grape seed
and grape pomace. Also, the characteristics and differences among the extracts from two grape
varieties were studied and compared to define their ability as a source of bioactive compounds.
Many studies have addressed the application of natural extracts as potential natural
antioxidants to improve the oxidative stability of edible oils subjected to various thermal
treatments. It is known that deep frying is widely used for the preparation of many types of foods.
Frying in vegetable oils involves the maintaining of oil at a high level of temperature, in the range
170-220°C (Silva et al., 2010). The high temperatures reached during frying lead to a complex
series of reactions that result in severe changes including thermo-oxidation, cis/trans-
isomerization, cyclization, polymerization and hydrolysis due to the high temperature of the
process (Gertz et al., 2000). Lipid oxidation is the main deterioration process that occurs during
edible oils heating containing lipid molecules with polyunsaturation (Gertz et al., 2000; El
Anany, 2007).
The thermal treatment of oil induces compositional changes by decomposition of
polyunsaturated, monounsaturated and saturated fatty acids. The lipids degradation process in
edible oils has generally been established as being a free radical mechanism that has as result the
occurring of primary oxidation products called hydroperoxides. They are odorless and colorless,
but are labile species that can undergo both enzymatic and non-enzymatic degradation to produce
a complex array of secondary oxidation products (aliphatic aldehydes, ketones, lactones,
alcohols, hydrocarbons, acids and epoxides) which are more stable during heating process. The
instability of peroxides may explain the decrease in peroxide values (PV) during advanced stages
of rancidity, so that, the breakdown into smaller molecules compounds associated with oxidation
of lipids would be expected to occur. The secondary products have the potential to affect flavour,
aroma, taste, nutritional value and overall quality of foods. Additionally, certain oxidation
Mariana-Atena POIANA Habilitation Thesis
66
products are potentially toxic at relatively low concentrations (Silva et al., 2010). Therefore,
oxidation of oil use as cooking medium is very important in terms of palatability, toxicity as well
as nutritional quality of the fried products.
The oxidative stability of oils is an important indicator of performance and shelf-life and
also for ensuring that oils show a good resistance during exposing at high temperature (Choe and
Min, 2006). The chemical changes occurring in oils in response to frying have been extensively
reported by Silva et al. (2010).
In addition to convective ovens, where heating occurs by forcing hot air to flow around
the food, microwave ovens are used in recent times more often for heating, reheating or cooking
but the effect of microwave heating on the edible oil can significantly differ from those produced
by convective heating. Exposure to microwave determines the increase of free fatty acids level,
possible isomerization of the double bonds of fatty acids and oxidation of polyunsaturated fatty
acids. As a result, free radicals can be formed in high amounts (Dostalova et al., 2005). Although,
there are many data regarding the consequences of microwave heating on the composition and
nutritional quality of food, little has been published about the changes occurring in oxidative
stability of edible oils during microwave exposure in response to supplementation by natural
extracts. On this topic, there were controversies regarding the free radical formation when oils
and fatty food are subjected to microwave treatment (Dostalova et al., 2005; Erkan et al., 2009;
Megahed et al., 2011).
The synthetic antioxidants, i.e. butylated hydroxyanisole (BHA) and butylated
hydroxytoluene (BHT) are very cost-effective given a high stability. The addition of synthetic
antioxidants for improving oxidative stability of edible oils is discouraged due to their suspected
action as promoters of carcinogenesis, as well for the general consumer rejection of synthetic
food additives (Nyam et al., 2013).
Nowadays, there is a proeminent interest in finding of phytochemicals as an alternative to
synthetic additives, commonly used in the food, pharmaceutical and cosmetic industry. Thus, due
to toxicological issues regarding the synthetic antioxidants, in the last years it has been seen an
increasing concern in identifying of potential natural sources such as agro-food by-products,
spices and other plant materials in order to obtain natural antioxidants used to minimize or delay
the lipid oxidation in fat-containing food products.
Many studies have dealt with evaluation of different crude extracts as natural antioxidants
in comparation with synthetic antioxidant (BHT) on the stability and quality of edible oils during
thermal treatments requiring elevated temperature (Yanishlieva and Marinova, 2001; Kalantzakis
and Blekas, 2006; Zhang et al., 2010).
Some components isolated from have been proven in model systems, being effective as
natural antioxidants (El Anany, 2007; Rehab, 2010) As such, nowadays there is a great interest in
the use of natural antioxidants derived from plant extracts and is expected to rise enormously in
the foreseeable future. Plant extract offers a unique range of applications for health. Secondary
metabolites such as phenolic compounds from plant sources are highly valuable for their
therapeutic attributes as antioxidants (Nyam et al., 2013).
Grape seed extract (GSE) contains large amounts of phenolic compounds and antioxidants
(Rababah et al., 2008). GSE is rich in proanthocyanidins and the mechanism of its antioxidant
Mariana-Atena POIANA Habilitation Thesis
67
action consists in its potential of radical scavenging, metal chelation, and synergism with other
bioactive compounds. Also, GSE exhibited high antioxidant activity, and may be used for food
preservation and health supplements (Jayaprakasha et al., 2001). Antioxidant activity of GSE has
been confirmed by β-carotene linoleate and linoleic acid peroxidation methods (Lafka et al.,
2007) as well as by DPPH and phosphomolybdenum complex methods (Yilmaz and Toledo,
2006).
Many attemps have been made to clarify the inhibitory potential of GSE on lipid
opidation developed in food systems. Most of the studies regarding the GSE effect on lipid
oxidation were conducted on meat (Mielnik et al., 2006; Brannan and Mah, 2007). Rababah et al.,
(2011) proved that GSE is an effective antioxidant to minimize lipid oxidation in corn chips
during storage. Shaker et al. (2006) reported that GSE (200 ppm) exhibited reasonable
antioxidant activity during the first day of sunflower oil heating at 60°C but showed pro-oxidative
effect with prolonged treatment.
Currently, the literature information on the effect of GSE on lipid oxidation of sunflower
oil during food applications which require heating to frying temperature seems to be limited. This
is the reason that drove me towards the study presented in selected paper 7.
Considering the concern for the lipid oxidation and its implications on food quality and
human health, the objective of the study performed by Poiana (2012) and presented in selected
paper 7, was to assess the inhibitory potential of freeze-dried grape seeds extract (GSE) against
lipid oxidation development in refined sunflower oil subjected to thermal treatments at elevated
temperatures. In this study, the oxidative stability of sunflower oils supplemented with GSE to
various doses was comparative investigated with the synthetic antioxidant (BHT) in order to
highlight the applicability of GSE as potential natural antioxidant in edible oils subjected to
some thermal applications specific to the food industry. This study was designed and performed
by me as single author.
Another valuable by-product that has retained our attention is represented by the fruit
kernels resulted from fruit processing. Seeds of apricot, peach and plum, belonging to the
Rosaceae family, are produced as by-products in large quantities from fruit canning industry.
Huge amounts of kernels of peach, apricot and plum result every year as a result of processing of
jams, jellies, and other sweet preserves of fruit, but their oils have not yet been fully studied.
These kernels are considered as potential non-traditional resources that can be exploited for oil
extraction (Hassanein, 1999) because these kinds of oil are considered a valuable source of
unsaturated fats due to their high content of oleic and linoleic acid.
Nevertheless, plum and apricot seeds are used worldwide only to small-scale for
vegetable oils industry due to the difficulty to break the shell covering the kernel. In addition to
the lipid fraction, these oils contain different bioactive compounds such as β-carotene (provitamin
A) and tocopherols. Tocopherols together with phytosterols and squalene are components present
in the unsaponifiable lipid fraction of fruit kernels oil. Tocopherols are fat soluble antioxidants
that protect the lipids and other membrane components because they act in quenching singlet
oxygen. Also, tocopherols have demonstrated the ability to inhibit lipid peroxidation, protecting
Mariana-Atena POIANA Habilitation Thesis
68
the stability of oils and fats. Also, the tocopherols may protect against atherogenesis by blocking
oxidation of low-density lipoprotein cholesterol and by favorably influencing plaque stability,
vasomotor function, and tendency for thrombosis (Min and Boff, 2002).
Antioxidants from seeds and fruit kernels oil are able to neutralize free radicals and have a
potential role in preventing the onset of some chronic diseases such as cardiovascular diseases,
some neurological disorders or certain inflammatory processes. These natural antioxidants are
important lipid oxidation inhibitors in food and biological systems and are found in oil seeds in
four vitamin E congeners called α–tocopherol (α–T), β–tocopherol (β–T), γ–tocopherol (γ–T),
and δ–tocopherol (δ–T) (Medina-Juarez et al.. 2000; Bele et al., 2013). α-T has three methyl
groups, β and γ forms have two methyl groups and the δ has one methyl group. The most active
form of vitamin E is α–T which it seems to protect the body against degenerative disorders such
as cancer and cardiovascular diseases. γ–T has been reported to be more potent than α–T in
decreasing the platelet aggregation and delaying LDL oxidation diseases (Hak et al., 2009).
20 years ago, apricot kernels oil has been studied for their fatty acids whereas peach
kernels oil had been investigated for both their sterols and fatty acids composition (Saadany et
al., 1993). Also, the study conducted by Hassanein (1999) reported some data about plum, peach
and apricot kernel oils in terms of fatty acid composition, sterols and tocopherol pattern. In the
last years, the study performed by Turan et al. (2007) has investigated the fatty acid,
triacylglycerol, phytosterol, and tocopherol variations in different varieties of apricot kernel oil.
Also, the research conducted by Ozcan et al. (2010) offers some information concerning the
properties of apricot kernel oils. According to the results of these studies, kernels oils contained
appreciable amounts of oleic and linoleic acids, but linolenic acid was found in negligible
amounts. These studies prove the concern for a more detailed characterization of these oils.
However, there are limited information concerning the antioxidant properties and the
existing bioactives compounds besides the lipidic fraction of these oils. Moreover, there is a lack
of information related to the plum kernel oil composition. Phenolic compounds from crude fruit
kernels oil have an important role on the oxidative stability of the polyunsaturated fatty acids of
these oils. This protective role is due to their antioxidant properties (Arranz et al., 2008).
Peach and apricot kernel oils have been used as adulterants for some expensive oils such
as almond oil (Hassanein, 1999). Kernel oils could be utilized into various food products and
cosmetics offering health benefits due to their nutritional qualities as well as their composition
(Amaral et al., 2008). Oil composition depends on the fruit variety, origin place, harvest year and
agro-technical measures (Zhang et al., 2009).
In light of the aforementioned, the main objectives of the study performed by Popa et al.
(2011) and presented in selected paper 8, was to describe a potential way to capitalise the fruit
kernels resulted as by-products in fruit canning industry and also to bring more information
about antioxidant properties, β-carotene, total phenolics content and tocopherol pattern of
apricot and plum kernel oils.
The obtained data are very useful to characterize these kernel oils and to facilitate their
differentiation from the other vegetable oils. In this study, I was involved as co-author.
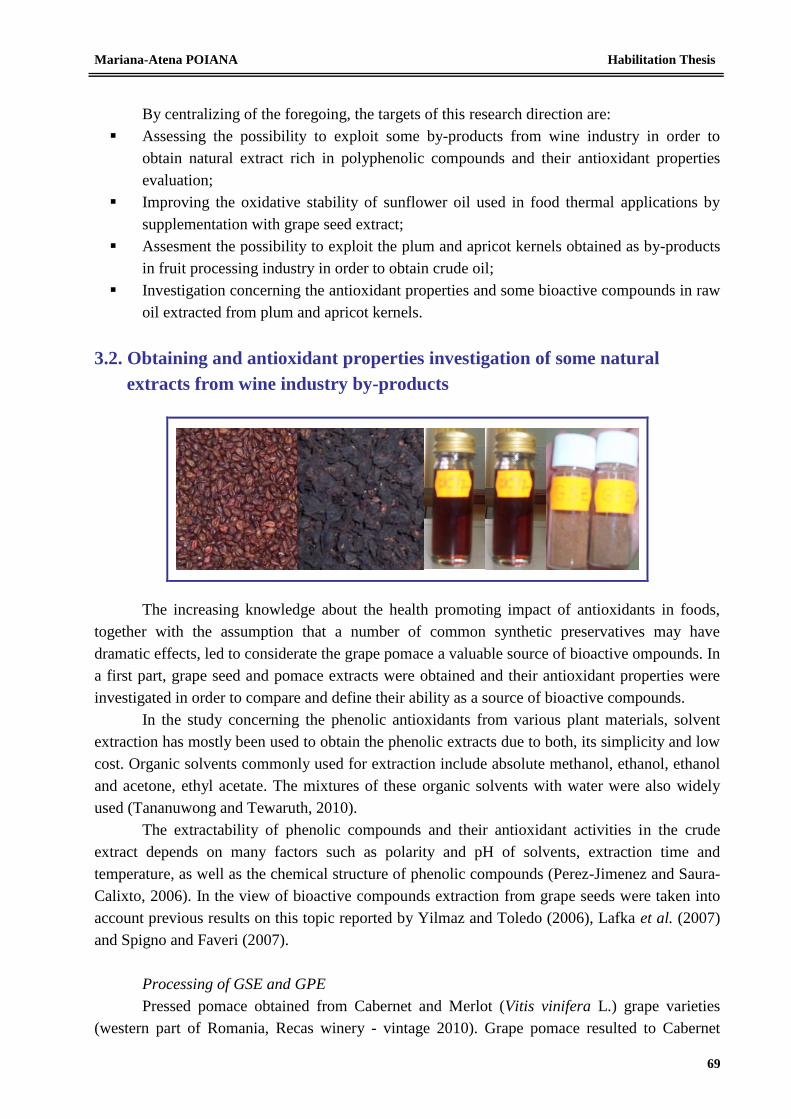
Mariana-Atena POIANA Habilitation Thesis
69
By centralizing of the foregoing, the targets of this research direction are:
Assessing the possibility to exploit some by-products from wine industry in order to
obtain natural extract rich in polyphenolic compounds and their antioxidant properties
evaluation;
Improving the oxidative stability of sunflower oil used in food thermal applications by
supplementation with grape seed extract;
Assesment the possibility to exploit the plum and apricot kernels obtained as by-products
in fruit processing industry in order to obtain crude oil;
Investigation concerning the antioxidant properties and some bioactive compounds in raw
oil extracted from plum and apricot kernels.
3.2. Obtaining and antioxidant properties investigation of some natural
extracts from wine industry by-products
The increasing knowledge about the health promoting impact of antioxidants in foods,
together with the assumption that a number of common synthetic preservatives may have
dramatic effects, led to considerate the grape pomace a valuable source of bioactive ompounds. In
a first part, grape seed and pomace extracts were obtained and their antioxidant properties were
investigated in order to compare and define their ability as a source of bioactive compounds.
In the study concerning the phenolic antioxidants from various plant materials, solvent
extraction has mostly been used to obtain the phenolic extracts due to both, its simplicity and low
cost. Organic solvents commonly used for extraction include absolute methanol, ethanol, ethanol
and acetone, ethyl acetate. The mixtures of these organic solvents with water were also widely
used (Tananuwong and Tewaruth, 2010).
The extractability of phenolic compounds and their antioxidant activities in the crude
extract depends on many factors such as polarity and pH of solvents, extraction time and
temperature, as well as the chemical structure of phenolic compounds (Perez-Jimenez and Saura-
Calixto, 2006). In the view of bioactive compounds extraction from grape seeds were taken into
account previous results on this topic reported by Yilmaz and Toledo (2006), Lafka et al. (2007)
and Spigno and Faveri (2007).
Processing of GSE and GPE
Pressed pomace obtained from Cabernet and Merlot (Vitis vinifera L.) grape varieties
(western part of Romania, Recas winery - vintage 2010). Grape pomace resulted to Cabernet
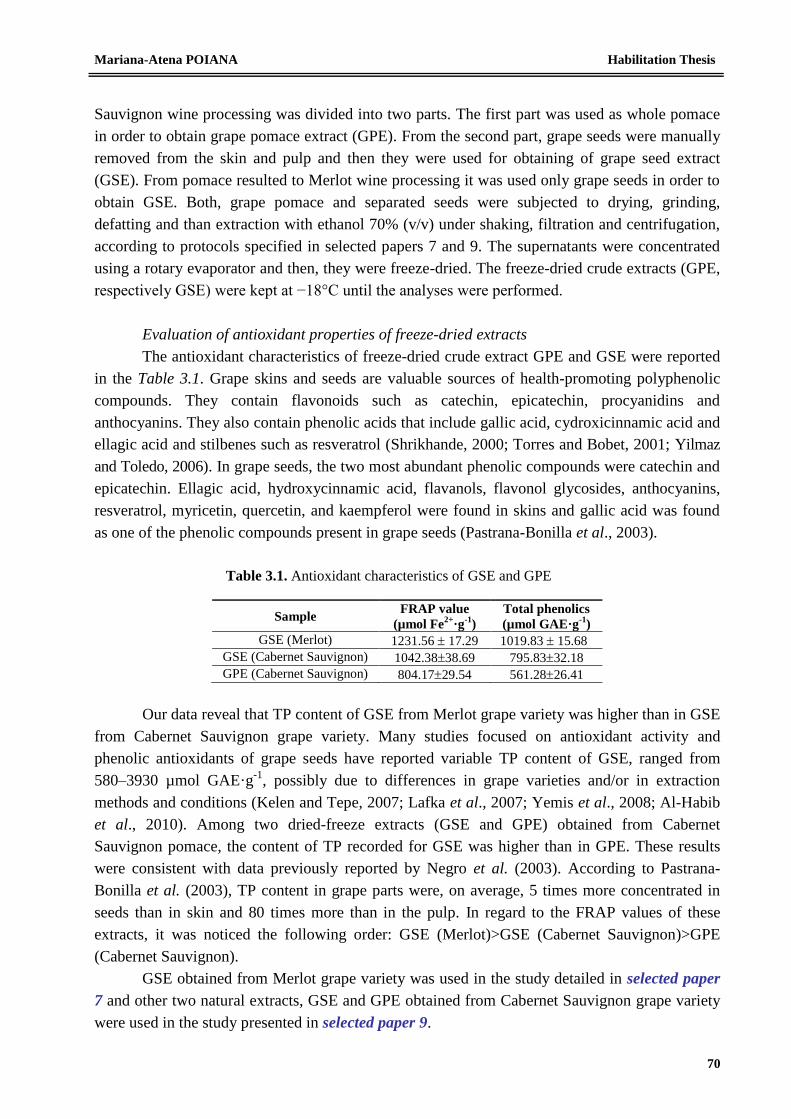
Mariana-Atena POIANA Habilitation Thesis
70
Sauvignon wine processing was divided into two parts. The first part was used as whole pomace
in order to obtain grape pomace extract (GPE). From the second part, grape seeds were manually
removed from the skin and pulp and then they were used for obtaining of grape seed extract
(GSE). From pomace resulted to Merlot wine processing it was used only grape seeds in order to
obtain GSE. Both, grape pomace and separated seeds were subjected to drying, grinding,
defatting and than extraction with ethanol 70% (v/v) under shaking, filtration and centrifugation,
according to protocols specified in selected papers 7 and 9. The supernatants were concentrated
using a rotary evaporator and then, they were freeze-dried. The freeze-dried crude extracts (GPE,
respectively GSE) were kept at −18°C until the analyses were performed.
Evaluation of antioxidant properties of freeze-dried extracts
The antioxidant characteristics of freeze-dried crude extract GPE and GSE were reported
in the Table 3.1. Grape skins and seeds are valuable sources of health-promoting polyphenolic
compounds. They contain flavonoids such as catechin, epicatechin, procyanidins and
anthocyanins. They also contain phenolic acids that include gallic acid, cydroxicinnamic acid and
ellagic acid and stilbenes such as resveratrol (Shrikhande, 2000; Torres and Bobet, 2001; Yilmaz
and Toledo, 2006). In grape seeds, the two most abundant phenolic compounds were catechin and
epicatechin. Ellagic acid, hydroxycinnamic acid, flavanols, flavonol glycosides, anthocyanins,
resveratrol, myricetin, quercetin, and kaempferol were found in skins and gallic acid was found
as one of the phenolic compounds present in grape seeds (Pastrana-Bonilla et al., 2003).
Table 3.1. Antioxidant characteristics of GSE and GPE
Sample FRAP value
(µmol Fe2+
·g-1
)
Total phenolics
(µmol GAE·g-1
)
GSE (Merlot) 1231.56 17.29 1019.83 15.68
GSE (Cabernet Sauvignon) 1042.3838.69 795.8332.18
GPE (Cabernet Sauvignon) 804.1729.54 561.2826.41
Our data reveal that TP content of GSE from Merlot grape variety was higher than in GSE
from Cabernet Sauvignon grape variety. Many studies focused on antioxidant activity and
phenolic antioxidants of grape seeds have reported variable TP content of GSE, ranged from
580–3930 µmol GAE·g-1
, possibly due to differences in grape varieties and/or in extraction
methods and conditions (Kelen and Tepe, 2007; Lafka et al., 2007; Yemis et al., 2008; Al-Habib
et al., 2010). Among two dried-freeze extracts (GSE and GPE) obtained from Cabernet
Sauvignon pomace, the content of TP recorded for GSE was higher than in GPE. These results
were consistent with data previously reported by Negro et al. (2003). According to Pastrana-
Bonilla et al. (2003), TP content in grape parts were, on average, 5 times more concentrated in
seeds than in skin and 80 times more than in the pulp. In regard to the FRAP values of these
extracts, it was noticed the following order: GSE (Merlot)>GSE (Cabernet Sauvignon)>GPE
(Cabernet Sauvignon).
GSE obtained from Merlot grape variety was used in the study detailed in selected paper
7 and other two natural extracts, GSE and GPE obtained from Cabernet Sauvignon grape variety
were used in the study presented in selected paper 9.
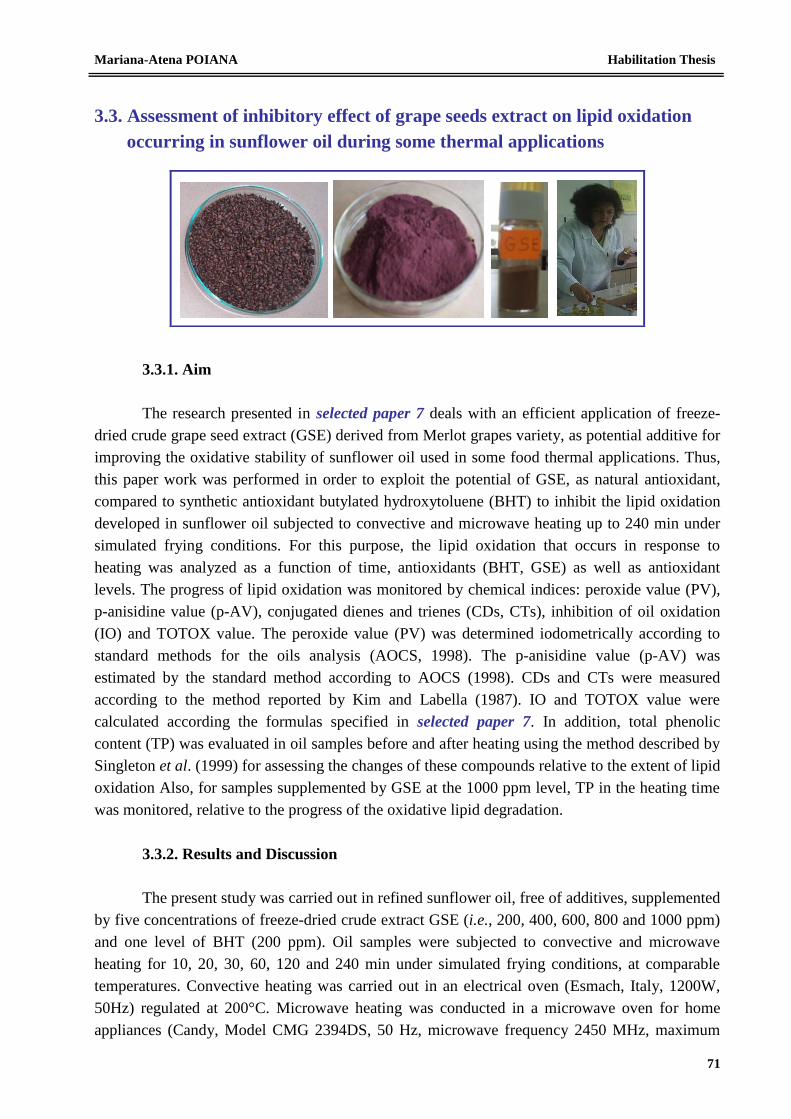
Mariana-Atena POIANA Habilitation Thesis
71
3.3. Assessment of inhibitory effect of grape seeds extract on lipid oxidation
occurring in sunflower oil during some thermal applications
3.3.1. Aim
The research presented in selected paper 7 deals with an efficient application of freeze-
dried crude grape seed extract (GSE) derived from Merlot grapes variety, as potential additive for
improving the oxidative stability of sunflower oil used in some food thermal applications. Thus,
this paper work was performed in order to exploit the potential of GSE, as natural antioxidant,
compared to synthetic antioxidant butylated hydroxytoluene (BHT) to inhibit the lipid oxidation
developed in sunflower oil subjected to convective and microwave heating up to 240 min under
simulated frying conditions. For this purpose, the lipid oxidation that occurs in response to
heating was analyzed as a function of time, antioxidants (BHT, GSE) as well as antioxidant
levels. The progress of lipid oxidation was monitored by chemical indices: peroxide value (PV),
p-anisidine value (p-AV), conjugated dienes and trienes (CDs, CTs), inhibition of oil oxidation
(IO) and TOTOX value. The peroxide value (PV) was determined iodometrically according to
standard methods for the oils analysis (AOCS, 1998). The p-anisidine value (p-AV) was
estimated by the standard method according to AOCS (1998). CDs and CTs were measured
according to the method reported by Kim and Labella (1987). IO and TOTOX value were
calculated according the formulas specified in selected paper 7. In addition, total phenolic
content (TP) was evaluated in oil samples before and after heating using the method described by
Singleton et al. (1999) for assessing the changes of these compounds relative to the extent of lipid
oxidation Also, for samples supplemented by GSE at the 1000 ppm level, TP in the heating time
was monitored, relative to the progress of the oxidative lipid degradation.
3.3.2. Results and Discussion
The present study was carried out in refined sunflower oil, free of additives, supplemented
by five concentrations of freeze-dried crude extract GSE (i.e., 200, 400, 600, 800 and 1000 ppm)
and one level of BHT (200 ppm). Oil samples were subjected to convective and microwave
heating for 10, 20, 30, 60, 120 and 240 min under simulated frying conditions, at comparable
temperatures. Convective heating was carried out in an electrical oven (Esmach, Italy, 1200W,
50Hz) regulated at 200°C. Microwave heating was conducted in a microwave oven for home
appliances (Candy, Model CMG 2394DS, 50 Hz, microwave frequency 2450 MHz, maximum
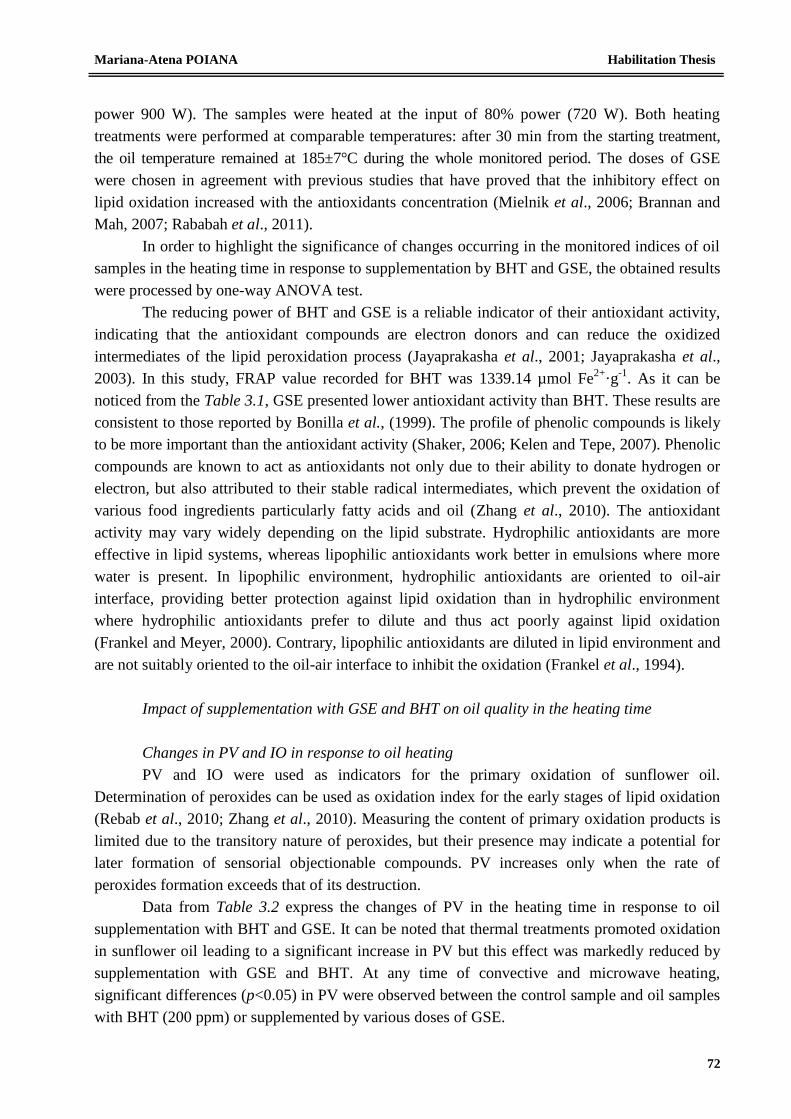
Mariana-Atena POIANA Habilitation Thesis
72
power 900 W). The samples were heated at the input of 80% power (720 W). Both heating
treatments were performed at comparable temperatures: after 30 min from the starting treatment,
the oil temperature remained at 185±7°C during the whole monitored period. The doses of GSE
were chosen in agreement with previous studies that have proved that the inhibitory effect on
lipid oxidation increased with the antioxidants concentration (Mielnik et al., 2006; Brannan and
Mah, 2007; Rababah et al., 2011).
In order to highlight the significance of changes occurring in the monitored indices of oil
samples in the heating time in response to supplementation by BHT and GSE, the obtained results
were processed by one-way ANOVA test.
The reducing power of BHT and GSE is a reliable indicator of their antioxidant activity,
indicating that the antioxidant compounds are electron donors and can reduce the oxidized
intermediates of the lipid peroxidation process (Jayaprakasha et al., 2001; Jayaprakasha et al.,
2003). In this study, FRAP value recorded for BHT was 1339.14 µmol Fe2+
·g-1
. As it can be
noticed from the Table 3.1, GSE presented lower antioxidant activity than BHT. These results are
consistent to those reported by Bonilla et al., (1999). The profile of phenolic compounds is likely
to be more important than the antioxidant activity (Shaker, 2006; Kelen and Tepe, 2007). Phenolic
compounds are known to act as antioxidants not only due to their ability to donate hydrogen or
electron, but also attributed to their stable radical intermediates, which prevent the oxidation of
various food ingredients particularly fatty acids and oil (Zhang et al., 2010). The antioxidant
activity may vary widely depending on the lipid substrate. Hydrophilic antioxidants are more
effective in lipid systems, whereas lipophilic antioxidants work better in emulsions where more
water is present. In lipophilic environment, hydrophilic antioxidants are oriented to oil-air
interface, providing better protection against lipid oxidation than in hydrophilic environment
where hydrophilic antioxidants prefer to dilute and thus act poorly against lipid oxidation
(Frankel and Meyer, 2000). Contrary, lipophilic antioxidants are diluted in lipid environment and
are not suitably oriented to the oil-air interface to inhibit the oxidation (Frankel et al., 1994).
Impact of supplementation with GSE and BHT on oil quality in the heating time
Changes in PV and IO in response to oil heating
PV and IO were used as indicators for the primary oxidation of sunflower oil.
Determination of peroxides can be used as oxidation index for the early stages of lipid oxidation
(Rebab et al., 2010; Zhang et al., 2010). Measuring the content of primary oxidation products is
limited due to the transitory nature of peroxides, but their presence may indicate a potential for
later formation of sensorial objectionable compounds. PV increases only when the rate of
peroxides formation exceeds that of its destruction.
Data from Table 3.2 express the changes of PV in the heating time in response to oil
supplementation with BHT and GSE. It can be noted that thermal treatments promoted oxidation
in sunflower oil leading to a significant increase in PV but this effect was markedly reduced by
supplementation with GSE and BHT. At any time of convective and microwave heating,
significant differences (p<0.05) in PV were observed between the control sample and oil samples
with BHT (200 ppm) or supplemented by various doses of GSE.
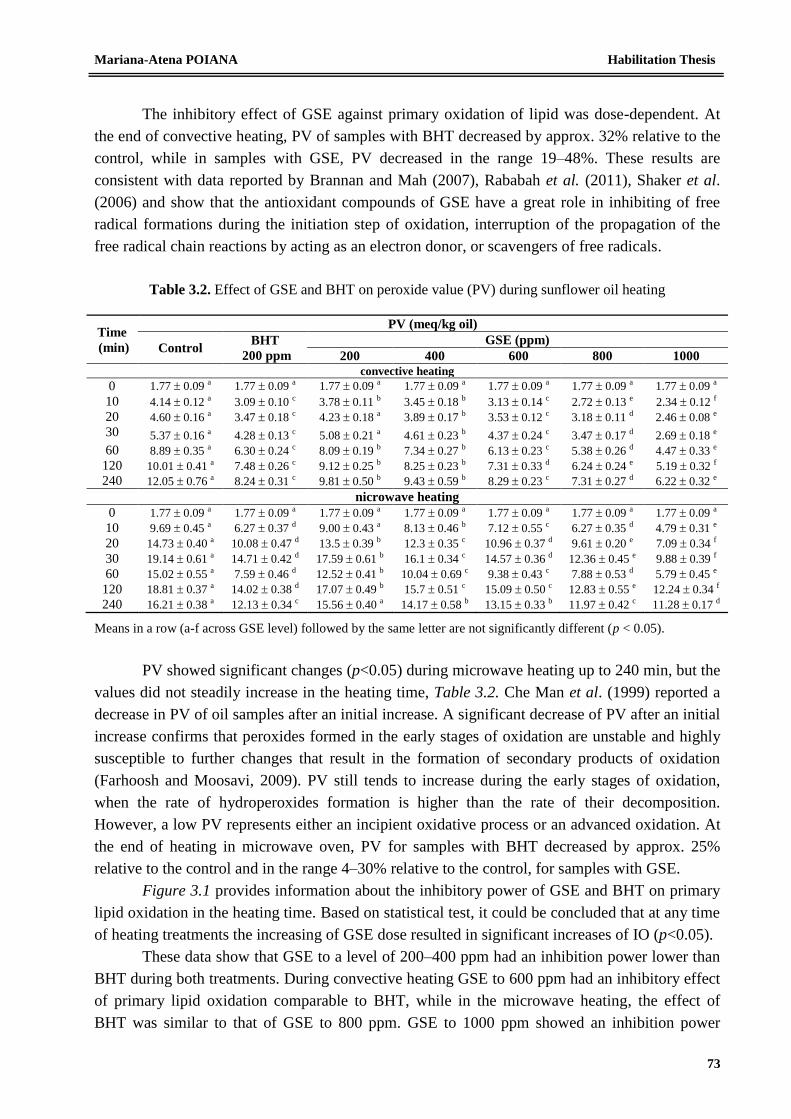
Mariana-Atena POIANA Habilitation Thesis
73
The inhibitory effect of GSE against primary oxidation of lipid was dose-dependent. At
the end of convective heating, PV of samples with BHT decreased by approx. 32% relative to the
control, while in samples with GSE, PV decreased in the range 19–48%. These results are
consistent with data reported by Brannan and Mah (2007), Rababah et al. (2011), Shaker et al.
(2006) and show that the antioxidant compounds of GSE have a great role in inhibiting of free
radical formations during the initiation step of oxidation, interruption of the propagation of the
free radical chain reactions by acting as an electron donor, or scavengers of free radicals.
Table 3.2. Effect of GSE and BHT on peroxide value (PV) during sunflower oil heating
Time
(min)
PV (meq/kg oil)
Control BHT
200 ppm
GSE (ppm)
200 400 600 800 1000
convective heating
0 1.77 0.09 a 1.77 0.09 a 1.77 0.09 a 1.77 0.09 a 1.77 0.09 a 1.77 0.09 a 1.77 0.09 a
10 4.14 0.12 a 3.09 0.10 c 3.78 0.11 b 3.45 0.18 b 3.13 0.14 c 2.72 0.13 e 2.34 0.12 f
20 4.60 0.16 a 3.47 0.18 c 4.23 0.18 a 3.89 0.17 b 3.53 0.12 c 3.18 0.11 d 2.46 0.08 e
30 5.37 0.16 a 4.28 0.13 c 5.08 0.21 a 4.61 0.23 b 4.37 0.24 c 3.47 0.17 d 2.69 0.18 e
60 8.89 0.35 a 6.30 0.24 c 8.09 0.19 b 7.34 0.27 b 6.13 0.23 c 5.38 0.26 d 4.47 0.33 e
120 10.01 0.41 a 7.48 0.26 c 9.12 0.25 b 8.25 0.23 b 7.31 0.33 d 6.24 0.24 e 5.19 0.32 f
240 12.05 0.76 a 8.24 0.31 c 9.81 0.50 b 9.43 0.59 b 8.29 0.23 c 7.31 0.27 d 6.22 0.32 e
nicrowave heating
0 1.77 0.09 a 1.77 0.09 a 1.77 0.09 a 1.77 0.09 a 1.77 0.09 a 1.77 0.09 a 1.77 0.09 a
10 9.69 0.45 a 6.27 0.37 d 9.00 0.43 a 8.13 0.46 b 7.12 0.55 c 6.27 0.35 d 4.79 0.31 e
20 14.73 0.40 a 10.08 0.47 d 13.5 0.39 b 12.3 0.35 c 10.96 0.37 d 9.61 0.20 e 7.09 0.34 f
30 19.14 0.61 a 14.71 0.42 d 17.59 0.61 b 16.1 0.34 c 14.57 0.36 d 12.36 0.45 e 9.88 0.39 f
60 15.02 0.55 a 7.59 0.46 d 12.52 0.41 b 10.04 0.69 c 9.38 0.43 c 7.88 0.53 d 5.79 0.45 e
120 18.81 0.37 a 14.02 0.38 d 17.07 0.49 b 15.7 0.51 c 15.09 0.50 c 12.83 0.55 e 12.24 0.34 f
240 16.21 0.38 a 12.13 0.34 c 15.56 0.40 a 14.17 0.58 b 13.15 0.33 b 11.97 0.42 c 11.28 0.17 d
Means in a row (a-f across GSE level) followed by the same letter are not significantly different (p < 0.05).
PV showed significant changes (p<0.05) during microwave heating up to 240 min, but the
values did not steadily increase in the heating time, Table 3.2. Che Man et al. (1999) reported a
decrease in PV of oil samples after an initial increase. A significant decrease of PV after an initial
increase confirms that peroxides formed in the early stages of oxidation are unstable and highly
susceptible to further changes that result in the formation of secondary products of oxidation
(Farhoosh and Moosavi, 2009). PV still tends to increase during the early stages of oxidation,
when the rate of hydroperoxides formation is higher than the rate of their decomposition.
However, a low PV represents either an incipient oxidative process or an advanced oxidation. At
the end of heating in microwave oven, PV for samples with BHT decreased by approx. 25%
relative to the control and in the range 4–30% relative to the control, for samples with GSE.
Figure 3.1 provides information about the inhibitory power of GSE and BHT on primary
lipid oxidation in the heating time. Based on statistical test, it could be concluded that at any time
of heating treatments the increasing of GSE dose resulted in significant increases of IO (p<0.05).
These data show that GSE to a level of 200–400 ppm had an inhibition power lower than
BHT during both treatments. During convective heating GSE to 600 ppm had an inhibitory effect
of primary lipid oxidation comparable to BHT, while in the microwave heating, the effect of
BHT was similar to that of GSE to 800 ppm. GSE to 1000 ppm showed an inhibition power
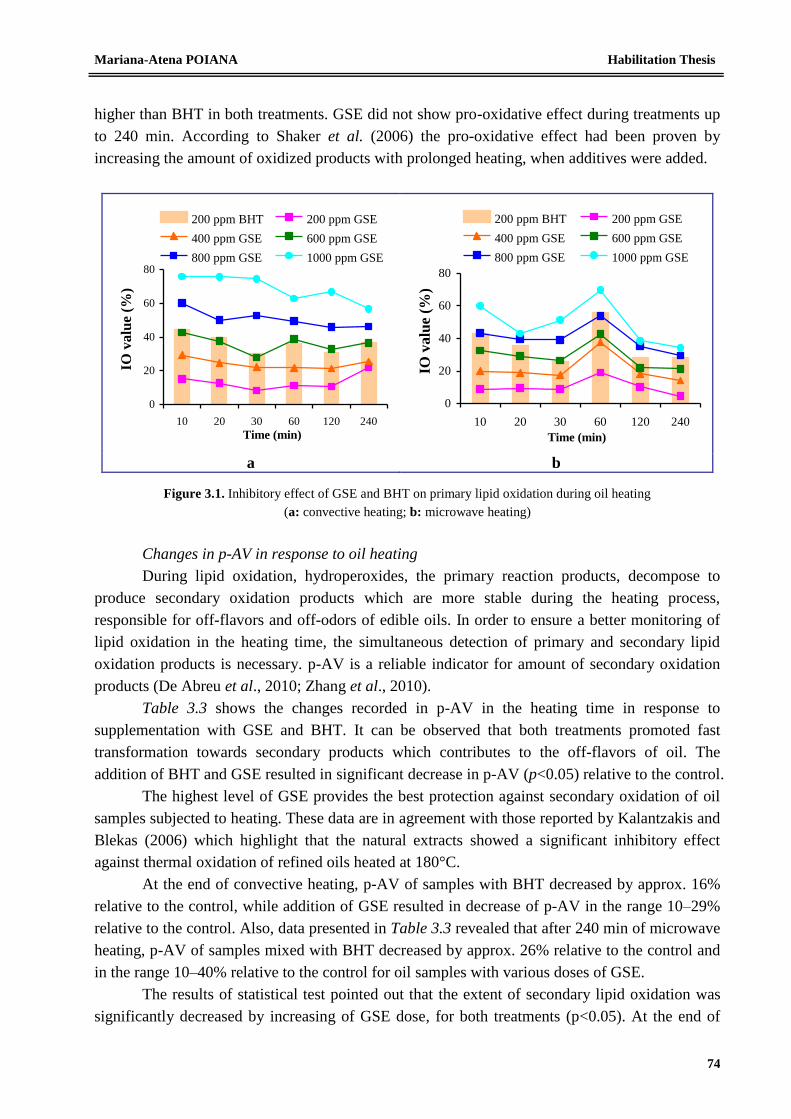
Mariana-Atena POIANA Habilitation Thesis
74
higher than BHT in both treatments. GSE did not show pro-oxidative effect during treatments up
to 240 min. According to Shaker et al. (2006) the pro-oxidative effect had been proven by
increasing the amount of oxidized products with prolonged heating, when additives were added.
0
20
40
60
80
10 20 30 60 120 240
Time (min)
IO v
alu
e (%
)
200 ppm BHT 200 ppm GSE
400 ppm GSE 600 ppm GSE
800 ppm GSE 1000 ppm GSE
0
20
40
60
80
10 20 30 60 120 240
Time (min)IO
va
lue
(%)
200 ppm BHT 200 ppm GSE
400 ppm GSE 600 ppm GSE
800 ppm GSE 1000 ppm GSE
a b
Figure 3.1. Inhibitory effect of GSE and BHT on primary lipid oxidation during oil heating
(a: convective heating; b: microwave heating)
Changes in p-AV in response to oil heating
During lipid oxidation, hydroperoxides, the primary reaction products, decompose to
produce secondary oxidation products which are more stable during the heating process,
responsible for off-flavors and off-odors of edible oils. In order to ensure a better monitoring of
lipid oxidation in the heating time, the simultaneous detection of primary and secondary lipid
oxidation products is necessary. p-AV is a reliable indicator for amount of secondary oxidation
products (De Abreu et al., 2010; Zhang et al., 2010).
Table 3.3 shows the changes recorded in p-AV in the heating time in response to
supplementation with GSE and BHT. It can be observed that both treatments promoted fast
transformation towards secondary products which contributes to the off-flavors of oil. The
addition of BHT and GSE resulted in significant decrease in p-AV (p<0.05) relative to the control.
The highest level of GSE provides the best protection against secondary oxidation of oil
samples subjected to heating. These data are in agreement with those reported by Kalantzakis and
Blekas (2006) which highlight that the natural extracts showed a significant inhibitory effect
against thermal oxidation of refined oils heated at 180°C.
At the end of convective heating, p-AV of samples with BHT decreased by approx. 16%
relative to the control, while addition of GSE resulted in decrease of p-AV in the range 10–29%
relative to the control. Also, data presented in Table 3.3 revealed that after 240 min of microwave
heating, p-AV of samples mixed with BHT decreased by approx. 26% relative to the control and
in the range 10–40% relative to the control for oil samples with various doses of GSE.
The results of statistical test pointed out that the extent of secondary lipid oxidation was
significantly decreased by increasing of GSE dose, for both treatments (p<0.05). At the end of
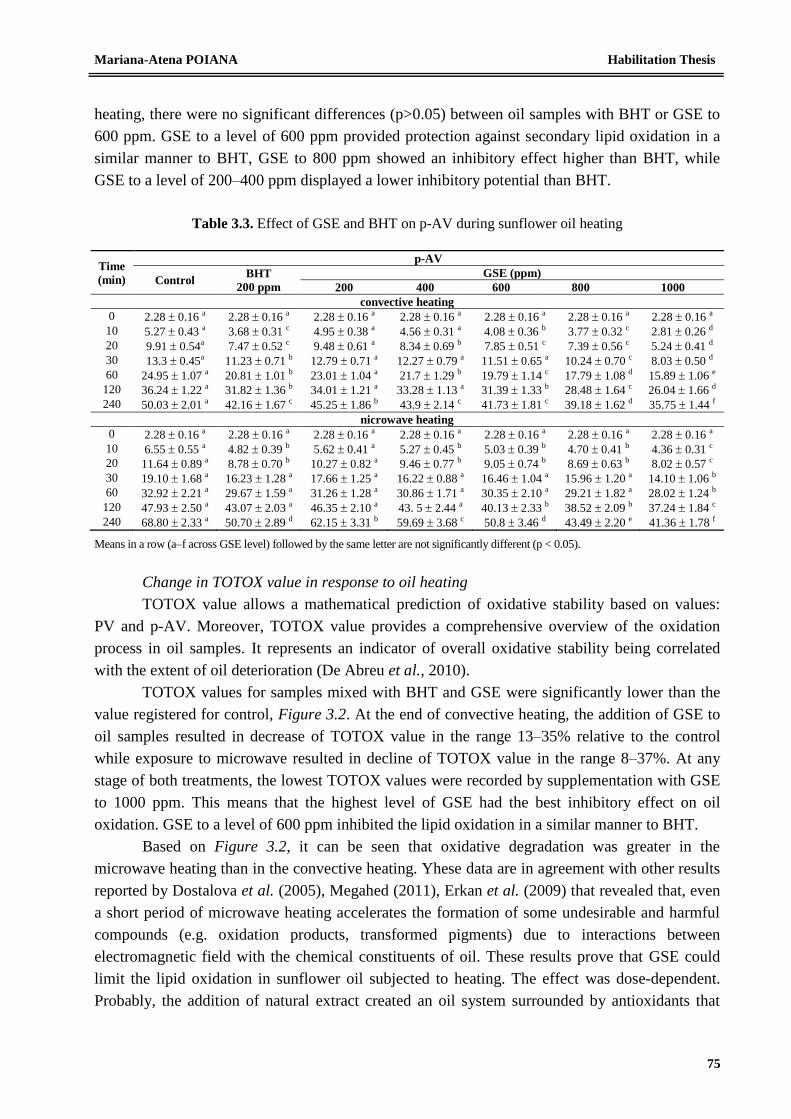
Mariana-Atena POIANA Habilitation Thesis
75
heating, there were no significant differences (p>0.05) between oil samples with BHT or GSE to
600 ppm. GSE to a level of 600 ppm provided protection against secondary lipid oxidation in a
similar manner to BHT, GSE to 800 ppm showed an inhibitory effect higher than BHT, while
GSE to a level of 200–400 ppm displayed a lower inhibitory potential than BHT.
Table 3.3. Effect of GSE and BHT on p-AV during sunflower oil heating
Time
(min)
p-AV
Control BHT
200 ppm
GSE (ppm)
200 400 600 800 1000
convective heating
0 2.28 0.16 a 2.28 0.16 a 2.28 0.16 a 2.28 0.16 a 2.28 0.16 a 2.28 0.16 a 2.28 0.16 a
10 5.27 0.43 a 3.68 0.31 c 4.95 0.38 a 4.56 0.31 a 4.08 0.36 b 3.77 0.32 c 2.81 0.26 d
20 9.91 0.54a 7.47 0.52 c 9.48 0.61 a 8.34 0.69 b 7.85 0.51 c 7.39 0.56 c 5.24 0.41 d
30 13.3 0.45a 11.23 0.71 b 12.79 0.71 a 12.27 0.79 a 11.51 0.65 a 10.24 0.70 c 8.03 0.50 d
60 24.95 1.07 a 20.81 1.01 b 23.01 1.04 a 21.7 1.29 b 19.79 1.14 c 17.79 1.08 d 15.89 1.06 e
120 36.24 1.22 a 31.82 1.36 b 34.01 1.21 a 33.28 1.13 a 31.39 1.33 b 28.48 1.64 c 26.04 1.66 d
240 50.03 2.01 a 42.16 1.67 c 45.25 1.86 b 43.9 2.14 c 41.73 1.81 c 39.18 1.62 d 35.75 1.44 f
nicrowave heating
0 2.28 0.16 a 2.28 0.16 a 2.28 0.16 a 2.28 0.16 a 2.28 0.16 a 2.28 0.16 a 2.28 0.16 a
10 6.55 0.55 a 4.82 0.39 b 5.62 0.41 a 5.27 0.45 b 5.03 0.39 b 4.70 0.41 b 4.36 0.31 c
20 11.64 0.89 a 8.78 0.70 b 10.27 0.82 a 9.46 0.77 b 9.05 0.74 b 8.69 0.63 b 8.02 0.57 c
30 19.10 1.68 a 16.23 1.28 a 17.66 1.25 a 16.22 0.88 a 16.46 1.04 a 15.96 1.20 a 14.10 1.06 b
60 32.92 2.21 a 29.67 1.59 a 31.26 1.28 a 30.86 1.71 a 30.35 2.10 a 29.21 1.82 a 28.02 1.24 b
120 47.93 2.50 a 43.07 2.03 a 46.35 2.10 a 43. 5 2.44 a 40.13 2.33 b 38.52 2.09 b 37.24 1.84 c
240 68.80 2.33 a 50.70 2.89 d 62.15 3.31 b 59.69 3.68 c 50.8 3.46 d 43.49 2.20 e 41.36 1.78 f
Means in a row (a–f across GSE level) followed by the same letter are not significantly different (p < 0.05).
Change in TOTOX value in response to oil heating
TOTOX value allows a mathematical prediction of oxidative stability based on values:
PV and p-AV. Moreover, TOTOX value provides a comprehensive overview of the oxidation
process in oil samples. It represents an indicator of overall oxidative stability being correlated
with the extent of oil deterioration (De Abreu et al., 2010).
TOTOX values for samples mixed with BHT and GSE were significantly lower than the
value registered for control, Figure 3.2. At the end of convective heating, the addition of GSE to
oil samples resulted in decrease of TOTOX value in the range 13–35% relative to the control
while exposure to microwave resulted in decline of TOTOX value in the range 8–37%. At any
stage of both treatments, the lowest TOTOX values were recorded by supplementation with GSE
to 1000 ppm. This means that the highest level of GSE had the best inhibitory effect on oil
oxidation. GSE to a level of 600 ppm inhibited the lipid oxidation in a similar manner to BHT.
Based on Figure 3.2, it can be seen that oxidative degradation was greater in the
microwave heating than in the convective heating. Yhese data are in agreement with other results
reported by Dostalova et al. (2005), Megahed (2011), Erkan et al. (2009) that revealed that, even
a short period of microwave heating accelerates the formation of some undesirable and harmful
compounds (e.g. oxidation products, transformed pigments) due to interactions between
electromagnetic field with the chemical constituents of oil. These results prove that GSE could
limit the lipid oxidation in sunflower oil subjected to heating. The effect was dose-dependent.
Probably, the addition of natural extract created an oil system surrounded by antioxidants that
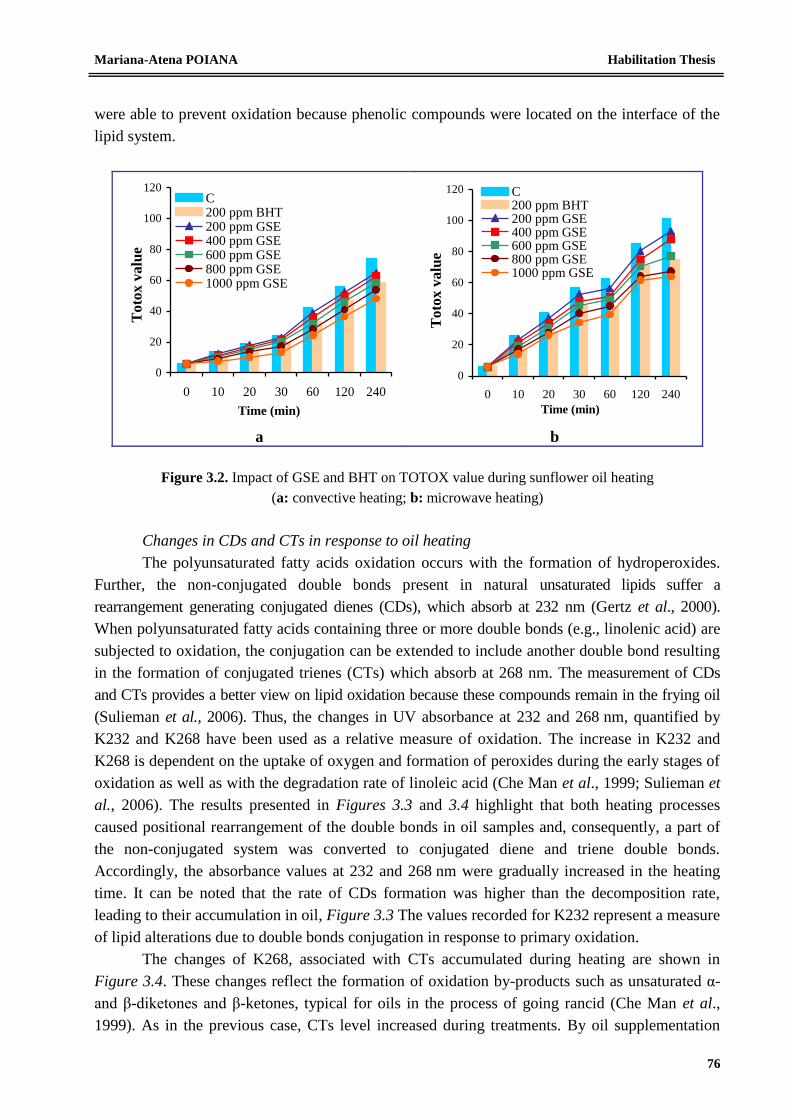
Mariana-Atena POIANA Habilitation Thesis
76
were able to prevent oxidation because phenolic compounds were located on the interface of the
lipid system.
0
20
40
60
80
100
120
0 10 20 30 60 120 240
Time (min)
Toto
x v
alu
e
C200 ppm BHT200 ppm GSE400 ppm GSE600 ppm GSE800 ppm GSE1000 ppm GSE
0
20
40
60
80
100
120
0 10 20 30 60 120 240
Time (min)
Toto
x v
alu
e
C200 ppm BHT200 ppm GSE400 ppm GSE600 ppm GSE800 ppm GSE1000 ppm GSE
a b
Figure 3.2. Impact of GSE and BHT on TOTOX value during sunflower oil heating
(a: convective heating; b: microwave heating)
Changes in CDs and CTs in response to oil heating
The polyunsaturated fatty acids oxidation occurs with the formation of hydroperoxides.
Further, the non-conjugated double bonds present in natural unsaturated lipids suffer a
rearrangement generating conjugated dienes (CDs), which absorb at 232 nm (Gertz et al., 2000).
When polyunsaturated fatty acids containing three or more double bonds (e.g., linolenic acid) are
subjected to oxidation, the conjugation can be extended to include another double bond resulting
in the formation of conjugated trienes (CTs) which absorb at 268 nm. The measurement of CDs
and CTs provides a better view on lipid oxidation because these compounds remain in the frying oil
(Sulieman et al., 2006). Thus, the changes in UV absorbance at 232 and 268 nm, quantified by
K232 and K268 have been used as a relative measure of oxidation. The increase in K232 and
K268 is dependent on the uptake of oxygen and formation of peroxides during the early stages of
oxidation as well as with the degradation rate of linoleic acid (Che Man et al., 1999; Sulieman et
al., 2006). The results presented in Figures 3.3 and 3.4 highlight that both heating processes
caused positional rearrangement of the double bonds in oil samples and, consequently, a part of
the non-conjugated system was converted to conjugated diene and triene double bonds.
Accordingly, the absorbance values at 232 and 268 nm were gradually increased in the heating
time. It can be noted that the rate of CDs formation was higher than the decomposition rate,
leading to their accumulation in oil, Figure 3.3 The values recorded for K232 represent a measure
of lipid alterations due to double bonds conjugation in response to primary oxidation.
The changes of K268, associated with CTs accumulated during heating are shown in
Figure 3.4. These changes reflect the formation of oxidation by-products such as unsaturated α-
and β-diketones and β-ketones, typical for oils in the process of going rancid (Che Man et al.,
1999). As in the previous case, CTs level increased during treatments. By oil supplementation
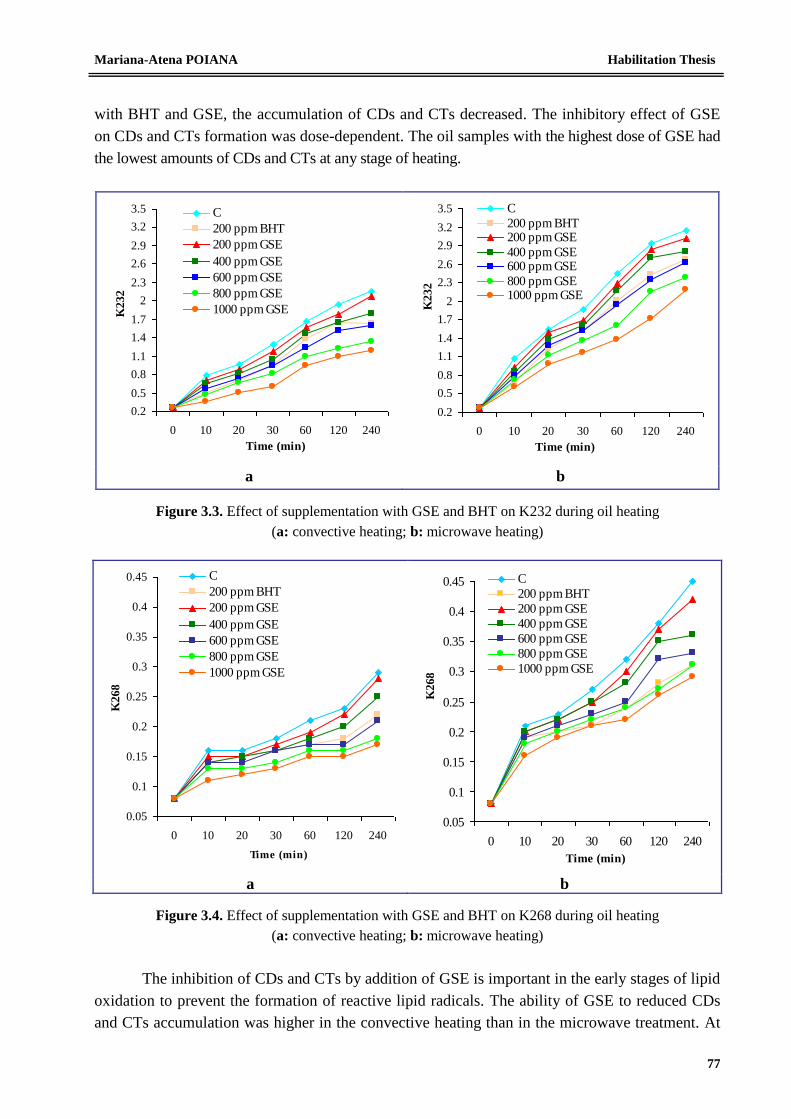
Mariana-Atena POIANA Habilitation Thesis
77
with BHT and GSE, the accumulation of CDs and CTs decreased. The inhibitory effect of GSE
on CDs and CTs formation was dose-dependent. The oil samples with the highest dose of GSE had
the lowest amounts of CDs and CTs at any stage of heating.
Figure 3.3. Effect of supplementation with GSE and BHT on K232 during oil heating
(a: convective heating; b: microwave heating)
0.05
0.1
0.15
0.2
0.25
0.3
0.35
0.4
0.45
0 10 20 30 60 120 240
Time (min)
K268
C
200 ppm BHT
200 ppm GSE
400 ppm GSE
600 ppm GSE
800 ppm GSE
1000 ppm GSE
0.05
0.1
0.15
0.2
0.25
0.3
0.35
0.4
0.45
0 10 20 30 60 120 240
Time (min)
K268
C
200 ppm BHT
200 ppm GSE
400 ppm GSE
600 ppm GSE
800 ppm GSE
1000 ppm GSE
a b
Figure 3.4. Effect of supplementation with GSE and BHT on K268 during oil heating
(a: convective heating; b: microwave heating)
The inhibition of CDs and CTs by addition of GSE is important in the early stages of lipid
oxidation to prevent the formation of reactive lipid radicals. The ability of GSE to reduced CDs
and CTs accumulation was higher in the convective heating than in the microwave treatment. At
0.2
0.5
0.8
1.1
1.4
1.7
2
2.3
2.6
2.9
3.2
3.5
0 10 20 30 60 120 240
Time (min)
K232
C
200 ppm BHT
200 ppm GSE
400 ppm GSE
600 ppm GSE
800 ppm GSE
1000 ppm GSE
0.2
0.5
0.8
1.1
1.4
1.7
2
2.3
2.6
2.9
3.2
3.5
0 10 20 30 60 120 240
Time (min)
K232
C
200 ppm BHT200 ppm GSE
400 ppm GSE600 ppm GSE
800 ppm GSE1000 ppm GSE
a b
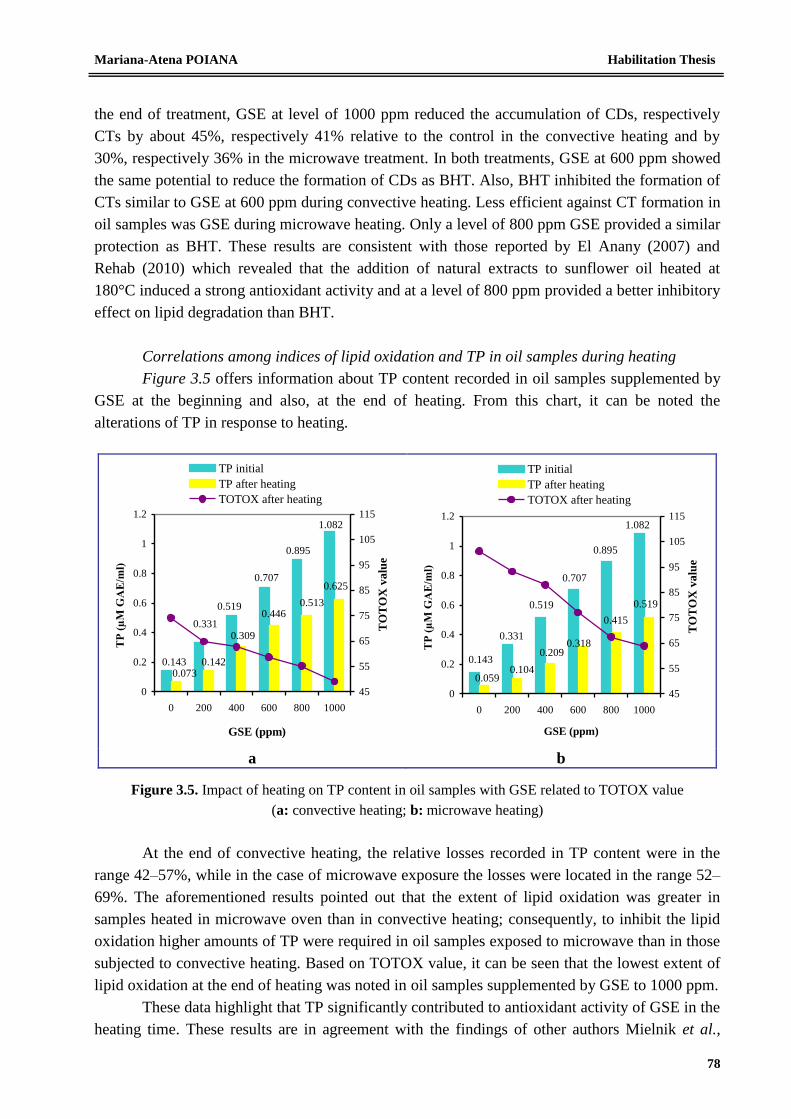
Mariana-Atena POIANA Habilitation Thesis
78
the end of treatment, GSE at level of 1000 ppm reduced the accumulation of CDs, respectively
CTs by about 45%, respectively 41% relative to the control in the convective heating and by
30%, respectively 36% in the microwave treatment. In both treatments, GSE at 600 ppm showed
the same potential to reduce the formation of CDs as BHT. Also, BHT inhibited the formation of
CTs similar to GSE at 600 ppm during convective heating. Less efficient against CT formation in
oil samples was GSE during microwave heating. Only a level of 800 ppm GSE provided a similar
protection as BHT. These results are consistent with those reported by El Anany (2007) and
Rehab (2010) which revealed that the addition of natural extracts to sunflower oil heated at
180°C induced a strong antioxidant activity and at a level of 800 ppm provided a better inhibitory
effect on lipid degradation than BHT.
Correlations among indices of lipid oxidation and TP in oil samples during heating
Figure 3.5 offers information about TP content recorded in oil samples supplemented by
GSE at the beginning and also, at the end of heating. From this chart, it can be noted the
alterations of TP in response to heating.
0.895
0.707
0.519
0.143
1.082
0.331
0.513
0.0730.142
0.309
0.446
0.625
0
0.2
0.4
0.6
0.8
1
1.2
0 200 400 600 800 1000
GSE (ppm)
TP
(µ
M G
AE
/ml)
45
55
65
75
85
95
105
115
TO
TO
X v
alu
e
TP initial
TP after heating
TOTOX after heating
0.415
0.895
0.707
0.519
0.143
1.082
0.331
0.0590.104
0.2090.318
0.519
0
0.2
0.4
0.6
0.8
1
1.2
0 200 400 600 800 1000
GSE (ppm)
TP
(µ
M G
AE
/ml)
45
55
65
75
85
95
105
115
TO
TO
X v
alu
e
TP initial
TP after heating
TOTOX after heating
a b
Figure 3.5. Impact of heating on TP content in oil samples with GSE related to TOTOX value
(a: convective heating; b: microwave heating)
At the end of convective heating, the relative losses recorded in TP content were in the
range 42–57%, while in the case of microwave exposure the losses were located in the range 52–
69%. The aforementioned results pointed out that the extent of lipid oxidation was greater in
samples heated in microwave oven than in convective heating; consequently, to inhibit the lipid
oxidation higher amounts of TP were required in oil samples exposed to microwave than in those
subjected to convective heating. Based on TOTOX value, it can be seen that the lowest extent of
lipid oxidation at the end of heating was noted in oil samples supplemented by GSE to 1000 ppm.
These data highlight that TP significantly contributed to antioxidant activity of GSE in the
heating time. These results are in agreement with the findings of other authors Mielnik et al.,
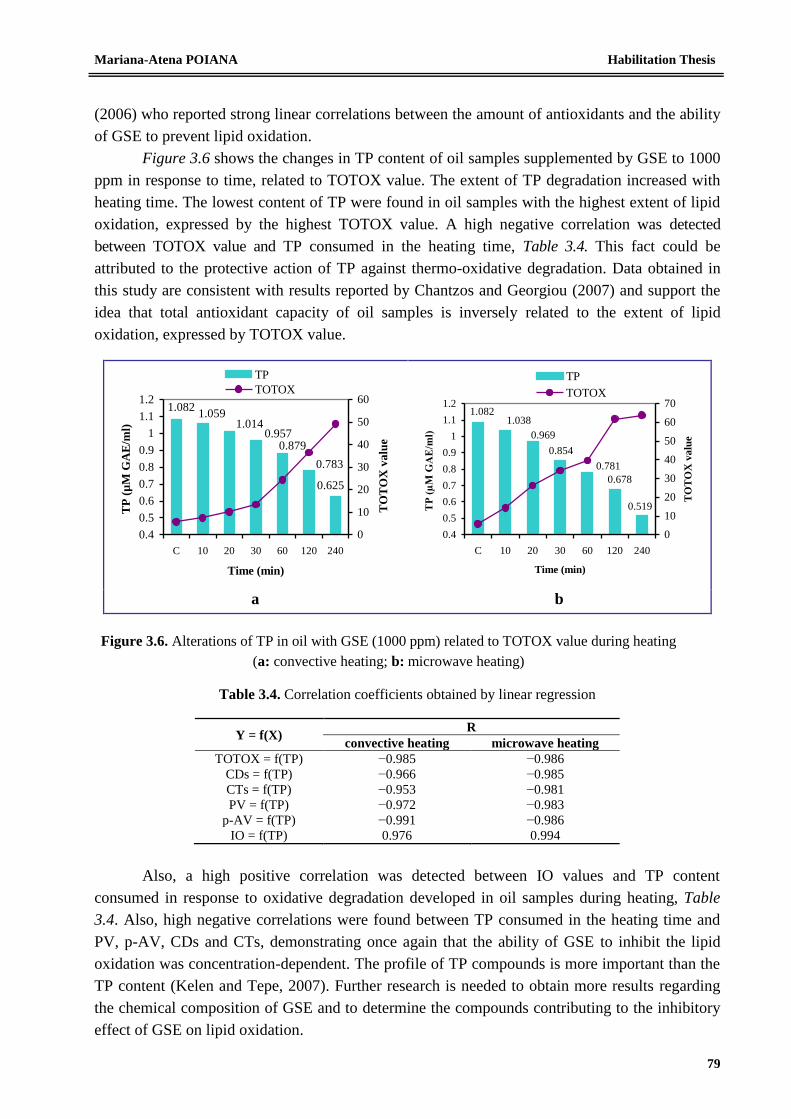
Mariana-Atena POIANA Habilitation Thesis
79
(2006) who reported strong linear correlations between the amount of antioxidants and the ability
of GSE to prevent lipid oxidation.
Figure 3.6 shows the changes in TP content of oil samples supplemented by GSE to 1000
ppm in response to time, related to TOTOX value. The extent of TP degradation increased with
heating time. The lowest content of TP were found in oil samples with the highest extent of lipid
oxidation, expressed by the highest TOTOX value. A high negative correlation was detected
between TOTOX value and TP consumed in the heating time, Table 3.4. This fact could be
attributed to the protective action of TP against thermo-oxidative degradation. Data obtained in
this study are consistent with results reported by Chantzos and Georgiou (2007) and support the
idea that total antioxidant capacity of oil samples is inversely related to the extent of lipid
oxidation, expressed by TOTOX value.
1.059
0.783
1.082
1.0140.957
0.879
0.625
0.4
0.5
0.6
0.7
0.8
0.9
1
1.1
1.2
C 10 20 30 60 120 240
Time (min)
TP
(µ
M G
AE
/ml)
0
10
20
30
40
50
60
TO
TO
X v
alu
eTP
TOTOX
1.038
0.678
1.082
0.969
0.854
0.781
0.519
0.4
0.5
0.6
0.7
0.8
0.9
1
1.1
1.2
C 10 20 30 60 120 240
Time (min)
TP
(µ
M G
AE
/ml)
0
10
20
30
40
50
60
70
TO
TO
X v
alu
e
TP
TOTOX
a b
Figure 3.6. Alterations of TP in oil with GSE (1000 ppm) related to TOTOX value during heating
(a: convective heating; b: microwave heating)
Table 3.4. Correlation coefficients obtained by linear regression
Y = f(X) R
convective heating microwave heating
TOTOX = f(TP) −0.985 −0.986
CDs = f(TP) −0.966 −0.985
CTs = f(TP) −0.953 −0.981
PV = f(TP) −0.972 −0.983
p-AV = f(TP) −0.991 −0.986
IO = f(TP) 0.976 0.994
Also, a high positive correlation was detected between IO values and TP content
consumed in response to oxidative degradation developed in oil samples during heating, Table
3.4. Also, high negative correlations were found between TP consumed in the heating time and
PV, p-AV, CDs and CTs, demonstrating once again that the ability of GSE to inhibit the lipid
oxidation was concentration-dependent. The profile of TP compounds is more important than the
TP content (Kelen and Tepe, 2007). Further research is needed to obtain more results regarding
the chemical composition of GSE and to determine the compounds contributing to the inhibitory
effect of GSE on lipid oxidation.
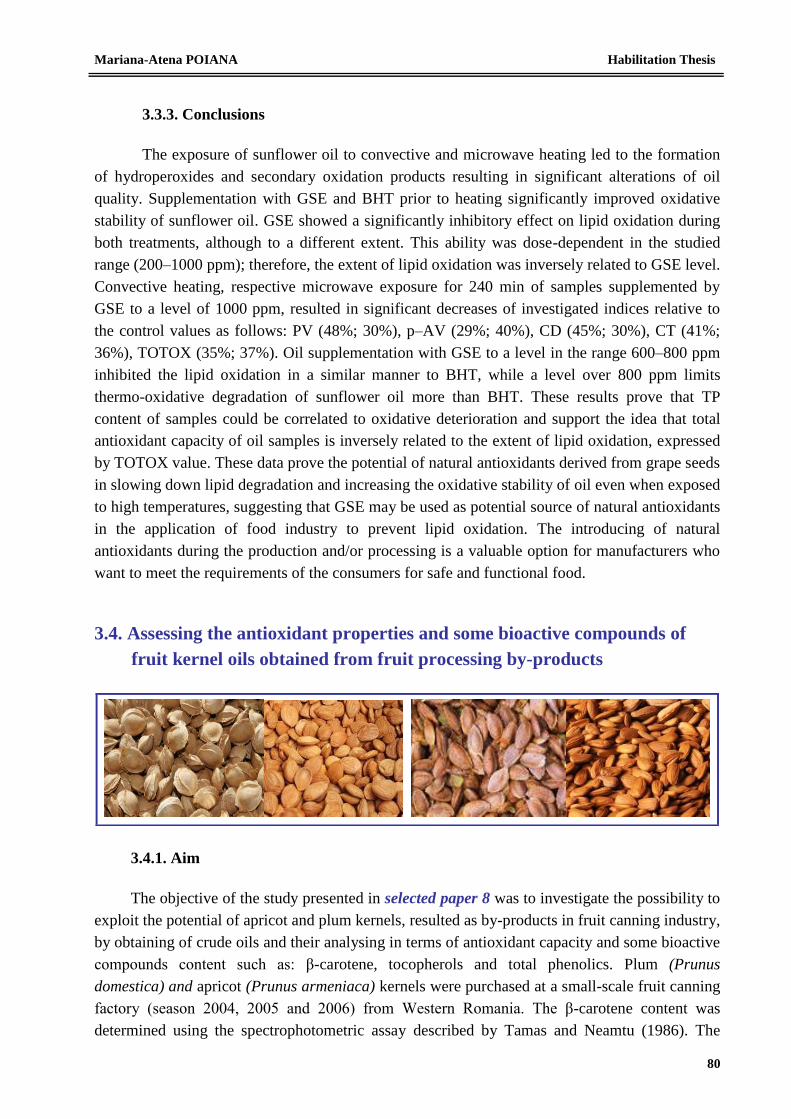
Mariana-Atena POIANA Habilitation Thesis
80
3.3.3. Conclusions
The exposure of sunflower oil to convective and microwave heating led to the formation
of hydroperoxides and secondary oxidation products resulting in significant alterations of oil
quality. Supplementation with GSE and BHT prior to heating significantly improved oxidative
stability of sunflower oil. GSE showed a significantly inhibitory effect on lipid oxidation during
both treatments, although to a different extent. This ability was dose-dependent in the studied
range (200–1000 ppm); therefore, the extent of lipid oxidation was inversely related to GSE level.
Convective heating, respective microwave exposure for 240 min of samples supplemented by
GSE to a level of 1000 ppm, resulted in significant decreases of investigated indices relative to
the control values as follows: PV (48%; 30%), p–AV (29%; 40%), CD (45%; 30%), CT (41%;
36%), TOTOX (35%; 37%). Oil supplementation with GSE to a level in the range 600–800 ppm
inhibited the lipid oxidation in a similar manner to BHT, while a level over 800 ppm limits
thermo-oxidative degradation of sunflower oil more than BHT. These results prove that TP
content of samples could be correlated to oxidative deterioration and support the idea that total
antioxidant capacity of oil samples is inversely related to the extent of lipid oxidation, expressed
by TOTOX value. These data prove the potential of natural antioxidants derived from grape seeds
in slowing down lipid degradation and increasing the oxidative stability of oil even when exposed
to high temperatures, suggesting that GSE may be used as potential source of natural antioxidants
in the application of food industry to prevent lipid oxidation. The introducing of natural
antioxidants during the production and/or processing is a valuable option for manufacturers who
want to meet the requirements of the consumers for safe and functional food.
3.4. Assessing the antioxidant properties and some bioactive compounds of
fruit kernel oils obtained from fruit processing by-products
3.4.1. Aim
The objective of the study presented in selected paper 8 was to investigate the possibility to
exploit the potential of apricot and plum kernels, resulted as by-products in fruit canning industry,
by obtaining of crude oils and their analysing in terms of antioxidant capacity and some bioactive
compounds content such as: β-carotene, tocopherols and total phenolics. Plum (Prunus
domestica) and apricot (Prunus armeniaca) kernels were purchased at a small-scale fruit canning
factory (season 2004, 2005 and 2006) from Western Romania. The β-carotene content was
determined using the spectrophotometric assay described by Tamas and Neamtu (1986). The
Mariana-Atena POIANA Habilitation Thesis
81
quantification of α–, β–, γ– and δ–tocopherols (α–T, β–T, γ–T, δ–T) in order to obtain tocopherol
pattern of plum and apricot kernel oil was performed by reversed phase high performance liquid
chromatography (RP-HPLC) with fluorescence detector at 290 nm excitation wavelength and 325
nm emission wavelength. The content of total phenolics (TP) was evaluated by Folin-Ciocalteu
colorimetric method (Singleton et al., 1999) and the antioxidant activity was measured using the
FRAP assay acccording to Benzie and Strain (1986).
In performing of this study the research team was formed by Assist. Dr. Mirela Popa [[email protected]]
, Lecturer dr. Delia Dumbrava [[email protected]]
, Lecturer dr. Diana
Raba[[email protected]]
and Assoc Prof. dr. Calin Jianu[[email protected]]
from Banat’s University of
Agricultural Sciences and Veterinary Medicine (Timisoara) and Prof. dr. Constantin
Bele[[email protected]]
to University of Agricultural Sciences and Veterinary Medicine from Cluj-
Napoca.
3.4.2. Results and discussion
Fruit kernels obtained by manual processing from plums and apricots stones were dried at
70°C for 10 h and then, they were ground and extracted, to obtain crude oil, with petroleum eter
(1:5, m/v) for 3 h. The oil content related to dry basis was 48.73% for plum kernels and 42.09%
for apricot kernels.
Evaluation of β–carotene content from analyzed oil
Results obtained for β–carotene content of investigated oil samples are reported in the
Table 3.5. These data show that β–carotene content depends on the harvest year and fruit species.
It can be observed that the plum kernels oil is richer in β-carotene than the apricot kernels oil.
Table 3.5. β-Caroten content of fruit kernel oil
Tocopherol HPLC pattern of fruit kernel oil
Figure 3.7 shows the HPLC chromatograms of standard α–T (a), δ–T (b) and γ–T (c). The
investigated fruit kernel oils revealed the presence of significant amounts of tocopherols, Figures
3.8 and 3.9.
Concerning the HPLC analysis of tocopherols in vegetable oils, this can be performed
either normal or reversed phase columns, using fluorescent, electrochemical and UV detector.
The normal phase columns provide separation of all tocopherol isomers, while reversed phase
columns (usually C18) are unable to separate the β– and γ– tocopherols (Andres et al., 2011; Bele
et al, 2013). The RP-HPLC method used in our study for tocophenols analysis does not
distinguish between β– and γ–isomers of tocopherol. Thus, the sum of these isomers is shown
throughout this work as β+γ–T.
Harvest year β-caroten content of sample (μg · g
-1)*
plum kernel oil apricot kernel oil
2004 188.65±2.03 61.05±2.08
2005 184.95±1.84 58.35±1.51
2006 191.21±2.13 62.46±2.16 *Each value is expressed as mean ± standard deviation (n = 3).
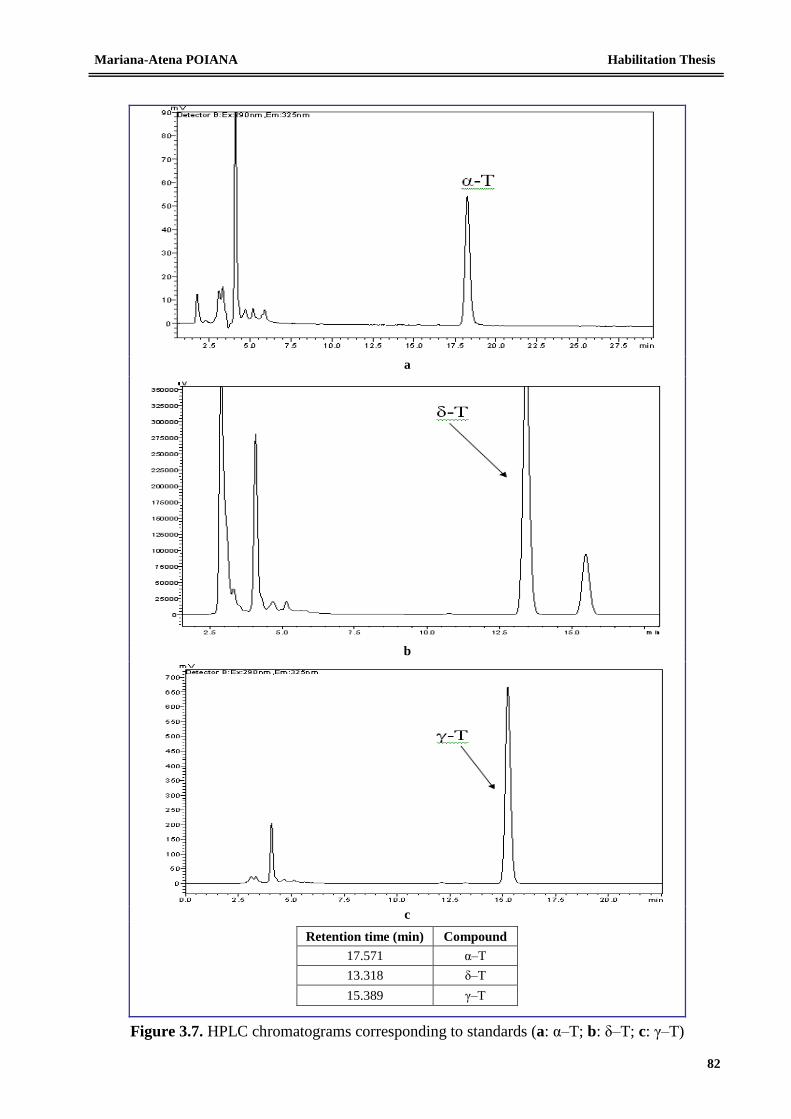
Mariana-Atena POIANA Habilitation Thesis
82
a
b
c
Retention time (min) Compound
17.571 α–T
13.318 δ–T
15.389 γ–T
Figure 3.7. HPLC chromatograms corresponding to standards (a: α–T; b: δ–T; c: γ–T)
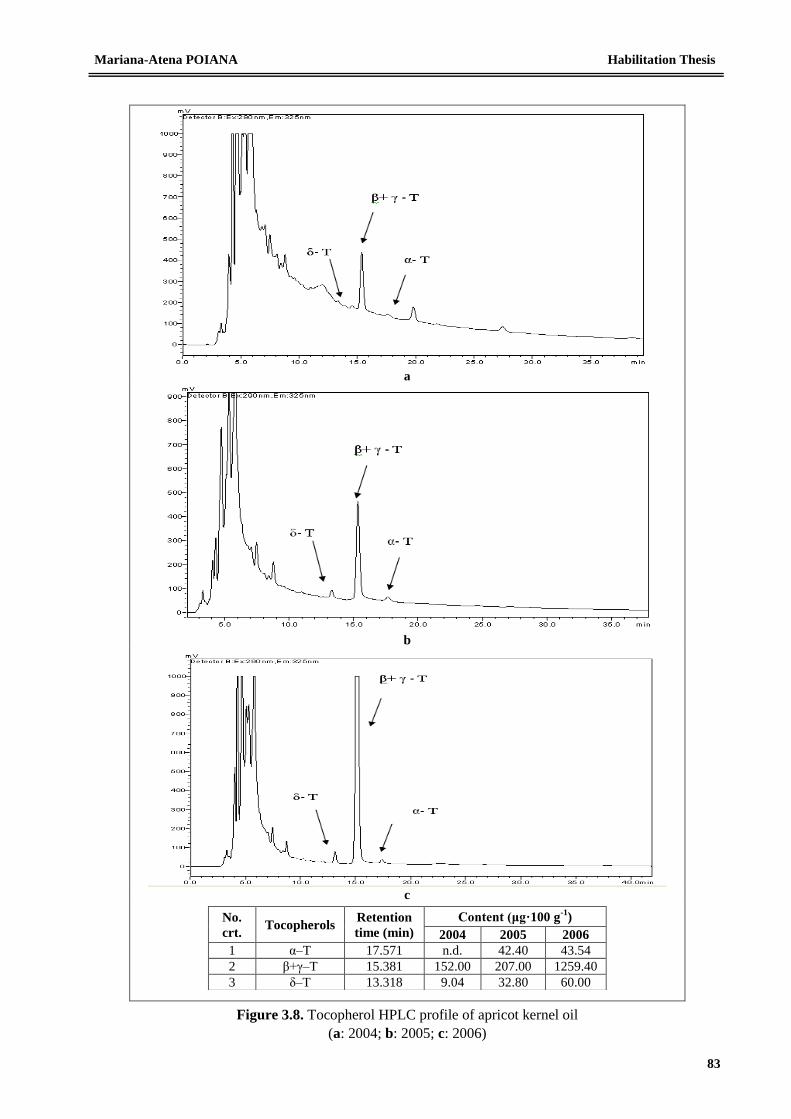
Mariana-Atena POIANA Habilitation Thesis
83
a
b
c
No.
crt. Tocopherols
Retention
time (min)
Content (μg·100 g-1
)
2004 2005 2006
1 α–T 17.571 n.d. 42.40 43.54
2 β+γ–T 15.381 152.00 207.00 1259.40
3 δ–T 13.318 9.04 32.80 60.00
Figure 3.8. Tocopherol HPLC profile of apricot kernel oil
(a: 2004; b: 2005; c: 2006)
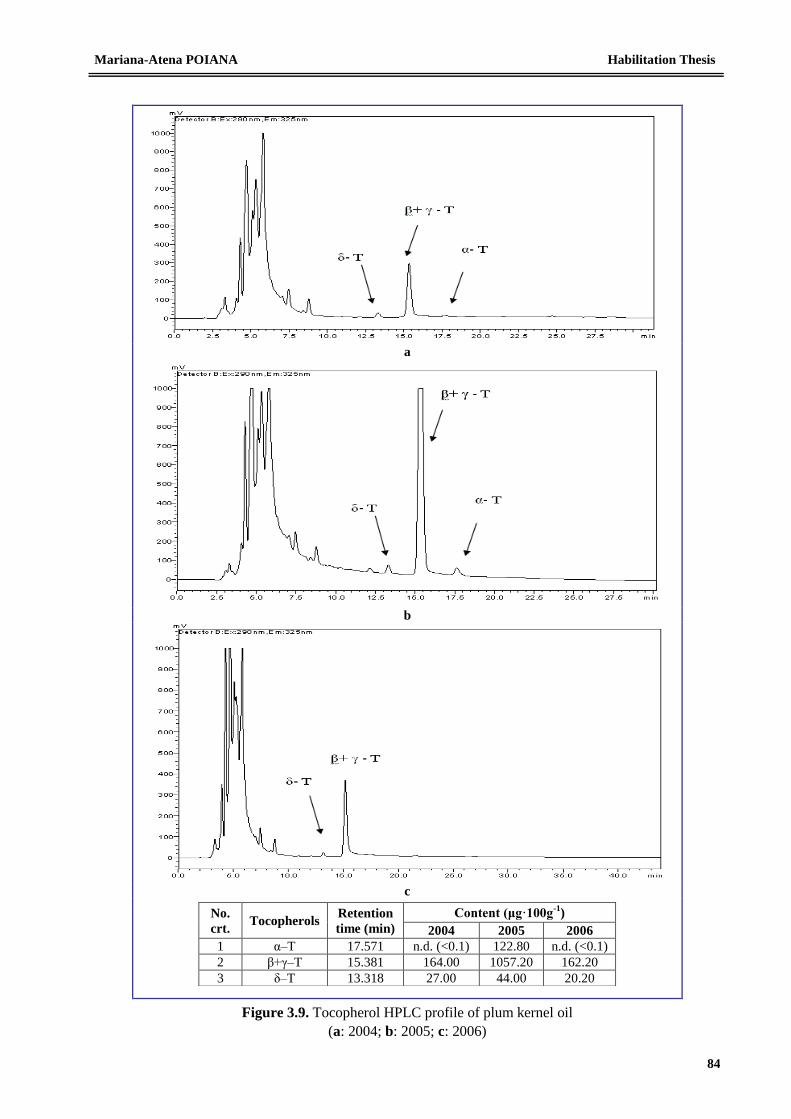
Mariana-Atena POIANA Habilitation Thesis
84
a
b
c
No.
crt. Tocopherols
Retention
time (min)
Content (μg·100g-1
)
2004 2005 2006
1 α–T 17.571 n.d. (<0.1) 122.80 n.d. (<0.1)
2 β+γ–T 15.381 164.00 1057.20 162.20
3 δ–T 13.318 27.00 44.00 20.20
Figure 3.9. Tocopherol HPLC profile of plum kernel oil
(a: 2004; b: 2005; c: 2006)
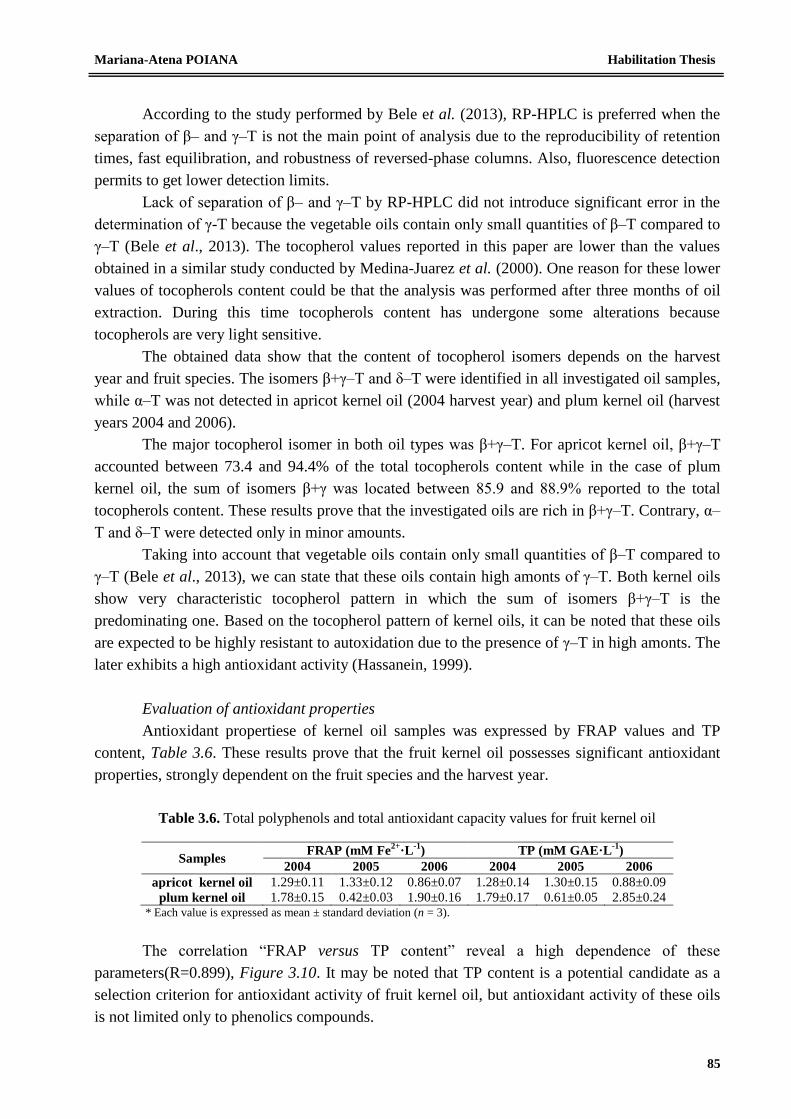
Mariana-Atena POIANA Habilitation Thesis
85
According to the study performed by Bele et al. (2013), RP-HPLC is preferred when the
separation of β– and γ–T is not the main point of analysis due to the reproducibility of retention
times, fast equilibration, and robustness of reversed-phase columns. Also, fluorescence detection
permits to get lower detection limits.
Lack of separation of β– and γ–T by RP-HPLC did not introduce significant error in the
determination of γ-T because the vegetable oils contain only small quantities of β–T compared to
γ–T (Bele et al., 2013). The tocopherol values reported in this paper are lower than the values
obtained in a similar study conducted by Medina-Juarez et al. (2000). One reason for these lower
values of tocopherols content could be that the analysis was performed after three months of oil
extraction. During this time tocopherols content has undergone some alterations because
tocopherols are very light sensitive.
The obtained data show that the content of tocopherol isomers depends on the harvest
year and fruit species. The isomers β+γ–T and δ–T were identified in all investigated oil samples,
while α–T was not detected in apricot kernel oil (2004 harvest year) and plum kernel oil (harvest
years 2004 and 2006).
The major tocopherol isomer in both oil types was β+γ–T. For apricot kernel oil, β+γ–T
accounted between 73.4 and 94.4% of the total tocopherols content while in the case of plum
kernel oil, the sum of isomers β+γ was located between 85.9 and 88.9% reported to the total
tocopherols content. These results prove that the investigated oils are rich in β+γ–T. Contrary, α–
T and δ–T were detected only in minor amounts.
Taking into account that vegetable oils contain only small quantities of β–T compared to
γ–T (Bele et al., 2013), we can state that these oils contain high amonts of γ–T. Both kernel oils
show very characteristic tocopherol pattern in which the sum of isomers β+γ–T is the
predominating one. Based on the tocopherol pattern of kernel oils, it can be noted that these oils
are expected to be highly resistant to autoxidation due to the presence of γ–T in high amonts. The
later exhibits a high antioxidant activity (Hassanein, 1999).
Evaluation of antioxidant properties
Antioxidant propertiese of kernel oil samples was expressed by FRAP values and TP
content, Table 3.6. These results prove that the fruit kernel oil possesses significant antioxidant
properties, strongly dependent on the fruit species and the harvest year.
Table 3.6. Total polyphenols and total antioxidant capacity values for fruit kernel oil
Samples FRAP (mM Fe
2+·L
-1) TP (mM GAE·L
-1)
2004 2005 2006 2004 2005 2006
apricot kernel oil 1.29±0.11 1.33±0.12 0.86±0.07 1.28±0.14 1.30±0.15 0.88±0.09
plum kernel oil 1.78±0.15 0.42±0.03 1.90±0.16 1.79±0.17 0.61±0.05 2.85±0.24 * Each value is expressed as mean ± standard deviation (n = 3).
The correlation “FRAP versus TP content” reveal a high dependence of these
parameters(R=0.899), Figure 3.10. It may be noted that TP content is a potential candidate as a
selection criterion for antioxidant activity of fruit kernel oil, but antioxidant activity of these oils
is not limited only to phenolics compounds.
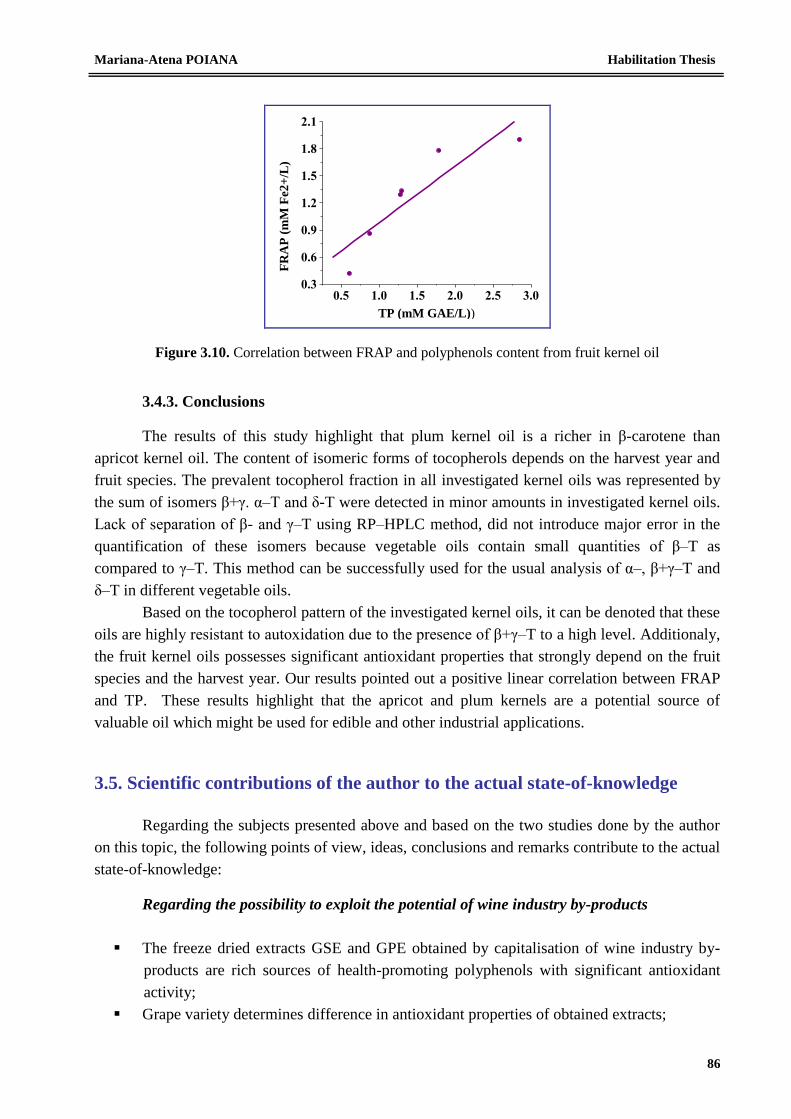
Mariana-Atena POIANA Habilitation Thesis
86
0.5 1.0 1.5 2.0 2.5 3.00.3
0.6
0.9
1.2
1.5
1.8
2.1
FR
AP
(m
M F
e2
+/L
)
TP (mM GAE/L))
Figure 3.10. Correlation between FRAP and polyphenols content from fruit kernel oil
3.4.3. Conclusions
The results of this study highlight that plum kernel oil is a richer in β-carotene than
apricot kernel oil. The content of isomeric forms of tocopherols depends on the harvest year and
fruit species. The prevalent tocopherol fraction in all investigated kernel oils was represented by
the sum of isomers β+γ. α–T and δ-T were detected in minor amounts in investigated kernel oils.
Lack of separation of β- and γ–T using RP–HPLC method, did not introduce major error in the
quantification of these isomers because vegetable oils contain small quantities of β–T as
compared to γ–T. This method can be successfully used for the usual analysis of α–, β+γ–T and
δ–T in different vegetable oils.
Based on the tocopherol pattern of the investigated kernel oils, it can be denoted that these
oils are highly resistant to autoxidation due to the presence of β+γ–T to a high level. Additionaly,
the fruit kernel oils possesses significant antioxidant properties that strongly depend on the fruit
species and the harvest year. Our results pointed out a positive linear correlation between FRAP
and TP. These results highlight that the apricot and plum kernels are a potential source of
valuable oil which might be used for edible and other industrial applications.
3.5. Scientific contributions of the author to the actual state-of-knowledge
Regarding the subjects presented above and based on the two studies done by the author
on this topic, the following points of view, ideas, conclusions and remarks contribute to the actual
state-of-knowledge:
Regarding the possibility to exploit the potential of wine industry by-products
The freeze dried extracts GSE and GPE obtained by capitalisation of wine industry by-
products are rich sources of health-promoting polyphenols with significant antioxidant
activity;
Grape variety determines difference in antioxidant properties of obtained extracts;
Mariana-Atena POIANA Habilitation Thesis
87
GSE derived from Merlot variety possess higher antioxidant properties in terms of TP and
FRAP value than GSE from Cabernet Sauvignon grape variety.
Regarding the possibility to exploit the potential of GSE as natural antioxidant for
edible oil industry
GSE at various levels exhibited very strong antioxidant activity. Probably, the addition of
natural extract created an oil system surrounded by antioxidants that were able to prevent
oxidation because phenolic compounds were located on the interface of the lipid system;
The potential of GSE to enhance the oxidative stability of sunflower oil during thermal
applications was dose-dependent in the studied range: 200–1000 ppm. The highest
oxidative stability of sunflower oil subjected to convective or microwave heating for 4 h
at 180°C was reached in oil samples supplemented by GSE to a level of 1000 ppm;
GSE did not show pro-oxidative effect during treatments up to 240 min;
Both convective heating and microwave exposure caused positional rearrangement of the
double bonds in oil samples and, consequently, a part of the non-conjugated system was
converted to conjugated diene and triene double bonds;
The ability of GSE to reduce the accumulation of primary and secondary products of lipid
oxidation was higher in the convective heating than in the microwave treatment;
Oil supplementation with GSE to a level in the range 600–800 ppm inhibited the lipid
oxidation in a similar manner to BHT, while a level of GSE over 800 ppm limits the
thermo-oxidative degradation of sunflower oil more than BHT;
TP content of oil samples significantly contributed to antioxidant activity of GSE in the
heating time. Thus, TP content of oil samples could be related to the lipid oxidative
deterioration;
The extent of lipid oxidation was greater in samples heated in microwave oven than in
convective heating; consequently, to inhibit the lipid oxidation higher amounts of TP
were required in oil samples exposed to microwave than in those subjected to convective
heating. Based on TOTOX value, it can be seen that the lowest extent of lipid oxidation at
the end of heating was noted in oil samples supplemented by GSE to a level of 1000 ppm;
Thus, these results support and strengthen the idea according to which, the total
antioxidant capacity is inversely related to the extent of lipid oxidation in the investigated
conditions;
GSE is a very effective inhibitor against lipid oxidation in food thermal applications
requiring the oil heating at high temperatures and can be recommended as a potential
natural antioxidant for edible oils industry.
Regarding the possibility to exploit the potential of fruit processing industry by-products
The plum and apricot kernels are important non-traditional sources with a high content of
potential edible oil.
Mariana-Atena POIANA Habilitation Thesis
88
The recovery of plum kernels seems to be more appropriate in approaching of some
possibilities for oil recovery due to the higher oil content in plum kernels than in apricot
kernels. In comparison with apricot seeds, the plums seeds resulted annually in
considerable quantities as by-products from fruit canning industry as well as from natural
distilled beverages industry.
Regarding the plum and apricot kernel oil quality
Fruit kernel oils contain considerable amounts of tocopherols, β-carotene and phenolics
compounds strongly dependent on the harvest year and fruit species;.
The correlation between FRAP and TP content reveal a high dependence of these
parameters;
TP content is a potential candidate as a selection criterion for antioxidant activity of fruit
kernel oil, but antioxidant activity of these oils is not limited only to the phenolics
compounds;
Both kernel oils showed very characteristic tocopherol pattern in which β+γ–T is the
predominating one. α–T and δ–T were detected in minor amounts in both kernel oils.
Lack of separation of β– and γ–T using RP–HPLC method, did not introduce major error
in the quantification of these isomers because vegetable oils contain small quantities of β–
T as compared to γ–T.
Although the chemical structure of these oils make them more susceptible to turning
rancid from lipid peroxidation, the presence of natural antioxidants, such as tocopherols,
help to offset decomposition and extend their shelf life.
The apricot and plum kernels are a potential source of valuable oil which might be used
for edible and other industrial applications. These oils could be also used as dietary
supplements because they are excellent sources of essential fatty acids and antioxidants.
Mariana-Atena POIANA Habilitation Thesis
89
4. Scientific achievements concerning the use of some natural bioactive
compounds for prevention and control of mycotoxin production in cereals
The studies presented in this part of thesis were performed for achieving the objectives of
the project SEE-ERA.NET PLUS, ERA 139/01[http://www.cereals-mycotoxins.ro]
, implemented in the
period 2010-2012, with theme: “Systems to reduce mycotoxin contamination of cereals and
medicinal plants in order to preserve native species and traditional products in Romania-Serbia-
Croatia” in which I was involved as researcher.
4.1. Background
Mycotoxins are toxic chemical products formed as secondary metabolites by a few fungal
species that colonize crops and contaminate them with toxins in the field or after harvest (Moss,
1996). They are produced during growth and multiplication of fungus when micro ecological
conditions are favorable (Alexa et al., 2011).
Mycotoxins usually enter in the body through ingestion of contaminated food, but also
inhalation of toxic spore’s and direct dermal contact are also important ways of penetrating. In
food and fodder naturally contaminated with fungi are found in high concentrations only seven
mycotoxins: aflatoxin, ochratoxin A, patulin, zearalenone, trichothecene, citrinin and penicilic
acid.
In Figure 4.1 is presented the mycotoxins distribution in the food chain. Practically, there
are no known areas in the world without mycotoxins and it is estimated that 25-60% of the
world’s grains contaminated with mycotoxins are produced mainly by fungus of the genera
Aspergillus, Fusarium, Penicillium (Alexa et al., 2013).
The contamination of cereals products with mycotoxins has been a serious problem in
Balkan communities. Cereals and cereal products are significant human food resources and
livestock feeds in the whole world. Each year, a large number of crops are susceptible to fungal
attack either in the field or during storage, leading to considerable financial losses and damage
the health of humans and animals (Jajic et al., 2008).
Several researches on the mycotoxins’ role in endemic kidney disease were
geographically limited to the Balkan region (Puntaric et al., 2001). Balkan endemic nephropathy
(BEN) is found in certain rural areas of the Balkans and affects at least 25 000 inhabitants. A
number of descriptive studies have suggested a correlation between the exposure to ochratoxin A
(OTA), Balkan endemic nephropathy and the mortality caused by urothelial urinary tract tumors
(Peraica et al., 2008).
Mycotoxins can be produced in pre-harvest and post-harvest, during food and feed
production. Grains are exposed to fungal contamination in the field, before harvest, but especially
during storage for longer periods in improper conditions, being favourable environments for
molds development. Among them, representatives of the genera Alternaria, Cladosporium,
Fusarium, Aspergillus and Penicillium are known to have negative impact on the preservation of
grains determining quantitative and qualitative losses (Rasooli et al., 2006).
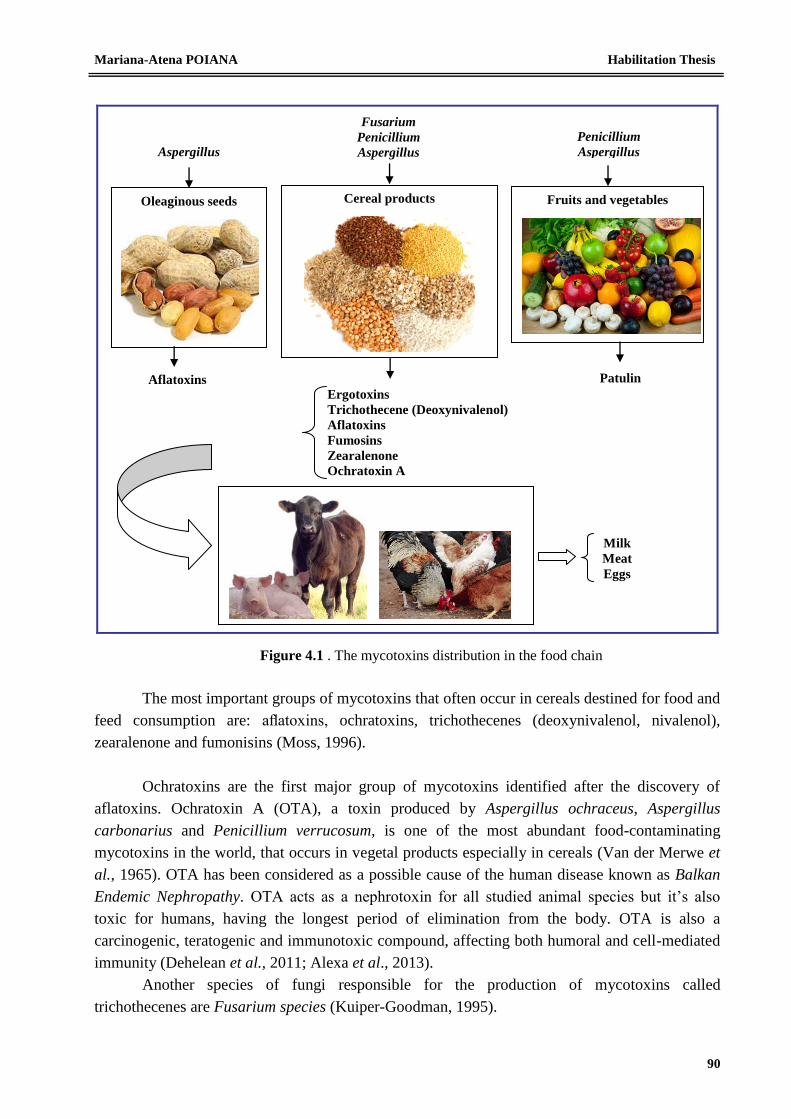
Mariana-Atena POIANA Habilitation Thesis
90
Figure 4.1 . The mycotoxins distribution in the food chain
The most important groups of mycotoxins that often occur in cereals destined for food and
feed consumption are: aflatoxins, ochratoxins, trichothecenes (deoxynivalenol, nivalenol),
zearalenone and fumonisins (Moss, 1996).
Ochratoxins are the first major group of mycotoxins identified after the discovery of
aflatoxins. Ochratoxin A (OTA), a toxin produced by Aspergillus ochraceus, Aspergillus
carbonarius and Penicillium verrucosum, is one of the most abundant food-contaminating
mycotoxins in the world, that occurs in vegetal products especially in cereals (Van der Merwe et
al., 1965). OTA has been considered as a possible cause of the human disease known as Balkan
Endemic Nephropathy. OTA acts as a nephrotoxin for all studied animal species but it’s also
toxic for humans, having the longest period of elimination from the body. OTA is also a
carcinogenic, teratogenic and immunotoxic compound, affecting both humoral and cell-mediated
immunity (Dehelean et al., 2011; Alexa et al., 2013).
Another species of fungi responsible for the production of mycotoxins called
trichothecenes are Fusarium species (Kuiper-Goodman, 1995).
Aspergillus
Oleaginous seeds
Aflatoxins
Fusarium
Penicillium
Aspergillus
Cereal products
Ergotoxins
Trichothecene (Deoxynivalenol)
Aflatoxins
Fumosins
Zearalenone
Ochratoxin A
Penicillium
Aspergillus
Fruits and vegetables
Patulin
Milk
Meat
Eggs
Mariana-Atena POIANA Habilitation Thesis
91
Deoxynivalenol (DON) is the most frequent trichotecene contaminants of agricultural
crops throughout the world and it is produced by species such as Fusarium graminearum and
Fusarium culmorum. Extensive survey data indicate the occurrence of this mycotoxin,
particularly in wheat and corn (Mankeviciene et al., 2011). DON is a potent antifeedant, inducing
in animals, especially in swine, feed refusal and vomiting and can also affect the immune system.
In human body, DON causes vomiting, headache, fever and nausea (Richard, 2007).
Zearalenone (ZON) is a fungal metabolite, mainly produced by Fusarium graminearum
and Fusarium culmorum, which are known to colonize maize, barley, wheat, oats and sorghum
(Krska, 1999). ZON and its related compounds can cause hyperestrogenism and severe
reproductive and infertility problems in animals, especially in swine (Kuiper-Goodman et al.,
1987). Regarding the rate of incidence and concentration levels in cereals, maize and oats were
the most frequently contaminated (Kumar et al., 2008).
Fumonisins (FB1 and FB2) represent a group of mycotoxins produced by Fusarium
verticillioides. Fumonisins are cancer-promoting metabolites of Fusarium proliferatum and
Fusarium verticillioides that have a long-chain hydrocarbon unit with role in their toxicity.
Consumption of food contaminated by fumonisins has been associated with elevated human
oesophageal cancer incidence. The total intake of FB1 in the European diet has been estimated at
1.4 g/kg of body weight per week (Soriano and Dragacci, 2004). Fusarium moulds have become
nowadays a serious problem because they produce a range of toxic metabolites (mycotoxins)
which imperil the health of both humans and animals. Although Fusarium species are
predominantly considered as field fungi, it has been reported that FUMO production can occur
post-harvest when storage conditions are inadequate (Marin et al., 2011).
Prevention of fungal infection during plant growth, harvest, storage and distribution as
well as the measures that must be taken for decontamination represent a current issue for the
European Commission (Commission regulation EC No. 1126/2007).
Romania is a major regional producer of wheat, ranking third in Central Europe behind
Serbia and Hungary (Jajic et al., 2008). Wheat dominates in the west part of Romania as a
primary crop and represents an important part in human and animal feed. The presence of
mycotoxins in cereals is potentially hazardous to human and animal’s health.
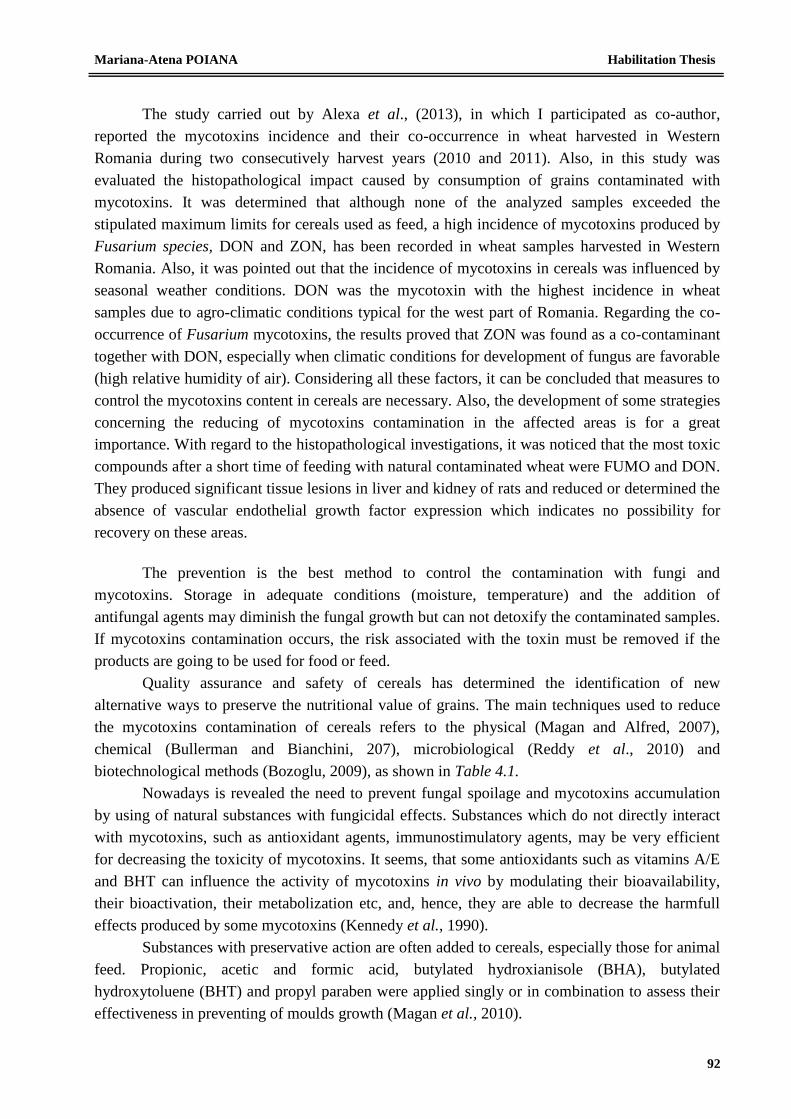
Mariana-Atena POIANA Habilitation Thesis
92
The study carried out by Alexa et al., (2013), in which I participated as co-author,
reported the mycotoxins incidence and their co-occurrence in wheat harvested in Western
Romania during two consecutively harvest years (2010 and 2011). Also, in this study was
evaluated the histopathological impact caused by consumption of grains contaminated with
mycotoxins. It was determined that although none of the analyzed samples exceeded the
stipulated maximum limits for cereals used as feed, a high incidence of mycotoxins produced by
Fusarium species, DON and ZON, has been recorded in wheat samples harvested in Western
Romania. Also, it was pointed out that the incidence of mycotoxins in cereals was influenced by
seasonal weather conditions. DON was the mycotoxin with the highest incidence in wheat
samples due to agro-climatic conditions typical for the west part of Romania. Regarding the co-
occurrence of Fusarium mycotoxins, the results proved that ZON was found as a co-contaminant
together with DON, especially when climatic conditions for development of fungus are favorable
(high relative humidity of air). Considering all these factors, it can be concluded that measures to
control the mycotoxins content in cereals are necessary. Also, the development of some strategies
concerning the reducing of mycotoxins contamination in the affected areas is for a great
importance. With regard to the histopathological investigations, it was noticed that the most toxic
compounds after a short time of feeding with natural contaminated wheat were FUMO and DON.
They produced significant tissue lesions in liver and kidney of rats and reduced or determined the
absence of vascular endothelial growth factor expression which indicates no possibility for
recovery on these areas.
The prevention is the best method to control the contamination with fungi and
mycotoxins. Storage in adequate conditions (moisture, temperature) and the addition of
antifungal agents may diminish the fungal growth but can not detoxify the contaminated samples.
If mycotoxins contamination occurs, the risk associated with the toxin must be removed if the
products are going to be used for food or feed.
Quality assurance and safety of cereals has determined the identification of new
alternative ways to preserve the nutritional value of grains. The main techniques used to reduce
the mycotoxins contamination of cereals refers to the physical (Magan and Alfred, 2007),
chemical (Bullerman and Bianchini, 207), microbiological (Reddy et al., 2010) and
biotechnological methods (Bozoglu, 2009), as shown in Table 4.1.
Nowadays is revealed the need to prevent fungal spoilage and mycotoxins accumulation
by using of natural substances with fungicidal effects. Substances which do not directly interact
with mycotoxins, such as antioxidant agents, immunostimulatory agents, may be very efficient
for decreasing the toxicity of mycotoxins. It seems, that some antioxidants such as vitamins A/E
and BHT can influence the activity of mycotoxins in vivo by modulating their bioavailability,
their bioactivation, their metabolization etc, and, hence, they are able to decrease the harmfull
effects produced by some mycotoxins (Kennedy et al., 1990).
Substances with preservative action are often added to cereals, especially those for animal
feed. Propionic, acetic and formic acid, butylated hydroxianisole (BHA), butylated
hydroxytoluene (BHT) and propyl paraben were applied singly or in combination to assess their
effectiveness in preventing of moulds growth (Magan et al., 2010).
Mariana-Atena POIANA Habilitation Thesis
93
Previous studies were performed for assess the effect of food grade antioxidants such as
propyl paraben (PP), butylated hydroxyanisole (BHA) and butylated hydroxytoluen (BHT) to
control the Fusarium species and mycotoxins production (Etcheverry et al., 2002). These
compounds were effective to control the growth of Aspergillus, Penicillium and Fusarium
populations as well as the synthesis of aflatoxin and fumonisin (Farnochi et al., 2005; Nesci et
al., 2008). BHA and propyl paraben inhibited the production of deoxynivalenol and nivalenol in
wheat grain (Fanelli et al., 2003; Hope et al., 2005).
Table 4.1. The main techniques used for reducing the mycotoxins contamination of cereals
Physical methods
Eliminating of altered fractions Separation
Grinding, sanding
Distorting of toxins Thermal distortion
Irradiation
Chemical methods
Acid-base distortion Ammonification
Nixtamalization
Distortion using oxidizing
and reducing agents
Adsorption of toxins
On clay
On active carbon
On resin
Microbial inactivation
and fermentation
The synthetic phenolic antioxidants (e.g. BHT, BHA) are preferred as fungicides due to
their protective effect on health.
In the last few years some alternatives to synthetic compounds used in prevention of
mycotoxins accumulation have been developed. The natural antioxidants have been proven some
effects on fungal growth and mycotoxin production (Fanelli et al., 2003). Plant extracts could be
a valuable alternative to chemical products for fungal prevention, because they are biodegradable,
are natural products and their use don’t contaminate the environment. Some plant extracts contain
antioxidant compounds as polyphenols (flavonoids and phenolic acids, etc.) and others, such as
terpenes, known for their effect on human health. These compounds could be the basis for the
antimicrobial effects exhibited of plant extracts. The mechanism of action of phenolic compounds
includes the inhibition of enzyme by the oxidized compounds which affect the integrity of
membrane, pH homeostasis and equilibrium of inorganic ions (Dambolena et al., 2010).
The treatment with synthetic resveratrol on maize grain led to the reduction of ZON
production by Fusarium graminearum (Marin et al., 2006). The study performed by Fanelli et al.,
(2003) concluded that the resveratrol exhibited a particularly wide spectrum of mycotoxin
control, although nowadays, this is an expensive product. Resveratrol is able to inhibit OTA
production by Penicillium verrucosum and Aspergillus westerdijkiae in naturally contaminated
wheat grain and is more effective in fungus control than the essential oils (Aldred et al., 2008).
One of the most valuable natural sourse of resveratrol is grape pomace. The effect of
synthetic trans-resveratrol and natural extracts obtained from wine industry by-products on
Fusarium species and mycotoxins production was evaluated by Marin et al. (2006), (2011). No
difference was found when it was used synthetic trans-resveratrol or natural extracts, suggesting
Mariana-Atena POIANA Habilitation Thesis
94
that, the by-products from wine industry are a cheaper source of resveratrol than the synthetic
one.
In line with these concerns, the objective of the study presented in selected paper 9
published by Alexa et al. (2012) was to assess the potential of two freeze-dried natural extracts
obtained from grape pomace and grape seeds (GPE and GSE) compared to synthetic antioxidant
(BHT) in order to control the ochratoxin A (OTA) production in naturally contaminated wheat
grain. The processing and characterization of freeze-dried extracts (GPE and GSE) used in this
study was done in Section I/3/3.2. In performing of this study, I was involved as principal author
(marked as corresponding author).
In the last years, essential oils and natural formulas with antioxidant activity were tested
as potential inhibitors of fungal development and mycotoxin production (Hope et al., 2005).
Moreover, the essential oils from different herbs and aromatic plants were used in the prevention
of fungi and mycotoxins accumulation in cereals as potential inhibitors of fungal development
and mycotoxin production (Hope et al., 2005; Aldred et al., 2008).
Essential oils, also known as volatile oils, are complex mixtures of volatile constituents
biosynthesized by plants, which mainly include terpenes, terpenoids, aromatic and aliphatic
constituents, all characterized by low molecular weight (Bassole and Juliani, 2012). They are a
valuable source of antioxidants and biologically active compounds. Natural essential oils are
expected to be more advantageous than the synthetic agents. Due to their bioactivity in the vapors
phase, essential oils could be used as fumigants for the protection of stored cereals (Naeini et al.,
2010).
The inhibitory mechanism of some essential oils against moulds is due to the modification
in cytoplasm, inhibiting some of its functions, cytoplasmatic membrane rupture as well as the
inactivation and/or inhibition of intracellular synthesis of enzymes. Also, the antifungal effect of
essential oils could be explained by the modifications induced on the fungal morphogenesis and
fungus growth through the interference of their components with the enzymes responsible for
wall cell synthesis leading to changes in the hyphae integrity, plasma membrane disruption and
mitochondrial destruction (Rasooli et al., 2006). These effects can occur simultaneously or alone
resulted in the inhibition of spore germination. For this reason, plant extracts or essential oils with
antimicrobial properties can replace the use of synthetic chemicals, in order to control
mycotoxicogenic moulds in raw materials and foods.
The most attractive aspect derived from using of essential oils and/or their constituents as
crop protectants is due to their biodegradability and non-toxicity (Isman, 2000).
Several researches have reported the preservation of grains by using of essential oils
(Soliman and Badeaa, 2002) and their impact on FUMO production by Fusarium verticillioides
(Dambolena et al., 2010; Menniti et al., 2010) or by Fusarium proliferatum (Velluti et al., 2003).
The results reported by Bluma et al. (2008) have pointed that the antifungal activity was
strongly associated with the presence of monoterpenic phenols, especially thymol, carvacrol and
eugenol in essential oils. These studies have suggested that only a few essential oils such as
cinnamon and clove leaf oil have the capacity for control the mycotoxigenic Fusarium species,
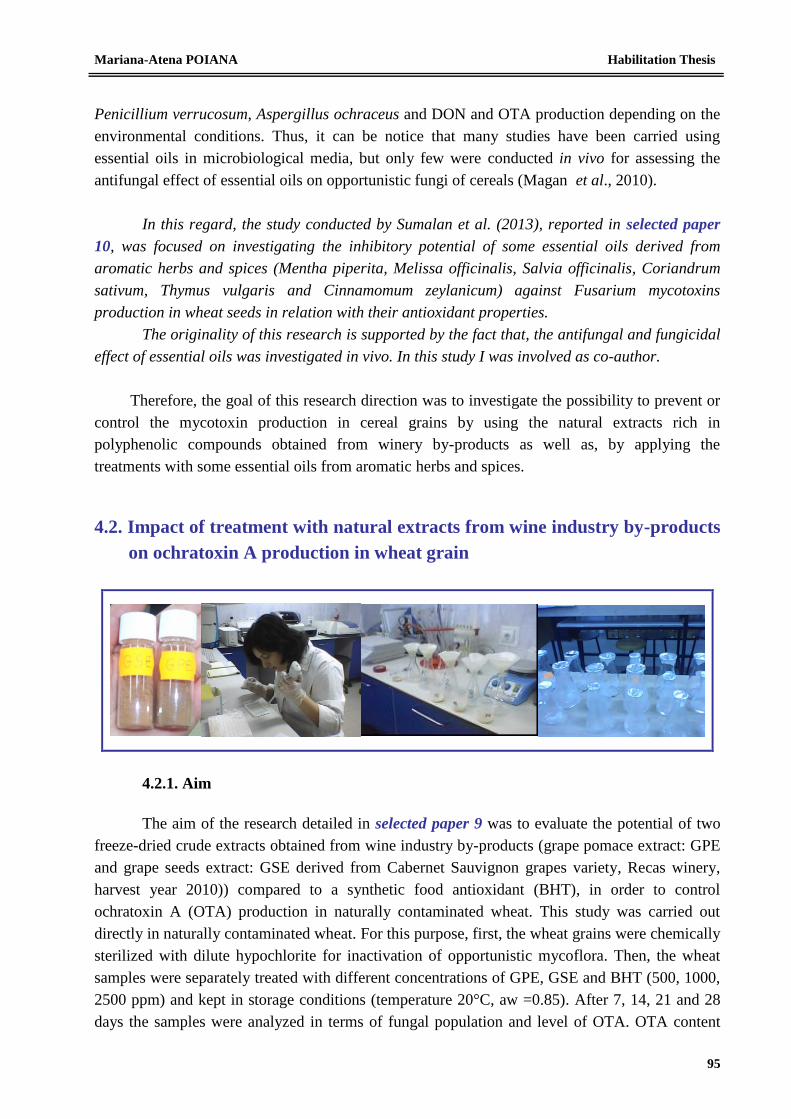
Mariana-Atena POIANA Habilitation Thesis
95
Penicillium verrucosum, Aspergillus ochraceus and DON and OTA production depending on the
environmental conditions. Thus, it can be notice that many studies have been carried using
essential oils in microbiological media, but only few were conducted in vivo for assessing the
antifungal effect of essential oils on opportunistic fungi of cereals (Magan et al., 2010).
In this regard, the study conducted by Sumalan et al. (2013), reported in selected paper
10, was focused on investigating the inhibitory potential of some essential oils derived from
aromatic herbs and spices (Mentha piperita, Melissa officinalis, Salvia officinalis, Coriandrum
sativum, Thymus vulgaris and Cinnamomum zeylanicum) against Fusarium mycotoxins
production in wheat seeds in relation with their antioxidant properties.
The originality of this research is supported by the fact that, the antifungal and fungicidal
effect of essential oils was investigated in vivo. In this study I was involved as co-author.
Therefore, the goal of this research direction was to investigate the possibility to prevent or
control the mycotoxin production in cereal grains by using the natural extracts rich in
polyphenolic compounds obtained from winery by-products as well as, by applying the
treatments with some essential oils from aromatic herbs and spices.
4.2. Impact of treatment with natural extracts from wine industry by-products
on ochratoxin A production in wheat grain
4.2.1. Aim
The aim of the research detailed in selected paper 9 was to evaluate the potential of two
freeze-dried crude extracts obtained from wine industry by-products (grape pomace extract: GPE
and grape seeds extract: GSE derived from Cabernet Sauvignon grapes variety, Recas winery,
harvest year 2010)) compared to a synthetic food antioxidant (BHT), in order to control
ochratoxin A (OTA) production in naturally contaminated wheat. This study was carried out
directly in naturally contaminated wheat. For this purpose, first, the wheat grains were chemically
sterilized with dilute hypochlorite for inactivation of opportunistic mycoflora. Then, the wheat
samples were separately treated with different concentrations of GPE, GSE and BHT (500, 1000,
2500 ppm) and kept in storage conditions (temperature 20°C, aw =0.85). After 7, 14, 21 and 28
days the samples were analyzed in terms of fungal population and level of OTA. OTA content
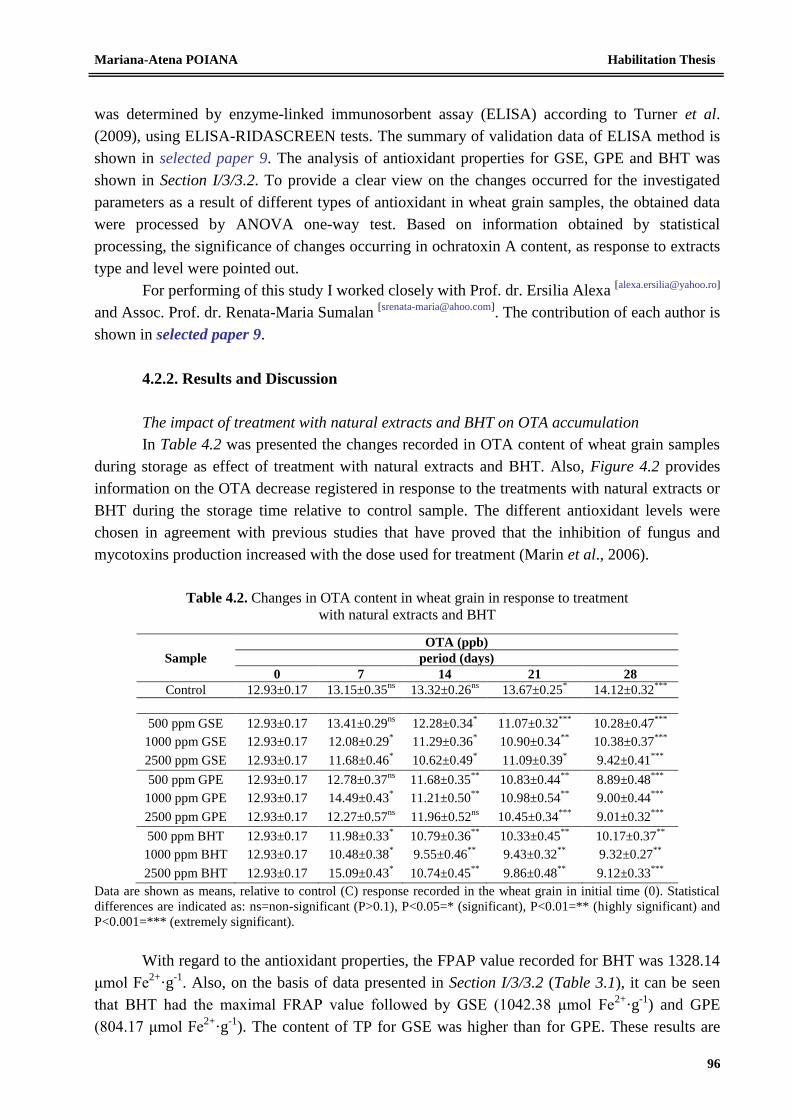
Mariana-Atena POIANA Habilitation Thesis
96
was determined by enzyme-linked immunosorbent assay (ELISA) according to Turner et al.
(2009), using ELISA-RIDASCREEN tests. The summary of validation data of ELISA method is
shown in selected paper 9. The analysis of antioxidant properties for GSE, GPE and BHT was
shown in Section I/3/3.2. To provide a clear view on the changes occurred for the investigated
parameters as a result of different types of antioxidant in wheat grain samples, the obtained data
were processed by ANOVA one-way test. Based on information obtained by statistical
processing, the significance of changes occurring in ochratoxin A content, as response to extracts
type and level were pointed out.
For performing of this study I worked closely with Prof. dr. Ersilia Alexa [[email protected]]
and Assoc. Prof. dr. Renata-Maria Sumalan [[email protected]]
. The contribution of each author is
shown in selected paper 9.
4.2.2. Results and Discussion
The impact of treatment with natural extracts and BHT on OTA accumulation
In Table 4.2 was presented the changes recorded in OTA content of wheat grain samples
during storage as effect of treatment with natural extracts and BHT. Also, Figure 4.2 provides
information on the OTA decrease registered in response to the treatments with natural extracts or
BHT during the storage time relative to control sample. The different antioxidant levels were
chosen in agreement with previous studies that have proved that the inhibition of fungus and
mycotoxins production increased with the dose used for treatment (Marin et al., 2006).
Table 4.2. Changes in OTA content in wheat grain in response to treatment
with natural extracts and BHT
Sample
OTA (ppb)
period (days)
0 7 14 21 28
Control 12.93±0.17 13.15±0.35ns
13.32±0.26ns
13.67±0.25*
14.12±0.32***
500 ppm GSE 12.93±0.17 13.41±0.29ns
12.28±0.34*
11.07±0.32***
10.28±0.47***
1000 ppm GSE 12.93±0.17 12.08±0.29*
11.29±0.36*
10.90±0.34**
10.38±0.37***
2500 ppm GSE 12.93±0.17 11.68±0.46*
10.62±0.49*
11.09±0.39*
9.42±0.41***
500 ppm GPE 12.93±0.17 12.78±0.37ns
11.68±0.35**
10.83±0.44**
8.89±0.48***
1000 ppm GPE 12.93±0.17 14.49±0.43*
11.21±0.50**
10.98±0.54**
9.00±0.44***
2500 ppm GPE 12.93±0.17 12.27±0.57ns
11.96±0.52ns
10.45±0.34***
9.01±0.32***
500 ppm BHT 12.93±0.17 11.98±0.33*
10.79±0.36**
10.33±0.45**
10.17±0.37**
1000 ppm BHT 12.93±0.17 10.48±0.38*
9.55±0.46**
9.43±0.32**
9.32±0.27**
2500 ppm BHT 12.93±0.17 15.09±0.43*
10.74±0.45**
9.86±0.48**
9.12±0.33***
Data are shown as means, relative to control (C) response recorded in the wheat grain in initial time (0). Statistical
differences are indicated as: ns=non-significant (P>0.1), P<0.05=* (significant), P<0.01=** (highly significant) and
P<0.001=*** (extremely significant).
With regard to the antioxidant properties, the FPAP value recorded for BHT was 1328.14
μmol Fe2+
·g-1
. Also, on the basis of data presented in Section I/3/3.2 (Table 3.1), it can be seen
that BHT had the maximal FRAP value followed by GSE (1042.38 μmol Fe2+
·g-1
) and GPE
(804.17 μmol Fe2+
·g-1
). The content of TP for GSE was higher than for GPE. These results are
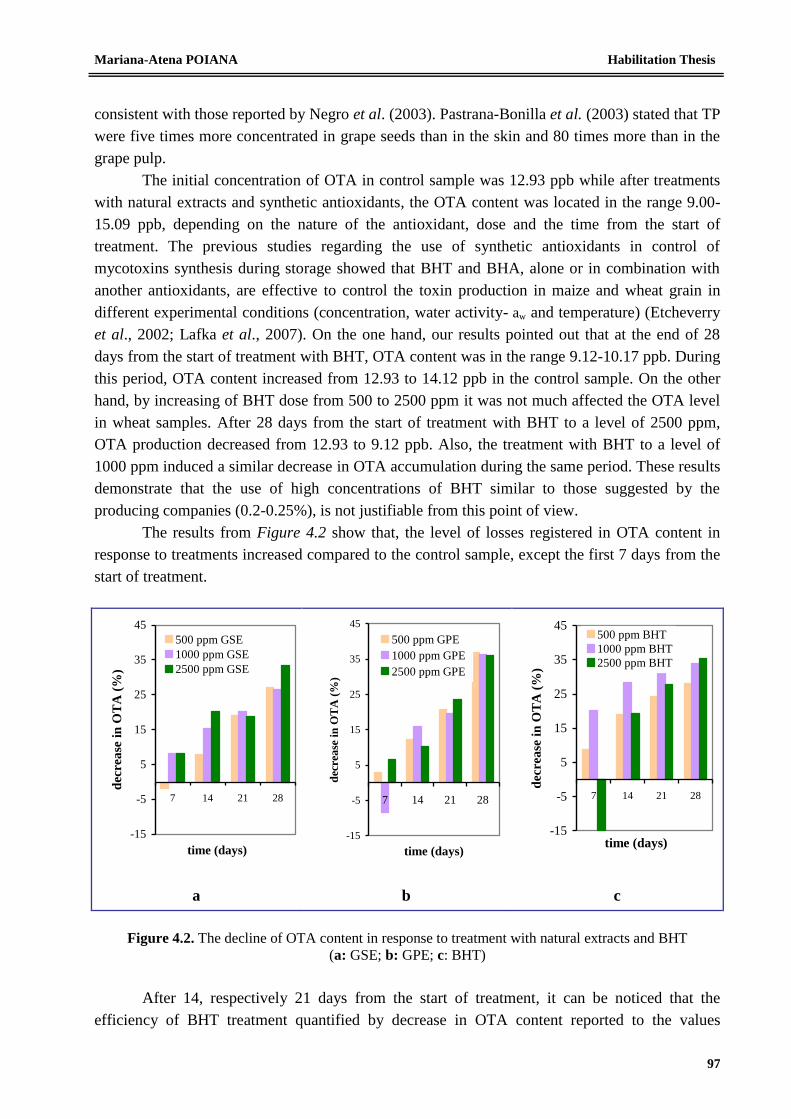
Mariana-Atena POIANA Habilitation Thesis
97
consistent with those reported by Negro et al. (2003). Pastrana-Bonilla et al. (2003) stated that TP
were five times more concentrated in grape seeds than in the skin and 80 times more than in the
grape pulp.
The initial concentration of OTA in control sample was 12.93 ppb while after treatments
with natural extracts and synthetic antioxidants, the OTA content was located in the range 9.00-
15.09 ppb, depending on the nature of the antioxidant, dose and the time from the start of
treatment. The previous studies regarding the use of synthetic antioxidants in control of
mycotoxins synthesis during storage showed that BHT and BHA, alone or in combination with
another antioxidants, are effective to control the toxin production in maize and wheat grain in
different experimental conditions (concentration, water activity- aw and temperature) (Etcheverry
et al., 2002; Lafka et al., 2007). On the one hand, our results pointed out that at the end of 28
days from the start of treatment with BHT, OTA content was in the range 9.12-10.17 ppb. During
this period, OTA content increased from 12.93 to 14.12 ppb in the control sample. On the other
hand, by increasing of BHT dose from 500 to 2500 ppm it was not much affected the OTA level
in wheat samples. After 28 days from the start of treatment with BHT to a level of 2500 ppm,
OTA production decreased from 12.93 to 9.12 ppb. Also, the treatment with BHT to a level of
1000 ppm induced a similar decrease in OTA accumulation during the same period. These results
demonstrate that the use of high concentrations of BHT similar to those suggested by the
producing companies (0.2-0.25%), is not justifiable from this point of view.
The results from Figure 4.2 show that, the level of losses registered in OTA content in
response to treatments increased compared to the control sample, except the first 7 days from the
start of treatment.
-15
-5
5
15
25
35
45
7 14 21 28
time (days)
dec
rea
se i
n O
TA
(%
)
500 ppm GSE
1000 ppm GSE
2500 ppm GSE
-15
-5
5
15
25
35
45
7 14 21 28
time (days)
dec
rea
se i
n O
TA
(%
)
500 ppm GPE
1000 ppm GPE
2500 ppm GPE
-15
-5
5
15
25
35
45
7 14 21 28
time (days)
dec
rea
se i
n O
TA
(%
)
500 ppm BHT
1000 ppm BHT
2500 ppm BHT
a b c
Figure 4.2. The decline of OTA content in response to treatment with natural extracts and BHT
(a: GSE; b: GPE; c: BHT)
After 14, respectively 21 days from the start of treatment, it can be noticed that the
efficiency of BHT treatment quantified by decrease in OTA content reported to the values
Mariana-Atena POIANA Habilitation Thesis
98
recorded in control sample, were higher at a level of 1000 ppm than those recorded at 500 ppm
and 2500 ppm. After 28 days from the start of treatment with BHT to a level of 1000 and 2500
ppm it was recorded decreases in OTA production about 35% relative to the control.
The results presented in Table 4.2 showed that the treatments with natural extracts (GPE
and GSE) were efficient in decreasing on OTA accumulation, having at least similar effect with
BHT.
The addition of GSE at 500 ppm level was induced a slow increase of OTA content after
7 days, followed by a decrease of OTA concentration after 28 days from the start of treatment. By
increasing the dose of GSE to a level of 1000 ppm it was recorded moderate relative decreases in
OTA content (10-12%). These results were in agreement with those reporded by Fanelli et al.
(2003) which revealed that resveratrol isolated from grapes and used for treating of wheat and
corn seeds led to a sharp reduction of OTA production (Lafka et al., 2007).
The treatment with GPE also led to the inhibition of OTA synthesis compared to control
sample. Previous researches on this topic proved that resveratrol from grapes was able to
completely inhibit the OTA production to a level of at 500 ppm, proving to be more effective
than essential oils to control the OTA synthesis (Lafka et al., 2007; Aldred et al., 2008). The
treatment with GPE to high concentration (1000 and 2500 ppm) had similar effects on OTA
accumulation suggesting no advantage in using of high dose. Comparable results were also
obtained by Reynoso et al. (2002) when synthetic antioxidants were used to control the Fusarium
speciesl.
From the Figure 4.2 it can be noted that, after 14 days from the start of treatment with
GSE and GPE it was recorded decreases in OTA production in the range 8-28% relative to the
control sample. After 28 days from the start of treatment, the recorded decreases were in the
range 26-37% relative to the control sample. The highest decrease in OTA production was
obtained for treatment with GPE to a level of 500 ppm.
Our data are in agreement with those reported by Aldred et al. (2008) concerning the
effect of resveratrol (at 200 ppm level) on OTA production by Penicillium verrucosum in stored
wheat grain for 28 days at 25C, when the losses registered in OTA production were between 27
an 71% relative to control, depending on aw.
The registered results pointed out that, there are no major differences in OTA production
among treatments with natural extracts to levels of 500, 1000 and 2500 ppm, proving that the
inhibition of OTA production is not dependent on the dose of antioxidant agent (Marin et al.,
2006).
Some stimulation of OTA production was observed with 500 ppm GSE, 1000 ppm GPE
and 2500 ppm BHT, after 7 days of treatment. These findings could indicate that, in response to
antioxidants stress, the fungus species produce more mycotoxins as a survival mechanism,
(Reynoso et al., 2002).
After 14 days from the start of treatment, the OTA accumulation decreased compared to
the control sample, proving the inhibitory potential of both synthetic antioxidant and natural
extracts on OTA production in wheat grain. The results showed that after 28 days of starting
treatment the most efficient on OTA decreasing was GPE followed by BHT and GSE. Data
presented in Section I/3/3.2 revealed that GPE does not have the highest TP content, i.e.
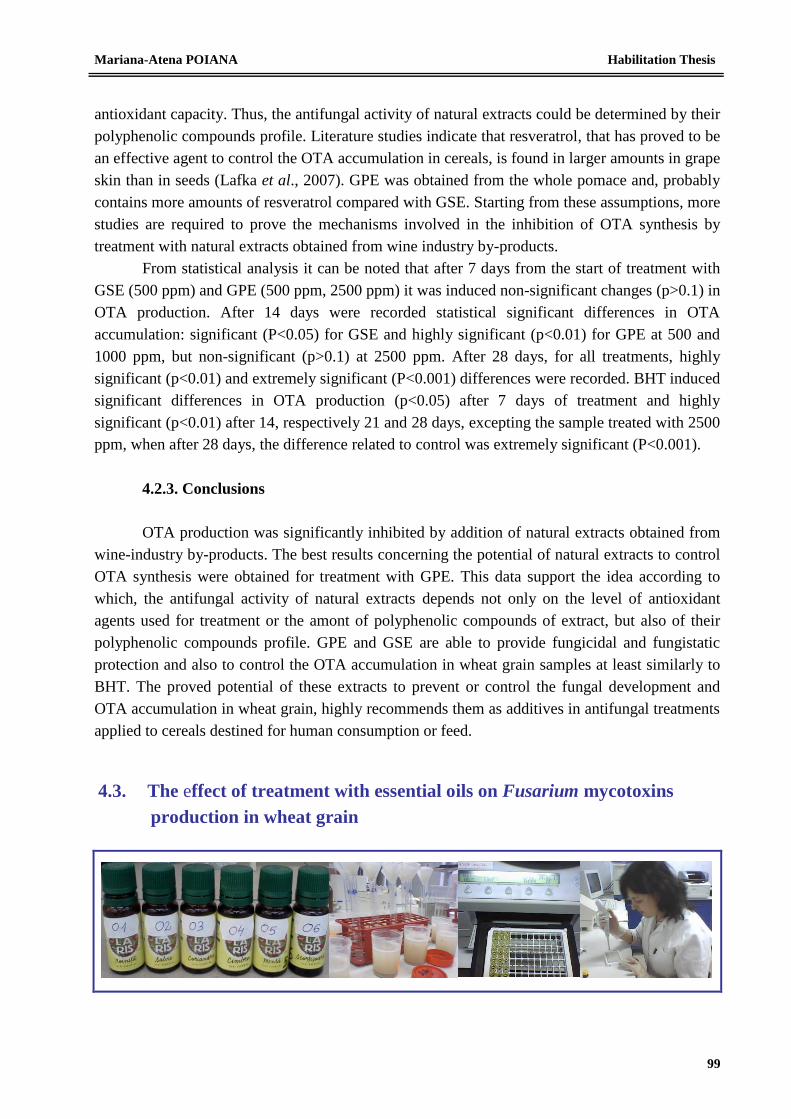
Mariana-Atena POIANA Habilitation Thesis
99
antioxidant capacity. Thus, the antifungal activity of natural extracts could be determined by their
polyphenolic compounds profile. Literature studies indicate that resveratrol, that has proved to be
an effective agent to control the OTA accumulation in cereals, is found in larger amounts in grape
skin than in seeds (Lafka et al., 2007). GPE was obtained from the whole pomace and, probably
contains more amounts of resveratrol compared with GSE. Starting from these assumptions, more
studies are required to prove the mechanisms involved in the inhibition of OTA synthesis by
treatment with natural extracts obtained from wine industry by-products.
From statistical analysis it can be noted that after 7 days from the start of treatment with
GSE (500 ppm) and GPE (500 ppm, 2500 ppm) it was induced non-significant changes (p>0.1) in
OTA production. After 14 days were recorded statistical significant differences in OTA
accumulation: significant (P<0.05) for GSE and highly significant (p<0.01) for GPE at 500 and
1000 ppm, but non-significant (p>0.1) at 2500 ppm. After 28 days, for all treatments, highly
significant (p<0.01) and extremely significant (P<0.001) differences were recorded. BHT induced
significant differences in OTA production (p<0.05) after 7 days of treatment and highly
significant (p<0.01) after 14, respectively 21 and 28 days, excepting the sample treated with 2500
ppm, when after 28 days, the difference related to control was extremely significant (P<0.001).
4.2.3. Conclusions
OTA production was significantly inhibited by addition of natural extracts obtained from
wine-industry by-products. The best results concerning the potential of natural extracts to control
OTA synthesis were obtained for treatment with GPE. This data support the idea according to
which, the antifungal activity of natural extracts depends not only on the level of antioxidant
agents used for treatment or the amont of polyphenolic compounds of extract, but also of their
polyphenolic compounds profile. GPE and GSE are able to provide fungicidal and fungistatic
protection and also to control the OTA accumulation in wheat grain samples at least similarly to
BHT. The proved potential of these extracts to prevent or control the fungal development and
OTA accumulation in wheat grain, highly recommends them as additives in antifungal treatments
applied to cereals destined for human consumption or feed.
4.3. The effect of treatment with essential oils on Fusarium mycotoxins
production in wheat grain
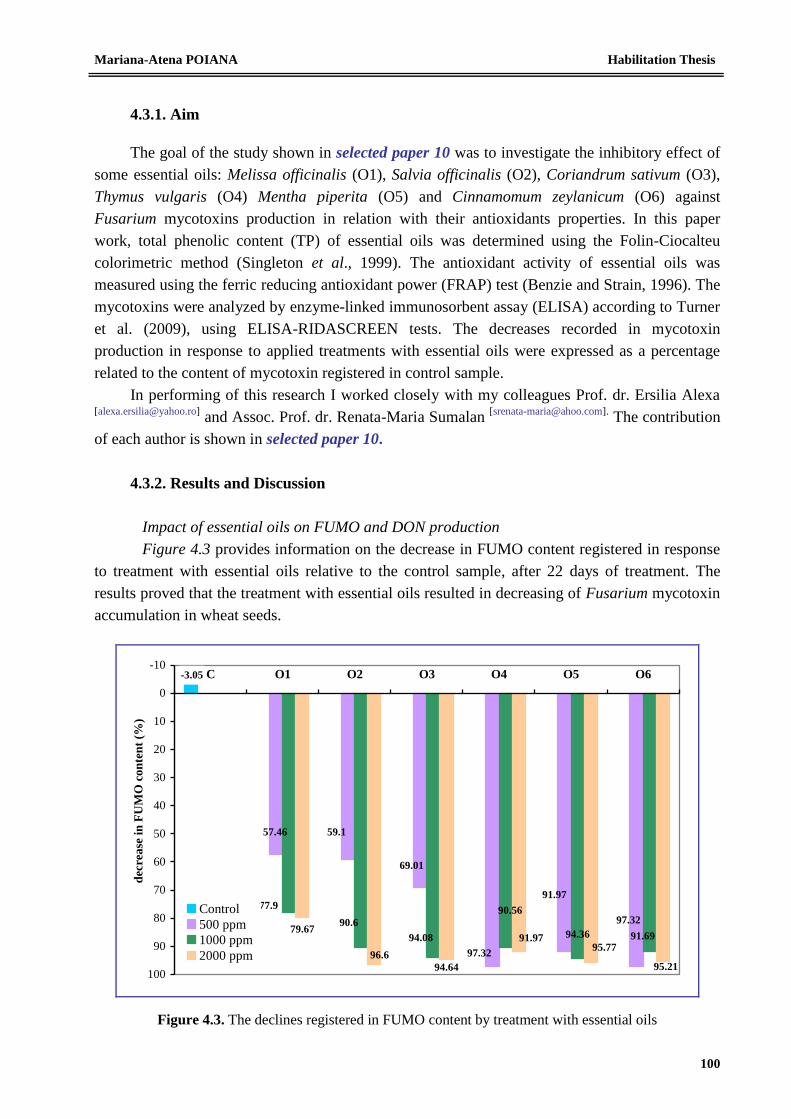
Mariana-Atena POIANA Habilitation Thesis
100
4.3.1. Aim
The goal of the study shown in selected paper 10 was to investigate the inhibitory effect of
some essential oils: Melissa officinalis (O1), Salvia officinalis (O2), Coriandrum sativum (O3),
Thymus vulgaris (O4) Mentha piperita (O5) and Cinnamomum zeylanicum (O6) against
Fusarium mycotoxins production in relation with their antioxidants properties. In this paper
work, total phenolic content (TP) of essential oils was determined using the Folin-Ciocalteu
colorimetric method (Singleton et al., 1999). The antioxidant activity of essential oils was
measured using the ferric reducing antioxidant power (FRAP) test (Benzie and Strain, 1996). The
mycotoxins were analyzed by enzyme-linked immunosorbent assay (ELISA) according to Turner
et al. (2009), using ELISA-RIDASCREEN tests. The decreases recorded in mycotoxin
production in response to applied treatments with essential oils were expressed as a percentage
related to the content of mycotoxin registered in control sample.
In performing of this research I worked closely with my colleagues Prof. dr. Ersilia Alexa [[email protected]]
and Assoc. Prof. dr. Renata-Maria Sumalan [[email protected]].
The contribution
of each author is shown in selected paper 10.
4.3.2. Results and Discussion
Impact of essential oils on FUMO and DON production
Figure 4.3 provides information on the decrease in FUMO content registered in response
to treatment with essential oils relative to the control sample, after 22 days of treatment. The
results proved that the treatment with essential oils resulted in decreasing of Fusarium mycotoxin
accumulation in wheat seeds.
79.67
-3.05
97.32
91.97
57.46 59.1
69.01
97.3290.6
94.08
90.56
94.36
77.9
91.69
96.6
94.64
91.9795.77
95.21
-10
0
10
20
30
40
50
60
70
80
90
100
C O1 O2 O3 O4 O5 O6
dec
rea
se i
n F
UM
O c
on
ten
t (%
)
Control
500 ppm
1000 ppm
2000 ppm
Figure 4.3. The declines registered in FUMO content by treatment with essential oils
Mariana-Atena POIANA Habilitation Thesis
101
At the beginning of the experiment, it was recorded a content of 0.689 ppm for FUMO
and 0.420 ppm for DON.
The declines registered in FUMO production after 22 days of treatment with essential oils
were in the range 57-97% related to the initial value, depending on the applied treatment (type
and dose of essential oil). The best control on FUMO production, expressed by decreasing greater
than 90% reported to the control value, was recorded for all treatments with O4, O5 and O6.
These results are in agreement with the study conducted by Soliman and Badeaa (2002) which
revealed that, the effect of treatment with essential oils on FUMO production control was as
follows: O4>O6>O5.
The treatments with O1, O2 and O3 applied to the lowest level (500 ppm) resulted in a
moderate inhibitory effect. Our results shown that the relative decreases in FUMO production
recorded in wheat samples in response to treatment with O1 were in the range 57-80%. Similar
results were also noticed for treatments with O2 and O3 applied to a level of 500 ppm, while the
treatment with these essential oils in doses of 1000 and 2000 ppm resulted in substantial
decreases in FUMO production, in the range 91-97%.
The results reported by Velluti et al., (2003) proved that aw, temperature, dose and type of
essential oil as well as some of their interactions had a significant effect on FUMO production by
Fusarium proliferatum. The mycotoxins production is affected by the treatment conditions
(temperature and the humidity of grain). The penetration of essential oils into the internal parts of
the grain is improved in the presence of water.
In our study, the constant conditions, in terms of aw (0.900) and temperature (25±2°C),
resulted in decreasing of DON and FUMO production in wheat grain samples after 22 days from
the start of treatment.
In regard to the effect of essential oil composition on mycotoxin synthesis, on the one
hand a few studies have reported high inhibitory activity exhibited by phenolic compounds. The
mechanism of action of phenolic compounds supposes the involvement of these compounds in
enzyme inhibition, possibly through reaction with sulfhydryl groups or through interactions with
proteins (Dambolena et al., 2008). On the other hand, it has reported that the relative antifungal
activity of the essential oils can not be correlated with any individual component, but only with
the mixture of compounds from these oils (Hashem et al., 2010).
The inhibition of fungal development as well as the toxins production not always can be
observed together (Magan et al., 2010). For example, previous studies with Fusarium culmorum
and Fusarium graminearum pointed out that growth of fungi was significantly inhibited by
cinnamon essential oil, but toxin production was enhanced (Dambolena et al., 2010). Also,
Magan et al. (2010) found that the suboptimal levels of fungicides stimulated DON production by
Fusarium culmorum in wheat grain. The additional stress of the fungicidal agents combined with
water stress could stimulate the mycotoxin production (Aldred et al., 2008).
After 22 days from the start of treatment with O4-O6 it was noted high FUMO inhibition,
but the most fungicidal effect was recorded for O2 to a level of 2000 ppm.
According to data reported by Dambolena et al. (2008), the inhibitory effect of terpenes
on Fusarium growth and FUMO production followed the sequence:
limonene>thymol>menthol>menthone. O4 contains high amounts of thymol, as previously
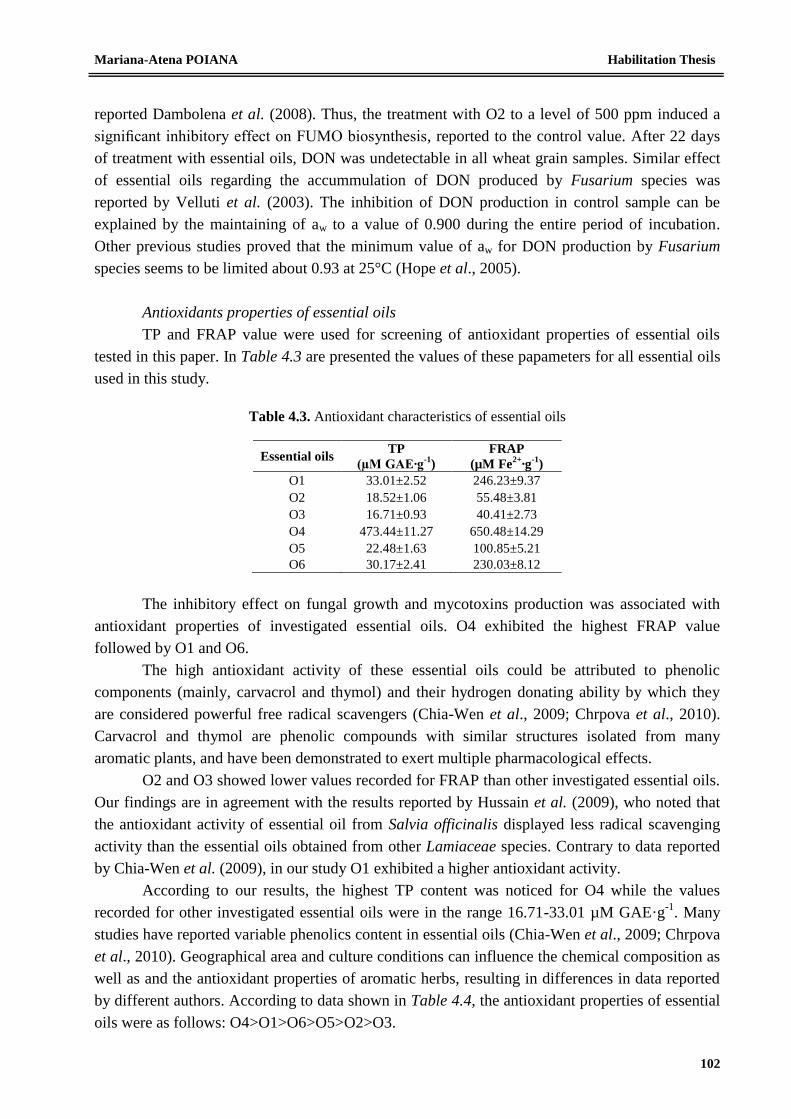
Mariana-Atena POIANA Habilitation Thesis
102
reported Dambolena et al. (2008). Thus, the treatment with O2 to a level of 500 ppm induced a
significant inhibitory effect on FUMO biosynthesis, reported to the control value. After 22 days
of treatment with essential oils, DON was undetectable in all wheat grain samples. Similar effect
of essential oils regarding the accummulation of DON produced by Fusarium species was
reported by Velluti et al. (2003). The inhibition of DON production in control sample can be
explained by the maintaining of aw to a value of 0.900 during the entire period of incubation.
Other previous studies proved that the minimum value of aw for DON production by Fusarium
species seems to be limited about 0.93 at 25°C (Hope et al., 2005).
Antioxidants properties of essential oils
TP and FRAP value were used for screening of antioxidant properties of essential oils
tested in this paper. In Table 4.3 are presented the values of these papameters for all essential oils
used in this study.
Table 4.3. Antioxidant characteristics of essential oils
Essential oils TP
(µM GAE∙g-1
)
FRAP
(µM Fe2+
∙g-1
)
O1 33.01±2.52 246.23±9.37
O2 18.52±1.06 55.48±3.81
O3 16.71±0.93 40.41±2.73
O4 473.44±11.27 650.48±14.29
O5 22.48±1.63 100.85±5.21
O6 30.17±2.41 230.03±8.12
The inhibitory effect on fungal growth and mycotoxins production was associated with
antioxidant properties of investigated essential oils. O4 exhibited the highest FRAP value
followed by O1 and O6.
The high antioxidant activity of these essential oils could be attributed to phenolic
components (mainly, carvacrol and thymol) and their hydrogen donating ability by which they
are considered powerful free radical scavengers (Chia-Wen et al., 2009; Chrpova et al., 2010).
Carvacrol and thymol are phenolic compounds with similar structures isolated from many
aromatic plants, and have been demonstrated to exert multiple pharmacological effects.
O2 and O3 showed lower values recorded for FRAP than other investigated essential oils.
Our findings are in agreement with the results reported by Hussain et al. (2009), who noted that
the antioxidant activity of essential oil from Salvia officinalis displayed less radical scavenging
activity than the essential oils obtained from other Lamiaceae species. Contrary to data reported
by Chia-Wen et al. (2009), in our study O1 exhibited a higher antioxidant activity.
According to our results, the highest TP content was noticed for O4 while the values
recorded for other investigated essential oils were in the range 16.71-33.01 µM GAE·g-1
. Many
studies have reported variable phenolics content in essential oils (Chia-Wen et al., 2009; Chrpova
et al., 2010). Geographical area and culture conditions can influence the chemical composition as
well as and the antioxidant properties of aromatic herbs, resulting in differences in data reported
by different authors. According to data shown in Table 4.4, the antioxidant properties of essential
oils were as follows: O4>O1>O6>O5>O2>O3.
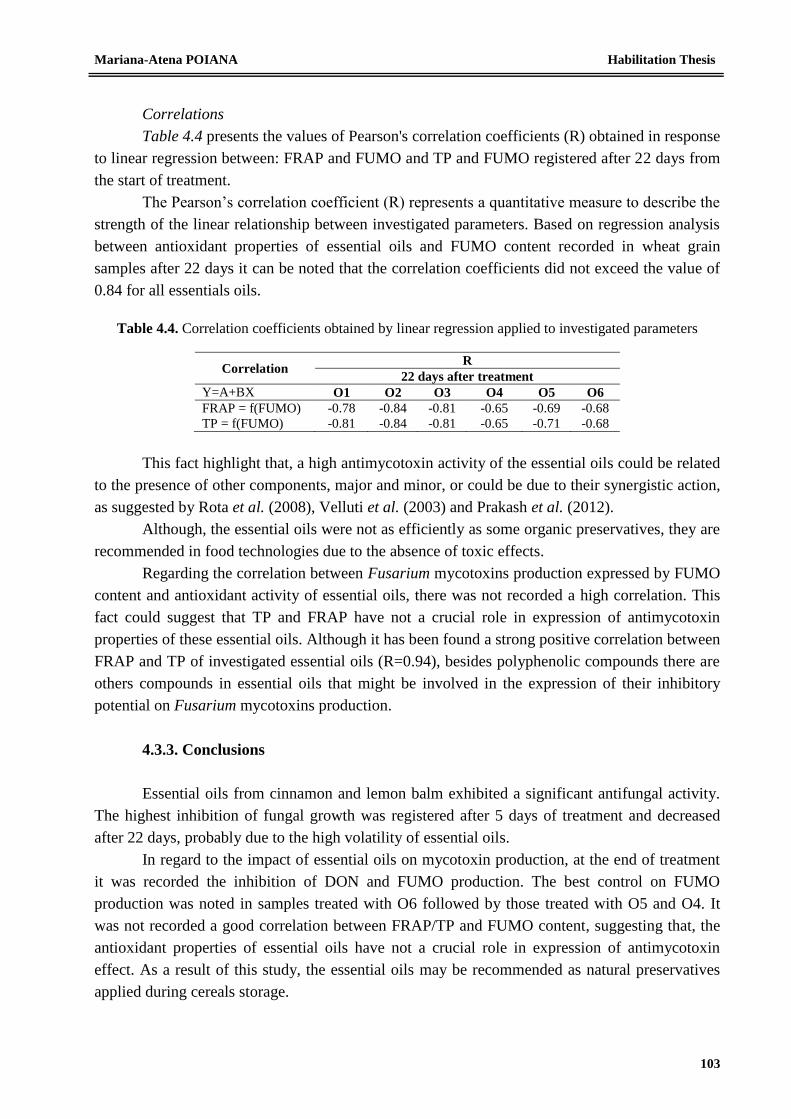
Mariana-Atena POIANA Habilitation Thesis
103
Correlations
Table 4.4 presents the values of Pearson's correlation coefficients (R) obtained in response
to linear regression between: FRAP and FUMO and TP and FUMO registered after 22 days from
the start of treatment.
The Pearson’s correlation coefficient (R) represents a quantitative measure to describe the
strength of the linear relationship between investigated parameters. Based on regression analysis
between antioxidant properties of essential oils and FUMO content recorded in wheat grain
samples after 22 days it can be noted that the correlation coefficients did not exceed the value of
0.84 for all essentials oils.
Table 4.4. Correlation coefficients obtained by linear regression applied to investigated parameters
Correlation R
22 days after treatment
Y=A+BX O1 O2 O3 O4 O5 O6
FRAP = f(FUMO) -0.78 -0.84 -0.81 -0.65 -0.69 -0.68
TP = f(FUMO) -0.81 -0.84 -0.81 -0.65 -0.71 -0.68
This fact highlight that, a high antimycotoxin activity of the essential oils could be related
to the presence of other components, major and minor, or could be due to their synergistic action,
as suggested by Rota et al. (2008), Velluti et al. (2003) and Prakash et al. (2012).
Although, the essential oils were not as efficiently as some organic preservatives, they are
recommended in food technologies due to the absence of toxic effects.
Regarding the correlation between Fusarium mycotoxins production expressed by FUMO
content and antioxidant activity of essential oils, there was not recorded a high correlation. This
fact could suggest that TP and FRAP have not a crucial role in expression of antimycotoxin
properties of these essential oils. Although it has been found a strong positive correlation between
FRAP and TP of investigated essential oils (R=0.94), besides polyphenolic compounds there are
others compounds in essential oils that might be involved in the expression of their inhibitory
potential on Fusarium mycotoxins production.
4.3.3. Conclusions
Essential oils from cinnamon and lemon balm exhibited a significant antifungal activity.
The highest inhibition of fungal growth was registered after 5 days of treatment and decreased
after 22 days, probably due to the high volatility of essential oils.
In regard to the impact of essential oils on mycotoxin production, at the end of treatment
it was recorded the inhibition of DON and FUMO production. The best control on FUMO
production was noted in samples treated with O6 followed by those treated with O5 and O4. It
was not recorded a good correlation between FRAP/TP and FUMO content, suggesting that, the
antioxidant properties of essential oils have not a crucial role in expression of antimycotoxin
effect. As a result of this study, the essential oils may be recommended as natural preservatives
applied during cereals storage.
Mariana-Atena POIANA Habilitation Thesis
104
4.4. Scientific contributions of the author to the actual state-of-knowledge
Regarding the aforementioned subjects and based on the two studies done by the author for
assessing the effect of some extracts obtained from wine industry by-products as well concerning
the inhibitory potential of essential oils on natural mycoflora and mycotoxins production in
naturally contaminated wheat, the following remarks contribute to the actual state-of-knowledge
on this topic:
The effect of natural freeze-dried extract (GSE and GPE) and BHT on OTA production
was not the same during the whole treatment. After 7 days of treatment, some stimulation
of OTA production was observed. These remarks could indicate that, in response to
antioxidants stress, the fungus species produce more mycotoxins quantity, as a survival
mechanism. After 14 days from the start of treatment, the OTA accumulation decreased
reported to the control sample, proving the inhibitory potential of BHT and natural freeze-
dried extracts on OTA production in wheat grain. After 28 days of treatment the most
efficient regarding the inhibition of OTA production was GPE followed by BHT and GSE;
GPE had a greater effect to control OTA synthesis than GSE, although GPE does not have
the highest polyphenols content, i.e. antioxidant capacity. We advanced the idea that the
antifungal activity of natural extracts could be related not only to the level of antioxidant
agents, but also the profile of their polyphenolic compounds;
GPE and GSE are able to provide fungicidal and fungistatic protection and control of
OTA production in wheat grain at least similar to BHT;
The efficiency of these extracts to control the fungal development and OTA production in
wheat grain, highly recommends them as natural additives in antifungal treatments applied
to cereals for human consumption or feed;
These extracts could be a valuable alternative to conventional methods used for control of
OTA production in stored cereals;
In regard to the inhibitory effect of above mentioned essential oils obtained from aromatic
herbs and spices, we can say that the treatment with these oils led to the inhibition of
Fusarium mycotoxins production in wheat grain;
The essential oils with the best antifungal properties was not the most effective inhibitor in
Fusarium mycotoxins production;
There was not recorded a good correlation correlation between Fusarium mycotoxins
production expressed by FUMO content and antioxidant activity of essential oils
suggesting that, the antioxidant properties of essential oils have not a crucial role in
expression of antimycotoxin effect;
Although it has been found a strong positive correlation between FRAP and TP of
investigated essential oils, in addition to polyphenolic compounds from essential oils,
there are other compounds involved in the expression of their inhibitory potential on
Fusarium mycotoxins production.
Considering the proven inhibitory potential of investigated essential oils on Fusarium
mycotoxins production, we strongly recommend them as natural preservative agents that
could be applied during cereals storage.
Mariana-Atena POIANA Habilitation Thesis
105
Section II
Academic and professional achievements
This part of Habilitation Thesis summarises the main academic and professional
achievements of the candidate in the last 10 years, in the period 2003-2013, after defending the
PhD Thesis and confirmed by The Ministry of Education and Research, on the basis of Order no.
3896, dated 24.04.2003.
In terms of professional and academic achievements, the period after defending the PhD
thesis is divided into two parts.
In the first part, between years 2003-2007, I paid a particular attention to the study
disciplines taught, especially at bachelor level. As a lecturer, I taught Fermentative and extractive
technologies and Vegetal food technologies to the students from the Faculty of Food Processing
Technology.
In this direction, I reviewed the laboratory works; also, I introduced new applications and
technological calculations which contributed to the understanding of technological issues in the
field of above mentioned subjects. Also, the courses for my teaching classes was completed and
organized in a form easily accessible for students. Thus, I have published to CNCSIS recognized
publishing houses 2 books and a practical work textbook, as follows:
Poiana Mariana-Atena, Fermentative and extractive technologies (published in
Romanian), EUROBIT Publishing House, Timisoara, ISBN 973-620-126-0, 438 pp.,
2004.
Poiana Mariana-Atena, Vegetal food technologies (published in Romanian), EUROBIT
Publishing House, Timisoara, ISBN 973-620-180-5, 297 pp., 2005.
Poiana Mariana-Atena, Vegetal food technologies. Methods of analysis, applications and
technological calculations (published in Romanian), EUROBIT Publishing House,
Timisoara, ISBN 973-620-129-5, 242 pp., 2004.
Along with my professional evolution, the thematic of subjects taught was updated, so in
2007, I published 2 books as follows:
Poiana Mariana-Atena, Extractive technologies (published in Romanian), SOLNESS
Publishing House, Timisoara, ISBN 978-973-729-106-6, 276 pp., 2007.
Poiana Mariana-Atena, Fermentative products technologies (published in Romanian),
EUROBIT Publishing House, Timisoara, ISBN 978-973-620-287-2, 397 pp., 2007.
At the same time, during this period I was involved in many research topics that address
aspects of nutrition in order to protect health through nutritional intervention with antioxidant
functional foods. Thus, we performed screening of quality for some matrices of functional food
and studies concerning the bioavailability of polyphenols and vitamins in various natural extracts
intended to obtain functional food.
Below are presented the national research projects that I attended in this period:
Mariana-Atena POIANA Habilitation Thesis
106
Grant AT, Theme no. 3/2003, no. 33556/1.07.2003, theme: Research on the isolation,
purification and characterization of some active principles from phytoncides class, 2003-
2005, project director Mucete Daniela
Grant AT, theme no. 1, code CNCSIS 4, no. 33370/29.06.2004, theme: Food processing
- means for reducing of cereal fungal contamination, 2004-2005, project director Alexa
Ersilia
Project CEEX 10/2005, theme: Study of synergistic bioactivity of antioxidant functional
food in reversible metabolic syndrome (MET-ANTIOX), 2005–2007, project director Dragan
Simona
Project CEEX, 44/2006, theme: “The impact of multicomponent functional foods to
combat obesity and atherosclerosis ANTIATERO-ALIM”, 2006-2008, project director Dragan
Simona
Project no. 3941/2007, PNCDI2/Module IV/Partnerships in priority areas, no.
7368/06.11.2007, theme: Performant piezoelectric sensor based on new structure alpha-
quartz type, sensors for food quality and safety (SENZ-ALIM), project director Miclau
Marinela
Also, during this period I coordinated two research themes with the economic
environment (Contract 7139/06.11.2007 between USAMVB Timisoara and S.C. LEGOFRUCT
SRL from Timisoara and Contract 5737/14.09.2007 between USAMVB Timisoara and S.C.
PADURE FRUCTE PROD SRL from Caransebes) focused on the influence of processing
techniques on sensory and physico-chemical characteristics of some fruits and vegetables from
conventional and organic farming as well as on the assessment of anthocyanin pigments in various
berries grown under protected conditions (greenhouse).
During this time I began the first studies on the analysis of red wine color and antioxidant
properties. Actually, it is the time when I started an extensive documentation on this theme, I
began to put into practice the studied aspects, I tried to adapt some methods for determination of
total antioxidant capacity and phenolics content, I applied some selective methods for wine color
analysis. It was a period of massive theoretical and practical accumulations, it was the proper
time to learn some techniques of analysis and analytical issues that I applied in my further
studies. This period has been a journey with many questions, searches, replies discovered only
after a long study, it was my road towards some independent research directions, it was my
beginning in this field, the basis for my professional defining. During this period I started to
publish my first results in this area. The work from this period has materialized by publishing of 4
articles in ISI quoted journals, 19 articles in other journals included in international data basis and
also, I participated with 4 papers to international conferences.
In the second part of my activity, since 2008 till 2013, I scored the most professional and
academic achievements. During this time I worked, but I also initiated numerous research topics
and, as a result of this work I have completed several publications (books, book chapters, articles)
with a great importance in my professional evolution.
In 2008, as a result of theoretical and practical studies undertaken in the previous stage, I
finished the book ”The analysis of red wine color (published in Romanian)”, author: Poiana
Mariana-Atena POIANA Habilitation Thesis
107
Mariana-Atena, EUROBIT Publishing House, Timisoara, ISBN 978-973-620-378-7, 181 pp.
Also, in 2008 I wrote a book chapter (Chapter 2.3.: ”Phenolic compounds with antioxidant
activity from grapes and wine”, pp. 217-272) in book: “Functionally alimentation with natural
bioactive components in metabolic syndrome” (published in Romanian), coordinators: Dragan
Simona, Gergen Iosif, Socaciu Carmen, EUROSTAMPA Publishing House, Timisoara, ISBN
978-973-687-761-2, 2008. Some of these materials are useful in performing courses and practical
works for ”Advanced technologies for obtaining of vegetal products” at Master program
”Advanced technologies for agricultural raw materials processing” (Faculty of Food Processing
Technology), respectively “Special techniques for obtaining of different types of wines” at Master
program ”Quality of viti-vinicole products and by-products (Faculty of Horticulture and
Forestry).
In 2009 I published the book ”Techniques for minimal processing of food products
(published in Romanian)” [Poiana Mariana-Atena, Editura SOLNESS, Timisoara, ISBN 978-
973-729-165-3, 222 pp.]. Currently, this material is useful for course ”Advanced food processing
techniques” taught at Master program titled “Food. Human Nutrition”.
In 2010 I published the practical textbook ”Fermentative technologies. Methods of
analysis, applications and technological calculations (published in Romanian)” [Poiana Mariana-
Atena, Diana Moigradean, SOLNESS Publishing House, Timisoara, ISBN 978-973-729-239-1,
231 pp.] useful for performing laboratory works to bachelor and also, to Master programs.
During this period I was involved in 5 research projects (2 international and 3 national)
and a POSDRU project. Of these, I coordinated as director 2 and I participated as researcher in 3
projects, as follows:
Project Director
Bilateral Project Romania-Greece, Program Capacities/Module III, no. 565/01.06.2012,
theme: Rapid Spectroscopic Methods for assessment of olive oil quality and adulteration
(SPECTRAOIL), 2012-2014, value 21710 lei, project director: Poiana Mariana-Atena [http://uefiscdi.gov.ro/userfiles/file/CAPACITATI/Bilaterale/RO-GR/Lista%20proiecte%20bilaterale%20Romania%20Grecia-
de%20contractat.pdf].
Research Project no. 637/21.01.2009 between USAMVB Timisoara and S.C. ETCO
EUROPE TRADE COMPANY SRL from SEBIS, ARAD County, theme: Studies
regarding the impact of some technological treatments on antioxidant characteristics of
some wild berries based products, 2009-2011, value 45 000 lei, project director: Poiana
Mariana-Atena.
Researcher
Project from Regional Program for Cooperation with South-East Europe (ReP-SEE), [http://plus.see-era.net]
, Reference number: ERA 139/01, theme: Systems to reduce mycotoxin
contamination of cereals and medicinal plants in order to preserve the native species and
traditional products in Romania-Serbia-Croatia, 2010-2012, [http://www.cereals-mycotoxins.ro]
.
Project from MAKIS Program funded by The World Bank, no. 141529/2008, AG no.
142.004/02.10.2008, theme: The implementation of modern technological systems to
obtain dietary floury food, 2008-2011, [http://www.alimente-dietetice-fainoase.ro/index.html].
Mariana-Atena POIANA Habilitation Thesis
108
Project no. 52157/2008, PNCDI2/Module IV/Partnerships in priority areas, no.
6324/23.09.2008, theme: “Interdisciplinary research on the soil-plant correlations,
establishment of some transfer factors for areas with historical anthropogenic pollution”,
2008-2011, total value 2000000 lei/for BUASVM 300000 lei, [www.ubm.ro/sites/CISPPA_2008/cisppa_2008.html]
.
The Bilateral Project Romania-Greece is focused on strengthening the relation between
the two teams (from Romania and Greece) with complementary skills and establishing a
framework for further collaborations. The food security has become a domain of highest priority
and, I strongly believe that this collaboration has allowed the development of complementary
methods for detection of olive oil adulteration and degradation. In the frame of this project I set a
close cooperation with Prof. Dr. Georgiou Constantinos from Agricultural University of Athens,
Chemistry Laboratory and Senior researcher Dr. George Mousdis from National Hellenic
Research Foundation, Theoretical and Physical Chemistry Institute in order to develop fast and
low-cost spectroscopic methods for detection of olive oil adulteration and evaluation of olive oils
quality in response to thermal and/or UV treatments. To achieve this objective was performed a
comparative study between two spectroscopic techniques: synchronous scanning fluorescence
spectroscopy (SSF) and FT-IR spectroscopy combined with chemometric analysis of spectral
obtained data for analysis of adulterated olive oils with low cost oils (e.g. sunflower, soybean,
corn germ oil) or thermally degraded olive oils. During this project, I together with other 3
researchers from project team performed mobilities in Greece (Athens) to National Hellenic
Research Foundation, Theoretical and Physical Chemistry Institute and Agricultural University of
Athens, Chemistry Laboratory (17-22 September 2013). Also, I organized two lectures (on
November 2012 and 2013) at Faculty of Food Processing Technology (Banat’s University of
Agricultural Sciences and Veterinary Medicine from Timisoara), and our partners from Atena
held lectures about “Use of florescence spectroscopy for detection of oil adulteration and
degradation”, “Toxicity assessment of carbonyl compounds during edible oil thermal stress” and
“Food Authentication: Analysis, Regulation & Consumers”.
The purpose intended in the frame of research project with economical environment
coordinated by me as director (contract no. 637/21.01.2009 between USAMVB Timisoara and
S.C. ETCO EUROPE TRADE COMPANY SRL from SEBIS, ARAD County) was to develop
simple ways to improve the antioxidant properties and color stability of gelled fruit products. For
this purpose, I have contributed with studies on the following concerns:
Assessing the impact of freezing and frozen storage on antioxidant properties and color
stability of some wild berries;
Evaluation the impact of fruit thermal treatment applied for jam processing as well as the
effect of jam storage on antioxidant properties and color indices of resulted gelled fruit
products;
Providing of some viable solutions in order to improve the antioxidant properties and
color quality of finished products.
Developing of some recipes for low-sugar jams with improved antioxidant properties.
Mariana-Atena POIANA Habilitation Thesis
109
The aim of research performed for solving of MAKIS Project was to obtain and
characterise some dietary floury food for both people with various diseases (diabetes, gluten
intolerance, errors of metabolism) and healthy people, but with specific food needs (infants,
pregnant women, athletes, overweight people) [http://www.alimente-dietetice-fainoase.ro/index.html]
.
In the realisation of this project I have contributed with studies on the obtaining and
characterization of dietary floury products, as follows: gluten free products (based on premixes,
bakery products, biscuits) for people intolerant to gluten (celiac disease); aproteic products
(premixes, bakery products, biscuits), products for people with errors of metabolism
(phenylketonuria); hypoglucidic products for people with diabetes; infant products and baby food
based on cereal, with or without addition of fruits and vegetables; iron fortified products
specifically designed for people with anemia; floury products for elderly.
As a result of our activity, it was registered 3 Trademarks to OSIM, as follows:
Certificate of Trademark Registration to OSIM no. 112438, for Trademark: TPA DIET
HIPOGLUCIDICBISC, deposit number M 2010 05684, C1:30: Biscuits (hypoglucidic
biscuits with chickpeas for people with diabetes, except for medical use).
Certificate of Trademark Registration to OSIM no 112402, for Trademark: TPA DIET
COZOHIPOGLUC, deposit number M 2010 05685, C1:30: Pastry product (hypoglucidic
cake with fruit jelly for people with diabetes, except for medical use).
Certificate of Trademark Registration to OSIM no. 112403, for Trademark: TPA DIET Fe
NUTRIPREMIX, deposit number M 2010 05686, C1:30: Gris (Nutritive premix, enriched
in iron, based on semolina wheat, lentils and apricots).
Trademarks owners: Alexa Ersilia Calina, Trasca Teodor Ioan, Poiana Mariana-Atena,
Pop Georgeta, Stoin Daniela, Negrea Monica, Cocan Ileana
Among these ones, the dietaty product TPA DIET – COZOHIPOGLUC won:
gold medal at European Exhibition of Creativity and Innovation (EURO INVENT, 11
May 2013, Iasi, Romania);
gold medal and diploma of excellence at the International Exhibition of Inventions
(PROINVENT, the XI Edition, 19-22 March, 2013, Cluj-Napoca)
In the frame of this project I participated in the organization of workshop [http://www.alimente-
dietetice-fainoase.ro/index.html] to Faculty of Food Processing Technology (in 2010, September 2). Also, I
was lecturer for two sections: (i) Physico-chemical and nutritional characterization of dietary
floury food. Theoretical and practical aspects; (ii) The importance of germinared cereals in
processing of dietary floury food” in the specialization course ”Dietary food - characterization,
processing technology and health impact” organized from the funds of this project at Banat’s
University of Agricultural Sciences and Veterinary Medicine, Faculty of Food Processing
Technology between 5-21 May, 2011[http://www.alimente-dietetice-fainoase.ro/index.html]
.
The material
presented by me at this course was published as a chapter entitled “The importance of germinated
cereals in processing of dietary floury food” in the course support.
Some of the results obtained in this project have been published in the book “Dietary
floury foods testing and their impact on consumer” (published in Romanian), authors: Ersilia
Mariana-Atena POIANA Habilitation Thesis
110
Alexa, Mariana-Atena Poiana, Monica Negrea, SOLNESS Publishing House, Timisoara, ISBN
978-973-729-242-1, 83 pp., 2010.
In the frame of project ERA 139/01[http://plus.see-era.net], from Regional Program of
Cooperation with South-East Europe (ReP-SEE), I was involved in the solving of following
objectives: (i) monitoring the content of mycotoxins in cereal grains and medicinal plants from
west part of Romania (ii) the possibility to control the mycotoxin production in cereals and
medicinal herbs by using of bioactive compounds. For this purpose, I attended the training stage
performed by DIAMEDIX IMPEX S.A (Bucuresti) for quantitative determination of mycotoxins
in accordance with the legislation using ELISA-RIDASCREEN tests. As a result of work in the
frame of this project, we have published 2 chapters: (i) Chapter VI: The occurence of fungal and
mycotoxins in cereals from west Romania (published in English), pp. 144-164, authors: Ersilia
Alexa, Mariana-Atena Poiana, Renata-Maria Sumalan, Monica Negrea and (ii) Chapter VII:
Strategies to reduce fungal and mycotoxins contamination of cereals and medicinal plants
(published in English), pp. 165-185, authors: Ersilia Alexa Mariana-Atena Poiana, Renata-Maria
Sumalan, Monica Negrea in the book “Occurence of fungi and mycotoxins in cereals and
medicinal plants from Romania-Serbia-Croatia area”, coordinators: Ersilia Alexa, Biljana
Avramovic, Jasenka Cosic, EUROBIT Publishing House, Timisoara, 2012, ISBN 978-973-620-
935-2.
Also, I was involved in the publication of a booklet entitled ”Strategies for prevention
and control of mycotoxin contamination in cereals and medicinal herbs” (published in English),
authors: Ersilia Alexa, Biljana Abramovic, Jasenka Cosic, Georgeta Pop, Mariana-Atena Poiana,
Calin Jianu, Monica Negrea, EUROBIT Publishing House, Timisoara, ISBN 978-973-620-919-2,
63 pp. 2012. In addition, during the implementation of this project, I performed mobilities in
Croatia (Osijec) to University of Osijek.
In last years I attempted to publish the results of my studies in ISI quoted journals,
considering that such publications give international visibility and prestige to those who are
involved in the field of education and research. Therefore, in the period 2008-2013, I have
published 19 articles in international ISI quoted journals (9 as first author, 1 as corresponding
author, 9 as co-author). 10 of these articles were presented in detail in this thesis (Part I/Section
I). Also, 11 ISI quoted papers were awarded by UEFISCDI/Program - Human Resources/Awards
for research results/Articles. Also, I have published 17 articles in journals included in
international data basis (7 as first author, 10 as co-author, 3 with international partnership), and
20 articles were presented at international conferences.
Since 2008, I have coordinated the Master program ”Advanced technologies for
agricultural raw materials processing” at Faculty of Food Processing Technology from our
university. In this quality, I have dealt with curriculum development by introducing of new
courses, the diversification of optional study packages, the updating of curriculum to
requirements of jobs market.
In the frame of Project POSDRU 86 “University for future”, DMI 1.2 “Quality in Higher
Education”, with theme: “Improving Master programs in the agrofood field by promoting
Mariana-Atena POIANA Habilitation Thesis
111
innovation and quality assurance, according with qualifications requirements of the Romanian
and European Union” (CALIMAS)[http://calimas.usamvcluj.ro/]
. I have been short-term expert,
responsible for curriculum analysis. For this purpose I have dealt with: (i) the analysis of the
content and compatibility of Master programs in the field of food science that run in the
universities from Romania and EU countries; (ii) development of some Master Programs
Framework in the field of food science; (iii) defining of key concepts, specific and generic
descriptors, knowing and functional skills as well as correlations between skills - areas of content
- study courses - number of credits for the Master Programs Framework.
In addition to the aforementioned achievements, I was member in the scientific committee
for “The 4th
International Conference on Food Chemistry, Engineering & Technology” (May 30–
31, 2013, Timişoara, Romania[http://www.usab-tm.ro/utilizatori/tpa/file/manifestari/Invitation_2013_TPA_Timisoara.pdf]
.
Also, I’m member in Editorial Advisory Board of Banat’s Journal of Biotechnology [http://www.bjbabe.ro/editorial-advisory-board/]
.
I’m member in 3 professional Associations as follows: Association of Food Industry
Specialists from Romania - from Education, Research and Production (no. 190); Chemical
Society from Romania (ID 1793) and General Association of Engineers from Romania (no.
60732). Also, I’m expert evaluator for Romanian Agency for Quality Assurance in Higher
Education.
My professional experience has been enhanced through participation as reviewer in peer-
review process for ISI journals such as: Food Chemistry; Food Science and Biotechnology;
Chemistry Central Journal, as evaluator for research project such as: Partnership, Human
Resources, Ideas and as a member in PhD Juries to the following thesis on my interest topics:
Member in the PhD Jury of Riron Ramona Cristina, theme: “Research concerning the
antioxidant activity of propolis extract from west part of Romania”, Banat,s University of
Agricultural Sciences and Veterinary Medicine, Faculty of Food Processing Technology,
November 2006.
Member in the PhD Jury of BUTA Nadina Ibolya, theme: ”Use of natural extracts in
order to improve the oxidative stability of some vegetable oils”, Banat,s University of
Agricultural Sciences and Veterinary Medicine, Faculty of Food Processing Technology,
September 2013.
Member in the PhD Jury of ROMAN Lucian-Alexandru, theme: ”Contributions to the
study of antioxidant and chromatic properties of red wines from west part of Romania”,
Banat,s University of Agricultural Sciences and Veterinary Medicine, Faculty of Food
Processing Technology, September 2013.
Mariana-Atena POIANA Habilitation Thesis
112
PART II
Career evolution and development plans
Mariana-Atena POIANA Habilitation Thesis
113
1. Plans for scientific evolution and development
The scientific development plans in my interest field is heading towards the same issues
previously mentioned. Considering the results obtained till now, I will continue the work related
to bioactive compounds - antioxidant properties of red wine and fruit products for a better
assessment of some aspects concerning the impact of different factors, treatments, processing
methods on these characteristics. For this purpose, the plan is structured on several interrelated
activities in my field of interest that fully complement each other and aims to develop the
knowledge in the above mentioned topics. These researches will complement the already
described studies.
Also, in the next years, I plan to grow my research on several key directions. My future
research will be focused on the study of possibilities to retain the active principles from different
vegetable matrices in food products and their influencing factors, to investigate the possibilities
to use non-destructive techniques such as NIR, FT-IR spectroscopy to detect the changes and
transformations occurring in foods in response to various techniques of processing.
For this purpose the following research topics will be continued or will be developed:
(i) Studies concerning the possibility to enhance the color stability of fruit products by
different copigments or cofactors addition. The results may be used for improving the
color quality of different berry products as well as for development of various foods with
anthocyanin-rich ingredients.
(ii) The identification of factors influencing the level of polyphenolic compounds and
polymeric pigments in red wines. The obtained results could be useful to gained more
information about wine pigments, especially the polymeric pigments which are the main
responsible for the permanent color of red wines. In parallel, will be assessed the impact
of enological practices (enzyme treatments, use of commercial tannins, use of alternative
oak sources, micro-oxygenation) on red wine antioxidant properties. Also, I will try to
assess the antioxidant capacity of red wines by using of multiple assays that could give an
overall picture about the antioxidant profile of red wines;
(iii) Assessing the impact of different pre-treatments and techniques used to obtain berries
juice on their polyphenolic compounds. These findings will be useful to processors for
improving the final content of polyphenolics compounds and antioxidant properties in
their products.
(iv) Evaluation the effect of pre-treatments and drying methods on anthocyanins from various
berries;
(v) Studies on the optimization of natural extracts rich in bioactive compounds obtaining from
different agro wastes by using of advanced techniques that could provide an innovative
approach to increase the production of specific compounds used as nutraceuticals or
ingredients in the design of functional foods;
(vi) The use of FT-IT spectroscopy for monitoring the lipid oxidation during thermal
processing and storage of vegetable oils. The information gained by performing of this
Mariana-Atena POIANA Habilitation Thesis
114
study will be useful in oil quality assessing, promoting the FT-IR spectroscopy as a
valuable tool with advantages in terms of speed and expense per analysis.
(i) A research direction that I've been thinking in recent years and I plan to approach in
the future is refers to the study of possibility to improve the stability of anthocyanins from
different berry products by different copigments or cofactors addition. Scientific research on the
chemistry of colors have become of a great significance for improving the color of different fruit
products. In berry products the color is an important quality parameter, which influences the
consumer’s behavior. This parameter could be improved and stabilized by copigmentation. I
agree with the opinion of many researchers according to which, copigmentation can be
considered a natural, valuable tool for improving the color of food products rich in anthocyanins.
Copigmentation reactions developed in different berry products and storage effects on the
copigmentation phenomenon are not fully studied until now. Therefore, more studies are required
concerning the copigmentation occurring in food products rich in anthocyanins. For this purpose
will be studied the factors which stabilize and enhance the anthocyanins color. I intent to test as
copigments both pure substances such as flavonoinds, phenolic acids as well as natural extracts
rich in cofactors. The overall objective of this direction is to study the factors that enhance and
stabilize the color of both pure anthocyanins and different berry juice as a material rich in
anthocyanins. The obtained results will contribute to the better understanding of the chemical
behavior of anthocyanins in different natural matrix.
The results reported by Wilska-Jeszka and Korzuchowska (1996) highlighted that
copigmentation is more intense in berry juices than when it was used the purified anthocyanin
molecules. This fact indicates that, there are several other components in the juice that play an
important role in the copigmentation phenomenon than just an added copigment molecule. Till
now, the most studied copigments were the flavonoids (flavones, flavonols, flavanones, and
flavanols). Also, phenolic acids such as caffeic acid, ferulic acid, gallic acid, chlorogenic acid,
rosmarinic acid have an important effect on the enhancement and stabilization of anthocyanins,
but these compounds have not been studied as extensively as flavonoids (Darias-Martin et al.,
2002; Talcott et al., 2003). Berries do not contain free phenolic acids in high amounts. There are
different plant materials that can be used as copigments. A potential source of copigments could
be the natural extracts obtained from wine industry by-products (Poiana, 2012) or the extracts
obtained from herbs belonging to the Lamiaceae family (Khomdram and Singh, 2011). Thus,
these extracts could be natural color enhancers, end they could be tested for this purpose. The
copigmentation reactions will be monitored using HPLC analysis to assess the changes in
anthocyanins, flavonoids and phenolics acid content, but in the same time for identifying the
compounds responsible for color enhancement. By using the spectrometry it will be possible to
notice the hyperchromic effect and bathochromic shift as a result of copigmentation phenomenon.
By color analysis it will be possible to quantify the main color parameters in order to follow the
color stability.
(ii) The main objectives of following research direction, which I consider important for
my career development, are to investigate the factors influencing the level of polyphenolic
Mariana-Atena POIANA Habilitation Thesis
115
substances, the formation polymeric pigments as well as the antioxidant profile during red wines
processing and aging. For solving of some problems, I will performe detailed studies concerning
the influence of commercial tannins addition, enzyme treatments, fermentation variables,
alternative oak sources, micro-oxygenation, fining agents (bentonite, gelatine), storage
temperature and storage time on color and antioxidant profile of red wines. Polymeric pigments
occurring in red wines during fermentation and wine aging are stable color compounds. They are
less affected by pH and SO2 than monomeric anthocyanin forms, and their color is usually stable
over storage time. Tannin concentrations seem to have more effect on the final concentrations of
polymeric anthocyanin than the content of monomeric anthocyanis. During aging, anthocyanins
react with tannins to form polymeric pigments or pigmented tannins which are considered to have
different protein-binding properties than tannin, and thus, may contribute to the reduction of wine
astringency (Remy et al., 2000). Polymerization of anthocyanins occurs most rapidly during
fermentation and maceration, but the process may continue throughout the life of red wine. In the
wine aging, a greater proportion of their anthocyanins content is polymerized. Like the other
wine polymers, they may also be removed due to precipitation. As a result, fining agents that
remove tannin may also remove polymeric anthocyanins and reduce the red wine color. It is
important to determine if the pre-fermentation treatments (enzyme treatments or the addition of
commercial tannins) affect the level of polymeric pigments before fermentation of grape must. In
this stage, phenolic compounds are extracted from skin and seeds, and their extraction is
influenced by winemaking procedures. The use of pectolytic enzymes have beneficial impact on
increasing the anthocyanins content in wines, being a common practice used in oenology.
Bautista-Ortin et al. (2005) reported that the macerating enzymes may help the extraction of
phenolics compounds. However, their addition may modify the color, stability, taste and structure
of red wines, because not only anthocyanins are released from skins, but also tannins bound to
the cell walls. Also is necessary to study the effect of fermentation variables on extraction of SPP
and formation of LPP during winemaking, with a special attention on temperature: by increasing
the maximum temperature, will increase the amount of tannin and SPP extracted from grapes as
well as the amount of LPP formed during fermentation.
Barrel aging affects the wine color and other sensory characteristic such as astringency
due to declining in amount of tannin and dramatically increasing in amount of LPP and SPP. It
will be interesting to see the red wine color behavior through maturation using of alternative oak
sources.
Another factor that could affect the wine color is micro-oxygenation. The results reported
by Castellari et al. (2000) have shown that oxygen supply has an essential role in improving of
red wine color, because the modification of phenolic compounds in response to oxidation result
in more colored and less astringent products. The oxygenation enhanced the content in LPP but
decreased the content of caffeic and ferulic acid, catechin, epicatechin and trans-resveratrol
compared to the control. On the one hand, oxygen treatment seems to have a negative impact on
antioxidant capacity of wine as a result of decreasing the content of low molecular weight
phenolics, but on the other hand is helpful for stabilizing the wine color.
Fining agents used in wine industry, such as bentonite, gelatine, casein, egg albumin can
lead to considerable decreases in some phenolic compounds (Stankovic et al., 2004; Castillo-
Mariana-Atena POIANA Habilitation Thesis
116
Sanchez et al., 2008). Thus, I intend to investigate the effects of fining agents on the structure of
red wines color as well as on their antioxidant properties.
Based on the knowledge derived from the above-mentioned research may be provided
solutions for improving the stability of the red wine color, as well as the enhancing its antioxidant
properties.
Regarding the antioxidant capacity of wine, it was mentioned by Rivero-Perez et al.,
(2007) the need to use more determination methods to have a wider picture of their multiple
effects. Previous studies on this topic usually reported data obtained from small group of wines.
Furthermore, the available researches were done using a reduced number of methods. Sometimes,
the results seem to be contradictory, inducing erroneous conclusions and some confusion about
the real antioxidant value of wines. For that reason, it is necessary to perform more studies using
a large numbers of samples, and different methodologies that could give an overall picture about
the antioxidant profile of red wines, which will be very useful for clarifying this confusing
situation. For this purpose can be applied different methods for assessing the total antioxidant
capacity such as: ORAC or oxygen radical absorbance capacity, ABTS or 2,2’-azinobis(3-
ethylbenzthiazoline-6-sulfonic acid), DPPH or 2,2-diphenyl-1-picrylhydrazyl, N,N-dimethyl-p-
phenylenediamine dihydrochloride, FRAP or ferric reducing antioxidant power, hydroxyl and
superoxide radical scavenger activities.
(iii) The next research direction with a great impact on my further evolution, is refer to the
evaluation of different pre-treatments and processing methods on the content and profile of
polyphenolic compounds in berry juice. In the juice processing technology, significant amounts
of health promoting compounds are left in the press cake. The polyphenol compounds contents
and their profiles in the processed juice differ from polyphenols in fresh berries matrix. The lost
of polyphenols may be significant during processing but it can be often reduced by choosing of a
proper processing technique. The objective of this study is to determine the effectiveness of
different pectolytic enzymes addition, initial heating, sulfur dioxide treatments, various
clarification treatments (by addition of pectinases, gelatine, silica gel, bentonite, cold storage of
the juice) and pasteurization to improve the color quality and antioxidant properties of berry
juice. The content and profile of anthocyanins, flavonols, and procyanidins, as well as the color
parameters and antioxidant properties will be determined throughout processing. Based on
obtained results it could be possible to determine the most appropriate pre-treatments and
processing method available to produce berry juice with a stable color and high antioxidant
properties.
(iv) This research direction is a consequence of the fact that the pre-treatments and drying
methods applied to different fruit rich in anthocyanins (blueberries, black and red currants,
strawberries, cherries) lead to a significant declines in anthocyanins content, phenolics and
antioxidant activity. Also, different degradation products of anthocyanins were identified in
samples. Since these fruit are seasonal and their life in fresh state is limited, they have to be
frozen or processed. Dried fruit are required in many breakfast cereals, cereal energy bars and
health bars. The freeze-drying treatment is an expensive option, thus, there is an increasing
Mariana-Atena POIANA Habilitation Thesis
117
interest in designing cost effective preservation methods able to reduce the losses of biologically
active compounds in dried fruit. For this purpose, various drying treatments (air-drying at high
and low temperatures, microwave drying, freeze-drying) will be assessed regarding the drying
parameters (time, temperature for air-drying, power and time for microwave drying) and quality
of the dried product in terms of anthocyanins, phenolic compounds as well as antioxidant activiy.
Prior to drying, the fruit will be dehydrated by osmosis using different solute and concentration
of osmotic solution in order to reduce the drying time and implicit, for minimizing the losses in
bioactive compounds.
(v) Vegetable wastes continue to be a rich and promising source of bioactive compounds.
In the next research direction I will try to exploit the potential of different agro wastes, such as
fruit seeds and peels resulted in fruit processing sector, to generate natural extracts having a high
level of bioactive components with particular advantages, by using of advanced techniques.
These extracts could be potentially used as nutraceuticals, ingredients in cosmetics,
pharmaceuticals, or in the design of functional foods. The main disadvantages of conventional
methods currently used for phenolic compounds extraction (maceration and Soxhlet extraction)
are low extraction efficiency and toxic solvent residues in the extracts because they use organic
solvent (methanol, ethanol, ethyl acetate, acetronitride) for extraction. The technological
advances and the development of new methods (Pressurized liquid extraction, Subcritical fluid
extraction, Supercritical extraction, Microwave-assisted extraction) for extraction of bioactive
compounds provide the opportunity to obtain natural extracts rich in active principles. These
methods are highly applicable in obtaining of extracts enriched in bioactive compounds from
natural products with several advantages over traditional extraction techniques, such as shorter
extraction time, lower cost of the solvent, higher quality of the extraction and environment
friendly.
(vi) Concerning the use of FT-IR spectroscopy for assessing the quality of edible oil, I
intend to deal with monitoring the oxidative processes occurring during thermall processing or
storage of edible oils. My concern for this topic has begun since 2012, in the frame of bilateral
project Romania-Greece conducted by me, when I started to use the FT-IR spectroscopy for
assessing the olive oil adulteration and degradation on the base of spectral changes at specific
wavenumbers. By oxidative degradation of lipids in response to thermal processing or storage,
substantial changes are taking place throughout the IR spectrum but most obviously are in the OH
region reflecting the formation of alcohols (~3544 cm−1
) and hydroperoxides (~3425 cm−1
), in the
single cis double bonds region (~3005 cm−1
), around 1740 cm−1
(specific to carbonylic
compounds resulted from the hydroperoxide decompositions) and in the fingerprint region
(1500−900 cm−1
) including the isolated trans portion (967 cm−1
). Also, the changes in region
(700–725 cm−1
) belong to the cis double bonds in unsaturated fatty acids. In addition, I am
considering improving the oxidative stability of edible oils by adding natural extracts as potential
additives with antioxidant properties. FT-IR spectroscopy could be a useful tool to assess the
oxidative stability of oils in a simple and fast way by detecting and quantifying the functional
groups arising during the oxidative degradation of lipids.
Mariana-Atena POIANA Habilitation Thesis
118
2. Plans for professional and academic evolution and development
Expanding both the research limits and capabilities to offer support in the field of the
bioactive compounds in food processing will be a continuous preoccupation. The experience
gained through the research concerning the impact of processes, techniques and storage
conditions on bioactive compound in vegetal food, in relation with their antioxidant properties
was partially included in the lectures at the graduate and undergraduate levels. Moreover, in some
of the laboratory works, some of these aspects are treated. I intend to constantly improve the
lectures with the new findings in the areas described above.
Based on the activities developed so far, an extensive set of activities in my interest fields,
both at national and international level, are expected. A successful activity for this purpose is not
possible without a solid team. The consolidation of research team will be one of the main
objectives for the next years. The results could be significantly enhanced if the interdisciplinary
research team will be enlarged with Master students and PhD students coordinated as a result of
the Habilitation Thesis.
Improving the cooperation with researchers and professors from different research centres
and universities both from EU countries and Romania is a priority of the research group. The
research activity will be funded by the national and European programs as well as by establishing
some contracts with private sector. The results are planned to be valorized in the scientific
community, but also to be oriented towards the public interested in the subjects of the research
activity.
With respect to the teaching activity, the course “Advanced food processing techniques”
from Master program “Food. Human Nutrition”, will be improved by adding new information
from the literature, as well as derived from my research activity. Also, the curriculum of the
course “Advanced technologies of plant origin food” taught at Master program “Advanced
technologies for processing of agricultural raw materials”, will be updated according to my
professional development.
In my opinion, university has the role to integrate research and education, and in the same
time to disseminate the knowledge towards social and economic environment. Moreover, I
consider that the sustainable development of food industry could be helped by addressing the
research themes related to immediately needs of this industry. The solving of these issues will
involve forms and methods of study whose main reason is to preserve as much as possible the
natural potential of raw material to offer foods rich in nutrients and biologically active
compounds for consumers.
The strategies applied for my future career development are considering the increase of
our university visibility in relationship to the European research centres of similar interest. It will
be another objective for the next years and I believe it will be possible by involving in common
research projects, exchange of Master or PhD students, exchange of researchers and by
publishing of some scientific materials. As a feed-back, these actions have the role to improving
the quality of scientific research. As a feed-back, these actions have the role to improving the
quality of scientific research.
Mariana-Atena POIANA Habilitation Thesis
119
As a form of exploitation of the results obtained in the research activity, I intend to
prepare a teaching program closely related to the needs and motivation of learners. I’m fully
aware that the main goal of the teaching/learning process is to provide to the learners a set of
knowledge and skills that can be used by them to meet their needs of knowledge and
communication. Therefore, I intend to adopt a dynamic form of teaching that can meet multiple
objectives and that can be easily adapted to the teaching needs. I think that teaching should be
flexible and dynamic to suit the learner's talent and ability while the teacher should be more
imaginative, creative and to persist in ensuring that all students receive the necessary knowledge
and skills. I will be focused to enhance the teaching qualities and also, I will try to give to my
students the opportunity to get more involved in the activities which could develop their interests.
Finally, it have to be underlined that my active role will continuously increase in the
future and the main indicators to quantify my professional and academic development as well as
evolution will be researches, lectures, and applicative works developed in the mentioned
directions.
In order to fulfill the ones previously mentioned, the following future actions will be
taken:
Applying the project proposals in research and teaching directions, both at national and
international level;
Including the results obtaining from research in the teaching programs, mainly for Master
and PhD;
The consolidation of research team by including of Master students and PhD students;
Creation of sustainable collaborative mechanisms with national and international partners
who work in the same or related research and teaching fields
Publishing the books and articles in specialized journals (especially ISI quoted) together
with other researchers and professors on the topics in our field of interest;
Participation with new research topics to international conferences;
Improving the cooperation with the economic field, especially in applicative research
direction.
The above described foreseen research directions and their results are strongly interesting
with respect to the general progress of the knowledge in the field of food technology with direct
applications on improving the content of bioactive compounds and antioxidant properties of
foods. Starting to the saying “We are what we eat”, the changing and opening of young
generation perception towards the improving of nutritional value and antioxidant properties of
food products, the knowledge of the influential factors regarding these characteristics, exploiting
the natural potential of raw material, applying of new methods, environment friendly, to obtain
foods with added nutritional and biological values, has to be a permanent concern. This can be
done by knowledge and education and the teachers, by their responsible actions, have a great role
for this purpose. Therefore, it is of a great importance to be performed a continuous action by
improving of curriculum for students, by publishing articles in newspapers, through organization
informative workshops and seminars.
Mariana-Atena POIANA Habilitation Thesis
120
Part III
References
Mariana-Atena POIANA Habilitation Thesis
121
Alcalde-Eon C., Escribano-Bailón M.T., Santos-Buelga C., Rivas-Gonzalo J.C. Changes in the detailed
pigment composition of red wine during maturity and ageing: A comprehensive study. Analytica Chimica
Acta. 2006, 563(1–2):238–254.
Aldred D., Cairns V., Magan N. Environmental factors affect efficacy of some essential oils and
resveratrol to control growth and ochratoxin A production by Penicillium verrucosum and
Aspergillus westerdijkiae on wheat grain. Journal of Stored Products Research. 2008, 44(4):341–
346.
Alexa E., Poiana M.A., Sumalan R.M. Mycoflora and ochratoxin a control in wheat grain using natural
extracts obtained from wine industry byproducts. International Journal of Molecular Sciences. 2012,
13(4):4949–4967.
Alexa E., Pop G., Sumalan R., Radulov I., Poiana M., Tulcan C. Fusarium species and Fusarium
mycotoxins in cereals from West Romania: preliminary survey. Communications in Agricultural and
Applied Biological Sciences. 2011, 76(4):661–666.
Alexa E., Dehelean C.A., Poiana M.A., Radulov I., Cimpean A.M., Bordean D.M., Tulcan C., Pop G.
The occurrence of mycotoxins in wheat from western Romania and histopathological impact as
effect of feed intake. Chemistry Central Journal. 2013, 7(1):99.
Al-Habib A., Al-Saleh E., Safer A.M., Afzal M. Bactericidal effect of grape seed extracton methicillin-
resistant Staphylococcus aureus (MRSA). Journal of Toxicology Science. 2010, 35(A):357–364.
Amakura Y., Umino Y., Tsuji S., Tonogai Y. Influence of jam processing on the radical scavenging
activity and phenolic content in berries. Journal of Agricultural and Food Chemistry. 2000,
48(12):6292–6297.
Amaral J.S,. Seabra R.M., Andrade P.B, Valentao P., Pereira J.A., Ferreres F. Phenolic profile in the
quality control of walnut (Juglans regia L.) leaves. Food Chemistry. 2004, 88(3):373–379.
Ancos B., Gonzalez E.M., Cano M.P. Ellagic acid, vitamin C, and total phenolic contents and radical
scavenging capacity affected by freezing and frozen storage in raspberry fruit. Journal of
Agricultural and Food Chemistry. 2000, 48(10):4565–4570.
Andres M.P.S., Otero J., Vera S. High performance liquid chromatography method for the simultaneous
determination of α- ,γ- and δ- tocopherol in vegetable oils in presence of
hexadecyltrimethylammonium bromide/n-propanol in mobile phase. Food Chemistry. 2011,
126(3):1470–1474.
AOAC: Vitamin C (ascorbic acid) in vitamin preparations and juices. In Helrich K. (Ed.). Official
Methods of Analysis. 15th edn. AOAC, Inc., Arlington VA. 2000:1058.
Arranz S., Jimenez J.P., Calixto F.S. Antioxidant capacity of walnut (Juglans regia L.): contribution of oil
and defatted matter, European Food Research and Technology. 2008, 227(3):425–431.
AOCS - Association of Coaching Supervisors. Official and Recommended Practices of the American Oil
Chemists’ Society, Official Methods and Recommended Practices, 5th ed.; Firestone, D., Ed.; AOAC
Press: Champaign, IL, USA, 1998.
Axelos M.A.V., Thibault, J.F. The chemistry of low-methoxyl pectin gelation. In The chemistry and
technology of pectin, Ed. by Walter R.H., New York: Academic Press, 1991. Bachgi D., Sen C.K., Bagchi M., Atalay M. Antiangiogenic, antioxidant and anticarcinogenic properties
of a novel anthocyanin-rich berry extract formula. Biochemistry. 2004, 69(1):95–102.
Bakker J., Preston N.W., Timberlake C.F. The determination of anthocyanins in aging red wines:
Comparisons of HPLC and spectral methods. American Journal of Enology and Viticulture. 1986,
37(2):121–126.
Bassole I.H.N., Juliani H.R. Essential oils in combination and their antimicrobial properties. Molecules.
2012, 17(4):3989–4006.
Bautista-Ortin A.B., Martínez-Cutillas A., Ros-García J.M., López-Roca J.M., Gómez-Plaza E. Improving
color extraction and stability in red wines: the use of maceration enzymes and enological tannins.
International Journal of Food Science and Technology. 2005, 40(8):867–878.
Mariana-Atena POIANA Habilitation Thesis
122
Beekwilder J., Jonker H., Meesters P., Hall R.D., van der Meer I.M., Rick de Vos C.H. Antioxidants in
raspberry: on-line analysis links antioxidant activity to a diversity of individual metabolites. Journal
of Agricultural and Food Chemistry. 2005, 53(9):3313–3320.
Bele C., Matea C., Raducu C., Miresan V., NEGREA O. Tocopherol content in vegetable oils using a
rapid HPLC fluorescence detection method. Notulae Botanicae Horti Agrobotanici. 2013, 41(1):93–
96.
Benzie I.F.F., Strain L. Ferric reducing ability of plasma (FRAP) as a measure of antioxidant power: The
FRAP assay. Analytical Biochemistry. 1996, 239(1):70–76.
Bluma R., Amaiden M.R., Etcheverry M. Screening of Argentine plant extracts: Impact on growth
parameters and aflatoxin B1 accumulation by Aspergillus section Flavi. International Journal of
Food Microbiology. 2008, 122(1-2):114–125.
Bonilla F., Mayen M., Merida J., Medina M. Extraction of phenolic compounds from red grape marc for
use as food lipid antioxidants. Food Chemistry. 1999, 66(2):209–215.
Boselli E., Boulton R.B., Thorngate J.H., Frega, N.G. Chemical and sensory characterization of DOC
wines from Marche (Italy) related to vintage and grape cultivars. Journal of Agricultural and Food
Chemistry. 2004, 52(12):3843–3854.
Boulton R. The co-pigmentation of anthocyanins and its role in the colour of red wine: A critical review.
American Journal of Enology and Viticulture. 2001, 52(2):67–87.
Boulton R. A method for the assessment of copigmentation in red wines. American Journal of Enology
and Viticulture. 1996, 47(3):346–361.
Bowen-Forbes C.S., Zhang Y., Nair M.G. Anthocyanin content, antioxidant, anti-inflammatory and
anticancer properties of blackberry and raspberry fruits. Journal of Food Composition and Analysis.
2010, 23(6):554–560.
Bozoglu F. Different mycotoxin inactivation applications and their inactivation mechanisms. Proceeding
for Natural Science Matica Srpska Novi Sad. 2009, 117:27–35.
Brannan R.G., Mah E. Grape seed extract inhibits lipid oxidation in muscle from different species during
refrigerated and frozen storage and oxidation catalyzed by peroxynitrite and iron/ascorbate in a
pyrogallol red model system. Meat Science. 2007, 77(4):540–546.
Brouillard R., Chassaing S., Fougerousse A. Why are grape/fresh wine anthocyanins so simple and why is
it that red wine color lasts so long? Phytochemistry. 2003, 64(7):1179–1186.
Brouillard R., Lang, J. The hemiacetal-cis-chalcone equilibrium of malvin, a natural anthocyanin.
Canadian Journal of Chemistry. 1990, 68(5):755–761.
Brownmiller C., Howard L.R., Prior R.L. Processing and storage effects on monomeric anthocyanins,
percent polymeric color, and antioxidant capacity of processed blueberry products. Journal of Food
Science. 2008, 73(5):72–79.
Brownmiller C., Howard L.R., Prior R.L. Processing and storage effects on procyanidin composition and
concentration of processed blueberry products. Journal of Agricultural and Food Chemistry. 2009,
57(5):1896–1902.
Buchweitz M., Nagel A., Carle R., Kammerer D.R. Characterization of sugar beet pectin fractions
providing enhanced stability of anthocyanin-based natural blue food colourants. Food Chemistry.
2012, 132(4):1971–1979.
Buchweitz M., Speth M., Kammerer D.R., Carle R. Impact of pectin type on the storage stability of black
currant (Ribes nigrum L.) anthocyanins in pectic model solutions. Food Chemistry. 2013, 139(1-
4):1168–78.
Bullerman L.B., Bianchini A. Stability of mycotoxins during food processing. International Journal of
Food Microbiology. 2007, 119(1–2): 140–146.
Burns J., Gardne, P.T., Matthews D., Duthie G.G., Lean M.E.J., Crozier A. Extraction of phenolics and
changes in antioxidant activity of red wines during vinification. Journal of Agricultural and Food
Chemistry. 2001, 49(12):5797–5808.
Mariana-Atena POIANA Habilitation Thesis
123
Bursac Kovacevic D., Levaj B., Dragovic-Uzelac V. Free radical scavenging activity and phenolic content
in strawberry fruit and jam. Agriculturae Conspectus Scientificus. 2009, 74(3):155–159.
Castellari M., Matricardi L., Arfelli G., Galassi S., Amati A. Level of single bioactive phenolic in red
wine as a function of the oxyen supplied during storage, Food Chemistry. 2000, 69(1):61–67.
Castillo-Sanchez J.X., Garcia-Falco M.S., Garrido J., Martinez-Carballoe E., Martins-Dias L.R., Mejutox
C. Phenolic compounds and colour stability of Vinhao wines: Influence of wine-making protocol and
fining agents. Food Chemistry. 2008, 106(1):18–26.
Cavalcanti R.N., Santos D.T., Meireles M.A.A. Non-thermal stabilization mechanisms of anthocyanins in
model and food systems-An overview. Food Research International. 2011, 44(2):499–509.
Chambers J.M., Cleveland W.S., Tukey P.A., Kleiner B. Graphical methods for data analysis. Pacific
Grove, CA: Wadsworth. Brooks/Cole. 1983:158–162.
Chantzos N.V., Georgiou A.C. Monitoring lipid oxidation events at frying temperatures through radical
scavenging assays. Chemical Industry and Chemical Engineering Quarterly. 2007, 13(3):163–166.
Chaovanalikit A., Wrolstad R.E. Anthocyanin and polyphenolic composition of fresh and processed
cherries. Journal of Food Science. 2004, 69(1):73–83.
Che Man Y.B., Liu J.L., Jamilah B., Rahman R.A. Quality changes of refined-bleached-deodorized (RBD)
palm olein, soybean oil and their blends during deep-fat frying. Journal of Food Lipids. 1999,
6(3):181–193.
Chia-Wen L., Chia-Wen Y., Sung-Chuan W., Kuang-Hway Y. DPPH free radical scavenging activity,
total phenolic contents and chemical composition analysis of forty-two kinds of essential oils.
Journal of Food and Drug Analysis. 2009, 17(5):386–395.
Choe E., Min D.B. Mechanisms and factors for edible oil oxidation. Comprehensive reviews in food
science and food safety. 2006, 5(4):169–186.
Chrpova D., Kourimska L., Gordon M.H., Hermanova V., Roubickova I., Panek J. Antioxidant activity of
selected phenols and herbs used in diets for medical conditions. Czech Journal of Food Sciences.
2010, 28(4):317–325.
Commission regulation (EC) No. 1126/2007. Official Journal of the European Communities. 2007,
255:14–17, http://eurlex.europa.eu/LexUriServ/LexUriServ.do?uri=OJ:L:2007:255:0014:0017:EN:PDF.
Da Silva Pinto M., Lajolo F.M., Genovese M.I. Bioactive compounds and antioxidant capacity of
strawberry jams. Plant Foods for Human Nutrition. 2007, 62(3):127–131.
Dambolena J.S., López A.G., Cánepa M.C., Theumer M.G., Zygadlo J.A., Rubinstein H.R. Inhibitory
effect of cyclic terpenes (limonene, menthol, menthone and thymol) on Fusarium verticillioides
MRC 826 growth and FUMO B1 biosynthesis. Toxicon. 2008, 51(1):37–44.
Dambolena J.S., Lopez A.G., Rubinstein H.R., Zygadlo J.A. Effects of menthol stereoisomers on the
growth, sporulation and FUMO B1 production of Fusarium verticillioides. Food Chemistry. 2010,
123(1):165–170.
Dangles O., Brouillard R. A Spectroscopic method based on the anthocyanin copigmentation interaction
and applied to the quantitative study of molecular complexes. Journal of the Chemical Society,
Perkin Transactions 2. 1992, 2:247–257.
Darias-Martin J., Martin-Luis B., Carrillo-Lopez M., Lamuela-Raventos R., Diaz-Romero C., Boulton R.
Effect of caffeic acid on the color of red wine. Journal of Agricultural and Food Chemistry. 2002,
50(7):2062–2067.
De Abreu, D.A.P, Losada P.P., Maroto J., Cruz J.M. Evaluation of the effectiveness of a new active
packaging film containing natural antioxidants (from barley husks) that retard lipid damage in frozen
Atlantic salmon (Salmo salar L.). Food Research International. 2010, 43(5):1277–1282.
De Beer D., Joubert E., Gelderblom W.C.A., Manley M. Changes in the Phenolic Composition and
Antioxidant Activity of Pinotage, Cabernet Sauvignon, Chardonnay and Chenin blanc Wines During
Bottle Ageing. South African Journal for Enology and Viticulture. 2005, 26(1):6–15.
Dehelean C., Alexa E., Feflea S., Pop G., Peev C. Ochratoxin A: A toxicologic evaluation usig in vitro
and in vivo bioassays. Annals of Oradea University - Biology Fascicola. 2011, 18(2):99–103.
Mariana-Atena POIANA Habilitation Thesis
124
Dobrei A., Poiana M.A., Sala F., Ghita A., Gergen I. Changes in the chromatic properties of red wines
from Vitis vinifera L. Cv. Merlot and Pinot Noir during the course of aging in bottle. Journal of
Food, Agriculture and Environment. 2010, 8(2):20–24.
Dostalova J., Hanzlik P., Reblova Z., Pokorny J. Oxidative changes of vegetable oils during microwave
heating. Czech Journal of Food Sciences. 2005, 23(6):230–239.
El Anany A.M. Influence of pomegranate (Punica granatum) peel extract on the stability of sunflower oil
during deep-fat frying process. Electronic Journal of Food and Plants Chemistry. 2007, 2(1):14–19.
El-Nawawi S.A., Heinkel Y.A. Factors affecting gelation of high ester citrus pectin. Process
Biochemistry. 1997, 32(5):381–385.
El-Saadany R.M.A. Kalaf H.H., Soliman M. Characterization of lipids extracted from peach kernels. Acta
Horticulturae. 1994, 368:123–127.
Erkan N., Ayranci G., Ayranci E. A kinetic study of oxidation development in sunflower oil under
microwave heating: effect of natural antioxidants. Food Research International. 2009, 42(8):1171–
1177.
Etcheverry M., Torres A., Ramirez M.L., Chulze S., Magan N. In vitro control of growth and FUMO
production by Fusarium verticilloides and Fusarium proliferatum using antioxidants under different
water availability and temperature regimes. Journal of Applied Microbiology. 2002, 92(4):624–632.
Fanelli C., Taddei F., Trionfetti Nisini P., Jestoi M., Ricelli A., Visconti A., Fabbri A.A. Use of resveratrol
and BHA to control growth and mycotoxin production in wheat and maize seeds. Aspects of Applied
Biology. 2003, 68:63–71.
Farhoosh R., Moosavi S.M.R. Evaluating the performance of peroxide and conjugated diene values in
monitoring quality of used frying oils. Journal of Agricultural Science and Technology. 2009,
11(2):173–179.
Farnochi M.C., Torres A.M., Magan N., Chulze S.N. Effect of antioxidants and competing mycoflora on
Fusarium verticillioides and F. proliferatum populations and fumonisin production on maize grain.
Journal of Stored Products Research. 2005, 41(2):211–219.
Fernandez-Pachon M.S., Villano D., Garcia-Parrilla M.C., Troncoso A.M. Antioxidant activity of wines
and relation with their polyphenolic composition. Analytica Chimica Acta. 2004, 513(1–2):113–118.
Fracassetti D., Del Bo’ C., Simonetti P., Gardana C., Klimis-Zacas D., Ciappellano S. Effect of time and
storage temperature on anthocyanin decay and antioxidant activity in wild blueberry (Vaccinium
angustifolium) powder. Journal of Agricultural and Food Chemistry. 2013, 61(12):2999–3005.
Frankel E.N., Huang S.W., Kanner J., German J.B. Interfacial phenomena in the evaluation of
antioxidants: bulk oils vs emulsions. Journal of Agricultural and Food Chemistry. 1994, 42(5):1054–
1059.
Frankel E.N., Meyer A.S. The problems of using one-dimensional methods to evaluate multifunctional
food and biological antioxidants. Journal of the Science of Food and Agriculture. 2000,
80(13):1925–1941. Gauche C., Da Silva Malagoli E., Luiz M.T.B. Effect of pH on the copigmentation of anthocyanins from
Cabernet Sauvignon grape extracts with organic acids. Scientia Agricola. 2010, 67(1):41–46.
Gertz C., Klosternmann S., Kochhar S.P. Testing and comparing oxidative stability of vegetable oils and
fats at frying temperature. European Journal of Lipid Science and Technology. 2000, 102(8-9):543–
551.
Gimenez J., Kajda P., Margomenou L., Piggott J.R., Zabetakis I. A study on the colour and sensory
attributes of high-hydrostatic-pressure jams as compared with traditional jams. Journal of the Science
of Food and Agriculture. 2001, 81(13):1228–1234.
Giusti M.M., Wrolstad R.E. Unit F1.2: Characterization and measurement of anthocyanins by UV-visible
spectroscopy, In Handbook of food analytical chemistry-pigments, colorants, flavors, texture, and
bioactive food components Ed. by Wrolstad RE, New York: John Wiley & Sons Inc. 2005:1–13.
Glories Y. La couleur des vins rouges. Connaissance de la Vigne et du Vin. 1984, 18(4):253–271.
Mariana-Atena POIANA Habilitation Thesis
125
Gonzalez E. M., De Ancos B., Cano M.P. Relation between bioactive compounds and free radical-
scavenging capacity in berry fruits during frozen storage. Journal of the Science of Food and
Agriculture. 2003, 83(7):722–726.
González-Manzano S., Dueñas M., Rivas-Gonzalo J.C., Escribano-Bailón M.T., Santos-Buelga C. Studies
on the copigmentation between anthocyanins and flavan-3-ols and their influence in the colour
expression of red wine. Food Chemistry. 2009, 114(2):649–656.
González-Manzano S., Santos-Buelga C., Dueñas M., Rivas-Gonzalo J.C. Escribano-Bailón, T. Colour
implications of self-association processes of wine anthocyanins. European Food Research and
Technology. 2008, 226(3):483–490.
González-Neves G., Franco J., Barreiro L., Gil G., Moutounet M., Carbonneau A. Varietal differentiation
of Tannat, Cabernet-Sauvignon and Merlot grapes and wines according to their anthocyanic
composition. European Food Research and Technology. 2007, 225(1):111–117.
Gonzalez-San Jose M.L., Santa-Maria G., Diez C. Anthocyanins as parameters for differentiating wines
by grape variety, wine-growing region, and wine-making methods. Journal of Food Composition and
Analysis. 1990, 3(1):54–66.
Guadalupe Z., Ayestarán B. Changes in the color components and phenolic content of red wines from
Vitis vinifera L. Cv. „Tempranillo” during vinification and aging. European Food Research and
Technology. 2008, 228(1):29–38.
Guendez R., Kallithraka S., Makris D.P., Kefalas P. Determination of low molecular weight polyphenolic
constituents in grape (Vitis vinifera sp.) seeds extracts: Correlation with antiradical activity. Food
Chemistry. 2005, 89(1):1–9.
Gutiérrez I.H., Lorenzo E.S., Espinosa A.V. Phenolic composition and magnitude of copigmentation in
young and shortly aged red wines made from the cultivars, Cabernet Sauvignon, Cencibel and Syrah.
Food Chemistry. 2005, 92(2):269–283.
Hager T.J., Howard L.R., Prior R.L. Processing and storage effects on monomeric anthocyanins, percent
polymeric color, and antioxidant capacity of processed blackberry products. Journal of Agricultural
and Food Chemistry. 2008, 56(3):689–695.
Hak E.A., Jing M., Powell C., Campos H., Gaziano M.J, Willet T.W.C., Stampfer M.J. Prospective study
of plasma carotenoids and tocopherols in relation to risk of ischemic Stroke. Stroke. 2004,
35(7):1584–1588.
Hammer O., Harper D.A.T., Ryan P.D. Past: paleontological statistics software package for education and
data analysis. Palaeontol Electron. 2001, 4(1):1–9.
Harbertson J.F., Picciotto E.A., Adams D.O. Measurement of polymeric pigments in grape berry extract
sand wines using a protein precipitation assay combined with bisulfite bleaching. American Journal
of Enology and Viticulture. 2003, 54(4):301–306
Hashem M., Moharam A.M., Zaied A.A., Saleh F.E.M. Efficacy of essential oils in the control of cumin
root rot disease caused by Fusarium spp. Crop Protection. 2010, 29(10):1111–1117.
Hassanein M.M.M. Studies on non-traditional oils: I. Detailed studies on different lipid profiles of some
Rosaceae kernel oils. Grasas y Aceites. 1999, 50(5):379–384.
He F., Liang N.N., Mu L., Pan Q.H., Wang J., Reeves M.J., Duan C.Q. Anthocyanins and their variation
in red wines I. Monomeric anthocyanins and their color expression. Molecules. 2012, 17(2):1571–
1601.
Hillmann M.C.R., Burin V.M., Bordignon-Luiz M.T. Thermal degradation kinetics of anthocyanins in
grape juice and concentrate. International Journal of Food Science and Technology. 2011,
46(9):1997–2000.
Holzwarth M., Korhummel S., Carle R., Kammerer D.R. Impact of enzymatic mash maceration and
storage on anthocyanin and color retention of pasteurized strawberry purées. European Food
Research and Technology. 2012, 234(2):207–222.
Mariana-Atena POIANA Habilitation Thesis
126
Holzwarth M., Korhummel S., Siekmann T., Carle R., Kammerer D.R. Influence of different pectins,
process and storage conditions on anthocyanin and colour retention in strawberry jams and spreads.
LWT- Food Science and Technology. 2013, 52(2):31–138.
Hope R., Aldred D., Magan N. Comparison of environmental profiles for growth and deoxynivalenol
production by Fusarium culmorum and F. graminearum on wheat grain. Letters in Applied
Microbiology. 2005, 40(4):295–300.
Hope R., Cairns-Fuller V., Aldred D., Magan N. Use of antioxidants and essential oils for controlling
mycotoxins in grain. BCPC International Congress - Crop Science & Technology. 2005, 1:429–436.
Howard L.R., Castrodale C., Brownmiller C., Mauromoustakos A. Jam processing and storage effects on
blueberry polyphenolics and antioxidant capacity. Journal of Agricultural and Food Chemistry.
2010, 58(7):4022–4029.
Hubbermann E.M., Heins A., Stőckmann H., Schwarz K. Influence of acids, salt, sugars and hydrocolloids
on the colour stability of anthocyanins rich blackcurrant and elderberry concentrates. European Food
Research and Technology. 2006, 223(1):83–90.
Hussain A.I. Characterization and biological activities of essential oils of some species of Lamiaceae. PhD
thesis. University of Agriculture, Faisalabad, Faculty of Sciences, Department of Chemistry and
Biochemistry. 2009. http://prr.hec.gov.pk/Thesis/154S.pdf
Isman B.M. Plant essential oils for pest and disease management. Crop Protection. 2000, 19(6):603–608.
Jajic I., Juric V., Glamocic D., Abramovic B. Occurrence of deoxynivalenol in maize and wheat in Serbia.
International Journal of Molecular Sciences. 2008, 9(11):2114–2126.
Jayaprakasha G.K., Selvi T., Sakariah K.K. Antibacterial and antioxidant activities of grape (vitis vinifera)
seed extracts. Food Research International. 2003, 36(2):117–122.
Jayaprakasha G.K., Singh R.P., Sakariah K.K. Antioxidant activity of grape seed
(Vitis vinifera) extracts on peroxidation models in vitro. Food Chemistry. 2001, 73(3):285–290.
Jianfu L.I., Jianshuang L.I., Huaiqing H.E. A simple and accurate approach to hierarchical clustering.
Journal of Computational Information Systems. 2011, 7(7):2577–2584.
Kalantzakis G., Blekas G. Effect of Greek sage and summer savory extracts on vegetable oil thermal
stability. European Journal of Lipid Science and Technology. 2006, 108(10):842–847.
Kalt W., Mc Donald J.E., Donnor H. Anthocyanins, phenolics, and antioxidant capacity of processed
lowbush blueberry products. Journal of Food Science. 2000, 65(3):390–393.
Kammerer D., Claus A., Carl, R., Schieber, A. Polyphenol screening of pomace from red and white grape
varieties (Vitis vinifera L.) by HPLC-DAD-MS/MS. Journal of Agricultural and Food Chemistry.
2004, 52(14):4360–4367.
Kampuse S., Kampuss K., Pizika L. Stability of anthocyanins and ascorbic acid in raspberry and
blackcurrant cultivars during frozen storage. Acta Horticulturae. 2002, 585:507–510.
Kasapis S. Viscoelasticity of oxidized starch/low methoxy pectin mixtures in the presence of glucose
syrup. International Journal of Food Science and Technology. 2002, 37(4):403–413.
Kelen M., Tepe B. Screening of antioxidative properties and total phenolic compounds of various extracts
of three different seed of grape varieties (Vitis vinifera L.) from turkish flora. Pakistan Journal of
Biological Sciences. 2007, 10(3):403–408.
Kennedy R., Lacey, J., Shekara S.H., Reddy M.J., Usha C.M., Patkar K.L. Control of moulding and
mycotoxin production in stored sorghum (Sorghum bicolor L. Moench) and rice (Oryza Sativa L.)
Using Organic Acids and Antioxidants. In Proceedings of the 5th International Working Conference
on Stored-Product Protection, Bordeaux, France. 9–14 September 1990, 337–345.
Khomdram S.D., Singh P.K. Polyphenolic compounds and free radical scavenging activity in eight
Lamiaceae Herbs of Manipur. Notulae Scientia Biologicae. 2011, 3(2):108–113.
Kim D.O., Padilla-Zakour O.I. Jam processing effect on phenolics and antioxidant capacity in
anthocyanin-rich fruits: cherry, plum and raspberry. Journal of Food Science. 2004, 69(9):395–400.
Kim R., Labella F. Comparison of analytical methods for monitoring autoxidation profiles of authentic
lipids. Journal of Lipid Research. 1987, 28(9):1110–1117.
Mariana-Atena POIANA Habilitation Thesis
127
Klopotek Y, Otto K, Bohm V. Processing strawberries to different products alters contents of vitamin C,
total phenolics, total anthocyanins, and antioxidant capacity. Journal of Agricultural and Food
Chemistry. 2005, 53(14):5640–5646.
Kmiecik W, Jaworska G, Budnik A. Effect of various thawing techniques on the quality of small fruit
frozen products. Roczniki Panstwowego Zakladu Higieny. 1995, 46(2):135–143.
Koca I., Sule Ustun N., Koca A.F., Karadeniz B. Chemical composition, antioxidant activity and
anthocyanin profiles of purple mulberry (Morus rubra) fruits. Journal of Food Agriculture and
Environment. 2008, 6(2):39–42.
Kopjar M., Pilizota V., Tiban N.N., Subaric D., Babic J., Ackar D., Sajdl M. Strawberry jams: influence of
different pectins on colour and textural properties. Czech Journal of Food Sciences. 2009, 27(1):20–
28.
Kopjar M., Pilizota V., Tiban N.N., Subaric D., Babic J., Ackar D. Effect of different pectin addition and
its concentration on colour and textural properties of raspberry jam. Deutsche Lebensm Rund. 2007,
103(4):164–168.
Krska R. Mycotoxins of growing interest - Zearalenone. Third Joint FAO/WHO/UNEP International
Conference on Mycotoxins. Tunis, 3–6 March 1999.
Kuiper-Goodman T. Mycotoxins: risk assessment and legislation. Toxicology Letters. 1995, 82–83:853–
859.
Kuiper-Goodman T., Scott P.M., Watanabe H. Risk assessment of the mycotoxin zearalenone. Regulatory
Toxicology and Pharmacology. 1987, 7(3):253–306.
Kumar V., Basu M.S., Rajendran T.P. Mycotoxin research and mycoflora in some commercially
important agricultural commodities. Crop Protection. 2008, 27(6):891–905.
Lafka T.I., Sinanoglou V., Lazos E.S. On the extraction and antioxidant activity of phenolic compounds
from winery wastes. Food Chemistry. 2007, 104(3):1206–1214.
Landrault N., Poucheret P., Ravel P., Gasc F., Cros G., Teissedre P.L. Antioxidant capacities and
phenolics levels of French wines from different varieties and vintages. Journal of Agricultural and
Food Chemistry. 2001, 49(7):3341–3348.
Lapornik B., Prošek M., Wondra A.G. Comparison of extracts prepared from plant by-products using
different solvents and extraction time. Journal of Food Engineering. 2005, 71(2):214–222.
Lee J., Durst R.W., Wrolstad R.E. Determination of total monomeric anthocyanin pigment content of fruit
juices, beverages, natural colorants, and wines by the pH differential method: Collaborative study.
Journal of AOAC International. 2005, 88(5):1269–1278.
Lewis C.E., Walker J.R.L., Lancaster J.E. Effect of polysaccharides on the colour of anthocyanins. Food
Chemistry. 1995, 54(3):315–319.
Li H., Wang X., Li Y., Li P., Wang, H. Polyphenolic compounds and antioxidant properties of selected
China wines. Food Chemistry. 2009, 112(2):454–460.
Lohachoompol V., Srzednicki G., Craske J. The change of total anthocyanins in blueberries and their
antioxidant effect after drying and freezing. Journal of Biomedicine and Biotechnology. 2004,
(5):248–252.
Magan N., Aldred D. Post-harvest control strategies: Minimizing mycotoxins in the food chain.
International Journal of Food Microbiology. 2007, 119(1-2):131–139.
Magan N., Aldred D., Hope R., Mitchell D. Environmental factors and interactions with mycobiota of
grain and grapes: Effects on growth, Deoxynivalenol and Ochratoxin production by Fusarium
culmorum and Aspergillus carbonarius. Toxins. 2010, 2(3):353–366.
Magan N., Aldred D., Mylona K., Lambert R.J. Limiting mycotoxins in stored wheat - a review. Food
additives & contaminants. Part A, Chemistry, analysis, control, exposure & risk. 2010, 27(5):644–
650.
Maletic E., Kontic J.K., Preiner D., Jeromel A., Patz C.D., Dietrich H. Anthocyanin profile and
antioxidative capacity of some autochthonous Croatian red wines. Journal of Food, Agriculture and
Environment. 2009, 7(1):48–51.
Mariana-Atena POIANA Habilitation Thesis
128
Malien-Aubert C., Dangles O., Amiot M.J. Color stability of commercial anthocyanin-based extracts in
relation to the phenolic composition. Protective effects by intra-and intermolecular copigmentation.
Journal of Agricultural and Food Chemistry. 2001, 49(1):170–176.
Mankeviciene A., Butkute B., Gaurilcikiene I., Dabkevicius Z., Suproniene S. Risk assessment of
Fusarium mycotoxins in Lithuanian small cereal grains. Food Control. 2011, 22(6):970–976.
Marin S., Ramos A.J., Cuevas D., Sanchis V. Fusarium verticillioides and Fusarium graminearum
infection and fumonisin B1 and zearalenone accumulation in resveratrol treated corn. Food Science
and Technology International. 2006, 12(4):353–359.
Marin S., Sanchis V., Ramos A.J. Plant products in the control of Mycotoxins and Mycotoxigenic fungi
on food commodities. In: Dubey NK (ed) Natural Products in Plant Pest Management. CAB
International. 2011:31–35.
Mazza G., Fukumoto L., Delaquis P., Girard B., Ewert B.V. Anthocyanins, phenolics, and color of
Cabernet Franc, Merlot, and Pinot Noir wines from British Columbia. Journal of Agricultural and
Food Chemistry. 1999, 47(10):4009–1017.
Mazza G., Miniati E. Grapes. In: Anthocyanins in fruits, vegetables and grains. Harbor (Ed.). Boca Raton,
CRC Press. London, UK. 1993:149–199.
Mazzaracchio P., Pifferi P., Kindt M., Munyaneza A., Barbiroli G. Interactions between anthocyanins and
organic food molecules in model systems. International Journal of Food Science and Technology.
2004, 39(1):53–59.
Medina-Juarez L.A., Gamez-Meza N., Ortega-Garcia J., Noriega-Rodriquez J.A., Angulo-Guerrero O.
Trans fatty acid composition and tocopherol content in vegetable oils produced in Mexico. Journal of
the American Oil Chemists' Society. 2000, 77(7):721–724.
Megahed M.G. Effect of microwave heating of linseed oil on the formation of primary and secondary
oxidation products. Agriculture and Biology Journal of North America. 2011, 2(4):673–679.
Menniti A.M., Gregori R., Neri F. Activity of natural compounds on Fusarium verticillioides and FUMO
production in stored maize kernels. International Journal of Food Microbiology. 2010, 136(3):304–
309.
Mercurio M.D., Dambergs R.G., Herderich M.J., Smith P.A. High throughput analysis of red wine and
grape phenolics adaptation and validation of methyl cellulose precipitable tannin assay and modified
somers color assay to a Rapid 96 Well Plate Format. Journal of Agricultural and Food Chemistry.
2007, 55(12):4651–4657.
Mielnik M.B., Olsen E., Vogt G., Adeline D., Skrede G. Grape seed extract as antioxidant in cooked, cold
stored turkey meat. LWT- Food Science and Technology. 2006, 39(3):191–198.
Min D.B., Boff J.M. Chemistry and reaction of singlet oxygen in foods. Comprehensive Reviews in Food
Science and Food Safety. 2002, 1(2):58–72.
Miniati E., Damiani P., Mazza G. Copigmentation and self-association of anthocyanins in food model
systems. Italian Journal of Food Science. 1992, 4(2):109–116.
Mirabel M., Saucier C., Guerra C., Glories Y. Copigmentation in model wine solutions: Occurrence and
relation to wine aging. American Journal of Enology and Viticulture. 1999, 50(2):211–218.
Monagas M., Bartolomé B., Gómez-Cordovés C. Evolution of polyphenols in red wines from Vitis
vinifera L. during aging in the bottle. European Food Research and Technology. 2005, 220(3–
4):331–340.
Monagas M., Martín-Álvarez P.J., Bartolomé B., Gómez-Cordovés C. Statistical interpretation of the
color parameters of red wines in function of their phenolic composition during ageing in bottle.
European Food Research and Technology. 2006, 222(5–6):702–710.
Moss M.O. Mode of formation of ochratoxin A. Food Additives & Contaminants. 1996, Supplement 13:5–
9.
Moura S.C.S.R., Rocha Tavares P.E., Germer S.P.M., Nisida A.L.A.C., Alves A.B., Kanaan A.S.
Degradation kinetics of anthocyanin of traditional and low-sugar blackberry jam. Food and
Bioprocess Technology. 2012, 5(6):2488–2496.
Mariana-Atena POIANA Habilitation Thesis
129
Moure A.., Cruz J.M., Franco D., Dominguez J.M., Sineiro J., Dominguez H., Nunez M.J., Parajo J.C.
Natural antioxidants from residual sources. Food Chemistry. 2001, 72(2):145–171.
Moyer R.A., Hummer K.E., Finn C.E., Frei B., Wrolstad R.E. Anthocyanins, phenolics, and antioxidant
capacity in diverse small fruits: Vaccinium, Rubus and Ribes. Journal of Agricultural and Food
Chemistry. 2002, 50(3):519–525.
Mullen W., Stewart A.J., Lean M.E., Gardner P., Duthie G.G., Crozier A. Effect of freezing and storage
on the phenolics, ellagitannins, flavonoids and antioxidant capacity of red raspberries. Journal of
Agricultural and Food Chemistry. 2002, 50(18):5197–5201.
Naeini A., Ziglari T., Shokri H., Khosravi A.R. Assessment of growthinhibiting effect of some plant
essential oils on different Fusarium isolates. Journal de Mycologie Medicale. 2010, 20(3):174–178.
Negro C., Tommasi L., Miceli A. Phenolic compounds and antioxidative activity from red grape marc
extracts. Bioresource Technology. 2003, 87:431–444.
Nerantzis E., Tataridis P. Integrated enology - utilisation of winery by-products into high added value
products. e-Journal of Science & Technology. 2006, 1(3):79–89.
Nesci A., Ferrari L., Etcheverry M. Effect of synthetic antioxidants on stored maize grain mycoflora in
situ. Journal of the Science of Food and Agriculture. 2008, 88(5):797–804.
Nyam K.L., Wong M.M., Long K., Tan C.P. Oxidative stability of sunflower oils supplemented with
kenaf seeds extract, roselle seeds extract and roselle extract, respectively under accelerated storage.
International Food Research Journal. 2013, 20(2):695-701.
Noormets M., Karp K., Starast M., Leis L., Muru K. The influence of freezing on the content of ascorbic
acid in Vaccinium species berries. Acta Horticulturae. 2006, 715:539–544.
Oakenfull D.G., Scott A.G. Gelation of high methoxyl pectins. Food Technology in Australia. 1985,
37(4):156–158.
Ollala M., Lopez M.C., Lopez-Garcia H., Villalon M., Gimwerez, L. Chromatic characterization of the
wine produced in the Spanish region Alpujara-Contraviesa. Ars Pharmaceutica. 1996, 37(1):53–62.
Ozcan M.M., Ozalp C., Unver A., Arslan D., Dursun N. Properties of apricot kernel and oils as fruit juice
processing waste. Food and Nutrition Sciences. 2010, 1(2):31–37.
Pantelidis G.E., Vasilakakis M., Manganaris G.A., Diamantidis Gr. Antioxidant capacity, phenol,
anthocyanin and ascorbic acid contents in raspberries, blackberries, red currants, gooseberries and
Cornelian cherries. Food Chemistry. 2007, 102(3):777–783.
Pascu L. Red wine quality establishing on the basis of chromatic properties. Revista de Chimie. 2005,
56(7):703–707.
Pastrana-Bonilla E., Akoh C.C., Sellapan S., Krewer G. Phenolic content and antioxidant capacity of
muscadine grapes. Journal of Agricultural and Food Chemistry. 2003, 51(18):5497–5503.
Patras A., Brunton N., Da Pieve S., Butler F. Impact of high pressure processing on total antioxidant
activity, phenolic, ascorbic acid, anthocyanin content and colour of strawberry and blackberry
purées. Innovative Food Science and Emerging Technologies. 2009, 10(3):308–313.
Patras A., Brunton N.P., O’Donnell C., Tiwari BK. Effect of thermal processing on anthocyanin stability
in foods; mechanisms and kinetics of degradation. Trends in Food Science and Technology. 2010,
21(1):3–11.
Peraica M., Domijan A.M., Miletic-Medved M., Fuchs R. The involvement of mycotoxins in the
development of endemic nephropathy. Wiener klinische Wochenschrift. 2008, 120(13–14):402–407.
Perez D.D., Strobel P., Foncea R., Diez M.S., Vasquez L., Urquiaga I., Castillo O., Cuevas A., San Martin
A., Leignton F. Wine, diet, antioxidant defenses and oxidative damage. Annals of the New York
Academy of Sciences. 2002, 957(1):136–145.
Perez-Jimenez J., Saura-Calixto F. Effect of solvent and certain food constituents on different antioxidant
capacity assays. Food Research International. 2006, 39(7):791–800.
Poiana M.A., The analysis of red wine color (published in Romanian), EUROBIT Publishing House,
Timisoara, 2008.
Mariana-Atena POIANA Habilitation Thesis
130
Poiana M.A., Dobrei A., Stoin D., Ghita A. The influence of viticultural region and the ageing process on
the color structure and antioxidant profile of Cabernet Sauvignon red wines. Journal of Food,
Agriculture and Environment. 2008, 6(3&4):104–108.
Poiana M.A., Moigradean D., Dogaru D., Mateescu C., Raba D., Gergen I. Processing and storage impact
on the antioxidant properties and color quality of some low sugar fruit jams. Romanian
Biotechnological Letters. 2011, 16(5):6504–6512.
Poiana M.A. Enhancing oxidative stability of sunflower oil during convective and microwawe heating
using grape seed extract. International Journal of Molecular Sciences. 2012, 13(7):9240–9259.
Poiana M.A., Alexa E., Mateescu C. Tracking antioxidant properties and color changes in low-sugar
bilberry jam as effect of processing, storage and pectin concentration. Chemistry Central Journal.
2012, 6:4.
Poiana M.A., Munteanu M.F., Bordean D.M., Gligor R., Alexa E. Assessing the effects of different
pectins addition on color quality and antioxidant properties of blackberry jam. Chemistry Central
Journal. 2013, 7:121.
Poiana M.A., Moigradean D., Raba D., Alda L.M., Popa M. The effect of long-term frozen storage on the
nutraceutical compounds, antioxidant properties and color indices of different kinds of berries.
Journal of Food Agriculture and Environment. 2010, 8(1):54–58.
Popa V.M., Bele C., Poiana M.A., Dumbrava D., Raba D.N., Jianu C. Evaluation of bioactive compounds
and of antioxidant properties of some oils obtained from food industry by-products. Romanian
Biotechnological Letters. 2011, 16(3):6234–6241.
Prakash B., Singh P., Kedia A., Dubey N.K. Assessment of some essential oils as food preservatives based
on antifungal, antiaflatoxin, antioxidant activities and in vivo efficacy in food system. Food Research
International. 2012, 49(1):201–208.
Prior R.L., Cao G., Martin A., Sofic E., Ewen Mc J., O’Brien C., Lischner N., Ehlenfeldt M., Kalt Krewer
W.G., Mainland C.M. Antioxidant capacity as influenced by total phenolic and anthocyanin content,
maturity and variety of Vaccinium species. Journal of Agricultural and Food Chemistry. 1998, 46(7):
2686–2693.
Puntaric D., Bosnir J., Smit Z., Skes I., Baklaic Z. Ochratoxin A in corn and wheat: geographical
association with endemic nephropathy. Croatian Medical Journal. 2001, 42(2):175–180.
Rababah T.M., Al-Mahasneh M.A., Kilani I., Yang W., Alhamad M.N., Ereifej K., Al-U'datt M. Effect of
jam processing and storage on total phenolics, antioxidant activity, and anthocyanins of different
fruits. Journal of the Science of Food and Agriculture. 2011, 91(6):1096–1102.
Rababah T.M., Ereifej K.I., Al-Mahasneh M.A., Ismaeal K., Al-Gutha H.A., Yang W. Total phenolics,
antioxidant activities, and anthocyanins of different grape seed cultivars grown in Jordan.
International Journal of Food Properties. 2008, 11(3):472–479.
Rababah T.M., Yucel S., Ereifej K.I., Alhamad M.N., Al-Mahasneh M.A., Yang W., Muhammad Al.H.,
Ismaeal K. Effect of grape seed extracts on the physicochemical and sensory properties of corn chips
during storage. Journal of the American Oil Chemists' Society. 2011, 88(5):631–637.
Rasooli I., Rezaei M.B., Allameh A. Growth inhibition and morphological alterations of Aspergillus niger
by essential oils from Thymus eriocalyx and Thymus x-porlock. Food Control. 2006, 17(5):359–364.
Reddy K.R.N., Farhana N.I., Salleh B., Oliveira C.A.F. Microbiological Control of Mycotoxins: Present
Status and Future Concerns. In Current Research, Technology and Education Topics in Applied
Microbiology and Microbial Biotechnology Ed. Mendez-Vilas A. Badajoz, Spain. 2010, 1078–1086.
Rehab F.M.A. Improvement the stability of fried sunflower oil by using different levels of Pomposia
(Syzyygium Cumini). Journal of Food Technology . 2010, 8(2):30–38.
Remy S., Fulcrand H., Labarbe B., Cheynier V., Moutounet M. First confirmation in red wine of products
resulting from direct anthocyanin-tannin reactions. Journal of the Science of Food and Agriculture.
2000, 80(6):745–751. Reynoso M.M., Torres A.M., Ramirez M.I., Rodriguez M.I., Chulze S., Magan N. Efficacy of antioxidant
mixtures on growth FUMO production and hydrolitic enzyme production by Fusarium verticilloides
and Fusarium proliferatum on maize media. Mycological Research. 2002, 106(9):1093–1099.
Mariana-Atena POIANA Habilitation Thesis
131
Ribéreau-Gayon P., Glories Y., Maujean A., Dubourdieu D. Handbook of Enology. Volume 2. The
Chemistry of Wine Stabilization and Treatments. 2nd ed.; John Wiley & Sons Ltd: Chichester, UK.
2005:141–204.
Richard J. Some major mycotoxins and their mycotoxicoses – An overview. International Journal of
Food Microbiology. 2007, 119(1–2):3–10.
Rivero-Perez D., Muniz P., Gonzalez-Sanjoseä M. Antioxidant profile of red wines evaluated by total
antioxidant capacity, scavenger activity, and biomarkers of oxidative stress methodologies. Journal
of Agricultural and Food Chemistry. 2007, 55(14):5476–5483.
Rommel A., Wrolstad R.E., Heatherbell D.A. Blackberry juice and wine: processing and storage effects
on anthocyanin composition, color and appearance. Journal of Food Science. 1992, 57(2):385–391.
Rota M.C., Herrera A., Martínez R.M., Sotomayor J., Jordán M.J. Antimicrobial activity and chemical
composition of Thymus vulgaris, Thymus zygis and Thymus hyemalis essential oils. Food Control.
2008, 19(7):681–687.
Roussis I.G., Lambropoulos I., Soulti K. Scavenging capacities of some wines and wine phenolic extracts.
Food Technology and Biotechnology. 2005, 43(4):351–358.
Sadilova E., Carle R., Stintzing F.C. Thermal degradation of anthocyanins and its impact on color and in
vitro antioxidant capacity. Molecular Nutrition & Food Research. 2007, 51(12):1461–1471.
Saitou N., Nei M. The neighbor-joining method: a new method for reconstructing phylogenetic trees.
Molecular Biology and Evolution. 1987, 4(4):406–425.
Savikin K., Zdunic G., Jankovic T., Tasic S., Menkovic N., Stevic T., Dordevic B. Phenolic content and
radical scavenging capacity of berries and related jams from certificated area in Serbia. Plant Foods
for Human Nutrition. 2009, 64(3):212–217.
Scalzo J., Politi A., Pellegrini N., Mezzetti B., Battino M. Plant genotype affects total antioxidant capacity
and phenolic contents in fruit. Nutrition. 2005, 21(2):207–213.
Schmidt B.M., Erdman Jr. JW., Lila M.A. Effects of food processing on blueberry antiproliferation and
antioxidant activity. Journal of Food Science. 2005, 70(6):389–394.
Schwarz M., Picazo-Bacete J.J., Winterhalter P., Hermosín-Gutiérrez I. Effect of copigments and grape
cultivar on the color of red wines fermented after the addition of copigments. Journal of Agricultural
and Food Chemistry. 2005, 53(21):8372–8381.
Scibisz I., Mitek M. The changes of antioxidant properties in highbush blueberries (Vaccinium
Corymbosum L.) during freezing and long-term frozen storage. ACTA Scientiarum Polonorum
Technologia Alimentaria. 2007, 6(4):75–82.
Shaker E.S. Antioxidative effect of extracts from red grape seed and peel on lipid oxidation in oils of
sunflower. LWT- Food Science and Technology. 2006, 39(8):883–892.
Shrikhande A.J. Wine by-products with health benefits. Food Research International. 2000, 33(6):469–
474.
Silva L., Pinto J., Carrola J., Paiva-Martins F. Oxidative stability of olive oil after food processing and
comparison with other vegetable oils. Food Chemistry. 2010, 121(4):1177–1187.
Singleton V.L., Orthofer R., Lamuela-Raventos R.M. Analysis of total phenols and other oxidation
substrates and antioxidants by means of Folin-Ciocalteu reagent. Methods in Enzymology. 1999,
299(Part A):152–178.
Soliman K.M., Badeaa R.I. Effect of oil extracted from some medicinal plants on different mycotoxigenic
fungi. Food and Chemical Toxicology. 2002, 40(11):1669–1675.
Somers T.C., Evans M.E. Wine quality: Correlations with colour density and anthocyanin equilibria in a
group of young red wines. Journal of the Science of Food and Agriculture. 1974, 25(11):1369–1379.
Somers T.C., Evans, M.E. Spectral evaluation of young red wines: Anthocyanin equilibria, total
phenolics, free and molecular SO2, and „chemical age”. Journal of the Science of Food and
Agriculture. 1977, 28(3):279–287.
Somers T.C., Evans M.E. Evolution of red wines. Ambient influences on colour composition during early
maturation. Vitis. 1986, 25:31–39.
Mariana-Atena POIANA Habilitation Thesis
132
Somers T.C., Pocock K.F. Evolution of red wines. III. Promotion of the maturation phase. Vitis. 1990,
29:109–121.
Soong Y.Y., Barlow P.J. Antioxidant activity and phenolic content of selected fruit seeds. Food
Chemistry., 2004, 88(3):411–417.
Soriano J.M., Dragacci S. Intake, decontamination and legislation of fumonisins in foods. Food Research
International. 2004, 37(4):367–374.
Soto Vázquez E., Río Segade S., Orriols Fernández I. Effect of the winemaking technique on phenolic
composition and chromatic characteristics in young red wines. European Food Research and
Technology. 2010, 231 (5):789–802.
Spigno G., Faveri D.M. Antioxidants from grape stalks and marc: Influence of extraction procedure on
yield, purity and antioxidant power of the extracts. Journal of Food Engineering. 2007, 78(3):793–
801.
Srivastava A., Akoh C.C., Yi W., Fischer J., Krewer G. Effect of storage conditions on the biological
activity of phenolic compounds of blueberry extract packed in glass bottles. Journal of Agricultural
and Food Chemistry. 2007, 55(7):2705–2713.
Srivastava P., Malviya R. Sources of pectin, extraction and its applications in pharmaceutical industry-An
overview. Indian Journal of Natural Products and Resources. 2011, 2(1):10−18.
Stankovic S., Jovic S., Zivkovic J. Bentonite and gelatine impact on the young red wine coloured matter.
Food Technology and Biotechnology. 2004, 42(3):183–188.
Sulieman A.E.M., El-Makhzangy A., Ramadan M.F. Antiradical performance and physicochemical
characteristics of vegetable oils upon frying of French fries: A preliminary comparative study.
Journal of Food Lipids. 2006, 13(3):259–276.
Sumalan R.M, Alexa E., Poiana M.A. Assessment of inhibitory potential of essential oils on natural
mycoflora and Fusarium mycotoxins production in wheat. Chemistry Central Journal. 2013, 7:32.
Syamaladevi R.M., Andrews P.K., Davies N.M., Walters T., Sablani S.S. Storage effects on anthocyanins,
phenolics and antioxidant activity of thermally processed conventional and organic blueberries.
Journal of the Science of Food and Agriculture. 2012, 92(4):916–24.
Talcott S.T., Brenes C.H., Pires D.M., Del Pozo-Insfran D. Phytochemical stability and color retention of
copigmented and processed muscadine grape juice. Journal of Agricultural and Food Chemistry.
2003, 51(4):957–963.
Tananuwong K., Tewaruth W. Extraction and application of antioxidants from black glutinous rice. LWT -
Food Science and Technology. 2010, 43(3):476–481. Torres J.L., Bobet R. New flavanol derivatives from grape (Vitis vinifera) by products. Antioxidant
aminoethylthio-flavan-3-ol conjugates from a polymeric waste fraction used as a source of flavanols.
Journal of Agricultural and Food Chemistry. 2001, 49(10):4627–4634.
Tsai O., Huang H. Effect of polymerization on the antioxidant capacity of anthocyanins in Roselle. Food
Research International. 2004, 37(4):313–318.
Tsai P.J., Delva L., Yu T.Y., Huang Y.T., Dufossé L. Effect of sucrose on the anthocyanin and antioxidant
capacity of mulberry extract during high temperature heating. Food Research International. 2005,
38(8–9):1059–1065.
Tsai P.J., Huang H.P., Huang T.C. Relationship between anthocyanin patterns and antioxidant capacity in
mulberry wine during storage. Journal of Food Quality. 2004, 27(6):497–505.
Tsanova-Savova S., Dimovw S., Ribarova F. Anthocyanins and color variables of Bulgarian aged Red
wines. Journal of Food Composition and Analysis. 2002, 15(6):647–654.
Turan S., Topcu A., Karabulut I., Vural H., Hayaloglu A.A. Fatty acid, triacylglycerol, phytosterol, and
tocopherol variations in kernel oil of Malatya apricots from Turkey. Journal of Agricultural and
Food Chemistry. 2007, 55(26):10787–94.
Turner N.W., Subrahmanyam S., Piletsky S.A. Analytical methods for determination of mycotoxins: a
review. Analytica Chimica Acta. 2009, 632(2):168–180.
Van der Merwe K.J., Steyne P.S., Fourie L.F., Scott D.B., Theron J.J. Ochratoxin A, a toxic metabolite
produced by Aspergillus Ochraceus Wilh. Nature. 1965, 205(4976):1112–1113.
Mariana-Atena POIANA Habilitation Thesis
133
Velluti A., Sanchis V., Ramos A.J., Egido J., Marın S. Inhibitory effect of cinnamon, clove, lemongrass,
oregano and palmarose essential oils on growth and FUMO B1 production by Fusarium proliferatum
in maize grain. International Journal of Food Microbiology. 2003, 89(2–3):145–154.
Versari A., Parpinello G.P., Mattioli A.U. Characterization of color components and polymeric pigments
of commercial red wines by using selected UV-VIS spectrophotometric methods. South African
Journal for Enology and Viticulture. 2007, 28(1):6–10.
Villano D., Fernandez-Pachon M.S., Troncoso A.M., Garcia-Parrilla M.C. Influence of enological
practices on the antioxidant activity of wines. Food Chemistry. 2006, 95(3):394–404.
Villano D., Fernandez-Pachon M.S., Troncoso A.M., Garcia-Parrilla M. Comparison of antioxidant
activity of wine phenolic compounds and metabolites in vitro. Analytica Chimica Acta. 2005, 538(1–
2):391–398.
Vollmannova A., Toth T., Urminska D., Polakova Z., Timoracka M., Margitanova E. Anthocyanins
content in blueberries (Vaccinium corymbosum L.) in relation to freesing duration. Czech Journal of
Food Science. 2009, 27(Special issue 1):S204–S206.
Walkinshaw M.D., Arnott S. Conformations and interactions of pectins. II. Models for junction zones in
pectinic acid and calcium pectate gels. Journal of Molecular Biology. 1981, 153(4):1075–1085.
Wilska-Jeszka J., Korzuchowska A. Anthocyanins and chlorogenic acid copigmentation. Influence on the
color of strawberry and chokeberry juices. European Food Research and Technology. 1996,
203(1):38–42. Wrolstad R.E., Durst R.W., Lee J. Tracking color and pigment changes in anthocyanin products. Trends in
Food Science and Techology. 2005, 16(9):423–428.
Yanishlieva N.V., Marinova E.M. Stabilization of edible oils with natural antioxidants. European Journal
of Lipid Science and Technology. 2001, 103(11):752–767.
Yemis O., Bakkalbasi E., Artik N. Antioxidative activities of grape (Vitis vinifera) seed extracts obtained
from different varieties grown in Turkey. International Journal of Food Science and Technology.
2008, 43(2):154–159.
Yilmaz Y., Toledo R.T. Major flavonoids in grape seeds and skins: Antioxidant capacity of catechin,
epicatechin, and gallic acid. Journal of Agricultural and Food Chemistry. 2004, 52(2):255–260.
Yilmaz Y., Toledo R.T. Oxygen radical absorbance capacities of grape / wine industry by products and effect
of solvent type on extraction of grape seed polyphenols. Journal of Food Composition and Analysis.
2006, 19(1):41–48.
Yuksel S., Koka I. Color stability of blackberry nectars during storage. Journal of Food Technology. 2008,
6(4):166–169.
Zafra-Stone S., Yasmin T., Bagchi M., Chatterjee A., Vinson J.A., Bagchi D. Berry anthocyanins as novel
antioxidants in human health and disease prevention. Molecular Nutrition and Food Research. 2007,
51(6):675–683.
Zhang L., Zhou J., Liu H., Khan M.A., Huang K., Gu Z. Compositions of anthocyanins in blackberry juice
and their thermal degradation in relation to antioxidant activity. European Food Research and
Technology. 2012, 235(4):637–645.
Zhang L.L., Moore J., Wu T., Wang Z. Antioxidant phenolic compounds from walnut kernels (Juglans
regia L.). Food Chemistry. 2009, 113(1):160–165.
Zhang Y., Yang L., Zu Y., Chen X., Wang F., Liu F. Oxidative stability of sunflower oil by carnosic acid
compared with synthetic antioxidants during accelerated storage. Food Chemistry. 2010, 118(3):656–
662.
http://www.cfs.purdue.edu/class/f&n630/pdfs/pectin.pdf
http://www.herbstreith-fox.de/fileadmin/tmpl/pdf/broschueren/Konfituere_englisch.pdf