Vulnerabilitate Cadrul Natural
8
Forum Geografic. Studii şi cercetări de g eografie şi prot ecţia mediul ui Year 8, No. 8/ 2009, pp. 131- 138 VULNERABILITY TO NATURAL HAZARDS IN ROMANIA Dan TANISLAV 1 , Andra COSTACHE 2 , George MURĂTOREANU 3 Abstract: The vulnerability assessment integrates the analysis of the conditions and the characteristics of a system that is exposed to a certain type of natural hazard. In the model that has been used in the present paper, the vulnerability was assessed at the administrative unit (county) level, as a result of the interaction between hazard and the exposed components of the system. The assessment of the exposure was done by measuring the total value of goods, resources and population that are exposed to natural hazards. There were selected 39 indicators, which were included into four major groups, depending on the main factors (physical, social, environmental and economic) that enhance the susceptibility of communities to natural hazards and on the elements that are exposed to these events. Each indicator was classified on a scale from 1 to 5 (1 – very low, 5 – very high). The sum of the indicators was reclassified according to the same model and, finally, the total exposure was obtained. The natural hazard was assessed according to the same principle, the earthquake, flood and landslide prone surfaces being taken into consideration. The total vulnerability was determined by overlapping the results. The analysis of the vulnerability enables the identification of the regions that need the allocation of financial resources in order to diminish the negative impact of natural hazards. Moreover, the vulnerability studies can be added to the natural hazards analyses, thus representing the fundament of the correct assessment of the risk that is associated to natural hazards. Key-words: natural hazards, exposure, vulnerability, assessment. Rezuma t: Vulnera bilita tea la haza rde natura le în România. Evaluarea vulnerabilităţii integrează analiza condiţiilor şi caracteristicilor existente într -un sistem expus la un anumit tip de hazard natural. În modelul folosit în acest articol, vulnerabilitatea a fost evaluată la nivel de unitate administrativă (judeţ), ca rezultat al interacţiunii dintre hazard şi componentele sistemului expuse. Evaluarea expunerii s-a realizat prin măsurarea valorii totale a bunurilor, resurselor şi populaţiei expuse hazardelor naturale. Au fost selectaţi 39 indicatori, incluşi în 4 grupe majore, în funcţie de factorii principali (fizici, sociali, de mediu şi economici) ce măresc susceptibilitatea comunităţilor la hazarde naturale şi de elementele expuse acestor evenimente. Fiecare indicator a fost clasificat pe o scară de la 1 la 5 (1-foarte scăzut, 5-foarte mare). Suma indicatorilor a fost la rândul său reclasificată după acelaşi model, până la determinarea, în final, a expunerii totale. Hazardul natural a fost evaluat după acelaşi principiu, luându-se în discuţie suprafaţa cu potenţial de producere a cutremurelor de pământ, inundaţiilor şi alunecărilor de teren. Prin suprapunerea rezultatelor a fost determinată vulnerabilitatea totală. Analiza vulnerabilităţii oferă posibilitatea identificării regiunilor care au nevoie de alocarea resurselor financiare în vederea diminuării impactului negativ al hazardelor naturale. De asemenea, studiile de vulnerabilitate se pot adăuga celor ce vizează analiza hazardelor naturale, putând astfel constitui baza în evaluarea corectă a riscului asociat hazardelor naturale. Cuvinte cheie: hazarde naturale, expunere, vulnerabilitate, evaluare. Introduction At the international level there is a large variety of definitions concerning the vulnerability and this is caused by the diverse conceptual and methodological approaches. There are multiple factors that can determine the vulnerability of a system (physical, social, cultural, economic and politic ones) and they interact in a complex manner, depending on the particular features and the location of that system. That is why most of the researchers think that it is essential to define vulnerability by taking into account the context (Downing et al ., 2003) and the aim of the research. The vulnerability is a concept with multiple dimensions (ecological, economic, social and institutional) and it represents the degree in which a system can be affected by the impact with a perturba tion or stress factor and its capacity of recover ing or adaptation to the consequence s of the impact (Kasperson et al ., 2002, Turner et al ., 2003). The vulnerability assessment integrates the analysis of the conditions and the characteristics of 1 “Valahia” University, Facu ltaty of Geography, Târgovişte, dtani slav@y ahoo.c om 2 E-mail: [email protected] 3 E-mail: [email protected] m 131
-
Upload
alamaru-marius-ionut -
Category
Documents
-
view
214 -
download
0
Transcript of Vulnerabilitate Cadrul Natural

8/15/2019 Vulnerabilitate Cadrul Natural
http://slidepdf.com/reader/full/vulnerabilitate-cadrul-natural 1/8
Forum Geografic. Studii şi cercetări de geografie şi protecţia mediului Year 8, No. 8/ 2009, pp. 131- 138
VULNERABILITY TO NATURAL HAZARDS IN ROMANIA
Dan TANISLAV1, Andra COSTACHE2, George MURĂTOREANU3
Abstract: The vulnerability assessment integrates theanalysis of the conditions and the characteristics of asystem that is exposed to a certain type of naturalhazard. In the model that has been used in the present paper, the vulnerability was assessed at theadministrative unit (county) level, as a result of theinteraction between hazard and the exposed componentsof the system. The assessment of the exposure was done by measuring the total value of goods, resources and population that are exposed to natural hazards. Therewere selected 39 indicators, which were included intofour major groups, depending on the main factors(physical, social, environmental and economic) thatenhance the susceptibility of communities to naturalhazards and on the elements that are exposed to theseevents. Each indicator was classified on a scale from 1to 5 (1 – very low, 5 – very high). The sum of theindicators was reclassified according to the same modeland, finally, the total exposure was obtained. Thenatural hazard was assessed according to the same principle, the earthquake, flood and landslide pronesurfaces being taken into consideration. The totalvulnerability was determined by overlapping the results.The analysis of the vulnerability enables theidentification of the regions that need the allocation offinancial resources in order to diminish the negativeimpact of natural hazards. Moreover, the vulnerabilitystudies can be added to the natural hazards analyses,
thus representing the fundament of the correctassessment of the risk that is associated to naturalhazards.Key-words: natural hazards, exposure, vulnerability,assessment.
Rezumat: Vulnerabilitatea la hazarde naturale înRomânia. Evaluarea vulnerabilităţii integrează analizacondiţiilor şi caracteristicilor existente într -un sistemexpus la un anumit tip de hazard natural. În modelulfolosit în acest articol, vulnerabilitatea a fost evaluată lanivel de unitate administrativă (judeţ), ca rezultat alinteracţiunii dintre hazard şi componentele sistemuluiexpuse. Evaluarea expunerii s-a realizat prin măsurareavalorii totale a bunurilor, resurselor şi populaţiei expusehazardelor naturale. Au fost selectaţi 39 indicatori,incluşi în 4 grupe majore, în funcţie de factorii principali (fizici, sociali, de mediu şi economici) cemăresc susceptibilitatea comunităţilor la hazardenaturale şi de elementele expuse acestor evenimente.Fiecare indicator a fost clasificat pe o scară de la 1 la 5(1-foarte scăzut, 5-foarte mare). Suma indicatorilor afost la rândul său reclasificată după acelaşi model, pânăla determinarea, în final, a expunerii totale. Hazardul
natural a fost evaluat după acelaşi principiu, luându-seîn discuţie suprafaţa cu potenţial de producere acutremurelor de pământ, inundaţiilor şi alunecărilor deteren. Prin suprapunerea rezultatelor a fost determinatăvulnerabilitatea totală. Analiza vulnerabilităţii oferă posibilitatea identificării regiunilor care au nevoie dealocarea resurselor financiare în vederea diminuăriiimpactului negativ al hazardelor naturale. De asemenea,studiile de vulnerabilitate se pot adăuga celor ce vizeazăanaliza hazardelor naturale, putând astfel constitui baza
în evaluarea corectă a riscului asociat hazardelornaturale.Cuvinte cheie: hazarde naturale, expunere,vulnerabilitate, evaluare.
Introduction
At the international level there is a large varietyof definitions concerning the vulnerability and thisis caused by the diverse conceptual andmethodological approaches. There are multiple
factors that can determine the vulnerability of asystem (physical, social, cultural, economic and politic ones) and they interact in a complexmanner, depending on the particular features andthe location of that system. That is why most of theresearchers think that it is essential to define
vulnerability by taking into account the context(Downing et al ., 2003) and the aim of the research.
The vulnerability is a concept with multipledimensions (ecological, economic, social andinstitutional) and it represents the degree in which
a system can be affected by the impact with a perturbation or stress factor and its capacity ofrecovering or adaptation to the consequences of the
impact (Kasperson et al ., 2002, Turner et al ., 2003).The vulnerability assessment integrates the
analysis of the conditions and the characteristics of
1“Valahia” University, Facultaty of Geography, Târgovişte, [email protected]
2 E-mail: [email protected]
3E-mail: [email protected]
131
8/15/2019 Vulnerabilitate Cadrul Natural
http://slidepdf.com/reader/full/vulnerabilitate-cadrul-natural 2/8
Vulnerability to natural hazards in Romania
a system that is exposed to a certain type ofnatural hazard. In other words, it identifies the
relation between hazard and the elementsexposed to it.
The vulnerability assessment process is
realized for a certain exposure unit (which may
be a region, an ecosystem, an economic sector or
a community - Kasperson et al ., 2002).
Vulnerability assessment in RomaniaThe research conducted at national level
concerned mainly the vulnerability of different
types of systems to extreme events. The conceptis initially mentioned in a series of synthesisworks or articles having a theoretical character
and referring to hazards and risks. Furthermore, itis to be noticed the assessment of the
vulnerability of the Romanian territory todifferent climatic risks, on the basis of theexposure to these phenomena (Bogdan and
Niculescu, 1999).
Subsequently, just like at the internationallevel, the concept of vulnerability integrated theoccurrence probability of extreme phenomena,
their impact, as well as the capacity of theaffected systems to rehabilitate/to adapt to the
new context (Benedek, 2002; Bălteanu, Costacheand Tanislav, 2003; Bălteanu and Şerban, 2005;Bălteanu and Costache, 2006).
From the methodological point of view, there
were realised assessments of the biophysicalvulnerability, especially in the framework of the
geomorphologic research (eg.: Armaş et al .,
2003; Armaş et al ., 2005). At the same time,
there are to be noticed approaches to the socialvulnerability: the distribution of marginal social
groups in Romania (Ianoş, Popescu and Tălângă,1996), the analysis of the social stress at nationallevel (Guran and Turnock, 2001), the social and
economic fragility index corresponding to theunderprivileged mining areas (Popescu et al .,2003), the identification of the underprivileged
and vulnerable social groups (Guran-Nica and
Roznovieţchi, 2002; Guran and Mocanu, 2005).Raţiu (2007) estimates the vulnerability of
rural settlements located in the Someş Plain, by
taking into account several indicators of thesocial-economic and natural potential, while
Goţiu and Surdeanu (2007) propose amethodology for the assessment of the populationvulnerability to extreme events, depending on the
proximity to the affected area and quantify the
resilience of the human settlements under studyon the basis of the average incomes of the
inhabitants.It is necessary to evaluate the vulnerability to
different stress factors through the correlation of
certain indicators that are relevant for themultiple dimensions of vulnerability
(Sorocovschi, 2007), respectively the ecological,the social-economic and the institutionaldimensions. However, a complex vulnerability
index, which would integrate the exposure and
hazard indicators, as well as those for the
adapting capacity, has not been developed yet.
In Romania there is the Law No. 575/2001,concerning the approval of the National TerritoryArrangement Plan – Section V, Natural Risk
Areas, together with the Romanian Governmental
Decision No. 477/2003, for the approval ofmethodological standards regarding theelaboration manner and the content of the natural
risk maps. However, the studies and papers thatdeal with these natural extreme phenomena at
national or county level concern solely the hazardanalysis (through the discrimination of the areasdepending on the distribution of the phenomena
or of their occurrence probability), the aspects
that concern the vulnerability assessment not being taken into account.
MethodologyStarting from the field literature (Odeh, 2002;
Borden et al ., 2007; Simpson and Human, 2008),
we chose to use a system vulnerability
quantification model that considers the result ofthe interaction between a potentially harmful
event (the hazard) and the systemic componentsthat are exposed to this event, according to the
formula:
Vulnerability = Exposure * Hazard
In a similar way, this model is also used in the
Natural Hazards Mitigation Plans in certainAmerican states, being approved by FEMA
(Federal Emergency Management Agency).The first stage in the assessment of the
vulnerability concerned the estimation of the
exposed components, while the second
concentrated upon certain hazard types, i.e.upon their spatial extension. By superposing
the results, we determined the total
vulnerability.The assessment of the exposure was realised
by measuring the total value of goods, resources
and population exposed to natural hazards. Therewere selected 39 indicators, included into four
major groups (comprising nine sub-groups),
depending on the main factors that increase thesusceptibility of communities to natural hazards
and on the elements that are exposed to theseevents. The formula used for the quantification of
the exposure is the following:
132
8/15/2019 Vulnerabilitate Cadrul Natural
http://slidepdf.com/reader/full/vulnerabilitate-cadrul-natural 3/8
Forum Geografic. Studii şi cercetări de geografie şi protecţia mediului Year 8, No. 8/ 2009, pp. 131- 138
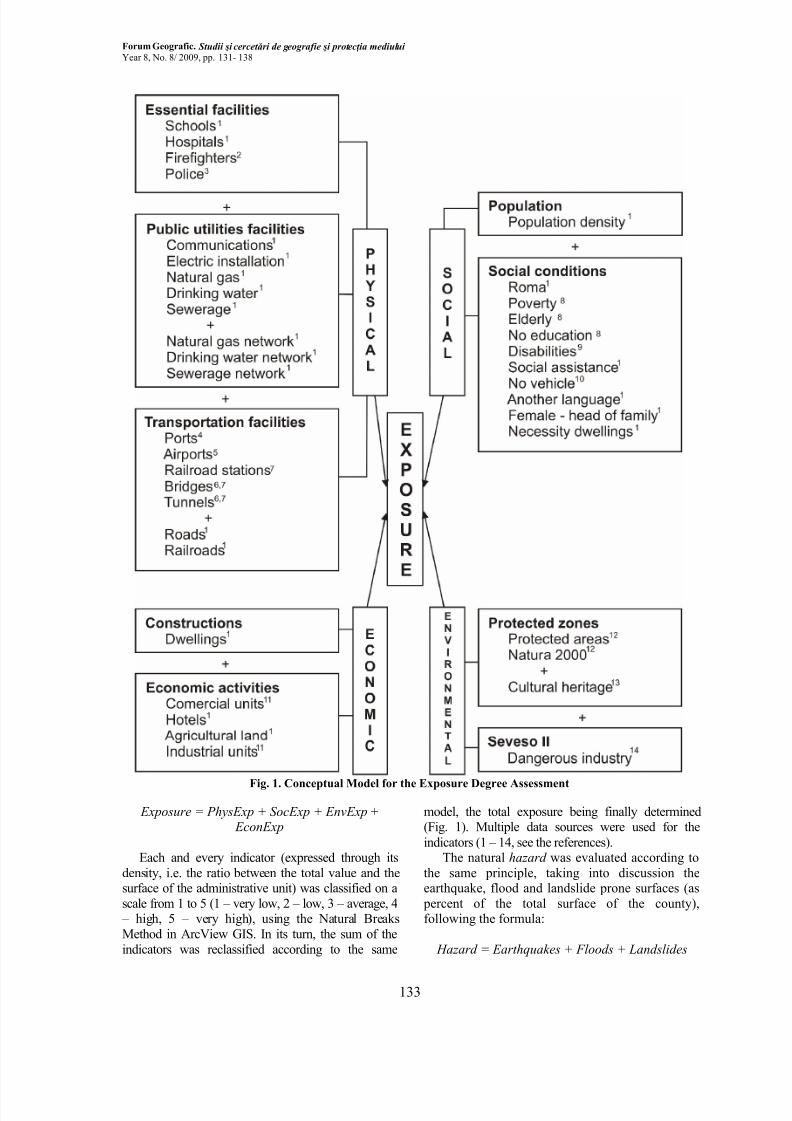
Fig. 1. Conceptual Model for the Exposure Degree Assessment
Exposure = PhysExp + SocExp + EnvExp + EconExp
Each and every indicator (expressed through its
density, i.e. the ratio between the total value and thesurface of the administrative unit) was classified on a
scale from 1 to 5 (1 – very low, 2 – low, 3 – average, 4 – high, 5 – very high), using the Natural Breaks
Method in ArcView GIS. In its turn, the sum of the
indicators was reclassified according to the same
model, the total exposure being finally determined(Fig. 1). Multiple data sources were used for the
indicators (1 – 14, see the references).The natural hazard was evaluated according to
the same principle, taking into discussion theearthquake, flood and landslide prone surfaces (as
percent of the total surface of the county),following the formula:
Hazard = Earthquakes + Floods + Landslides
133

8/15/2019 Vulnerabilitate Cadrul Natural
http://slidepdf.com/reader/full/vulnerabilitate-cadrul-natural 4/8
Vulnerability to natural hazards in Romania
Description of the variables
(A). Physical exposure (PhysExp)The analysis concentrated on the critical
facilities, as they play a major role in the response
and reconstruction activities.
(a). Essential facilities
1. schools (nurseries, elementary schools, high
schools and universities);2. hospitals (also including TB sanatoriums and
health resorts);
3. firefighters (detachments, sections,
intervention guards);4. police (municipality and city police; rural
police).
(b). Public utilities facilities5. communications (subscribers to the fixed
phone network and Internet special access);6. electric installations (settlements with
households endowed with electric installations);
7. natural gas (settlements where natural gas is
being distributed);8. drinking water (settlements with supply
installations for drinking water);
9. sewerage (settlements with public sewerageinstallations);
10. the natural gas network (the total simple
length of the natural gas distribution pipes);
11. the drinking water network (the total simplelength of the drinking water distribution network);
12. the sewerage network (the total simplelength of the sewerage pipes).
(c). Transportation facilities
13. ports (zone master’s office, harbour
master’s office, other offices);14. airports (international and national);15. railroad stations;
16. bridges (on roads and railroads);17. tunnels (on roads and railroads);
18. roads (the length of the public national,county and communal roads);
19. railroads (the length of the railroad lines in
use).
The most exposed administrative units (Fig. 2)are Bucharest city and Ilfov County (the high
population concentration required the existence of
numerous essential facilities, of an importantdensity of utilities network and of transportation
facilities – airport, railroad stations), but also
Prahova County (with many schools, densedrinking water and sewerage networks, railroads
stations and high density of public roads).
The least exposed counties are Tulcea andHarghita (due to the natural conditions that led to a
low concentration of population and reduced
facilities), Brăila, Ialomiţa, Vaslui, Caraş Severin, Neamţ, Covasna, Teleorman, Giurgiu, andCălăraşi.
Fig. 2. The physical Exposure (Critical Facilities)
(B). Social exposure (SocExp)There are taken into account the demographical
features that highlight the areas with low human potential, while the financial resources are too
limited as to ensure the passing over exceptionalsituations; there is to be noticed a strongdependency on the public institutions and
resources.The indicators that concern the social
conditions (21 - 30) are expressed as percentage,
being referenced to the county population (part ofthe total population). In order to preserve a
similarity with the other indicators under analysis,the result is subsequently correlated with the
population density at county level.(a). Population20. population density
(b). Social conditions21. Roma (stable gypsy population – the Roma);22. poverty (the poverty rate, respectively the
part of the population that lives under the poverty4
threshold in the total population);23. elderly (the population being 65 years and over);
24. no education (the population being 15 years
and over, which did not finish any school orgraduated only the primary school);
25. disabilities (persons with handicaps,
children or adults, in families or institutionalised);26. social assistance (retired persons who
benefit from the state social insurance,
4In accordance with CASPIS, the poverty threshold is
defined depending on the household consumption,
including an alimentary and a non-alimentary
component. The alimentary component is calculated as
value of an alimentary basket with a content of 2,550
calories, taking into account the structure of the
alimentary consumption characteristic of the population
within the second and the third deciles. The non-
alimentary component is evaluated as that non-
alimentary consumption level affordable for the
households with an alimentary consumption equal with
the alimentary threshold.
134

8/15/2019 Vulnerabilitate Cadrul Natural
http://slidepdf.com/reader/full/vulnerabilitate-cadrul-natural 5/8
Forum Geografic. Studii şi cercetări de geografie şi protecţia mediului Year 8, No. 8/ 2009, pp. 131- 138
unemployed persons who benefit from redundancy
payments, the beneficiaries of the soup kitchens);27. no vehicle (persons that do not own a motor
vehicle);
28. another language (the permanent populationwith a mother tongue different than Romanian);
29. female – head of family (the female
population whose legal status is divorced orwidow);
30. necessity dwellings (persons that live in
necessity units: spaces with other destinations,temporary constructions or mobile units).
The most exposed counties (Fig. 3) are Giurgiu
and Dâmboviţa (as a consequence of the predominance of the aged population and of the
population without education), Bihor, Călăraşi,Teleorman, Mehedinţi (especially because of thehigh poverty rate, of the numerous households withfemale breadwinners, of the persons without
education, without vehicle and of the important
number of gipsy persons), Buzău, Prahova andBucharest city (especially because of the high population density).
Fig. 3. Social exposure
Among the counties characterised by the lowest
exposure, partially due to the reduced populationdensity, there are to be noticed: Gorj, Harghita and
Tulcea (also displaying low values of the indicators
concerning the gypsy population, the population withdisabilities or that receiving social assistance).
(C). Environmental exposure (EnvExp)It concerns those environmental elements that
can worsen the natural hazard impact or that can be
severely affected by it. On the one hand, there arethe areas having ecological significance (rare
species, unique landscapes, built-up areas with
exceptional value), and on the other hand, there arelocations related to the appearance of secondary
effects (units where dangerous economic activitiesare conducted).
(a). Protected zones
31. Protected areas (biosphere reserves, Ramsar
sites, national or nature parks, nature monumentsor reserves);
32. Natura 2000 (Sites of Community Interest
and Special Protection Areas);33. cultural heritage (the built-up patrimony
with cultural value of exceptional national interest
– historical monuments, architectural complexes,archaeological sites).
(b). Seveso II
34. dangerous industry (industrial units thatconduct activities involving dangerous substances
– according to the Seveso II Directive).
The most exposed units under analysis (Fig. 4)are: Bucharest city (the most numerous heritage
monuments of exceptional national value and
Seveso II industrial units), Hunedoara, Constanţa,Alba and Cluj (as a consequence of the highdensity of protected areas, especially the nature
areas). The least exposed counties are: Sălaj,
Vaslui, Galaţi and Ialomiţa (due to the smallsurfaces occupied by protected areas and to thescarcely represented industrial activities).
Fig. 4. Environmental Exposure
(D). Economic Exposure (EconExp)
It concerns the identification of the inhabitedcentres and of the major economic activities, on
which the impact of the hazards can have severeeffects; it becomes obvious in the material loss, the
decrease of the incomes or the unemployment.(a). Constructions
35. dwellings (the housing fond in public or private property).(b). Economic activities
36. commercial units (local wholesale or retail
trade units, with more than 50 employees);37. hotels (and motels),
38. agricultural land (arable surfaces, pastures,
hay-fields, vineyards and orchards);39. industrial units (local units in the extractive
or manufacturing industry, with more than 250
employees).
135
8/15/2019 Vulnerabilitate Cadrul Natural
http://slidepdf.com/reader/full/vulnerabilitate-cadrul-natural 6/8
Vulnerability to natural hazards in Romania
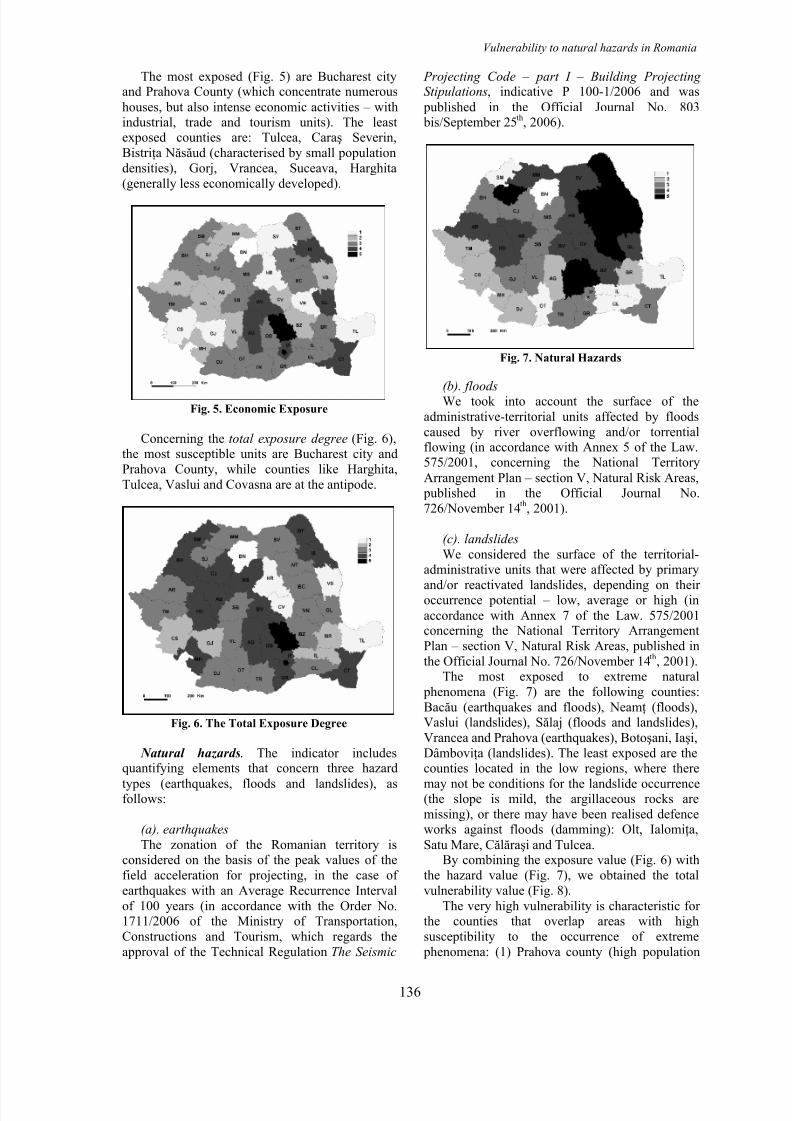
The most exposed (Fig. 5) are Bucharest cityand Prahova County (which concentrate numerous
houses, but also intense economic activities – withindustrial, trade and tourism units). The leastexposed counties are: Tulcea, Caraş Severin,Bistriţa Năsăud (characterised by small populationdensities), Gorj, Vrancea, Suceava, Harghita
(generally less economically developed).
Fig. 5. Economic Exposure
Concerning the total exposure degree (Fig. 6),the most susceptible units are Bucharest city and
Prahova County, while counties like Harghita,
Tulcea, Vaslui and Covasna are at the antipode.
Fig. 6. The Total Exposure Degree
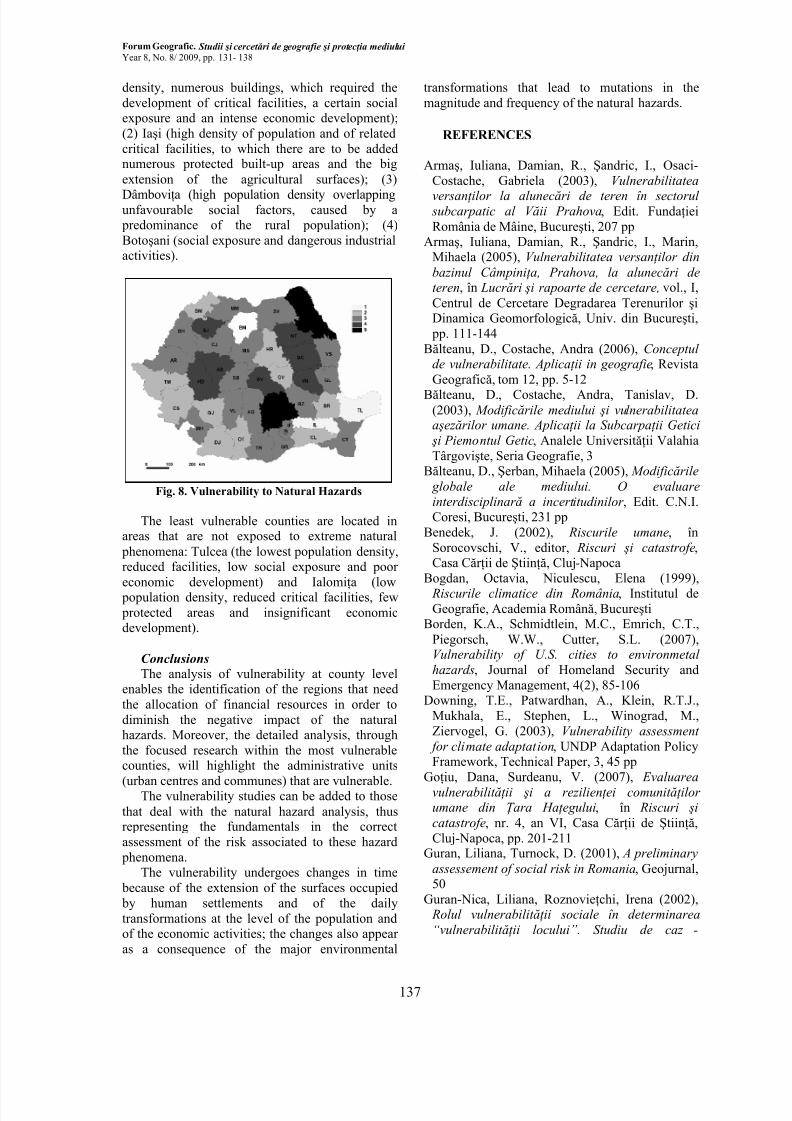
Natural hazards. The indicator includesquantifying elements that concern three hazard
types (earthquakes, floods and landslides), asfollows:
(a). earthquakes
The zonation of the Romanian territory isconsidered on the basis of the peak values of the
field acceleration for projecting, in the case of
earthquakes with an Average Recurrence Interval
of 100 years (in accordance with the Order No.1711/2006 of the Ministry of Transportation,
Constructions and Tourism, which regards the
approval of the Technical Regulation The Seismic
Projecting Code – part I – Building ProjectingStipulations, indicative P 100-1/2006 and was
published in the Official Journal No. 803 bis/September 25th, 2006).
Fig. 7. Natural Hazards
(b). floodsWe took into account the surface of the
administrative-territorial units affected by floods
caused by river overflowing and/or torrentialflowing (in accordance with Annex 5 of the Law.575/2001, concerning the National Territory
Arrangement Plan – section V, Natural Risk Areas, published in the Official Journal No.
726/November 14th, 2001).
(c). landslides
We considered the surface of the territorial-administrative units that were affected by primary
and/or reactivated landslides, depending on theiroccurrence potential – low, average or high (in
accordance with Annex 7 of the Law. 575/2001concerning the National Territory Arrangement
Plan – section V, Natural Risk Areas, published in
the Official Journal No. 726/November 14th, 2001).The most exposed to extreme natural
phenomena (Fig. 7) are the following counties:
Bacău (earthquakes and floods), Neamţ (floods),Vaslui (landslides), Sălaj (floods and landslides),Vrancea and Prahova (earthquakes), Botoşani, Iaşi,Dâmboviţa (landslides). The least exposed are thecounties located in the low regions, where there
may not be conditions for the landslide occurrence(the slope is mild, the argillaceous rocks are
missing), or there may have been realised defence
works against floods (damming): Olt, Ialomiţa,
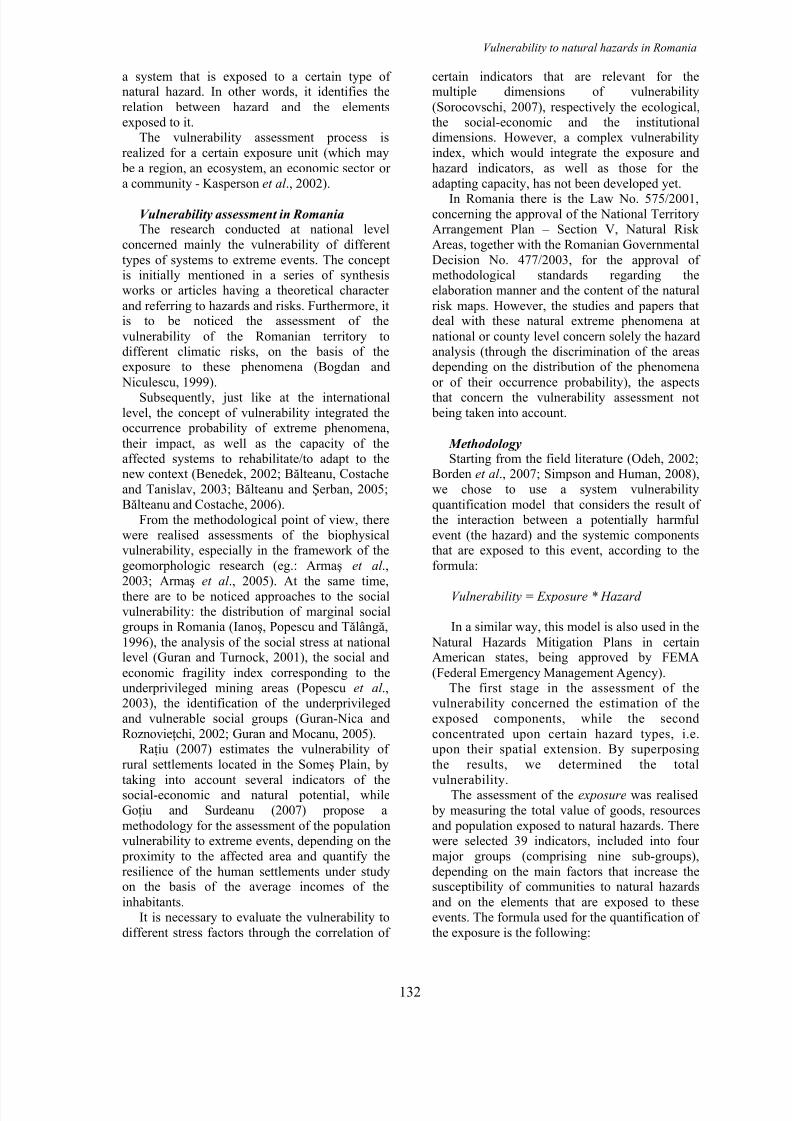
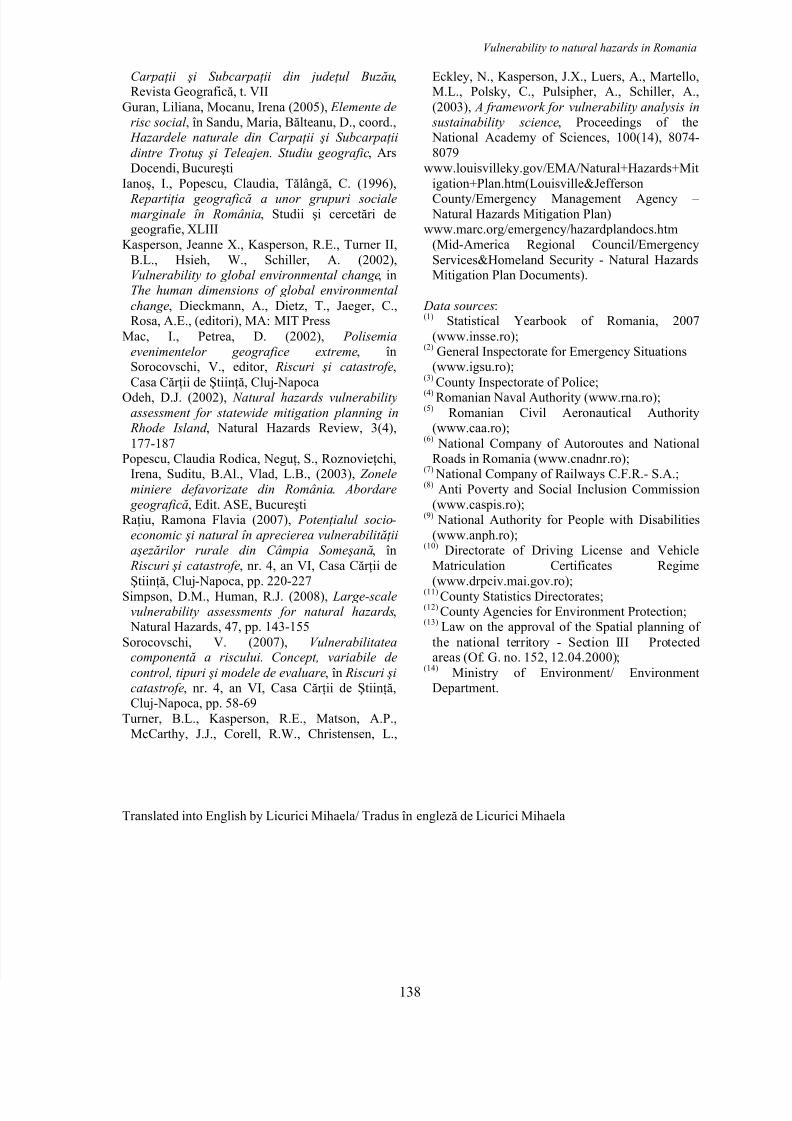
Satu Mare, Călăraşi and Tulcea.By combining the exposure value (Fig. 6) with
the hazard value (Fig. 7), we obtained the total
vulnerability value (Fig. 8).
The very high vulnerability is characteristic forthe counties that overlap areas with high
susceptibility to the occurrence of extreme
phenomena: (1) Prahova county (high population
136
8/15/2019 Vulnerabilitate Cadrul Natural
http://slidepdf.com/reader/full/vulnerabilitate-cadrul-natural 7/8
Forum Geografic. Studii şi cercetări de geografie şi protecţia mediului Year 8, No. 8/ 2009, pp. 131- 138
density, numerous buildings, which required the
development of critical facilities, a certain socialexposure and an intense economic development);
(2) Iaşi (high density of population and of relatedcritical facilities, to which there are to be addednumerous protected built-up areas and the big
extension of the agricultural surfaces); (3)
Dâmboviţa (high population density overlappingunfavourable social factors, caused by a predominance of the rural population); (4)
Botoşani (social exposure and dangerous industrialactivities).
Fig. 8. Vulnerability to Natural Hazards
The least vulnerable counties are located inareas that are not exposed to extreme natural
phenomena: Tulcea (the lowest population density,reduced facilities, low social exposure and poor
economic development) and Ialomiţa (low population density, reduced critical facilities, few
protected areas and insignificant economicdevelopment).
Conclusions
The analysis of vulnerability at county levelenables the identification of the regions that need
the allocation of financial resources in order to
diminish the negative impact of the naturalhazards. Moreover, the detailed analysis, through
the focused research within the most vulnerablecounties, will highlight the administrative units
(urban centres and communes) that are vulnerable.The vulnerability studies can be added to those
that deal with the natural hazard analysis, thusrepresenting the fundamentals in the correct
assessment of the risk associated to these hazard
phenomena.The vulnerability undergoes changes in time
because of the extension of the surfaces occupied
by human settlements and of the daily
transformations at the level of the population andof the economic activities; the changes also appear
as a consequence of the major environmental
transformations that lead to mutations in the
magnitude and frequency of the natural hazards.
REFERENCES
Armaş, Iuliana, Damian, R., Şandric, I., Osaci-
Costache, Gabriela (2003), Vulnerabilitatea
versanţilor la alunecări de teren în sectorul subcarpatic al Văii Prahova, Edit. FundaţieiRomânia de Mâine, Bucureşti, 207 pp
Armaş, Iuliana, Damian, R., Şandric, I., Marin,Mihaela (2005), Vulnerabilitatea versanţilor din
bazinul Câmpiniţa, Prahova, la alunecări deteren, în Lucrări şi rapoarte de cercetare, vol., I,
Centrul de Cercetare Degradarea Terenurilor şiDinamica Geomorfologică, Univ. din Bucureşti, pp. 111-144
Bălteanu, D., Costache, Andra (2006), Conceptulde vulnerabilitate. Aplicaţii in geografie, Revista
Geografică, tom 12, pp. 5-12
Bălteanu, D., Costache, Andra, Tanislav, D.(2003), Modificările mediului şi vulnerabilitateaaşezărilor umane. Aplicaţii la Subcarpaţii Getici
şi Piemontul Getic, Analele Universităţii ValahiaTârgovişte, Seria Geografie, 3
Bălteanu, D., Şerban, Mihaela (2005), Modificările
globale ale mediului. O evaluare
interdisciplinară a incert itudinilor , Edit. C.N.I.
Coresi, Bucureşti, 231 ppBenedek, J. (2002), Riscurile umane, în
Sorocovschi, V., editor, Riscuri şi catastrofe,
Casa Cărţii de Ştiinţă, Cluj-Napoca
Bogdan, Octavia, Niculescu, Elena (1999),
Riscurile climatice din România, Institutul deGeografie, Academia Română, Bucureşti
Borden, K.A., Schmidtlein, M.C., Emrich, C.T.,
Piegorsch, W.W., Cutter, S.L. (2007),Vulnerability of U.S. cities to environmetal
hazards, Journal of Homeland Security and
Emergency Management, 4(2), 85-106Downing, T.E., Patwardhan, A., Klein, R.T.J.,
Mukhala, E., Stephen, L., Winograd, M.,
Ziervogel, G. (2003), Vulnerability assessment
for climate adaptation, UNDP Adaptation PolicyFramework, Technical Paper, 3, 45 pp
Goţiu, Dana, Surdeanu, V. (2007), Evaluarea
vulnerabilităţii şi a rezilienţei comunităţilorumane din Ţara Haţegului, în Riscuri şi
catastrofe, nr. 4, an VI, Casa Cărţii de Ştiinţă,Cluj-Napoca, pp. 201-211
Guran, Liliana, Turnock, D. (2001), A preliminary
assessement of social risk in Romania, Geojurnal,50
Guran-Nica, Liliana, Roznovieţchi, Irena (2002), Rolul vulnerabilităţii sociale în determinarea
“vulnerabilităţii locului”. Studiu de caz -
137
8/15/2019 Vulnerabilitate Cadrul Natural
http://slidepdf.com/reader/full/vulnerabilitate-cadrul-natural 8/8
Vulnerability to natural hazards in Romania
Carpaţii şi Subcarpaţii din judeţul Buzău,Revista Geogr afică, t. VII
Guran, Liliana, Mocanu, Irena (2005), Elemente derisc social , în Sandu, Maria, Bălteanu, D., coord., Hazardele naturale din Carpaţii şi Subcarpaţii
dintre Trotuş şi Teleajen. Studiu geografic, Ars
Docendi, BucureştiIanoş, I., Popescu, Claudia, Tălângă, C. (1996),
Repartiţia geografică a unor grupuri socialemarginale în România, Studii şi cercetări degeografie, XLIII
Kasperson, Jeanne X., Kasperson, R.E., Turner II,
B.L., Hsieh, W., Schiller, A. (2002),Vulnerability to global environmental change, inThe human dimensions of global environmental
change, Dieckmann, A., Dietz, T., Jaeger, C.,Rosa, A.E., (editori), MA: MIT Press
Mac, I., Petrea, D. (2002), Polisemia
evenimentelor geografice extreme, înSorocovschi, V., editor, Riscuri şi catastrofe,
Casa Cărţii de Ştiinţă, Cluj-Napoca
Odeh, D.J. (2002), Natural hazards vulnerabilityassessment for statewide mitigation planning in Rhode Island , Natural Hazards Review, 3(4),
177-187Popescu, Claudia Rodica, Neguţ, S., Roznovieţchi,
Irena, Suditu, B.Al., Vlad, L.B., (2003), Zonele
miniere defavorizate din România. Abordare
geografică, Edit. ASE, BucureştiRaţiu, Ramona Flavia (2007), Potenţialul socio-
economic şi natural în aprecierea vulnerabilităţiiaşezărilor rurale din Câmpia Someşană, în
Riscuri şi catastrofe, nr. 4, an VI, Casa Cărţii deŞtiinţă, Cluj-Napoca, pp. 220-227
Simpson, D.M., Human, R.J. (2008), Large-scalevulnerability assessments for natural hazards, Natural Hazards, 47, pp. 143-155
Sorocovschi, V. (2007), Vulnerabilitateacomponentă a riscului. Concept, variabile de
control, tipuri şi modele de evaluare, în Riscuri şicatastrofe, nr. 4, an VI, Casa Cărţii de Ştiinţă,Cluj-Napoca, pp. 58-69
Turner, B.L., Kasperson, R.E., Matson, A.P.,
McCarthy, J.J., Corell, R.W., Christensen, L.,
Eckley, N., Kasperson, J.X., Luers, A., Martello,M.L., Polsky, C., Pulsipher, A., Schiller, A.,
(2003), A framework for vulnerability analysis in sustainability science, Proceedings of the National Academy of Sciences, 100(14), 8074-
8079
www.louisvilleky.gov/EMA/Natural+Hazards+Mit
igation+Plan.htm(Louisville&Jefferson
County/Emergency Management Agency – Natural Hazards Mitigation Plan)
www.marc.org/emergency/hazardplandocs.htm
(Mid-America Regional Council/Emergency
Services&Homeland Security - Natural HazardsMitigation Plan Documents).
Data sources:(1) Statistical Yearbook of Romania, 2007
(www.insse.ro);(2) General Inspectorate for Emergency Situations
(www.igsu.ro);(3) County Inspectorate of Police;(4) Romanian Naval Authority (www.rna.ro);(5) Romanian Civil Aeronautical Authority
(www.caa.ro);(6)
National Company of Autoroutes and NationalRoads in Romania (www.cnadnr.ro);
(7) National Company of Railways C.F.R.- S.A.;(8) Anti Poverty and Social Inclusion Commission
(www.caspis.ro);(9) National Authority for People with Disabilities
(www.anph.ro);(10) Directorate of Driving License and Vehicle
Matriculation Certificates Regime
(www.drpciv.mai.gov.ro);(11) County Statistics Directorates;(12) County Agencies for Environment Protection;(13)
Law on the approval of the Spatial planning of
the national territory - Section III – Protectedareas (Of. G. no. 152, 12.04.2000);
(14)Ministry of Environment/ Environment
Department.
Translated into English by Licurici Mihaela/ Tradus în engleză de Licurici Mihaela
138