REVISTA ROMÂNĂ DE STATISTICĂ SUPLIMENT SUMAR / … · 2015-06-30 · Revista Română de...
100
Revista Română de Statistică - Supliment nr. 5 / 2015 SUMAR / CONTENTS 5/2015 REVISTA ROMÂNĂ DE STATISTICĂ SUPLIMENT SCENARII DE REGIONALIZARE: ANALIZĂ ASUPRA INDUSTRIEI DIN ROMÂNIA FOLOSIND STATISTICA INFORMAŢIONALĂ ONICESCU 3 SCENARIOS FOR REGIONALIZATION: ANALYSIS ON ROMANIA’S INDUSTRY USING ONICESCU INFORMATIONAL STATISTICS 11 Drd. Ioana-Ruxandra Lie Academia de Studii Economice din Bucureşti ANALIZA INTENŢIEI DE ÎNTOARCERE A ROMÂNILOR DIN SPANIA 19 AN INVESTIGATION OF ROMANIANS’ RETURN INTENTIONS FROM SPAIN 31 Elena-Maria Prada Academia de Studii Economice din Bucureşti STUDIU COMPARATIV DE CONVERGENŢĂ REGIONALĂ NUTS3 PE ŢĂRI DIN UE 43 CONVERGENCE REGIONAL STUDY COMPARING EU MEMBER STATES 55 Drd. Natalia Dumitrescu (Moroianu) Academia de Studii Economice, Bucureşti PRINCIPALELE VARIABILE ÎN EVALUAREA IMPACTULUI GAZELOR DE ŞIST ASUPRA PREŢURILOR ENERGIEI 66 KEY DETERMINANTS OF SHALE GAS IMPACT ON ENERGY PRICES 84 Drd. Valentina Ivan Academia de Studii Economice www.revistadestatistica.ro/supliment
Transcript of REVISTA ROMÂNĂ DE STATISTICĂ SUPLIMENT SUMAR / … · 2015-06-30 · Revista Română de...

Revista Română de Statistică - Supliment nr. 5 / 2015
SUMAR / CONTENTS 5/2015REVISTA ROMÂNĂ DE STATISTICĂ SUPLIMENT
SCENARII DE REGIONALIZARE: ANALIZĂ ASUPRA INDUSTRIEI DIN ROMÂNIA FOLOSIND STATISTICA INFORMAŢIONALĂ ONICESCU 3
SCENARIOS FOR REGIONALIZATION: ANALYSIS ON ROMANIA’S INDUSTRY USING ONICESCU INFORMATIONAL STATISTICS 11
Drd. Ioana-Ruxandra Lie Academia de Studii Economice din Bucureşti
ANALIZA INTENŢIEI DE ÎNTOARCERE A ROMÂNILOR DIN SPANIA 19 AN INVESTIGATION OF ROMANIANS’ RETURN INTENTIONS FROM SPAIN 31 Elena-Maria Prada Academia de Studii Economice din Bucureşti
STUDIU COMPARATIV DE CONVERGENŢĂ REGIONALĂ NUTS3 PE ŢĂRI DIN UE 43
CONVERGENCE REGIONAL STUDY COMPARING EU MEMBER STATES 55 Drd. Natalia Dumitrescu (Moroianu) Academia de Studii Economice, Bucureşti
PRINCIPALELE VARIABILE ÎN EVALUAREA IMPACTULUI GAZELOR DE ŞIST ASUPRA PREŢURILOR ENERGIEI 66
KEY DETERMINANTS OF SHALE GAS IMPACT ON ENERGY PRICES 84 Drd. Valentina Ivan Academia de Studii Economice
www.revistadestatistica.ro/supliment
Romanian Statistical Review - Supplement nr. 5 / 20152
Revista Română de Statistică, editată de Institutul Naţional de Statistică, este unica publicaţie de specialitate din ţara noastră, în domeniul teoriei şi practicii statistice. Articolele publicate se adresează oamenilor de ştiinţă, cercetătorilor, precum şi utilizatorilor de date şi informaţii statistice interesaţi în lărgirea şi aprofundarea orizontului cunoaşterii prin asimilarea noţiunilor de specialitate, abordarea de noi lucrări şi studii de referinţă pe care să le aplice ulterior în domeniul în care îşi desfăşoară activitatea. Prin prezentarea unor lucrări ştiinţifi ce şi de promovare a culturii statistice, necesară în economia de piaţă funcţională, revista se doreşte a fi un spaţiu propice schimbului de idei şi, totodată, o provocare. Orice studiu sau opinie care poate contribui la dezvoltarea gradului de înţelegere a statisticii ca ştiinţă este binevenit.
The Romanian Statistical Review, issued by the National Institute of Statistics, is in our country specialising in the fi eld of statistical theory and practice. The articles published are addressed to the scientists, researchers and statistical data and information users interested in broadening and deepening their horizon of knowledge by acquiring specialised notions and coming into contact with new papers and reference studies they can later apply in their own fi eld. Through the presentation of papers that are scientifi c in nature and that promote statistical culture, which is necessary in a functional market economy, the Review aims to be a favourable space for exchange of ideas and a challenge at the same time. Any study or opinion that can contribute to the development of the degree understanding statistics as a science is welcome.
La Revue Roumaine de Statistique, éditée par l’Institut National de la Statistique, est la seule publication de spécialité de notre pays dans le domaine de la théorie et de la pratique statistique. Les articles y étant publiés s’adressent aux scientifi ques, aux chercheurs, ainsi qu’aux utilisateurs de données et d’informations statistiques, intéressés d’élargir leur horizon de connaissances avec des notions de spécialité et de nouveaux travaux et études de référence qu’ils peuvent appliquer ultérieurement dans leurs domaines d’activité. Par la présentation de certains ouvrages scientifi ques et de promotion de la culture statistique nécessaires dans l’économie de marché fonctionnelle, la Revue se veut être un espace propice à l’échange d’idées et en même temps une provocation. Toute étude et opinion qui pourraient contribuer au développement du degré de compréhension de la statistique en tant que science sont bienvenues.
Revista Română de Statistică - Supliment nr. 5 / 2015 3
Scenarii de regionalizare: analiză asupra industriei din România folosind statistica
informaţională Onicescu Drd. Ioana-Ruxandra Lie
Academia de Studii Economice din Bucureşti, [email protected]
Abstract
Am arătat că este necesar să luăm în considerare mai multe criterii pentru a lua o decizie cu privire la formula optimă de regionalizare a României. Obiectivul acestei lucrări este de a studia unul din aceste criterii, respectiv sectorul industrial. Cu ajutorul instrumentelor oferite de statistica informaţională Onicescu analizăm omogenitatea regiunilor României în ceea ce priveşte două variabile, indicele producţiei industriale şi indicele valoric al cifrei de afaceri din industrie. Am descoperit că din acest punct de vedere regiunile nu sunt omogene, ceea ce duce la concluzia că industria este un aspect care poate fi luat în considerare atunci când se decide cu privire la regionalizare. Clasifi care JEL: C49, L60, L70, R13 Cuvinte-cheie: regionalizare, industrie, statistică informaţională, energie informaţională
Introducere
Regionalizarea a fost în ultimii ani un important subiect de discuţie în România, datorită faptului că Uniunea Europeană se concentrează pe regiuni ca bază a cooperării la nivelul continentului. Cum regiunile noastre de dezvoltare nu au personalitate juridică, este necesar să o obţină, dar, înainte de acesta, este nevoie să fi e găsită formula optimă de regionalizare, capabilă să stimuleze dezvoltarea. Această lucrare este a doua parte a unui studiu mai extins, realizat cu scopul de a găsi structura optimă pentru fi ecare regiune din cele menţionate anterior. Aici ne concentrăm pe studierea industriei României, a omogenităţii regiunilor din acest punct de vedere şi a relaţiei dintre variabile din domeniul industriei. Realizând o analiză cu ajutorul instrumentelor oferite de statistica informaţională Onicescu am ajuns la concluzia că există o legătură între indicele producţiei industriale şi indicele valoric al cifrei de afaceri din industrie. În plus, am afl at că regiunile nu sunt omogene în ceea ce priveşte

Romanian Statistical Review - Supplement nr. 5 / 20154
industria, ceea ce înseamnă că variabilele din acest domeniu pot fi utilizate pentru a decide asupra formulei optime de regionalizare. Prima parte a lucrării prezintă principalele caracteristici ale industriei României, concentrându-se pe evoluţia acestui sector după sfârşitul perioadei comuniste şi, de asemenea, pe consecinţele recentei crize economice. A doua parte a lucrării se referă la datele şi metodele folosite pentru a realiza analiza, şi este urmată de prezentarea rezultatelor obţinute. Lucrarea se încheie cu câteva concluzii şi direcţiile pentru cercetarea ulterioară.
Evoluţia şi caracteristicile sectorului industrial din România
Unul din principalele obiective ale regionalizării este de a crea structuri care ar creşte şi stimula dezvoltarea în România, iar industria are un rol important în dezvoltare. De exemplu, Danciu (2012: 40-44) observă că una dintre cauzele subdezvoltării este predominanţa activităţilor rurale. În plus, conform altor autori, în prezent „industria trebuie să joace rolul cel mai important în noul model de dezvoltare a Uniunii Europene, pentru soliditatea şi viabilitatea economiei UE” (Chivu, L., Ciutacu, C., 2014: 157-166). Industria românească s-a dezvoltat în special în perioada comunistă, dar câteva sectoare industriale au apărut încă de dinainte, de exemplu sectorul extractiv şi cel energetic. Aşa cum subliniază Bulearcă et. all (2014: 106-112), România s-a afl at printre pionierii Europei şi ai lumii în ceea ce priveşte extracţia şi utilizarea gazelor naturale; tot ei observă şi faptul că avem o lungă istorie în alte domenii ale sectorului energetic, precum exploatarea cărbunelui, a petrolului, şi generarea de energie electrică în termocentrale şi în hidrocentrale. Dezvoltarea acestor sectoare a continuat şi în anii 1950 România era „pe unul dintre primele cinci locuri din lume în ceea ce priveşte producţia şi consumul de energie primară” (Bulearcă et. all, 2014: 106-112). După mulţi ani de producţie şi consum de enrgie în creştere, datorate industrializării intensive din perioada comunistă (Bulearcă et. all, 2014: 106-112), din 1990 am fost martorii unei schimbări în structura acestui sector: ca o consecinţă a scăderii consumului, acum se produce mai puţină energie electrică, iar contribuţia energiei electrice din termocentrale la producţia totală a scăzut, în timp ce parcurile de eoliene s-au extins” (Bădileanu et. all, 2014: 53-59). Trebuie menţionat şi fapul că, dintre toate sectoarele industriale din România, „cea mai mare creştere în termeni reali a valorii adăugate brute în 2010 faţă de 1990 a fost înregistrată în producţia şi vânzarea de energie electrică, termică, de gaze şi de apă caldă” (Chivu, L., Ciutacu, C., 2014: 157-166).
Revista Română de Statistică - Supliment nr. 5 / 2015 5
Cum acest studiu se concentrează asupra regiunilor României, este de asemenea important de menţionat faptul că acest sector nu este dezvoltat în mod egal în ţară: în 2013 „regiunile Sud-vest şi Sud-Est administrau aproape 60% din capacităţile din sistemul energetic”, iar aceste disparităţi tind să se accentueze, având în vedere că se prognozează continuarea dezvoltării parcurilor de eoliene, în timp ce producţia bazată pe combustibili fosili va scădea (Bădileanu et. all, 2014: 53-59). Un alt sector industrial important în România este industria automobilelor, nu doar pentru că „a devenit un motor al redresării economice în ultimii ani” (Dachin, A., Burcea, F. C., 2014: 207 -216), dar şi pentru că alte ramuri industriale sunt strâns legate de aceasta: industria metalurgică şi cea chimică, sectorul energetic, industria textilă, industria electrică şi a calculatoarelor (Dachin, A., Burcea, F. C., 2014: 207 -216). Deşi „piaţa europeană a automobilelor a fost grav afectată de criza economică” (Niminet, L. A., 2013: 108-114), iar vânzările au scăzut şi pentru producătorii români în 2010 şi 2011 (Niminet, L. A., 2013: 108-114), în timpul crizei „Industria automobilelor şi-a crescut contribuţia la export” (Dachin, A., Burcea, F. C., 2014: 207 -216). În plus, două din cele 35 de clustere industriale identifi cate pentru economia românească de către Management Authority for the Sectoral Operation Program în 2011 au fost din industria automobilelor: Dacia Renault şi Automobile Sud-Vest Oltenia (Dachin, A., Burcea, F. C., 2014: 207 -216). În ceea ce priveşte alte ramuri industriale, merită menţionat faptul că, per total, valoarea adăugată brută din industrie reprezintă cam 30% în majoritatea regiunilor, cu valori care depăşesc 35% în Centru şi Sud-Muntenia (Iordan, M., Chilian, M. N., 2014: 397-406). După 1990 industria românească este caracterizată de o scădere a gradului de concentrare, datorată liberalizării pieţei, şi, de asemenea, de o creştere a „ponderii capitalului străin, care deţine acum aproximativ 70% din cifra de afaceri din industrie” (Chivu, L., Ciutacu, C., 2014: 157-166). Pe de altă parte, mai ales între 1990 şi 2000, industria din România s-a confruntat cu „o dispariţie accelerată a mai mult de jumătate din producţia industrială, a infrastructurii tehnice şi de know-how, a competenţelor şi a muncii” (Chivu, L., Ciutacu, C., 2014: 157-166). Având în vedere această situaţie, este necesar să fi e luate în considerare caracteristicile sectorului industrial din fi ecare judeţ, pentru a decide asupra celei mai bune formule de regionalizare. Această analiză va fi realizată în următoarea secţine a lucrării de faţă.

Romanian Statistical Review - Supplement nr. 5 / 20156
Metodologie şi sursa datelor
Această analiză a fost realizată folosindu-se instrumente oferite de statistica informaţională Onicescu, precum energia informaţională şi proprietăţile sale. Datele folosite pentru realizarea studiului provin din „Buletinul Statistic Lunar al Judeţelor” emis în mai 2013 de către Institutul Naţional de Statistică al României. Aşa cum este menţionat în respectivul document, datele cu privire la industrie se referă la industria extractivă şi de manufacturare, la producţia şi furnizarea de electricitate, gaze naturale, apă caldă şi aer condiţionat. Cele două variabile folosite pentru analiză au fost indicii producţiei industriale şi indicii valorici ai cifrei de afaceri din industrie pe total (piaţa internă şi piaţa externă) corespunzători fi ecărui judeţ din România.
Analiza datelor
În prima etapă a studiului a fost cercetată existenţa unei legături între indicii producţiei industriale şi indicii valorici ai cifrei de afaceri din industrie, pe baza indicilor generali (01.01.-31.05.2013 faţă de 01.01-31.05.2012). De asemenea, s-a cercetat dacă această posibilă legătură este infl uenţată de structura regiunilor. În acest scop, a fost calculată frecvenţa de apariţie a unor indici sub 100%, respectiv peste 100% în fi ecare regiune. După aceea, au fost calculate energiile informaţionale şi câştigul informaţional. Calculele au fost realizate atât pentru actuala structură a regiunilor României, cât şi pentru versiunile propuse într-o lucrare anterioară (Lie, I. R, 2015). Rezultatele obţinute au condus la următoarele concluzii: - Pentru regiunea Nord-Vest se observă o infl uenţă importantă a indicelui producţiei industriale asupra indicilor cifrei de afaceri din industrie (câştig informaţional 35.56%). Infl uenţa a fost uşor mai scăzută (33.33%) în cazul versiunii fără judeţele Cluj and Bistriţa-Năsăud. - Pentru regiunea Vest infl uenţa este mult mai mică, dar îşi păstrează importanţa, având în vedere că depăşeşte 5%. Cu toate acestea, atunci când judeţul Hunedoara este exclus din regiune, se observă o creştere importantă a infl uenţei (de la 8.33 la 22.2%). O situaţie similară apare şi în regiunea Sud-Muntenia, dar aici infl uenţa indicelui producţiei industriale asupra indicilor cifrei de afaceri din industrie este mult mai mare, atât în formula din prezent, cât şi în cea din care sunt excluse judeţele Călăraşi şi Ialomiţa (17.01% pentru structura curentă şi 42.67% pentru formula propusă).
Revista Română de Statistică - Supliment nr. 5 / 2015 7
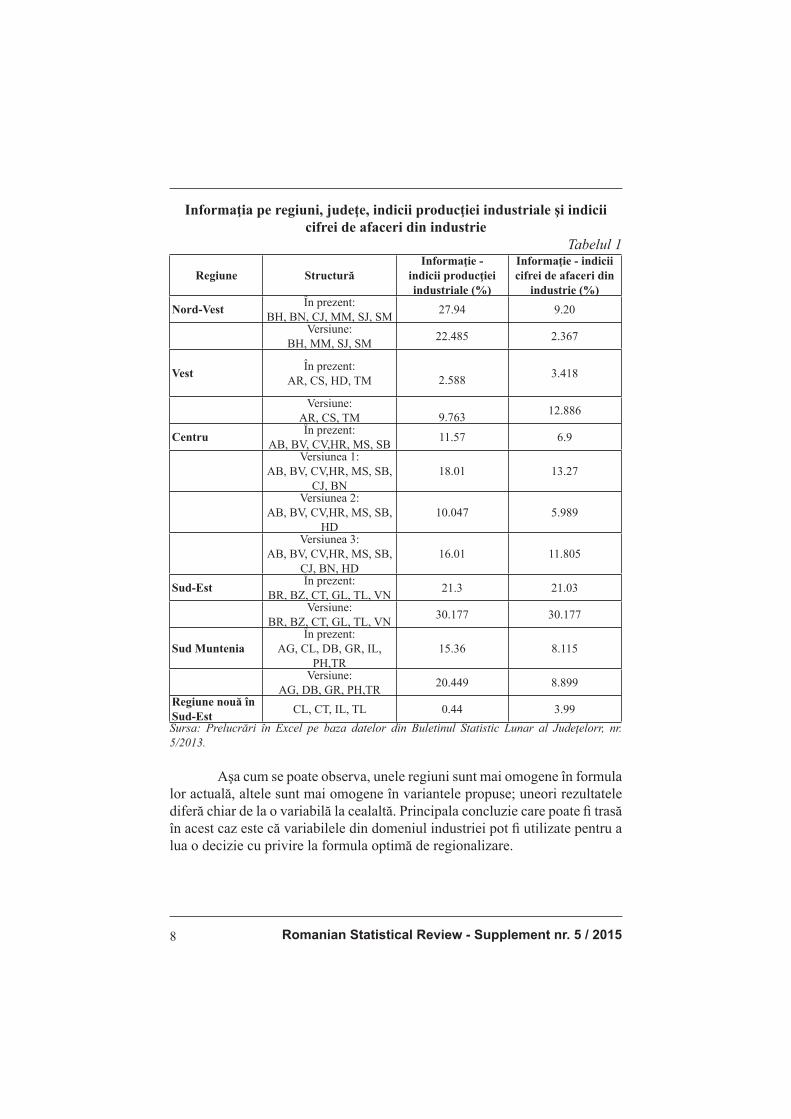
- Pentru regiunea Centru informaţia obţinută este zero; una din posibilele cauze ale acestei situaţii este faptul că aici toate judeţele au indicii cifrei de afaceri din industrie peste 100%, ceea ce face imposibile calculele tipice statisticii informaţionale. - În cazul noii regiuni propuse pentru a fi creată în Sud-Est, compusă din Tulcea, Constanţa, Călăraşi şi Ialomiţa, se poate demonstra o anumită infl uenţă a indicelui producţiei industriale asupra indicilor cifrei de afaceri din industrie, dar aceasta nu este foarte ridicată (8.3%). A doua parte a analizei se referă la omogenitatea regiunilor din România, din punctul de vedere al celor două variabile studiate anterior. Datele au fost grupate folosindu-se câte două criterii, judeţ şi frecvenţa indicilor producţiei industriale mai mari, respectiv mai mici de 100%, şi, de asemenea, judeţ şi frecvenţa indicilor cifrei de afaceri din industrie mai mari şi mai mici de 100%. Pasul următor a fost de a calcula energiile informaţionale, energiile informaţionale ajustate şi infl uenţele pentru fi ecare judeţ şi regiune. În Tabelul 1 sunt prezentate rezultatele obţinute în urma analizei indicilor producţiei industriale şi ai cifrei de afaceri din industrie pentru regiunile României.
Romanian Statistical Review - Supplement nr. 5 / 20158
Informaţia pe regiuni, judeţe, indicii producţiei industriale şi indicii cifrei de afaceri din industrie
Tabelul 1
Regiune StructurăInformaţie -
indicii producţiei industriale (%)
Informaţie - indicii cifrei de afaceri din
industrie (%)Nord-Vest În prezent:
BH, BN, CJ, MM, SJ, SM 27.94 9.20Versiune:
BH, MM, SJ, SM 22.485 2.367
Vest În prezent:AR, CS, HD, TM 2.588 3.418
Versiune:AR, CS, TM 9.763 12.886
Centru În prezent:AB, BV, CV,HR, MS, SB 11.57 6.9
Versiunea 1:AB, BV, CV,HR, MS, SB,
CJ, BN18.01 13.27
Versiunea 2:AB, BV, CV,HR, MS, SB,
HD10.047 5.989
Versiunea 3:AB, BV, CV,HR, MS, SB,
CJ, BN, HD16.01 11.805
Sud-Est În prezent:BR, BZ, CT, GL, TL, VN 21.3 21.03
Versiune:BR, BZ, CT, GL, TL, VN 30.177 30.177
Sud MunteniaÎn prezent:
AG, CL, DB, GR, IL, PH,TR
15.36 8.115
Versiune:AG, DB, GR, PH,TR 20.449 8.899
Regiune nouă în Sud-Est CL, CT, IL, TL 0.44 3.99Sursa: Prelucrări în Excel pe baza datelor din Buletinul Statistic Lunar al Judeţelorr, nr. 5/2013.
Aşa cum se poate observa, unele regiuni sunt mai omogene în formula lor actuală, altele sunt mai omogene în variantele propuse; uneori rezultatele diferă chiar de la o variabilă la cealaltă. Principala concluzie care poate fi trasă în acest caz este că variabilele din domeniul industriei pot fi utilizate pentru a lua o decizie cu privire la formula optimă de regionalizare.
Revista Română de Statistică - Supliment nr. 5 / 2015 9
Concluzii
Acest studiu asupra industriei din regiunile şi judeţele României face parte dintr-o cercetare mai extinsă, care are ca scop găsirea unei formule optime de regionalizare (nivelul NUTS 2) a ţării.Folosind instrumentele noi, oferite de statistica informaţională, am analizat legătura dintre două variabile importante din industrie, indicele producţiei industriale şi indicele cifrei de afaceri din industrie, precum şi infl uenţa structurii regiunilor asupra acestei legături. Am studiat de asemenea omogenitatea regiunilor, atât în structura lor actuală, cât şi în versiunile propuse, luând în considerare cele două variabile menţionate anterior.Rezultatul este că indicele producţiei industriale are o infl uenţă semnifi cativă asupra indicelui cifrei de afaceri din industrie; în unele cazuri infl uenţa este mai mare în structura actuală, în altele, în versiunile propuse.Am descoperit, de asemenea, că regiunile României nu sunt omogene în ceea ce priveşte industria, nici în forma lor prezentă, nici în variantele propuse. Aceasta înseamnă că decizia referitoare la formula optimă de regionalizare poate fi luată pe baza variabilelor din industrie, printre alte variabile din domenii precum comerţul sau turismul, care vor fi studiate în lucrări viitoare.
Acknowledgement
Această lucrare a fost cofi nanţată din Fondul Social European, prin Programul Operaţional Sectorial Dezvoltarea Resurselor Umane 2007-2013, proiect numărul POSDRU/159/1.5/S/134197 „Performanţă şi excelenţă în cercetarea doctorală şi postdoctorală în domeniul ştiinţelor economice din România”.
Surse bibliografi ce - Bădileanu, M., Băleanu, D., Georgescu, L. I. (2014), “Regional disparities of
the Romanian energy system”, 1st International Conference Economic Scientifi c Research - Theoretical, Empirical and Practical Approaches, ESPERA 2013, Procedia Economics and Finance, vol. 8: 53 – 59.
- Bulearcă, M., Neagu, C., Sima, C., Mărguș, D. (2014) “The Romanian extractive industry, from its early beginnings up to year 1948”, 1st International Conference Economic Scientifi c Research - Theoretical, Empirical and Practical Approaches, ESPERA 2013, Procedia Economics and Finance, vol. 8: 106 – 112.
- Chivu, L., Ciutacu, C. (2014) “About industrial structures decomposition and recomposition”, 1st International Conference Economic Scientifi c Research - Theoretical, Empirical and Practical Approaches, ESPERA 2013, Procedia Economics and Finance, vol. 8: 157 – 166.
Romanian Statistical Review - Supplement nr. 5 / 201510
- Dachin, A., Burcea, F. C., (2012) “Evaluations of Driving Effects of the Automotive Industry in the Romanian Economy – a Quantitative Analysis”, 7th International Conference on Applied Statistics, Procedia Economics and Finance vol. 10: 207 – 216.
- Danciu, A. R. (2012) “The ranking of the Romanian regions based on the potential to attract FDI”, WCBEM 2012, Procedia - Social and Behavioral Sciences, vol. 62: 40 – 44.
- Institutul Naţional de Statistică (2014) http://statistici.insse.ro/shop/ - Iordan, M., Chilian, M. N. (2014) “The sectoral structures in Romania, its regions and
the EU countries – key features of economic and social cohesion”, 1st International Conference Economic Scientifi c Research - Theoretical, Empirical and Practical Approaches, ESPERA 2013, Procedia Economics and Finance, vol. 8: 397 – 406.
- Lie, I.R, Mihaiţă N. V, (2014). “Regionalization: a few developed and applied methodologies”, in Proceedings of the Ninth International Conference on Economic Cybernetic Analysis Positive and Negative Effects of European Union and Eurozone Enlargement – PONE 2014, Editura ASE, București: 1-6.
- Lie, I.R (2015) “Scenarios for regionalization: analysis on Romania’s population using Onicescu informational statistics”, Romanian Statistical Review – Supplement, vol.3.
- Mihăiţă N. V. & Stanciu Capotă, R. (2003). “Relaţiile statistice puternice, ascunse, false şi iluzorii: aplicaţii ale statisticii informaţionale – ediţie bilingvă”, Editura ASE, Bucureşti.
- Mihăiţă N. V. (2001) “Metode cantitative în studiul pieţei – Statistica şi marketingul informaţional”, Editura Economică. Bucureşti.
- Onicescu, O. & Ştefănescu, V. (1979) „Elemente de statistică informaţională cu aplicaţii”, Editura Tehnică, Bucureşti.
- Niminet, L. A (2013) “The Automotive Market - An Ongoing Turmoil”, International Economic Conference of Sibiu 2013 Post Crisis Economy: Challenges and Opportunities, IECS 2013, Procedia Economics and Finance, vol. 6: 108-114.
Revista Română de Statistică - Supliment nr. 5 / 2015 11
SCENARIOS FOR REGIONALIZATION: ANALYSIS ON ROMANIA’S INDUSTRY USING ONICESCU INFORMATIONAL
STATISTICS PhD Student Ioana-Ruxandra Lie Bucharest University of Economic Studies
Abstract
We have shown that in order to make a decision regarding the optimal formula for Romania’s regionalization it is necessary to consider more than one criteria. The aim of this paper is to study one of these criteria – the industrial sector. Using instruments provided by Onicescu’s informational statistics we analyze the homogeneity of the Romanian regions regarding two variables, the industrial production index and the turnover value index in industry. We fi nd out that from this point of view regions are not homogeneous, which leads to the conclusion that industry is an aspect that can be considered when deciding on regionalization. JEL Classifi cation codes: C49, L60, L70, R13 Key words: regionalization, industry, informational statistics, informational energy
Introduction
Regionalization has been an important topic for discussion and research in Romania in the last few years, as the European Union focuses on regions as base for cooperation. As our development regions don’t have judicial personality, it is necessary to assign it to them, but, before that, it is necessary to fi nd the optimal structure for each region, in order to prompt development. This paper is the second part of a more extensive research, aiming to fi nd the optimal structure for each region that was mentioned above. Here, we focus on studying Romania’s industry, the homogeneity of its regions from this point of view and the connection between some variables from the industry fi eld. The analysis is carried out with the instruments provided by Onicescu’s informational statistics. As a result, we fi nd out that there is a connection between the industrial production index and the turnover value index in industry. More important, we also fi nd that regions are not homogeneous from
Romanian Statistical Review - Supplement nr. 5 / 201512
the industry’s point of view, which means that the variables from this fi eld can be used in order to decide on the optimal formula for regionalization. The fi rst part of the paper presents the main characteristics of Romanian industry, focusing on the evolution in this fi eld after the end of the communist era and, also, on the consequences of the more recent economic crisis. The second section of the paper focuses on the data and methods used in order to carry out the analysis, and it is followed the presentation of the results we obtained. We end with the conclusions and directions for further investigations.
Evolution and general characteristics of Romania’s industrial sector
One of the main reasons for regionalization is to create structures that would increase and stimulate development in Romania, and an important role in development is held by industry. For example, Danciu (2012: 40-44) notices that one of the causes of underdevelopment is the predominance of rural activities. Moreover, according to other authors, nowadays “industry is called to play the most important role in the new development model of the European Union, in the soundness and viability of the EU economy” (Chivu, L., Ciutacu, C., 2014: 157-166). Romanian industry developed especially in the communist era, but there were some industrial activities that emerged previously to that moment, for example extractive and energy sectors. As Bulearcă et. all (2014: 106-112) highlight, Romania was among the pioneers in the exploitation and use of natural gas, in Europe and in the world; they also notice that we have a long history with other areas of the energy sector, like coal mining, oil exploitation, and thermoelectric and hydroelectric power generation. The development of these sectors continued and by the 1950s, Romania was “among the top 5 places in the world in terms of production and consumption of primary energy” (Bulearcă et. all, 2014: 106-112). After many years of increasing production and consumption of energy due to the intensive industrialization in the communist era (Bulearcă et. all, 2014: 106-112), from the 1990s we have witnessed a change in the structure of this sector: as a consequence of the decrease in consumption, less electricity is now produced, the contribution of thermal energy to the total production has diminished, and wind farms have expanded (Bădileanu et. all, 2014: 53-59). It is worth mentioning that from all the industrial branches in Romania, “in real terms, the highest gross value added increment in 2010, by comparison to 1990, was recorded in the production and supply of electric power, heating, gas, hot water” (Chivu, L., Ciutacu, C., 2014: 157-166).
Revista Română de Statistică - Supliment nr. 5 / 2015 13
As we focus our study on Romania’s regions, it is also important to mention that this sector is not equally developed over the country: in 2013 “Sothwest and Southeast regions administered almost 60% of the capacities of the energy system”, and these disparities tend to increase as it is forecasted that wind farms will continue to expand, and production based on fossil fuels will decrease (Bădileanu et. all, 2014: 53-59). Another important industrial sector in Romania is the automotive industry, not only because it “became an engine for recovery in the last years”, (Dachin, A., Burcea, F. C., 2014: 207 -216), but also because there are other industrial branches strongly connected to this one: metallurgical industry, chemical industry, the energy sector, textile industry, electrical and computer industries (Dachin, A., Burcea, F. C., 2014: 207 -216). Even though the “European automotive market has been hit hard by the economic crisis” (Niminet, L. A., 2013: 108-114) and sales also dropped for Romanian producers in 2010 and 2011 (Niminet, L. A., 2013: 108-114), during this crisis “the automotive industry has increased its contribution to exports” (Dachin, A., Burcea, F. C., 2014: 207 -216). Moreover, two out of the 35 industrial clusters identifi ed for the Romanian economy by the Management Authority for the Sectoral Operation Program in 2011 were from the automotive industry: Dacia Renault and Automotive Southwest Oltenia (Dachin, A., Burcea, F. C., 2014: 207 -216). Regarding other industry sectors, it is worth mentioning that overall, the gross value added from industry is around 30% in most of the regions, with values that exceed 35% in Center and South Muntenia (Iordan, M., Chilian, M. N., 2014: 397-406). After 1990 Romanian industry is also characterized by a decrease in the degree of concentration, due to the market liberalization, and also by an increase of the “share of foreign capital, which is now holding some 70% of the turnover in industry” (Chivu, L., Ciutacu, C., 2014: 157-166). On the other hand, especially between 1990 and 2000, Romanian industry faced an “accelerated dissolution of more than half of the industrial production, technical and know-how infrastructure, competences, and labor” (Chivu, L., Ciutacu, C., 2014: 157-166). Considering this situation, it is necessary to take into account the characteristics of the industrial sector in each county in order to decide regarding the best formula for regionalization. This analysis will be carried out in the following section of the paper.
Romanian Statistical Review - Supplement nr. 5 / 201514
Methodology and data
This analysis was made using instruments provided by Onicescu’s informational statistics, like informational energy and its properties. The data used in order to complete the study was found in the “Statistical Monthly Bulletin of the Counties” issued in May 2013 by the Romanian National Institute of Statistics. As it is mentioned in this bulletin, data regarding industry refers to mining and quarrying, manufacturing, production and supply of electricity and heat, gas, hot water and air conditioning. The two variables used in order to perform this analysis were the industrial production index and turnover value index in industry for total (domestic and non-domestic markets) corresponding to each county in Romania.
Data analysis
The fi rst part of this study was to analyze, based on general indexes (01.01.-31.05.2013 to 01.01-31.05.2012), if there is a connection between industrial production indexes and those of turnover value. It was also studied if this possible connection is infl uenced by the regions’ structures. In order to achieve this, we calculated the frequency of occurrence of indexes below 100%, respectively above this value for each region. Then we calculated the weighted informational energies and the information gained. These calculations were made for the current composition of Romania’s regions, and also for the versions we proposed in a previous paper (Lie, I. R, 2015). The results obtained lead to the following conclusions: - For Northwest region there is an important infl uence of the industrial production index on the turnover value index in industry (information gain 35.56%). The infl uence was slightly lower (33.33%) in the case of the version without Cluj and Bistriţa-Năsăud counties. - For the West region the infl uence is much smaller, but it is still important, as it exceeds 5%. However, when excluding Hunedoara county from the region, a signifi cant increase in infl uence is noticed (from 8.33 to 22.2%). A similar situation occurs in South-Muntenia Region, but here the infl uence of the industrial production index on the turnover value index in industry is much higher both in the current formula and in the one excluding Călăraşi and Ialomiţa counties (17.01% for current situation, and 42.67% for the proposed version). - For the Center region the information obtained is zero; one of the
Revista Română de Statistică - Supliment nr. 5 / 2015 15
possible causes for this situation in the fact that here all the counties have the turnover value index in industry above 100%, which makes the calculations typical for informational statistics impossible. - In the current formula, it appears to be no connection between the two variables considered, in the Southeast region, but when excluding Tulcea and Constanţa counties, the infl uence increases signifi cantly (25%). - In the case of the new region proposed by us to be created in the Southeast of Romania, composed by Tulcea, Constanţa, Călăraşi and Ialomiţa, we can prove a certain infl uence of the industrial production index on the turnover value index in industry, but this is not very high (8.3%). The second part of the study is an analysis on the homogeneity of the regions in Romania, taking into account the two variables analyzed in the previous part. We grouped the data using two criteria, county and the frequency of industrial production indexes below and above 100%, and also county and the turnover value indexes in industry, below and above 100%. This was followed by the calculation of the informational energies, the adjusted informational energies and infl uences for each county and region. Table 1 presents the results obtained by analyzing the industrial production indexes and the turnover value indexes in industry for the Romanian regions.

Romanian Statistical Review - Supplement nr. 5 / 201516
Informational energies and information by regions, counties, industrial production indexes and turnover value indexes in industry
Table 1
Region StructureInformation -
industrial production indexes (%)
Information - turnover value indexes in
industry (%)Northwest Current:
BH, BN, CJ, MM, SJ, SM
27.94 9.20
Version:BH, MM, SJ, SM 22.485 2.367
West Current:AR, CS, HD, TM 2.588 3.418
Version:AR, CS, TM 9.763 12.886
Center Current:AB, BV, CV,HR, MS, SB 11.57 6.9
Version 1:AB, BV, CV,HR, MS,
SB, CJ, BN18.01 13.27
Version 2:AB, BV, CV,HR, MS,
SB, HD10.047 5.989
Version 3:AB, BV, CV,HR, MS,
SB, CJ, BN, HD16.01 11.805
Southeast Current:BR, BZ, CT, GL, TL, VN 21.3 21.03
Version:BR, BZ, CT, GL, TL, VN 30.177 30.177
South Muntenia
Current:AG, CL, DB, GR, IL,
PH,TR15.36 8.115
Version:AG, DB, GR, PH,TR 20.449 8.899
New region in the Southeast CL, CT, IL, TL 0.44 3.99Source: Excel calculations based on data from Statistical Monthly Bulletin of the Counties, no. 5/2013.
As it can be seen some of the regions are more homogeneous in their current formula, others are more homogeneous in the proposed versions; sometimes the results differ from one variable to the other. The main conclusion reached here is that when trying to decide on an optimal formula for regionalization, variables from the industry area can be used in order to make a decision.

Revista Română de Statistică - Supliment nr. 5 / 2015 17
Conclusions
This study on the industry in Romanian regions and counties is part of a more extensive research, aiming to fi nd an optimal formula for regionalization (NUTS 2 level) for Romania. Using the new instruments, provided by the informational statistics, we analyzed the relationship between two important variables in industry, the industrial production index and the turnover value index in industry, and the infl uence of the regions’ structure on this relationship. We also studied the homogeneity of the regions, both with their current structure and the proposed structures, taking into account the two variables mentioned before. The result is that the industrial production index has a signifi cant infl uence on the turnover value index in industry; in some cases this infl uence is bigger in the current situation, sometimes it is bigger in the proposed version. We also found that regions in Romania are not homogenous in terms of industry, in both current and proposed versions. This means that the decision on the optimal formula can be taken considering variables from industry, but also from other fi elds, like commerce and tourism, which will be studied in further works.
Acknowledgement
This work was cofi nanced from the European Social Fund through Sectoral Operational Programme Human Resources Development 2007-2013, project number POSDRU/159/1.5/S/134197 „Performance and excellence in doctoral and postdoctoral research in Romanian economics science domain”.
References
- Bădileanu, M., Băleanu, D., Georgescu, L. I. (2014), “Regional disparities of the Romanian energy system”, 1st International Conference Economic Scientifi c Research - Theoretical, Empirical and Practical Approaches, ESPERA 2013, Procedia Economics and Finance, vol. 8: 53 – 59.
- Bulearcă, M., Neagu, C., Sima, C., Mărguș, D. (2014) “The Romanian extractive industry, from its early beginnings up to year 1948”, 1st International Conference Economic Scientifi c Research - Theoretical, Empirical and Practical Approaches, ESPERA 2013, Procedia Economics and Finance, vol. 8: 106 – 112.
- Chivu, L., Ciutacu, C. (2014) “About industrial structures decomposition and recomposition”, 1st International Conference Economic Scientifi c Research - Theoretical, Empirical and Practical Approaches, ESPERA 2013, Procedia Economics and Finance, vol. 8: 157 – 166.
Romanian Statistical Review - Supplement nr. 5 / 201518
- Dachin, A., Burcea, F. C., (2012) “Evaluations of Driving Effects of the Automotive Industry in the Romanian Economy – a Quantitative Analysis”, 7th International Conference on Applied Statistics, Procedia Economics and Finance vol. 10: 207 – 216.
- Danciu, A. R. (2012) “The ranking of the Romanian regions based on the potential to attract FDI”, WCBEM 2012, Procedia - Social and Behavioral Sciences, vol. 62: 40 – 44.
- Institutul Naţional de Statistică (2014) http://statistici.insse.ro/shop/ - Iordan, M., Chilian, M. N. (2014) “The sectoral structures in Romania, its regions and
the EU countries – key features of economic and social cohesion”, 1st International Conference Economic Scientifi c Research - Theoretical, Empirical and Practical Approaches, ESPERA 2013, Procedia Economics and Finance, vol. 8: 397 – 406.
- Lie, I.R, Mihaiţă N. V, (2014). “Regionalization: a few developed and applied methodologies”, in Proceedings of the Ninth International Conference on Economic Cybernetic Analysis Positive and Negative Effects of European Union and Eurozone Enlargement – PONE 2014, Editura ASE, București: 1-6.
- Lie, I.R (2015) “Scenarios for regionalization: analysis on Romania’s population using Onicescu informational statistics”, Romanian Statistical Review – Supplement, vol.3.
- Mihaiţă N. V. & Stanciu Capotă, R. (2003). “Relaţiile statistice puternice, ascunse, false şi iluzorii: aplicaţii ale statisticii informaţionale – ediţie bilingvă”, Editura ASE, Bucureşti.
- Mihaiţă N. V. (2001) “Metode cantitative în studiul pieţei – Statistica şi marketingul informational”, Editura Economică. Bucureşti.
- Onicescu, O. & Ştefănescu, V. (1979) „Elemente de statistică informaţională cu aplicaţii”, Editura Tehnică, Bucureşti.
- Niminet, L. A (2013) “The Automotive Market - An Ongoing Turmoil”, International Economic Conference of Sibiu 2013 Post Crisis Economy: Challenges and Opportunities, IECS 2013, Procedia Economics and Finance, vol. 6: 108-114.
Revista Română de Statistică - Supliment nr. 5 / 2015 19
Analiza intenţiei de întoarcere a românilor din Spania
Elena-Maria Prada Bucharest Academy of Economic Studies
email: [email protected]
Abstract
Migrația este fenomenul care a însoțit fi ința umană de-a lungul vieții, oamenii căutând locuri potrivite traiului. Motivele pentru a migra au evoluat o data cu marile descoperiri ale lumii. În zilele noastre, conceptual de migrație este diferit din punctual de vedere al factorilor care o determină, dar motivul principal pentru a migra râmane bunăstarea. În analiza determinării factorilor migrației de revenire a românilor din Spania am utilizat chestionarul Institutului de Statistică din Spania ”Encuesta Nacional de Inmigrantes” din anul 2007. Rezultatele arată că înainte de începerea crizei fi nanciare intențiile de revenire nu erau atât de proeminente, totuși dacă persoana remitea în țara de origine sau avea o experiență sufi cientă în Spania existau și intenții de revenire, acest lucru confi rmând faptul că migrația nu era una permanentă, ci una temporară iar pe măsură ce scopul migrației era îndeplinit migrantul inteționa să revină. Cuvinte cheiei: revenire, migrație, probit, logit, Romania. JEL Classifi cation codes: C01,C30, O15
Introducere
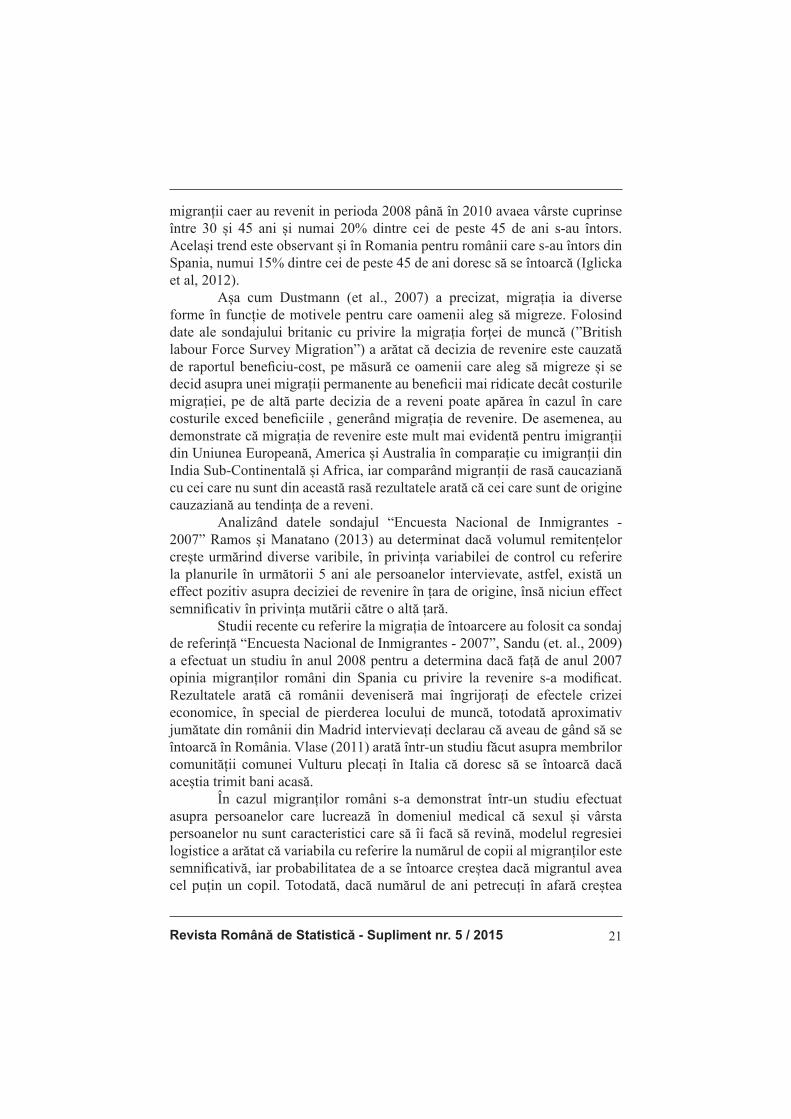
Migrația este fenomenul care a însoțit fi ința umană de-a lungul vieții, oamenii căutând locuri potrivite traiului. Motivele pentru a migra au evoluat o data cu marile descoperiri ale lumii. În zilele noastre, conceptul de migrație este diferit din punctual de vedere al factorilor care o determină, dar motivul principal pentru a migra râmane bunăstarea. Migrația de întoarcere a devenit un subiect important mai ales după criza fi nanciară din 2007, mai din cauza efectelor acesteia precum creșterea prețurilor sau pierderea locurilor de muncă. În timp ce pentru emigrație s-a demonstrat că este determinată de condițiile mai bune de trai din țările gazdă (astfel că factorii bunăstării la nivel macroeconomic sunt principalii factori push), migrația de revenire necesită informații și la nivel microeconomic, deoarece reprezintă o decizie a individului în funcție de contextul socio-economic. Mulți autori plasează debutul crizei economice la sfârșitul anului 2008 rata șomajului a ajuns la niveluri neprevăzute (Hurd și Rohwedder, 2010) (Ötker-Robe și Podpiera, 2013).
Romanian Statistical Review - Supplement nr. 5 / 201520
În Romania studiile cu privire la migrația de revenire sunt doar la nivel incipent în principal din cauza lipsei datelor consistente cu privire la această temă. În acest context articolul de față expluateză baza de date a Institutului din Spania din 2007 - “Encuesta Nacional de Inmigrantes”, pentru a determina intențiile de revenire a emigranților români în anul 2007, înainte de criza fi nanciară. Articolul începe cu o descriere succintă a literaturii de specialitate cu privire la subiectul migrației de revenire și este structurat după cum urmează: mai întâi am precizat metodologia modelelor econometrice care au ca variabila dependentă binară, utilizate în analiza intenției migrației de revenire, urmată de specifi carea variabilelor utilizate în analiză folosind chestionarul “Encuesta Nacional de Inmigrantes - 2007”( ENI - 2007). În fi nal, am construit două modele econometrice Probit pentru determinare motivelor mgirației de întoarcere în privința migranților români din Spania. Articolul plasează analiza înaintea crizei fi nanciare și oferă imagine de ansamblu a întențiilor pre-criză, de altfel, trebuie luat în calcul acest aspect mai ales că din analiza descriptivă se observă că cei care doresc să revină au o pondere semifi cativ mai mica decât a celor care doresc să rămână.
Migrația de revenire. Contextul internațional și național
Literatura în domeniul migrației este foarte bogată, multe dintre studii se concentrează asupra determinaților migrației, aspectele și repercusiunile la nivel macroeconomic și microeconomic a țărilor care trimit și primesc migranți deopotrivă. Migrația de revenire, totuși, nu a fost o problemă intens dezbătută decât după ce criza fi nanciară a început. Date fi ind principalele teorii ale migrației cel care se întoarce poate fi un migrant care a eșuat în scopurile sale de a migra dar este puternic legat de țara de origine, chiar și așa unii dintre ei nu aleg să se întoarcă permanent (Cassarino, 2004). Migrația de revenire este importantă din perspectiva ambelor țări: atât cele care primesc, dar și cele care trimit migrant. Principalul motiv care determină revenirea îl reprezintă eșecul economic al migrantului, primele constatări arată că migrantul care este incapabil să găsească o slujbă potrivită este mult mai probabil să se întoarcă (DaVanzo, 1980). Totodată, migranții pot fi legați de tărâmurile natale, iar decizia de a se întoarce către țara natală în cazul celor din Noua Zeelandă este bazată pe atașamentul puternic fașă de familie, prieteni și locuri vechi și familiare (Gilson și Lidgard, 2002). Actualul context socio-economic a fost afectat de criza fi nanciară care a început în 2007 având un impact puternic asupra țărilor dezvoltate, fapt care poate determina migrația de revenire (Herm, 2008). In Ungaria jumatate dintre
Revista Română de Statistică - Supliment nr. 5 / 2015 21
migranții caer au revenit in perioda 2008 până în 2010 avaea vârste cuprinse între 30 și 45 ani și numai 20% dintre cei de peste 45 de ani s-au întors. Același trend este observant și în Romania pentru românii care s-au întors din Spania, numui 15% dintre cei de peste 45 de ani doresc să se întoarcă (Iglicka et al, 2012). Așa cum Dustmann (et al., 2007) a precizat, migrația ia diverse forme în funcție de motivele pentru care oamenii aleg să migreze. Folosind date ale sondajului britanic cu privire la migrația forței de muncă (”British labour Force Survey Migration”) a arătat că decizia de revenire este cauzată de raportul benefi ciu-cost, pe măsură ce oamenii care aleg să migreze și se decid asupra unei migrații permanente au benefi cii mai ridicate decât costurile migrației, pe de altă parte decizia de a reveni poate apărea în cazul în care costurile exced benefi ciile , generând migrația de revenire. De asemenea, au demonstrate că migrația de revenire este mult mai evidentă pentru imigranții din Uniunea Europeană, America și Australia în comparație cu imigranții din India Sub-Continentală și Africa, iar comparând migranții de rasă caucaziană cu cei care nu sunt din această rasă rezultatele arată că cei care sunt de origine cauzaziană au tendința de a reveni. Analizând datele sondajul “Encuesta Nacional de Inmigrantes - 2007” Ramos și Manatano (2013) au determinat dacă volumul remitențelor crește urmărind diverse varibile, în privința variabilei de control cu referire la planurile în următorii 5 ani ale persoanelor intervievate, astfel, există un effect pozitiv asupra deciziei de revenire în țara de origine, însă niciun effect semnifi cativ în privința mutării către o altă țară. Studii recente cu referire la migrația de întoarcere au folosit ca sondaj de referință “Encuesta Nacional de Inmigrantes - 2007”, Sandu (et. al., 2009) a efectuat un studiu în anul 2008 pentru a determina dacă față de anul 2007 opinia migranților români din Spania cu privire la revenire s-a modifi cat. Rezultatele arată că românii deveniseră mai îngrijorați de efectele crizei economice, în special de pierderea locului de muncă, totodată aproximativ jumătate din românii din Madrid intervievați declarau că aveau de gând să se întoarcă în România. Vlase (2011) arată într-un studiu făcut asupra membrilor comunității comunei Vulturu plecați în Italia că doresc să se întoarcă dacă aceștia trimit bani acasă. În cazul migranților români s-a demonstrat într-un studiu efectuat asupra persoanelor care lucrează în domeniul medical că sexul și vârsta persoanelor nu sunt caracteristici care să îi facă să revină, modelul regresiei logistice a arătat că variabila cu referire la numărul de copii al migranților este semnifi cativă, iar probabilitatea de a se întoarce creștea dacă migrantul avea cel puțin un copil. Totodată, dacă numărul de ani petrecuți în afară creștea

Romanian Statistical Review - Supplement nr. 5 / 201522
probabilitatea de a reveni creștea. Deasemenea, cei care remit intenționează să revină, iar venit are un impact negativ asupra intenției de revenire, întrucât, cu cât venitul migrantului este mai ridicat cu atât acesta este mai puțin dornic de a se întoarce în țară (Roman și Zizi, 2012) (Roman și Zizi, 2014).
Metodologia cercetării
Modele econometrice avansate cele mai utilizate în analiza de chestionar sunt modelele a căror variabilă dependent ia valori discrete. În funcție de tipul variabilei putem distinge urmatoarele două tipuri de modele econometrice (Andrei și Bourbonnais, 2008): • Modele cu variabila dependentă binară (în general valori acceptate
pentru această variabilă sunt 0 și 1). Aceste modele estimează probabilitatea pi este egală cu 1. Cele mai utilizate modele binare sunt Logit, Probit și regresia logistică.
• Modele cu răspunsuri multiple sunt modele a căror variabilă dependentă are mai mult de două variante de răspuns. În acest caz variabila dependentă poate fi nominală sau ordinală.
Un model econometric cu variabila dependentă de tip binar, Logit, a fost utilizat în analiza intenției de revenire a Românilor migranți care au studii superioare, asupra unei baze de date colectate cu ajutorul unui sondaj on-line, rezultatele arată că o dată cu înaintarea în vârstă intenția de revenire scade. Totodată, dacă aceștia au un serviciu stabil în țara gazdă afectează negative intențiile de revenire în țara de origine. Pe de altă parte, situații precum identitatea națională, faptul că sunt mândrii că sunt români, dar și faptul că au o rudă acasă (soț / soție / copil) în țara de orgine determină intenția de revenire (Predosanu et al., 2007). Modele Probit sunt și acestea utilizate în studiul intenției de revenire. Soon (2010) a studiat intenția de a reveni în țara de origine a studenților străini din Noua Zeelandă și a demonstrate că percepția asupra felului în care aceștia își pot folosi în țara lor de origine aptitudinile dobândite le afectează semnifi cativ intenția de a reveni, de asemenea, cu privire la perioada pe care au petrecut-o în Noua Zeelandă, studenții doresc să râmână pe măsură ce această perioadă crește. Modele binare sunt modele pentru variabile dependente dihotomice, forma generală a modelelor Probit și Logit este reprezentată după cum urmează:
(1)

Revista Română de Statistică - Supliment nr. 5 / 2015 23
Singura diferență dintre cele două modele este cu privire la distribuția termenului eroare. Distribuția termenului eroare a modelului Logit este reprezentat de o distribuție logistică după cum urmează:
(2)
Distribuția termenului eroare a modelului Probit model este o distribuție normală spre deosebire de distribuția logistică a modelului Logit (Pecican, 2009). În această situație probabilitatea ca pi = P (yi = 1) este defi nite de următoarea ecuație (Andrei și Bourbonnais, 2008):
(3), Unde:
Cu:
Atunci când se estimează parametrii unui model cu variabilă binară de tipul Probit sau Logit, totodată se estimează și efectele marginale ale acestora. Efectele marginale arată cu cât se modifi că probabilitatea variabile dependente atunci când y=1 dacă variabilele independente se modifi că cu o unitate(Greene, 1996). În analiză am folosit modelul Probit, deoarece în literatura de specialitate nu se recomandă un anumit model, iar pentru rezultatele analizate nu există diferențe semnifi cative între rezultaltele celor două modele.
Date și variabile
Pentru a analiza situația generală a emigranților Români în Spania, am folosit baza de date a unui chestionar efectuat asupra imigranților din Spania furnizată de către Institutul de Statistică al Spaniei în 2007 - “Encuesta Nacional de Inmigrantes”(ENI). ENI a fost desfășurat în perioada noiembrie 2006 și februarie 2007 și oferă informații cu privire la aspect soci-demografi ce precum statusul marital, naționalitate, țara unde s-a născut, educație, dar și informații cu privire la planurile în următorii 5 ani, venit, ani petrecuți în Spania, sau dacă sunt sau nu angajați.

Romanian Statistical Review - Supplement nr. 5 / 201524
Variabila dependent utilizată în model cu referire la intenția de revenire a respondenților a fost codifi cată după întrebarea ”Care sunt planurile dumneavoastra în următorii 5 ani?”: 1. Nu știu 2. Mă întorc în țara de origine 3. Rămân în Spania 4. Mă gândesc la o altă țară Analizând răspunsurile cu privire la planurile în următorii 5 ani observăm că o parte mică din respondenți 8,28% au declarat că doresc să revină în România. Variabila dependentă a fost recodifi cată după întrebarea care sunt planurile dumneavoastră în următorii 5 ani astfel: - Mai întâi am renunțat la variantele de răspuns ”nu știu” și ”consider
o altă țară” întrucât numărul de respondenți era foarte mic; - Apoi am codifi cat întrebarea astfel: 1 = Da, doresc să revin în
România și 0 = Rămân în Spania. Pentru a obține baza de date fi nală am fi ltrat baza de date după țara în care s-au născut, dar și după naționalitate, astfel încât baza de date să includă numai români. Totodată, din baza de date am eliminat și răspunsurile nefi rești, deoarece unii dintre respondenți au declarat că nu au vârsta de muncă deși aveau peste 30 de ani. De asemenea, am exclus persoanele care aveau vârsta sub 18 ani și peste 65 ani pentru a obține o bază de date care are populația în vârstă de muncă, astfel componența bazei de date fi nale este formată din 955 de observații însă dintre aceștia 946 de persoane au răspuns la întrebarea ”ce planuri aveți în următorii 5 ani”; repartizarea pe variante de răspuns este prezentată mai jos:
“Care sunt planurile în următorii 5 ani”: Frecvența- Mă întorc în țara de origine- Rămân în Spania
85393
Total 946
Analiza noastră a cuprins variabile socio-demografi ce, dar și variabile care țin de alte aspecte precum nivelul de vorbire al limbii spaniole introdus în analiză ca variabilă dummy în funcție de cel mai mic nivel al cunoașterii limbii spaniole (1 fi ind cel mai mic nivel - nu stie spaniola bine, iar 4 cel mai înalt nivel - știe spaniola foarte bine); sexul persoanelor variabilă de tip dihotomic 1 reprezentând sexul feminine și 0 sexul masculin; starea civilă dacă este căsătorit(1) sau nu(0); dacă are studii de orice fel(codifi cată cu 1 pentru da are studii și 0 pentru nu are studii); dacă are părinții în țara de origine, respectiv în România; variabila continuă numărul de persoane cu care locuiește în Spania; dacă are sau nu serviciu la momentul intervievării; dacă remite către țara de
Revista Română de Statistică - Supliment nr. 5 / 2015 25
origine; și anii petrecuți în Spania, care refl ect experința ca migrant, unde am pus restrictive maximum 10 ani întrucât până la acest număr de ani erau cei mai mulți dintre migranți.
Rezultate și comentarii
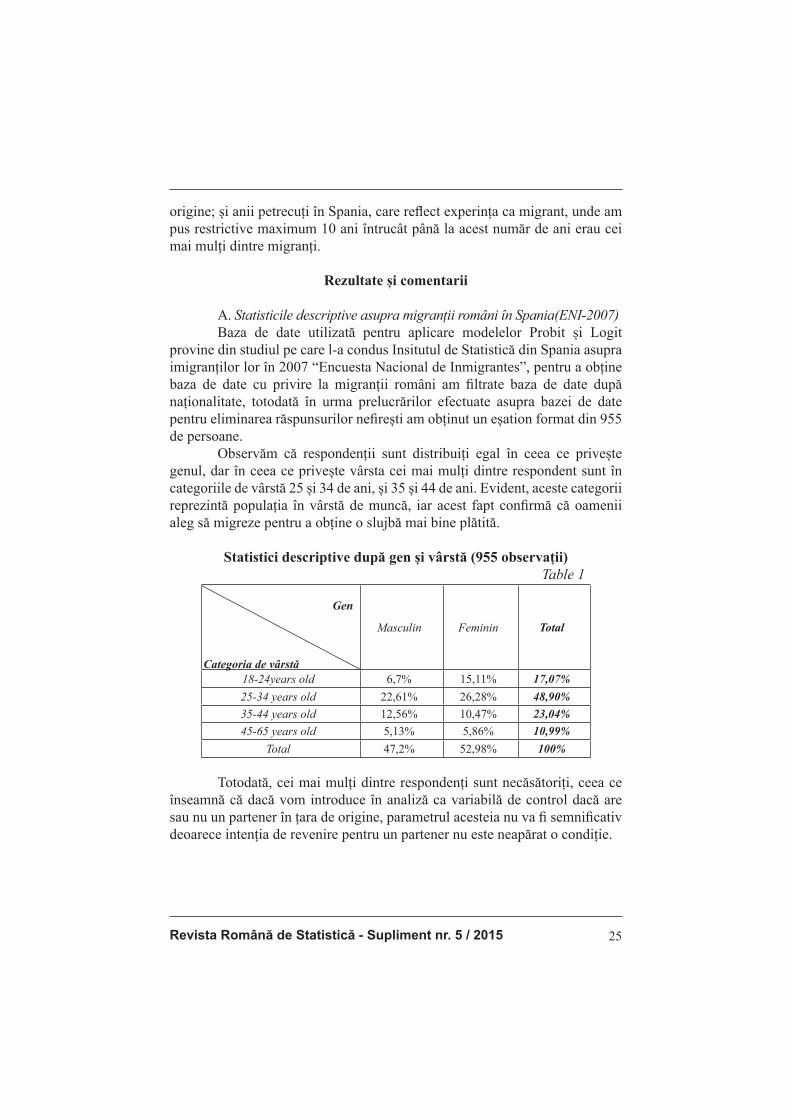
A. Statisticile descriptive asupra migranții români în Spania(ENI-2007) Baza de date utilizată pentru aplicare modelelor Probit și Logit provine din studiul pe care l-a condus Insitutul de Statistică din Spania asupra imigranților lor în 2007 “Encuesta Nacional de Inmigrantes”, pentru a obține baza de date cu privire la migranții români am fi ltrate baza de date după naționalitate, totodată în urma prelucrărilor efectuate asupra bazei de date pentru eliminarea răspunsurilor nefi rești am obținut un eșation format din 955 de persoane. Observăm că respondenții sunt distribuiți egal în ceea ce privește genul, dar în ceea ce privește vârsta cei mai mulți dintre respondent sunt în categoriile de vârstă 25 și 34 de ani, și 35 și 44 de ani. Evident, aceste categorii reprezintă populația în vârstă de muncă, iar acest fapt confi rmă că oamenii aleg să migreze pentru a obține o slujbă mai bine plătită.
Statistici descriptive după gen și vârstă (955 observații) Table 1
Gen
Categoria de vârstă
Masculin Feminin Total
18-24years old 6,7% 15,11% 17,07%25-34 years old 22,61% 26,28% 48,90%35-44 years old 12,56% 10,47% 23,04%45-65 years old 5,13% 5,86% 10,99%
Total 47,2% 52,98% 100%
Totodată, cei mai mulți dintre respondenți sunt necăsătoriți, ceea ce înseamnă că dacă vom introduce în analiză ca variabilă de control dacă are sau nu un partener în țara de origine, parametrul acesteia nu va fi semnifi cativ deoarece intenția de revenire pentru un partener nu este neapărat o condiție.

Romanian Statistical Review - Supplement nr. 5 / 201526
Statistici descriptive după status marital și vîrstă(955 observații) Tabel 2
Gen
Categoria de vârstă
Necăsătorit Căsătorit Total
18-24years old 8.1% 9.0% 17.1%25-34 years old 32.9% 16.0% 48.9%35-44 years old 17.1% 6.0% 23.0%45-65 years old 7.7% 3.2% 11.0%
Total 65.8% 34.2% 100.0%
B. Analiza rezultatelor modelului Probit Pentru a analiza intenția de revenire am construit duă modele Probit: unul pentru categoria de vârstă 18 – 65 de ani care reprezinta populația în vârstă de muncă, și cel de-al doilea pentru categoria de vârstă 19-50 de ani întrucât în acestă categorie există proporția cea mai mare de migranți români care doresc să revină 10,16%. Având în vedere aceste rezultate, trebuie să luâm în considerare faptul că anul în care a fost culeasă baza de date este 2007, când cei mai mulți nu doreau să revină, în principal datorită boomul economic și faptului că efectel crizei fi nanciare încă nu erau resimțite. Analizând rezultatele observăm că variabilele socio-demografi ce precum sexul și starea civilă a persoanelor intervievate nu au efect asupra deciziei de revenire, deși pentru variabila cu referire la genul persoanei era egal distribuită. De asemenea, am introdus în model și variabile de control cu privire la dacă are părinții în România, dacă are orice fel de studii, fi e acestea la nivel minim sau superior, și dacă a dobândit o locuință în Spania, niciuna dintre aceste variabile neavând un efect semnifi cativ asupra intenției de revenire a respondenților. Nesemnifi cativitatea coefi cienților modelului se datorează în mod special ponderii mici a persoanelor care au declarat că doresc să revină. Totodată analizând intenția de revenire din perspectiva persoanelor care au nivel mai ridicat al cunoștintelor limbii spaniole față de cele care au nivel slab de cunoștințe se observă că persoanele care cunosc foarte bine limba spaniolă nu au intenția să revină în România, lucru care era de așteptat având în vedere că acestea au depășit foarte ușor barajul lingvistic.

Revista Română de Statistică - Supliment nr. 5 / 2015 27
Probit for age between 18-65 years oldTabel 3
Model Probit Model Probit II Efecte marginale p>|z|Constant -1,949 -1,700 - -VbSpan2 -0,213 - - -VbSpan3 -0,077 - - -VbSpan4 -0,413(*) -0,356(*) -0,056 0,012Remite 0,347(*) 0,343(*) 0,054 0,010Are serviciu -0,223(*) -0,254(*) -0,039 0,035Anii în Spania 0,364(*) 0,288(*) 0,045 0,019Locuință în Spania -0,209 - - -Sex 0,131 - - -Stare civilă 0,914 - - -Părinți în România -0,381 - - -Are studii 0,009 - - -Număr persoane 0,001 - - -Log likehood -265,234 -266,46Pseudo R2 0,038 0,0342LR chi2 21,35(*) 18,89(*)Numărul de observații 890 (*) semnifi cativ la 5%
De asemenea, în privința intenției de revenire un efect pozitiv îl au variabilele cu privire la dacă persoana remite bani acasă, cu alte cuvinte investește banii câștigați și în țara de origine, și vechimea ca migrant în Spania, limitată la 10 ani deoarece peste această perioadă eșantionul era afectat de valori extreme. Acest lucru demonstrează că intenția de migra nu este una permanentă, iar migrantul o dată ce și-a îndeplinit scopul are intenția de reveni în țara de origine. Analizând rezultatele efectelor marginale asupra modelului Probit redefi nt după ce am eliminate variabilele nesemnifi cative din modelul Probit anterior, observăm că cei care cunosc foarte bine spaniola față de cei care au un nivel scăzut de cunoștințe al acestei limbi sunt cu 5,6% mai puțin probabil să revină, iar cei care au un serviciu sunt cu 3,9% mai puțin probabil să revină față de cei care nu au un serviciu. În privința intenției de revenire, aceasta se manifestă in cazul celor care remit fi ind cu 5,4% mai probabil să revină în țară față de cei care nu remit, de asemenea pentru fi ecare an care se adaugă experienței de migrant există o probabilitatea cu 4,5% mai mare de revenire. Așa cum am justifi cat anterior, am ales ca eșantion pentru cel de-al doilea model persoanele din categoria de vârstă 19-50 de ani deoarece aceștia aveau cea mai mare pondere a persoanelor care doresc să revină din totalul eșantionului, 10,16% declarau că doresc să revină.

Romanian Statistical Review - Supplement nr. 5 / 201528
Probit for age between 19-50 years oldTabel 4
Model Probit Model Probit II Efecte marginale p>|z|Constant -1,591(*) -1,662 - -VbSpan2 -0,277 - - -VbSpan3 -0,181 - - -VbSpan4 -0,455(*) -0,326(*) -0,053 0,024Remite 0,383(*) 0,385(*) 0,062 0,005Are serviciu -0,261(*) -0,288(*) -0,047 0,020Anii în Spania -0,455(*) 0,077(*) 0,013 0,016Locuință în Spania -0,230 - - -Sex 0,077 - - -Stare civilă 0,021 - - -Părinți în România -0,391 - - -Are studii -0,002 - - -Număr persoane -0,005 - - -Log likehood -249,88 -251,324Pseudo R2 0,0453 0,0398LR chi2 23,7(*) 20,82(*)Numărul de observații 816(*) semnifi cativ la 5%
Rezultatele nu sunt semnifi cativ diferite nici în cazul grupei de vârstă 19-50 de ani, chiar dacă eșantionul celor care doresc să revină este relativ mai mare decât în cazul grupei de vârstă 18-65 de ani. Observându-se aceiași tendință pentru persoanele care doresc să revină în România, aceștia având o vechime sufi cientă în Spania și totodată trimițând bani acasă, cel mai probabil în vederea investițiilor.
Concluzii
În Romania studiile cu privire la migrația de revenire sunt la început în mod special din cauza lipsei datelor consistente cu privire la această temă. Pentru a analiza situația generală a emigranților Români în Spania înainte de criza fi nanciară, am folosit baza de date a unui chestionar efectuat asupra imigranților din Spania furnizată de către Institutul de Statistică al Spaniei în 2007 - “Encuesta Nacional de Inmigrantes”(ENI). ENI a fost desfășurat în perioada noiembrie 2006 și februarie 2007 și oferă informații cu privire la aspect soci-demografi ce precum statusul marital, naționalitate, țara unde s-a născut, educație, dar și informații cu privire la planurile în următorii 5 ani, venit, ani petrecuți în Spania, sau dacă sunt sau nu angajați. Analizând rezultatele observăm că variabilele socio-demografi ce precum sexul și starea civilă a persoanelor intervievate nu au efect asupra deciziei de revenire, deși pentru variabila cu referire la genul persoanei era egal distribuită. De asemenea, am introdus în model și variabile de control cu privire la faptul dacă are părinții în România, dacă are orice fel de studii, fi e
Revista Română de Statistică - Supliment nr. 5 / 2015 29
acestea la nivel minim sau superior, și dacă a dobândit o locuință în Spania, niciuna dintre aceste variabile neavând un efect semnifi cativ asupra intenției de revenire a respondenților. Nesemnifi cativitatea coefi cienților modelului se datorează în mod special ponderii mici a persoanelor care au declarat că doresc să revină. Totodată analizând intenția de revenire din perspectiva persoanelor care au nivel mai ridicat al cunoștintelor limbii spaniole față de cele care au nivel slab de cunoștințe se observă că persoanele care cunosc foarte bine limba spaniolă nu au intenția să revină în România, lucru care era de așteptat având în vedere că acestea au depășit foarte ușor barajul lingvistic. Rezultatele nu sunt semnifi cativ diferite nici în cazul grupei de vârstă 19-50 de ani, chiar eșationul celor care doresc să revină este relativ mai mare decât în cazul grupei de vârstă 18-65 de ani. Intenția de revenire este un subiect de actualitate mai ales privind efectele crizei economice în țările dezvoltate. În România migrația este încă un subiect la început de drum, în mod special migrația de revenire, pentru care trebuie constituite baze de date de natură să surprindă efectele migrației și schimbârilor economice de-a lungul timpului.
Acknowledgment „Această lucrare a fost cofi nanţată din Fondul Social European, prin Programul Operaţional Sectorial Dezvoltarea Resurselor Umane 2007-2013, proiect numărul POSDRU/159/1.5/S/138907„Excelenţă în Cercetarea Ştiinţifi că, Interdisciplinară, Doctorală şi Postdoctorală, în Domeniile Economic, Social şi Medical - EXCELIS”, coordonator Academia de Studii Economice din Bucureşti”
Referințe
- Andrei, T., Bourbonnais, R., 2008. Econometrie. Ed Economică, Bucharest, pp. - Cassarino, Jean-Pierre, “Theorising Return Migration: The Conceptual Approach to
Return Migrants Revisited.” International Journal on Multicultural Societies, 6, no. 2 (2004), UNESCO, Paris, p. 253-279 available on: http://unesdoc.unesco.org/images/0013/001385/138592E.pdf#page=60
- Dustmann, C.; Weiss, Y. (2007): “Return Migration: Theory and Empirical Evidence from UK”, British Journal of Industrial Relations, vol. 45, n. 2, pp.236-256.
- Greene, William H., Marginal Effects in the Bivariate Probit Model (June 1996). NYU Working Paper No. EC-96-11. Available at SSRN: http://ssrn.com/abstract=1293106
- Herm, A, Recent migration trends: citizens of EU-27 Member States become ever more mobile while EU remains attractive to non-EU citizens (Eurostat, 2008).
- Hurd, M. D., Rohwedder, S.,”Effects of the Financial Crisis and Great Recession on American Households” NBER Working Paper No. 16407 September 2010 JEL No. D12,D31,D84,D91,J64 available on: http://www.nber.org/papers/w16407.pdf

Romanian Statistical Review - Supplement nr. 5 / 201530
- Iglicka (scientifi c advisor), Barcevičius, Repečkaitė, Žvalionytė Labour mobility within the EU: The impact of return migration, Public Policy and Management Institute (PPMI), (Lithuania, 2012)
- Lidgard, J., Gilson, C., ”Population Association of New Zealand Return Migration of New Zealanders: Shuttle and Circular Migrants” New Zealand Population Review 28(1), 99-128. 2002 available on: http://www.waikato.ac.nz/__data/assets/pdf_fi le/0010/76555/nzpr02-28-lidgard.pdf
- Sandu Dumitru, coordonator, ”Comunități românești în Spania”, Fundația Soros, Februarie 2009.
- Pecican, E. Ş., Econometrie pentru .. economiști. , Ed. Economică, (Bucharest, 2007).
- Predosanu, Zamfi r, Militaru, Mocanu, Vasile ”Econometric modeling of return migration intention”(2007) Available on: http://www.wseas.us/e-library/conferences/2011/Corfu/ASM/ASM-34.pdf
- Raúl Ramos, Alessia Matano, Remittances, education and return migration. Evidence for immigrants in Spain, WP3/11 SEARCH WORKING PAPERApril 2013. Available on: http://www.ub.edu/searchproject/wp-content/uploads/2013/05/WP_3.11.pdf
- Roman, M, Zizi, G, Return migration in an economic crisis context. A survey on Romanian healthcare professionals, Tome 39, Issue 2(48), Romanian Journal of Economics, 2014, p. 100-120
- Roman, M, Zizi, G, Romanian Immigrants Worldwide: What makes them Return Home? Journal of Identity and Migration Studies Volume 6, number 2, 2012 p.2-17
- Soon, A., ”Change of Heart? A bivariate Probit Model of International Students’ Change of Return Intention International Journal of Business and Economics”, 2010, Vol 9, No.2, pg115-129
- Ötker-Robe, I, Podpiera, A. M., ”The Social Impact of Financial Crises Evidence from the Global Financial Crisis” The World Bank Development Economics Offi ce of the Senior Vice President and Chief Economist November 2013 available on: http://www-wds.worldbank.org/external/default/WDSContentServer/IW3P/IB/2013/11/14/000158349_20131114113429/Rendered/PDF/WPS6703.pdf
- Vlase, I., ”Migrația de întoarcere a românilor din Italia. Studiu de caz în Vulturu, Vrancea” CALITATEA VIEŢII, XXII, nr. 2, 2011, p. 155–176

Revista Română de Statistică - Supliment nr. 5 / 2015 31
AN INVESTIGATION OF ROMANIANS’ RETURN INTENTIONS FROM SPAIN
Elena-Maria PRADA Bucharest Academy of Economic Studies
Abstract Migration is the phenomenon that has always been along humans, people searching for better places to live. Reasons of migration have been evolved along the greatest discoveries of man. Nowadays, the concept of migration is just different in terms of the factors which determinate it, but the basic reason of migration is welfare. We employed a Probit model to estimate which factors are determining Romanians to return from Spain using the Spanish Survey ”Encuesta Nacional de Inmigrantes” 2007. Our results showed that before the fi nancial crisis began the intentions to return were so noticeable, although if the person remits to the home country or has a suffi cient experience in Spain also they express their intentions to return, this confi rms the fact that migration was a temporary one and as the purpose of migration was fulfi lled the migrant intends to return. Keywords: returnee, migration, probit, logit, Romania. JEL Classifi cation codes: C01,C30, O15
Introduction
Migration is the phenomenon that has always been along the human being, people searching for better places to live. Reasons of migration have been evolved along the greatest discoveries of the human being. Nowadays, the concept of migration is just different in terms of the factors which determinate it, but the basic reason of migration is welfare. Return migration has been an important topic to discuss after the fi nancial crisis, mainly because the effects of the crisis as rising prices or loss of the job. While for emigration is shown that is driven by better conditions in the host countries (as the macroeconomic welfare factors are the main push factors), return migration requires information also at micro-level, as it is a decision of the individual depending of the socio-economical context. Many authors places the debut of fi nancial crisis at the end of 2007 when the house and stock prices began to decline and by the end of 2008 the unemployment rate raised to unpredictable levels (Hurd and Rohwedder, 2010) (Ötker-Robe and Podpiera, 2013).

Romanian Statistical Review - Supplement nr. 5 / 201532
In Romania the studies regarding return migrations are just scratching the surface of this topic mainly due to the lack of consistent data. In this context the paper explores the survey from Spain in 2007 - “Encuesta Nacional de Inmigrantes”, to determinate the return migration intentions of Romanian emigrants. We began by providing the literature review related to return migration topic. The paper is structured as it follows: fi rst we followed the research methodology by providing the usage of binary models in analysing the return intention, secondly we describe the variables employed in the analyse of return intentions based on the data provided by “Encuesta Nacional de Inmigrantes - 2007”( ENI - 2007). And last we concluded the results based on the marginal effect of the Probit models. Finally, we built two Probit models to determine the return migration intentions regarding Romanian migrants in Spain. The article analysis the return intentions of the Romanian migrants in Spain before fi nancial crisis and provides an overview of the return intentions, moreover, we must take into consideration that the survey was collected before fi nancial crisis also noticeable from the small sample of the those who intended to return.
Literature review
The literature on migration is very rich, many studies have been made regarding the determinants of migration, the aspects and the repercussions on the macro economical and micro economical levels of both sending and receiving countries. Return migration though has not been an issue to debate until the fi nancial crisis began. Given the main theories of migration the returnee may be a failure migrant that has not accomplished its goals or the migrant that has successfully fulfi lled their goals but is strongly linked to their home country, even though some of them are not returning permanently (Cassarino, 2004). Return migration is important from the perspective of both countries: the sending countries and the receiving countries. The main reason of returning is the economic failure of the migrant, early fi ndings show that if a migrant is unable to fi nd a reasonable job is more likely to return (DaVanzo, 1980). Also, migrants may be bound to their homeland, the decision of returning to their home in case of the New Zeelanders is based on their strong attachment to family, friends and old places (Gilson and Lidgard, 2002). The actual socio-economic context has been affected by the fi nancial recession started in 2007 and has an impact on developed countries and this fact could determine the return migration. According to the studies provided

Revista Română de Statistică - Supliment nr. 5 / 2015 33
by Eurostat in the EU Member States, the median age of those who return to their home country was over 30 years in 2008 (Herm, 2008). In Hungary half of the migrants returned in 2008 until 2010 were aged between 30 and 45 years and only 20% of those over 45 have returned. The same trend is observed in Romania for the Romanians returning from Spain, only 15% of those aged over 45 years are coming back to their homes (Iglicka et al, 2012). As Dustmann (et al., 2007) stated, migration takes different forms regarding the reasons of migration, return migration is a form of temporary migration due to economic motives. Using data from British labour Force Survey Migration showed that the returning decision is a cause of benefi t-cost ratio, as people choose to migrate and decide a permanent migration if the benefi t is higher than the cost of migration, on the other side the decision of returning may occur if the costs exceed the benefi ts, generating return migration. Also, they showed that the return migration is more highlighted for the EU, America’s and Australia’s migrants compared with the immigrants from Indian Sub-Continent and Africa, and comparing white migrants with non-white migrants the results show that white migrants tend to return. Newer studies referred to Romanian migrants have used the “Encuesta Nacional de Inmigrantes - 2007”, Sandu (et. al., 2009) has conducted a survey in 2008 to establish if there are any differences from year 2007 regarding the return intentions of Romanian migrants in Spain. The results showed that Romanian were concerned about their jobs and stability, due to the consequences of fi nancial crisis, and almost half from Romanian in Madrid declared that they intend to return. Vlase (2011) showed that Romanians, community based Vulturu, intend to return from Italy if they remit to their homes. In case of Romanian migrants has been proven regarding the medical staff that the gender and the age are no feature that will make them return, logistic regression results showed that the number of children has statistical signifi cance, and as the migrants has at least one child the return intention increase. Also, if the experience as a migrant increases, the return intention increases towards. As well, if the migrants remit to their home country they intend to return, and the wages of the migrant have a negative impact on return intention, as the income increases the return intention decreases (Roman and Zizi, 2012) (Roman and Zizi, 2014).
Research methodology
Advanced econometric models most common on the analysis of opinion surveys are those models in which the dependent variable takes discrete values.
Romanian Statistical Review - Supplement nr. 5 / 201534
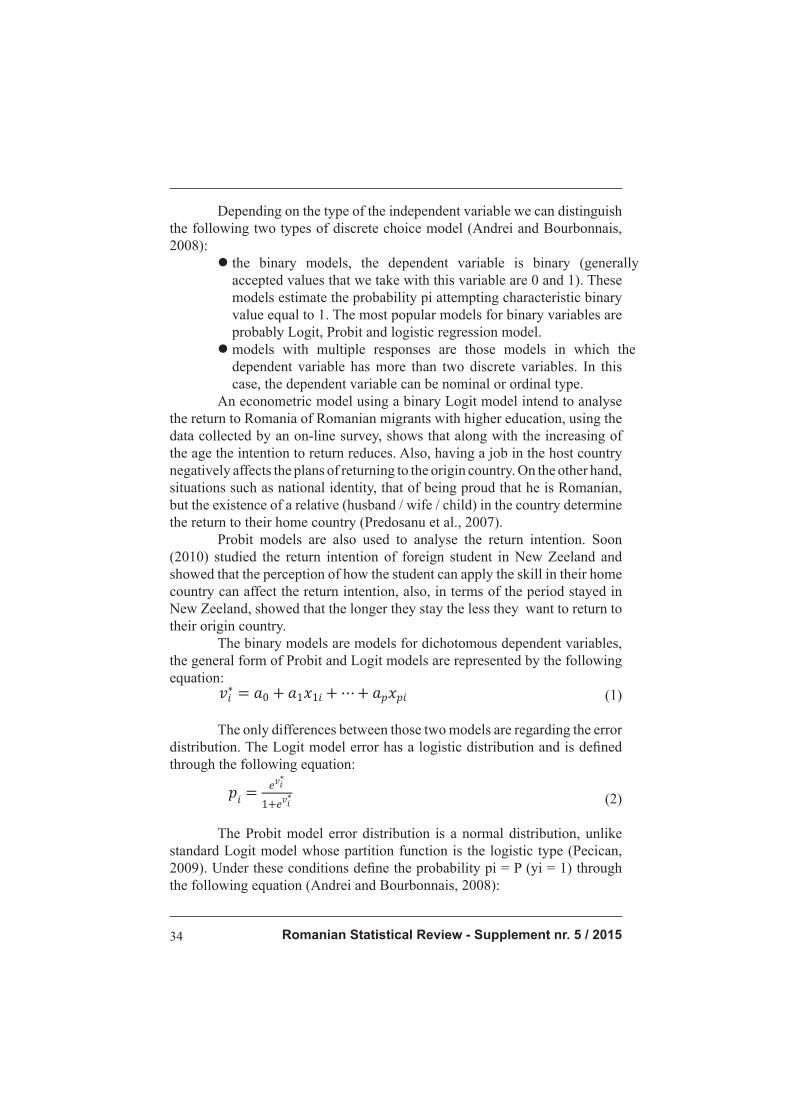
Depending on the type of the independent variable we can distinguish the following two types of discrete choice model (Andrei and Bourbonnais, 2008): the binary models, the dependent variable is binary (generally
accepted values that we take with this variable are 0 and 1). These models estimate the probability pi attempting characteristic binary value equal to 1. The most popular models for binary variables are probably Logit, Probit and logistic regression model.
models with multiple responses are those models in which the dependent variable has more than two discrete variables. In this case, the dependent variable can be nominal or ordinal type.
An econometric model using a binary Logit model intend to analyse the return to Romania of Romanian migrants with higher education, using the data collected by an on-line survey, shows that along with the increasing of the age the intention to return reduces. Also, having a job in the host country negatively affects the plans of returning to the origin country. On the other hand, situations such as national identity, that of being proud that he is Romanian, but the existence of a relative (husband / wife / child) in the country determine the return to their home country (Predosanu et al., 2007). Probit models are also used to analyse the return intention. Soon (2010) studied the return intention of foreign student in New Zeeland and showed that the perception of how the student can apply the skill in their home country can affect the return intention, also, in terms of the period stayed in New Zeeland, showed that the longer they stay the less they want to return to their origin country. The binary models are models for dichotomous dependent variables, the general form of Probit and Logit models are represented by the following equation: (1)
The only differences between those two models are regarding the error distribution. The Logit model error has a logistic distribution and is defi ned through the following equation:
(2)
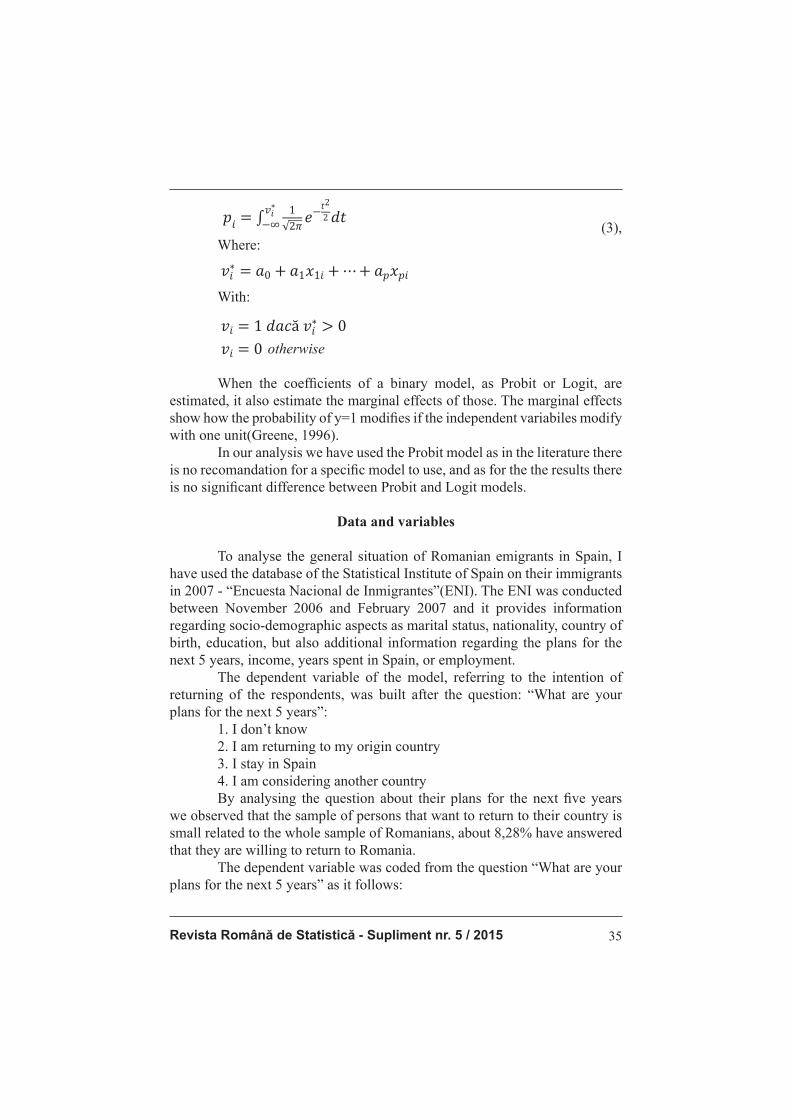
The Probit model error distribution is a normal distribution, unlike standard Logit model whose partition function is the logistic type (Pecican, 2009). Under these conditions defi ne the probability pi = P (yi = 1) through the following equation (Andrei and Bourbonnais, 2008):
Revista Română de Statistică - Supliment nr. 5 / 2015 35
(3),
Where:
With:
otherwise
When the coeffi cients of a binary model, as Probit or Logit, are estimated, it also estimate the marginal effects of those. The marginal effects show how the probability of y=1 modifi es if the independent variabiles modify with one unit(Greene, 1996). In our analysis we have used the Probit model as in the literature there is no recomandation for a specifi c model to use, and as for the the results there is no signifi cant difference between Probit and Logit models.
Data and variables
To analyse the general situation of Romanian emigrants in Spain, I have used the database of the Statistical Institute of Spain on their immigrants in 2007 - “Encuesta Nacional de Inmigrantes”(ENI). The ENI was conducted between November 2006 and February 2007 and it provides information regarding socio-demographic aspects as marital status, nationality, country of birth, education, but also additional information regarding the plans for the next 5 years, income, years spent in Spain, or employment. The dependent variable of the model, referring to the intention of returning of the respondents, was built after the question: “What are your plans for the next 5 years”: 1. I don’t know 2. I am returning to my origin country 3. I stay in Spain 4. I am considering another country By analysing the question about their plans for the next fi ve years we observed that the sample of persons that want to return to their country is small related to the whole sample of Romanians, about 8,28% have answered that they are willing to return to Romania. The dependent variable was coded from the question “What are your plans for the next 5 years” as it follows:
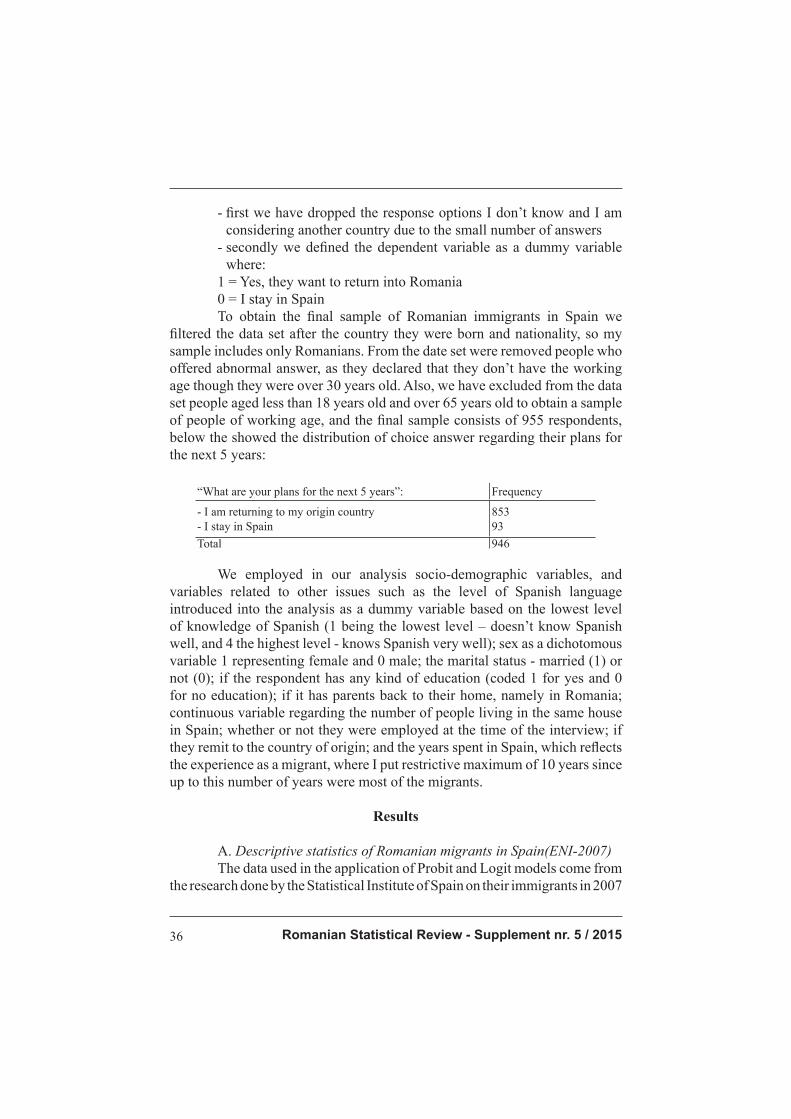
Romanian Statistical Review - Supplement nr. 5 / 201536
- fi rst we have dropped the response options I don’t know and I am considering another country due to the small number of answers
- secondly we defi ned the dependent variable as a dummy variable where:
1 = Yes, they want to return into Romania 0 = I stay in Spain To obtain the fi nal sample of Romanian immigrants in Spain we fi ltered the data set after the country they were born and nationality, so my sample includes only Romanians. From the date set were removed people who offered abnormal answer, as they declared that they don’t have the working age though they were over 30 years old. Also, we have excluded from the data set people aged less than 18 years old and over 65 years old to obtain a sample of people of working age, and the fi nal sample consists of 955 respondents, below the showed the distribution of choice answer regarding their plans for the next 5 years:
“What are your plans for the next 5 years”: Frequency
- I am returning to my origin country- I stay in Spain
85393
Total 946
We employed in our analysis socio-demographic variables, and variables related to other issues such as the level of Spanish language introduced into the analysis as a dummy variable based on the lowest level of knowledge of Spanish (1 being the lowest level – doesn’t know Spanish well, and 4 the highest level - knows Spanish very well); sex as a dichotomous variable 1 representing female and 0 male; the marital status - married (1) or not (0); if the respondent has any kind of education (coded 1 for yes and 0 for no education); if it has parents back to their home, namely in Romania; continuous variable regarding the number of people living in the same house in Spain; whether or not they were employed at the time of the interview; if they remit to the country of origin; and the years spent in Spain, which refl ects the experience as a migrant, where I put restrictive maximum of 10 years since up to this number of years were most of the migrants.
Results
A. Descriptive statistics of Romanian migrants in Spain(ENI-2007) The data used in the application of Probit and Logit models come from the research done by the Statistical Institute of Spain on their immigrants in 2007
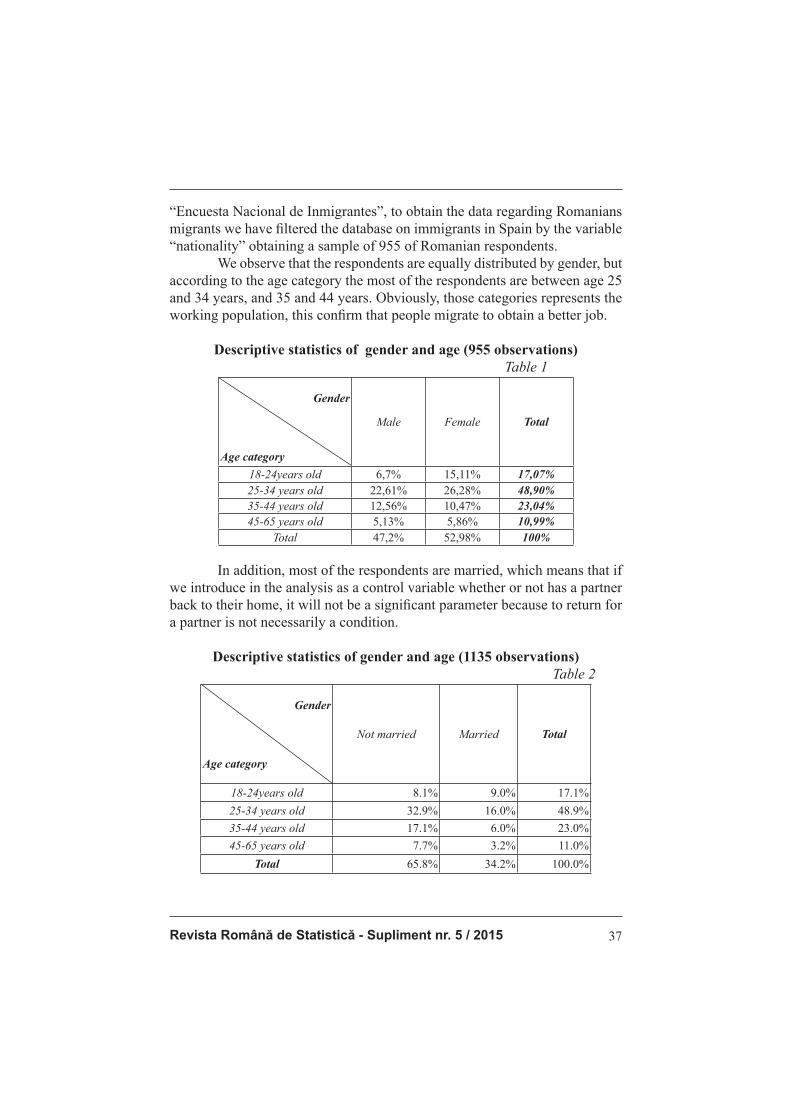
Revista Română de Statistică - Supliment nr. 5 / 2015 37
“Encuesta Nacional de Inmigrantes”, to obtain the data regarding Romanians migrants we have fi ltered the database on immigrants in Spain by the variable “nationality” obtaining a sample of 955 of Romanian respondents. We observe that the respondents are equally distributed by gender, but according to the age category the most of the respondents are between age 25 and 34 years, and 35 and 44 years. Obviously, those categories represents the working population, this confi rm that people migrate to obtain a better job.
Descriptive statistics of gender and age (955 observations) Table 1
Gender
Age category
Male Female Total
18-24years old 6,7% 15,11% 17,07%25-34 years old 22,61% 26,28% 48,90%35-44 years old 12,56% 10,47% 23,04%45-65 years old 5,13% 5,86% 10,99%
Total 47,2% 52,98% 100%
In addition, most of the respondents are married, which means that if we introduce in the analysis as a control variable whether or not has a partner back to their home, it will not be a signifi cant parameter because to return for a partner is not necessarily a condition.
Descriptive statistics of gender and age (1135 observations) Table 2
Gender
Age category
Not married Married Total
18-24years old 8.1% 9.0% 17.1%25-34 years old 32.9% 16.0% 48.9%35-44 years old 17.1% 6.0% 23.0%45-65 years old 7.7% 3.2% 11.0%
Total 65.8% 34.2% 100.0%
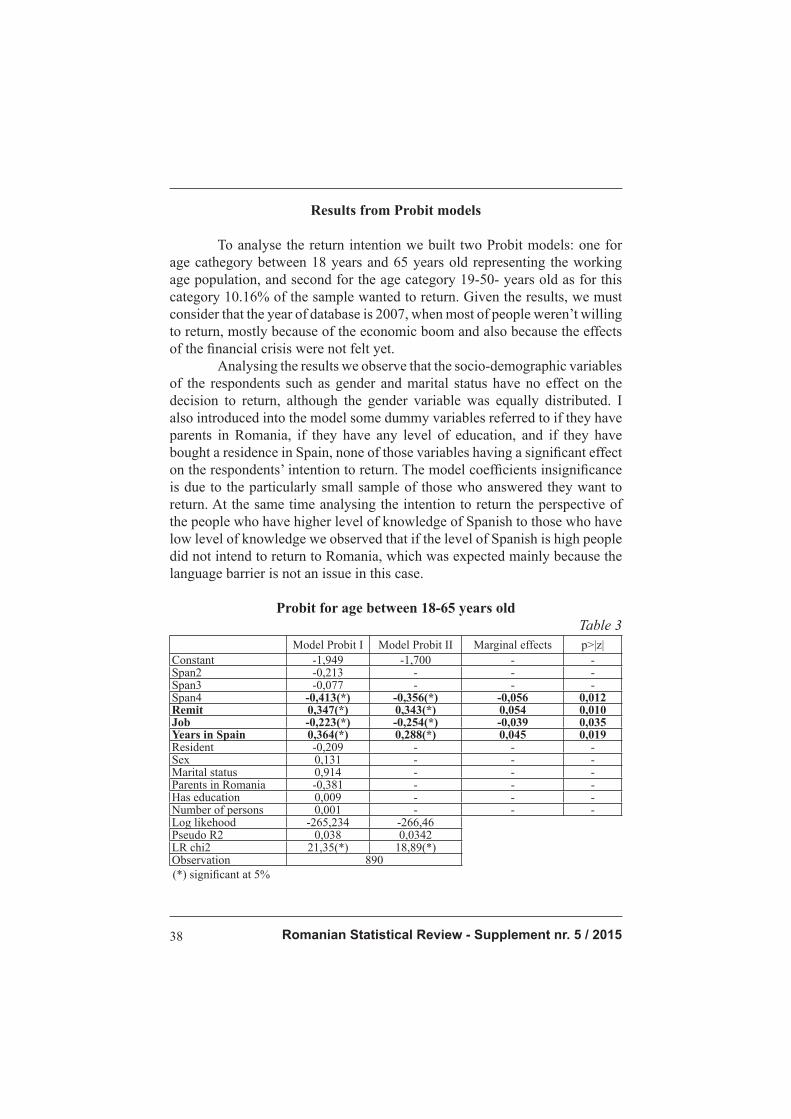
Romanian Statistical Review - Supplement nr. 5 / 201538
Results from Probit models
To analyse the return intention we built two Probit models: one for age cathegory between 18 years and 65 years old representing the working age population, and second for the age category 19-50- years old as for this category 10.16% of the sample wanted to return. Given the results, we must consider that the year of database is 2007, when most of people weren’t willing to return, mostly because of the economic boom and also because the effects of the fi nancial crisis were not felt yet. Analysing the results we observe that the socio-demographic variables of the respondents such as gender and marital status have no effect on the decision to return, although the gender variable was equally distributed. I also introduced into the model some dummy variables referred to if they have parents in Romania, if they have any level of education, and if they have bought a residence in Spain, none of those variables having a signifi cant effect on the respondents’ intention to return. The model coeffi cients insignifi cance is due to the particularly small sample of those who answered they want to return. At the same time analysing the intention to return the perspective of the people who have higher level of knowledge of Spanish to those who have low level of knowledge we observed that if the level of Spanish is high people did not intend to return to Romania, which was expected mainly because the language barrier is not an issue in this case.
Probit for age between 18-65 years oldTable 3
Model Probit I Model Probit II Marginal effects p>|z|Constant -1,949 -1,700 - -Span2 -0,213 - - -Span3 -0,077 - - -Span4 -0,413(*) -0,356(*) -0,056 0,012Remit 0,347(*) 0,343(*) 0,054 0,010Job -0,223(*) -0,254(*) -0,039 0,035Years in Spain 0,364(*) 0,288(*) 0,045 0,019Resident -0,209 - - -Sex 0,131 - - -Marital status 0,914 - - -Parents in Romania -0,381 - - -Has education 0,009 - - -Number of persons 0,001 - - -Log likehood -265,234 -266,46Pseudo R2 0,038 0,0342LR chi2 21,35(*) 18,89(*)Observation 890 (*) signifi cant at 5%
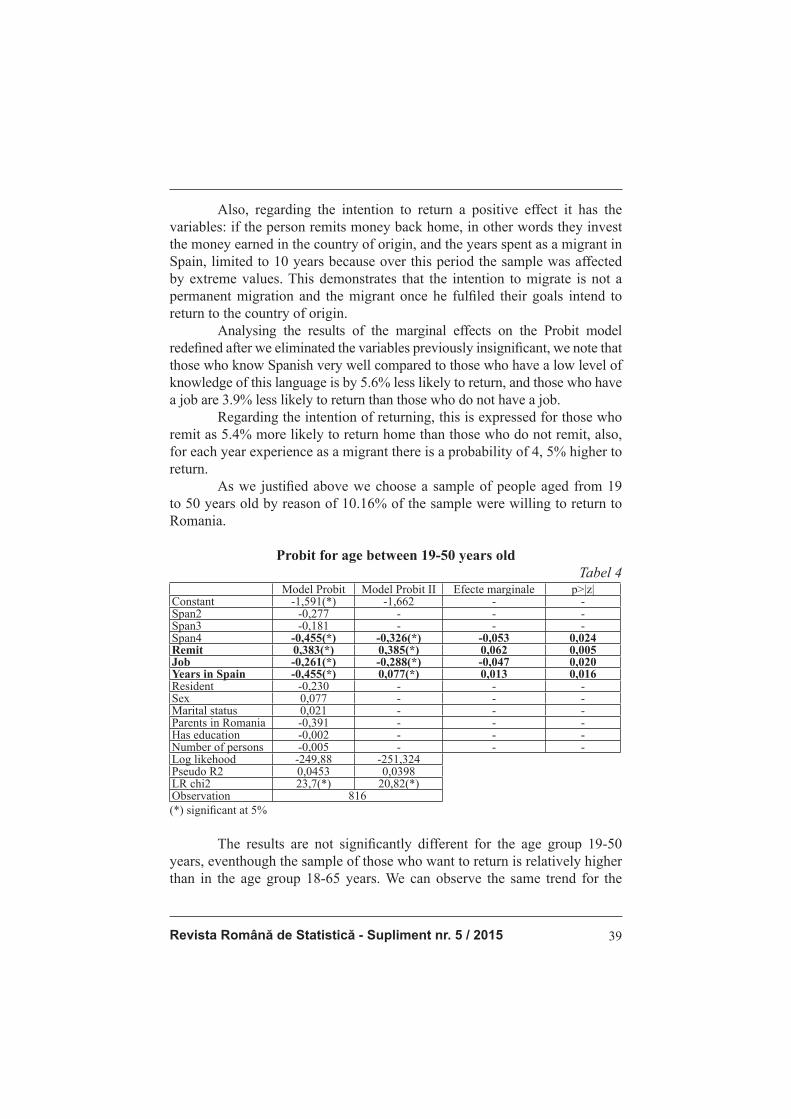
Revista Română de Statistică - Supliment nr. 5 / 2015 39
Also, regarding the intention to return a positive effect it has the variables: if the person remits money back home, in other words they invest the money earned in the country of origin, and the years spent as a migrant in Spain, limited to 10 years because over this period the sample was affected by extreme values. This demonstrates that the intention to migrate is not a permanent migration and the migrant once he fulfi led their goals intend to return to the country of origin. Analysing the results of the marginal effects on the Probit model redefi ned after we eliminated the variables previously insignifi cant, we note that those who know Spanish very well compared to those who have a low level of knowledge of this language is by 5.6% less likely to return, and those who have a job are 3.9% less likely to return than those who do not have a job. Regarding the intention of returning, this is expressed for those who remit as 5.4% more likely to return home than those who do not remit, also, for each year experience as a migrant there is a probability of 4, 5% higher to return. As we justifi ed above we choose a sample of people aged from 19 to 50 years old by reason of 10.16% of the sample were willing to return to Romania.
Probit for age between 19-50 years oldTabel 4
Model Probit Model Probit II Efecte marginale p>|z|Constant -1,591(*) -1,662 - -Span2 -0,277 - - -Span3 -0,181 - - -Span4 -0,455(*) -0,326(*) -0,053 0,024Remit 0,383(*) 0,385(*) 0,062 0,005Job -0,261(*) -0,288(*) -0,047 0,020Years in Spain -0,455(*) 0,077(*) 0,013 0,016Resident -0,230 - - -Sex 0,077 - - -Marital status 0,021 - - -Parents in Romania -0,391 - - -Has education -0,002 - - -Number of persons -0,005 - - -Log likehood -249,88 -251,324Pseudo R2 0,0453 0,0398LR chi2 23,7(*) 20,82(*)Observation 816(*) signifi cant at 5%
The results are not signifi cantly different for the age group 19-50 years, eventhough the sample of those who want to return is relatively higher than in the age group 18-65 years. We can observe the same trend for the
Romanian Statistical Review - Supplement nr. 5 / 201540
people who want to return to Romania, if they have suffi cient years spent in Spain and they are also sending money back home, they are most likely to to return back home.
Conclusions
In Romania the studies regarding return migrations are just scratching the surface of this topic mainly due to the lack of consistent data. In this context the paper explores the survey from Spain in 2007 - “Encuesta Nacional de Inmigrantes”, to determinate the return migration intentions of Romanian emigrants. To analyse the general situation of Romanian emigrants in Spain, I have used the database of the Statistical Institute of Spain on their immigrants in 2007 - “Encuesta Nacional de Inmigrantes”(ENI). The ENI was conducted between November 2006 and February 2007 and it provides information regarding socio-demographic aspects as marital status, nationality, country of birth, education, but also additional information regarding the plans for the next 5 years, income, years spent in Spain, or employment. Analysing the results we observe that the socio-demographic variables of the respondents such as gender and marital status have no effect on the decision to return, although the gender variable was equally distributed. I also introduced into the model some dummy variables referred to if they have parents in Romania, if they have any level of education, and if they have bought a residence in Spain, none of those variables having a signifi cant effect on the respondents’ intention to return. The model coeffi cients insignifi cance is due to the particularly small sample of those who answered they want to return. At the same time analysing the intention to return the perspective of the people who have higher level of knowledge of Spanish to those who have low level of knowledge we observed that if the level of Spanish is high people did not intend to return to Romania, which was expected mainly because the language barrier is not an issue in this case. The results are not signifi cantly different for the age group 19-50 years, even though the sample of those who want to return is relatively higher than in the age group 18-65 years. The intention to return is an important issue especially regarding the context of fi nancial crisis in developed countries. In Romania migration is still a subject to debate, especially regarding the return migration which needs reliable databases to capture the effects of migration and economic changes over time.
Revista Română de Statistică - Supliment nr. 5 / 2015 41
Acknowledgment
„This paper was co-fi nanced from the European Social Fund, through the Sectorial Operational Programme Human Resources Development 2007-2013, project number POSDRU/159/1.5/S/138907 “Excellence in scientifi c interdisciplinary research, doctoral and postdoctoral, in the economic, social and medical fi elds -EXCELIS”, coordinator The Bucharest University of Economic Studies”.
References
- Andrei, T., Bourbonnais, R., 2008. Econometrie. Ed Economică, Bucharest, pp. - Cassarino, Jean-Pierre, “Theorising Return Migration: The Conceptual Approach
to Return Migrants Revisited.” International Journal on Multicultural Societies, 6, no. 2 (2004), UNESCO, Paris, p. 253-279 available on: http://unesdoc.unesco.org/images/0013/001385/138592E.pdf#page=60
- Dustmann, C.; Weiss, Y. (2007): “Return Migration: Theory and Empirical Evidence from UK”, British Journal of Industrial Relations, vol. 45, n. 2, pp.236-256.
- Greene, William H., Marginal Effects in the Bivariate Probit Model (June 1996). NYU Working Paper No. EC-96-11. Available at SSRN: http://ssrn.com/abstract=1293106
- Herm, A, Recent migration trends: citizens of EU-27 Member States become ever more mobile while EU remains attractive to non-EU citizens (Eurostat, 2008).
- Hurd, M. D., Rohwedder, S.,”Effects of the Financial Crisis and Great Recession on American Households” NBER Working Paper No. 16407 September 2010 JEL No. D12,D31,D84,D91,J64 available on: http://www.nber.org/papers/w16407.pdf
- Iglicka (scientifi c advisor), Barcevičius, Repečkaitė, Žvalionytė Labour mobility within the EU: The impact of return migration, Public Policy and Management Institute (PPMI), (Lithuania, 2012)
- Lidgard, J., Gilson, C., ”Population Association of New Zealand Return Migration of New Zealanders: Shuttle and Circular Migrants” New Zealand Population Review 28(1), 99-128. 2002 available on: http://www.waikato.ac.nz/__data/assets/pdf_fi le/0010/76555/nzpr02-28-lidgard.pdf
- Sandu Dumitru, coordonator, ”Comunități românești în Spania”, Fundația Soros, Februarie 2009.
- Pecican, E. Ş., Econometrie pentru .. economiști. , Ed. Economică, (Bucharest, 2007). - Predosanu, Zamfi r, Militaru, Mocanu, Vasile ”Econometric modeling of return
migration intention”(2007) Available on: http://www.wseas.us/e-library/conferences/2011/Corfu/ASM/ASM-34.pdf
- Raúl Ramos, Alessia Matano, Remittances, education and return migration. Evidence for immigrants in Spain, WP3/11 SEARCH WORKING PAPERApril 2013. Available on: http://www.ub.edu/searchproject/wp-content/uploads/2013/05/WP_3.11.pdf
- Roman, M, Zizi, G, Return migration in an economic crisis context. A survey on Romanian healthcare professionals, Tome 39, Issue 2(48), Romanian Journal of Economics, 2014, p. 100-120

Romanian Statistical Review - Supplement nr. 5 / 201542
- Roman, M, Zizi, G, Romanian Immigrants Worldwide: What makes them Return Home? Journal of Identity and Migration Studies Volume 6, number 2, 2012 p.2-17
- Soon, A., ”Change of Heart? A bivariate Probit Model of International Students’ Change of Return Intention International Journal of Business and Economics”, 2010, Vol 9, No.2, pg115-129
- Ötker-Robe, I, Podpiera, A. M., ”The Social Impact of Financial Crises Evidence from the Global Financial Crisis” The World Bank Development Economics Offi ce of the Senior Vice President and Chief Economist November 2013 available on: http://www-wds.worldbank.org/external/default/WDSContentServer/IW3P/IB/2013/11/14/000158349_20131114113429/Rendered/PDF/WPS6703.pdf
- Vlase, I., ”Migrația de întoarcere a românilor din Italia. Studiu de caz în Vulturu, Vrancea” CALITATEA VIEŢII, XXII, nr. 2, 2011, p. 155–176
Revista Română de Statistică - Supliment nr. 5 / 2015 43
Studiu comparativ de convergenţă regională NUTS3 pe ţări din UE
Drd. Natalia DUMITRESCU (MOROIANU)Academia de Studii Economice, Bucureşti
e-mail: [email protected]
Abstract
În contextul interesului major al UE pentru convergenţa regională ca obiectiv al politicii sale de coeziune, cât şi al dezbaterilor teoretice şi al cercetărilor ştiinţifi ce aplicative, am realizat o analiză succintă a evoluţiei economice a câtorva state membre, considerate ca reprezentative pentru stadiul şi rolul jucat în dezvoltarea economică a Uniunii, respectiv Franța, Germania și Grecia, în scopul identifi cării tipului de convergență, precum și a impactului economic al unor evenimente majore, preum lărgirea UE. In studiul de față am utilizat versiunea modelului neoclasic de creştere elaborat de Barro şi Sala-i-Martin, care defi neşte conceptele de β-convergenţă şi σ-convergenţă, model pe care l-am aplicat pe valorile PIB pe locuitor măsurate în perioada 2000-2011 la nivelul unităților teritoriale NUTS3 din cele trei state UE, datele statistice fi ind preluate din baza de date EUROSTAT. Cuvinte cheie: β-convergenţă, σ-convergeţă, PIB pe locuitor, nivel NUTS3, convergenţă/divergenţă inter-regională
Introducere
Convergenţa regională face parte dintre obiectivele fundamentale urmărite de Politica de Coeziune a UE care, prin intermediul asistenţei acordate din Fondurile Structurale, stă la baza întocmirii unei strategii economice efi ciente de susţinere a ţărilor şi regiunilor dezavantajate. Astfel, un grad ridicat de convergenţă conduce la un nivel mai scăzut de susţinere pentru atenuarea diferenţelor economice, în timp ce un grad scăzut de convergenţă conduce la justifi carea unor costuri ridicate de susţinere. Scopuri declarate şi determinante de la începuturile înfi inţării Uniunii, realizarea unei pieţe unice, echilibrate şi prospere şi reducerea decalajelor au provocat dezbateri aprinse şi continue privind conceptele ce trebuie luate în consideraţie atunci când ai în perspectivă o astfel de realizare grandioasă. Mai mult, evoluţiile politice şi economice care au urmat, cum a fost aderarea economiilor închise din Europa Centrală și de Est (Artelaris, P., Kalioras, D., Petrakos, G., 2010), densitatea şi
Romanian Statistical Review - Supplement nr. 5 / 201544
diversitatea culturală, socială şi economică, caracteristice acestui continent au conferit o complexitate sporită realizării acestui deziderat. Pe plan internațional există o literatură de specialitate foarte bogată privind modelele de convergenţă regională, tratate atât sub aspect teoretic, cât şi din punctul de vedere al corectitudinii aprecierii cantitative a fenomenului economic, dar cercetările sunt departe de a se apropia de o soluţie categoric valabilă. Oricum, în acest moment sunt identifi cate, formulate şi măsurabile două aspecte ale acestui proces complex: β-convergenţa şi σ-convergenţa. Convergenţa regională este procesul prin care diferite nivele de dezvoltare regională tind să se apropie, în mod natural sau controlat, fapt care face posibilă şi reală reducerea în timp a disparităţilor între regiuni. Deşi controversată pentru incapacitatea de a surprinde toate aspectele ce produc şi infl uenţează acest proces, unitatea de măsură PIB/locuitor, odată convenită la nivel european, a devenit măsura efi cienței politicii de coeziune a UE. Unul dintre scopurile acestei lucrări este identifi carea unui posibil impact al lărgirii UE asupra dezvoltării regionale în spaţiul economic european, prin prisma teoriei de convergenţă/divergenţă regională şi utilizând datele econometrice ofi ciale publicate. Folosind mijloace şi tehnici de lucru adecvate, specifi ce modelului ales şi econometriei, am urmărit depistarea refl ectării evenimentelor istorice majore asupra evoluţiei economiilor alese ca reprezentative pentru ţările din spaţiul UE. Pentru aceasta, ne-am propus să identifi căm în evoluţia celor trei state membre UE alese prezența unui interval de convergenţă între regiunile NUTS3, în limitele date de organizarea lor teritorială la nivelul macroregiunii NUTS1 din care fac parte. Evidențierea unor aspecte ale corelaţiei dintre cele două mărimi statistice de convergenţă, anume β şi σ, a reprezentat de asemenea un obiectiv al studiului. În lucrare este cuprinsă o perioadă scurtă, dar crucială pentru formarea UE27, care acoperă primul deceniu al secolului XXI, respectiv perioada 2000-2011, perioadă pentru care există date statistice publicate. Lucrarea este structurată pe cinci capitole. Următorul capitol defi neşte contextul teoretic din care am ales modelul, precum şi formulele cantitative pe care le-am utilizat în valorifi carea bazei de date prezentată în capitolul 3. Descrierea prelucrării matematice statistice şi interpretarea rezultatelor obţinute sunt cuprinse în capitolul 4 urmat, în încheiere, de concluziile lucrării prezentate în capitolul 5 .
Revista Română de Statistică - Supliment nr. 5 / 2015 45
Convergenţa Beta şi Sigma
Conceptul de β-convergenţă – care reprezintă procesul de dezvoltare mai rapidă a regiunilor sărace în raport cu cele bogate – a fost introdus de Solow (1956), reprezentant al şcolii de gândire neo-clasică, şi se bazează pe fenomenul economic cunoscut al diminuării profi tului pe măsura desfăşurării producţiei. Astfel, procesul de dezvoltare al unei economii tinde în timp către un palier de echilibru, numit de cercetători „steady state”, care este rezultatul reducerii treptate a ratei de creştere, pe măsură ce economia se apropie de nivelul ei de stabilitate. Aceasta presupune că ţările (regiunile) sărace, afl ate în stadii incipiente de dezvoltare, au o viteză de creştere mai mare decât cele bogate şi, prin urmare, pot recupera pe termen lung decalajele faţă de economiile avansate. Atunci când regiunile tind spre același palier vorbim despre β-convergența absolută, spre deosebire de β-convergența condițională care se manifestă între regiuni ce tind, pe termen lung, spre paliere diferite, datorită mecanismelor specifi ce fi ecăreia. Pentru o aceeaşi economie, acest palier se poate modifi ca dacă, pe parcurs, intervine progresul tehnologic sau mărirea forţei de muncă. Studiile realizate de Barro şi Sala-i-Martin (1992), apoi Mankiw (1992) au declanşat dezbateri profunde teoretice şi mai ales abordări de determinare cantitativă a procesului de divergenţă/ convergenţă, în scopul defi nirii acestui concept cât mai aproape de realităţile dinamicii economice. Analizele realizate de cercetătorii în domeniu continuă să evidenţieze noi faţete ale procesului de convergenţă, având în vedere infl uenţele de vecinătate între regiuni, evidențiate de analizele spaţiale, analizele panel (Eckey, Turck 2006, Dunford 2009). În consens general, β-convergenţa se măsoară pe baza mărimii PIB/locuitor, dar există şi alte abordări acceptate, cum ar fi PIB/forţa de muncă sau venitul/locuitor. Metoda de calcul pentru β-convergență utilizată în acest studiu este dependența liniară exprimată sub forma:
unde γ reprezintă creșterea economică a regiunii i, în intervalul temporar de T ani, de la momentul t (anul 2000), la momentul t+T (anul 2011, cu T=12 ani), β reprezintă panta (de valoare pozitivă în cazul convergenței), iar ultimul termen reprezintă eroarea. Conceptul de σ-convergenţă evaluează procesul de reducere a disparităţilor economice regionale în timp, reprezentând o descriere a distribuţiei venitului între economii (Young, Matthew, Higgins 2008). Deşi poate părea că este strâns legat de β-convergenţă, de fapt aceasta din urmă creează doar condiţia necesară, dar nu şi sufi cientă ca σ-convergenţa să existe.
Romanian Statistical Review - Supplement nr. 5 / 201546
Relaţia complexă dintre β-convergenţă şi σ-convergenţă este demonstrată şi prin rezultatele obţinute în această lucrare, după cum se poate vedea din datele numerice prezentate în Tabelele din capitolul 4. Convergenţa σ este relevată de dependența temporală a deviaţiei standard sau a coefi cientului de variaţie al PIB/loc regional:
sau
= /μ Deşi domeniul teoretic şi modalităţile de apreciere cantitativă s-au extins şi specializat, toate se raportează încă, într-un grad mai mare sau mai mic, la modelul neoclasic al lui Barro şi Sala-i-Martin, ale cărui principii sunt descrise mai sus. De aceea, în acest studiu ne-am propus să analizăm evoluţia convergenţei regionale β şi σ a dezvoltării economice a trei dintre ţările membre UE pe baza acestui model.
Baza de date
Seriile de date au fost preluate din baza de date oferită de UE pe EUROSTAT şi se referă la valorile PIB/locuitor la nivelul unităţii teritoriale europene NUTS3. Astfel, studiul benefi ciază de date extrase şi prelucrate după aceleaşi standarde statistice europene, în aceeaşi monedă europeană, €, cu date pe cele trei nivele de unităţi teritoriale europene NUTS1, NUTS2 şi NUTS3, stabilite după numărul de locuitori pe care îl cuprind. Criteriul de alegere a perioadei 2000-2011 a fost, pentru anul 2000, ca datele statistice să fi e disponibile pentru toate ţările membre la nivel NUTS3, pentru a avea libertatea de extindere geografi că a cercetării şi pentru a compara datele şi rezultatele obţinute, limitată fi ind doar de anul cu cele mai recente date statistice stabile, adică 2011. Astfel, seriile de date se referă la perioada 2000-2011, ca fi ind cel mai bine acoperită. Datele au fost organizate şi prelucrate numeric cu programele Excel şi eViews.

Revista Română de Statistică - Supliment nr. 5 / 2015 47
Rezultatele analizei statistice empirice
Am ales, dintre mai multe ţări membre studiate, trei ţări reprezentative pentru UE: - Franţa şi Germania sunt două dintre statele fondatoare ale UE alături de Belgia, Luxemburg şi Olanda; sunt două țări ale căror economii, ca forţă şi stabilitate, reprezintă repere în cadrul UE; - Grecia, care a aderat la Uniune în 1981, având statutul de ţară susţinută economic și care, alături de Portugalia, reprezintă prima experienţă de subvenţionare din partea UE a unui stat membru. Pentru evaluarea β-convergenţei am utilizat ecuaţia de creştere a lui Sala-i-Martin (1996). Pe baza datelor EUROSTAT pentru fi ecare unitate teritorială NUTS3, am calculat ln(PIB/locuitor) (ln y) pentru anii 2000 şi 2011. Valoarea creşterii (gamma) pentru o unitate NUTS3 este reprezentată de media logaritmilor raportului y_2011/y_2000, calculată pe intervalul de 12 ani pe care au fost publicate datele. Regresia liniară a fost aplicată cu variabila independentă ln y _2000 şi variabila dependentă gamma, pentru fi ecare unitate teritorială NUTS3. Pentru σ-convergenţa, utilizând ecuaţia consacrată de Barro (1992), pentru fi ecare an al intervalului temporar 2000 – 2011, am calculat suma pătratelor diferenţelor dintre valoarea logaritmului PIB/loc (notat y) corespunzător fi ecărei unități teritoriale NUTS3 şi apoi media logaritmilor PIB/loc al tuturor unităților NUTS3 care aparţin aceleiaşi unități NUTS1. Valoarea pătratului abaterii medii statisitce, σ-standard, care se numeşte dispersie sau deviaţie standard, este dată de raportul dintre sumă şi numărul de ani luaţi în consideraţie.
Franţa Am cercetat convergenţa-β pe unitățile teritoriale NUTS3 corespunzătoare celor 98 de departamente din 8 unități NUTS1 ale Franţei (ulterior, regiunea Île de France am exclus-o din calcul deoarece am considerat că nu este reprezentativă economic pentru convergenţă, având valorile PIB puternic discrepante în raport cu valorile celorlalte unitățile NUTS3 – fapt care conduce în mod evident la divergenţă). Astfel, am prelucrat 1164 de date reprezentând valorile PIB pe locuitor la nivelul unităților teritoriale NUTS3 pentru intervalul de 12 ani, respectiv 2000-2011. Aceste valori au fost preluate din baza de date EUROSTAT publicată de UE pentru statele membre și alcătuită pe baza raportărilor instituţiilor de statistică naţionale respective. Rezultatele calculelor sunt sintetic prezentate în Tabelul 1. Se observă că valorile PIB pe locuitor variază în perioada 2000-2011 între maxima de

Romanian Statistical Review - Supplement nr. 5 / 201548
39000 €/locuitor în unitatea teritorială NUTS3-Rhône din macroregiunea NUTS1-Centre-Est şi minima de 15900 €/locuitor în unitatea teritorială NUTS3-Haute-Corse din macroregiunea NUTS1-Méditerranée. Din același Tabel 1 se observă că valorile σ au fost calculate pe două subperioade din cadrul perioadei studiate pentru evidenţierea unor tendinţe clare, cu excepția regiunii NUTS1-Ouest. Pe regiunea NUTS1-Sud-Ouest este de remarcat prezența unei convergenţe -σ statistic semnifi cative pe ambele subintervale în contextul unei evidente divergențe-β. Regiunile NUTS1 de pe coasta Atlanticului (în vestul Franţei) prezintă o β-divergenţă slabă, concomitent cu o σ-convergenţă destul de semnifi cativă statistic, mai ales pentru unitatea teritorială NUTS1-Sud-Ouest (Tabelul 1).
Valori convergenţă β şi σ pentru Franţa 2000-2011Tabelul 1
FRANŢA (NUTS1) β σ
Bassin Parisien -0,00551452000-2003 2004-2011-0,0027783 -0,0008594
Nord – Pas-de-Calais -0,0029157
2000-2006 2009-2011-0,0023838 -0,00025628
Ouest 0,00977772000-2003 2004-2007 2009-20110,0017515 -0,000707 -0,000111
Sud-Ouest 0,007481652000-2005 2007-20110,0030829 -0,00092103
Centre-Est -0,00040642000-2005 2007-2011
-0,00101015 -0,00129019
Méditerranée 0,00673972000-2006 2007-2011-0,0001569 0,0013798
(Sursa: Autor, 2015)
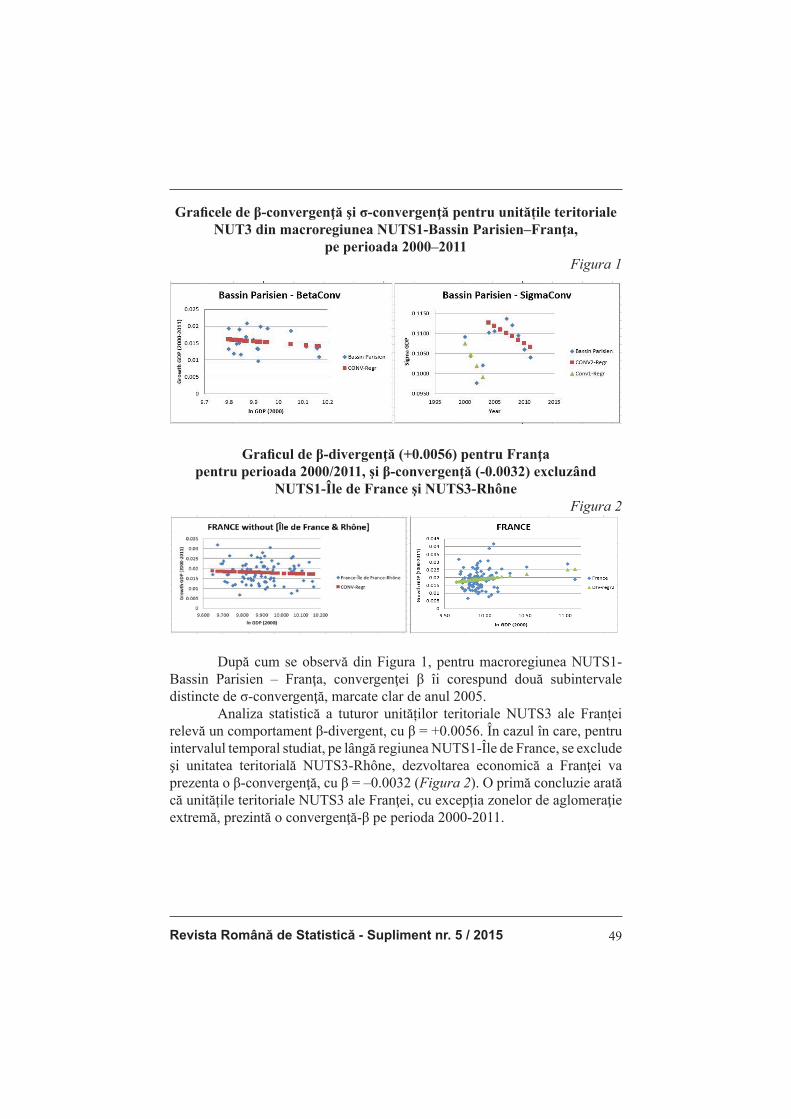
Revista Română de Statistică - Supliment nr. 5 / 2015 49
Grafi cele de β-convergenţă şi σ-convergenţă pentru unitățile teritoriale NUT3 din macroregiunea NUTS1-Bassin Parisien–Franţa,
pe perioada 2000–2011Figura 1
Grafi cul de β-divergenţă (+0.0056) pentru Franţa pentru perioada 2000/2011, şi β-convergenţă (-0.0032) excluzând
NUTS1-Île de France şi NUTS3-RhôneFigura 2
După cum se observă din Figura 1, pentru macroregiunea NUTS1-Bassin Parisien – Franţa, convergenţei β îi corespund două subintervale distincte de σ-convergenţă, marcate clar de anul 2005. Analiza statistică a tuturor unităților teritoriale NUTS3 ale Franței relevă un comportament β-divergent, cu β = +0.0056. În cazul în care, pentru intervalul temporal studiat, pe lângă regiunea NUTS1-Île de France, se exclude şi unitatea teritorială NUTS3-Rhône, dezvoltarea economică a Franţei va prezenta o β-convergenţă, cu β = –0.0032 (Figura 2). O primă concluzie arată că unitățile teritoriale NUTS3 ale Franţei, cu excepția zonelor de aglomeraţie extremă, prezintă o convergenţă-β pe perioda 2000-2011.

Romanian Statistical Review - Supplement nr. 5 / 201550
Germania Convergenţa β a fost analizată pe toate unitățile teritoriale NUTS3 care corespund celor 694 de districte în cadrul celor 9 regiuni NUTS1 ale Germaniei. Astfel, am prelucrat 8328 de date reprezentând valorile PIB/locuitor la nivel NUTS3 pentru același interval de 12 ani, respectiv 2000–2011. Aceste valori au fost preluate din baza de date EUROSTAT publicată de UE pentru statele membre și alcătuită pe baza raportărilor respectivelor institute naţionale de statistică. În cazul Germaniei, valorile PIB/locuitor pe perioada 2000–2011 variază între maxima de 108900 €/locuitor în NUTS3-Wolfsburg Kreisfreie Stadt, aparținând de NUTS1-Niedersachsen şi minima de 11600 €/locuitor din NUTS3-Südwestpfalz din NUTS1-Rheinland-Pfalz. Valorile parametrilor statistici obținuți prin regresia non-liniară pentru dependențele calculate ale mărimilor β şi σ aferente unităților teritoriale NUTS3 din fi ecare regiune administrativă NUTS1 sunt expuse în Tabelul 2. Șapte dintre cele nouă macroregiuni prezintă β-convergenţă, iar două β-divergenţă, comportament evidențiat prin regresie liniară. Pentru toate regiunile NUTS1 regresia non-liniară a fost aplicată separat pe cele două subintervale evidente în dependența temporală a mărimii σ-standard în cadrul perioadei studiate, cu excepția NUTS1-Schleswig-Holstein, pentru care sunt evidențiate trei subintervale. Comportamentul celor două mărimi statistice este similar în toate NUTS1, cu două excepții antagonice: în regiunea NUTS1-Bayern, la β-convergenţă corespunde σ-divergenţă, iar în NUTS1-Niedersachsen, la β-divergență corespunde σ-convergență.
Convergenţa β şi σ pentru Germania 2000-2011Tabelul 2
GERMANIA (NUTS1) β 2000-2011 σ
Baden-Württemberg -0.00863 2002-2006 2007-2011-0.003170075 -0.00211861
Bayern -0.00109 2000-2007 2008-20110.002913835 0.002709473
Nordrhein-Westfalen -0.0071 2000-2006 2006-2011-0.00446324 -0.00982079
Niedersachsen 0.00303 2000-2004 2005-2009-0.004093826 -0.00409383
Hessen -0.01454 2002-2006 2007-2011-0.004323431 -0.00418941
Rheinland-Pfalz -0.00551 2000-2003 2004-2011-0.00219914 -0.00195885
Saarland 0.01896 2000-2008 2009-20110.007241928 0.010204448
Schleswig-Holstein -0.00241 2000-2004 2004-2007 2008-20110.006523 -0.006109 -0.005343
Thüringen -0.03335 2000-2008 2009-2011-0.007752977 -0.002995859
(Sursa: Autor, 2015)

Revista Română de Statistică - Supliment nr. 5 / 2015 51
Absența unei convergenţe a mărimii σ pentru unitățile NUTS3 din NUTS1-Bayern reprezintă un exemplu concret al faptului că β-convergenţa este necesară, dar nu sufi cientă pentru prezența unei convergențe σ (Sala-i-Martin, 1992). Acest comportament se poate datora unei β-convergenţe condiţionale, proces în care economiile nu tind către acelaşi palier „steady-state” (Figura 3).
Grafi ce β-convergenţă şi σ-divergenţă pentru unitățile teritoriale NUTS3 ale regiunii NUTS1-Bayern–Germania pe perioada 2000–2011
Figura 3
(Sursa: Autor, 2015)
În fi nal, trebuie semnalat că impactul crizei economice din 2008 este refl ectat clar de modifi carea comportamentului σ cu excepția NUTS1-Niedersachsen, iar impactul lărgirii UE se manifestă prin alterarea tendinței mărimii σ, cu excepția NUTS1-Bayern.
Grecia Am calculat valoarea creșterii economice pentru toate cele 51 de unități teritoriale NUTS3 corespunzătoare celor 3 macroregiuni NUTS1 ale Greciei. Astfel, am prelucrat 600 de date reprezentând valorile PIB pe locuitor la nivel NUTS3. Aceste valori au fost preluate din aceeaşi bază de date EUROSTAT publicată de UE pentru statele membre. Valorile PIB per capita pe unitățile teritoriale NUTS3 variază între maxima de 27700 €/locuitor, aceeași pentru unitățile teritoriale NUTS3 Andros, Thira, Kea, Milos, Mykonos, Naxos, Paros, Syros şi Tinos din regiunea NUTS1-Nisia, Aigaiou, Kriti şi minima de 7800 €/locuitor din unitatea teritorială NUTS3-Ileia a regiunii NUTS1-Kentriki.
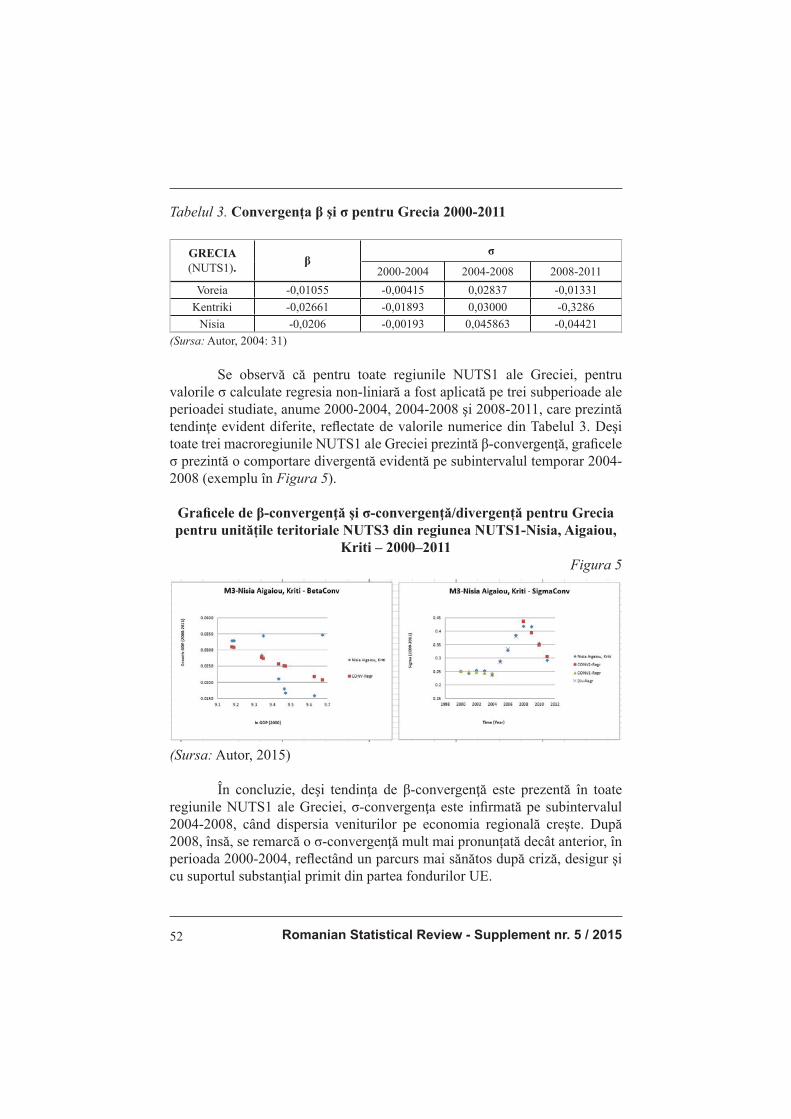
Romanian Statistical Review - Supplement nr. 5 / 201552
Tabelul 3. Convergenţa β şi σ pentru Grecia 2000-2011
GRECIA (NUTS1). β
σ
2000-2004 2004-2008 2008-2011Voreia -0,01055 -0,00415 0,02837 -0,01331
Kentriki -0,02661 -0,01893 0,03000 -0,3286Nisia -0,0206 -0,00193 0,045863 -0,04421
(Sursa: Autor, 2004: 31)
Se observă că pentru toate regiunile NUTS1 ale Greciei, pentru valorile σ calculate regresia non-liniară a fost aplicată pe trei subperioade ale perioadei studiate, anume 2000-2004, 2004-2008 şi 2008-2011, care prezintă tendinţe evident diferite, refl ectate de valorile numerice din Tabelul 3. Deşi toate trei macroregiunile NUTS1 ale Greciei prezintă β-convergenţă, grafi cele σ prezintă o comportare divergentă evidentă pe subintervalul temporar 2004-2008 (exemplu în Figura 5).
Grafi cele de β-convergenţă şi σ-convergenţă/divergență pentru Grecia pentru unitățile teritoriale NUTS3 din regiunea NUTS1-Nisia, Aigaiou,
Kriti – 2000–2011Figura 5
(Sursa: Autor, 2015)
În concluzie, deşi tendinţa de β-convergenţă este prezentă în toate regiunile NUTS1 ale Greciei, σ-convergenţa este infi rmată pe subintervalul 2004-2008, când dispersia veniturilor pe economia regională crește. După 2008, însă, se remarcă o σ-convergenţă mult mai pronunțată decât anterior, în perioada 2000-2004, refl ectând un parcurs mai sănătos după criză, desigur şi cu suportul substanţial primit din partea fondurilor UE.
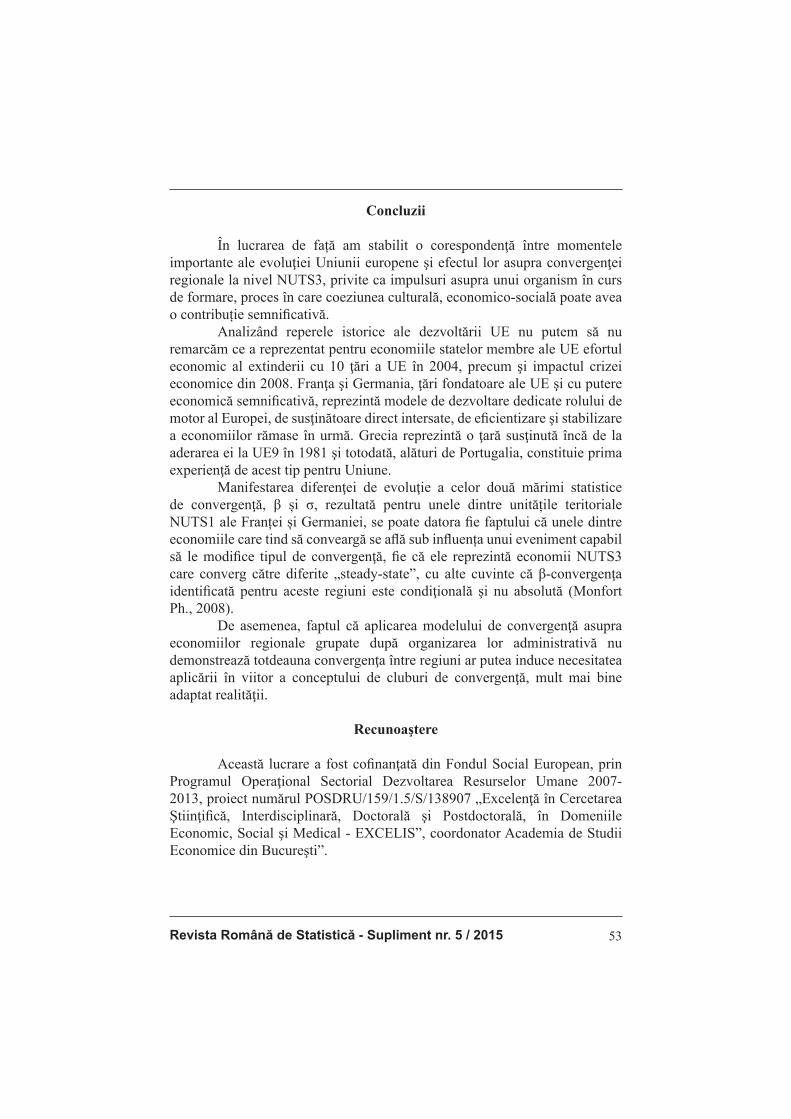
Revista Română de Statistică - Supliment nr. 5 / 2015 53
Concluzii
În lucrarea de față am stabilit o corespondenţă între momentele importante ale evoluţiei Uniunii europene şi efectul lor asupra convergenţei regionale la nivel NUTS3, privite ca impulsuri asupra unui organism în curs de formare, proces în care coeziunea culturală, economico-socială poate avea o contribuție semnifi cativă. Analizând reperele istorice ale dezvoltării UE nu putem să nu remarcăm ce a reprezentat pentru economiile statelor membre ale UE efortul economic al extinderii cu 10 ţări a UE în 2004, precum şi impactul crizei economice din 2008. Franţa şi Germania, ţări fondatoare ale UE şi cu putere economică semnifi cativă, reprezintă modele de dezvoltare dedicate rolului de motor al Europei, de susţinătoare direct intersate, de efi cientizare şi stabilizare a economiilor rămase în urmă. Grecia reprezintă o ţară susţinută încă de la aderarea ei la UE9 în 1981 şi totodată, alături de Portugalia, constituie prima experienţă de acest tip pentru Uniune. Manifestarea diferenţei de evoluţie a celor două mărimi statistice de convergenţă, β și σ, rezultată pentru unele dintre unitățile teritoriale NUTS1 ale Franței și Germaniei, se poate datora fi e faptului că unele dintre economiile care tind să conveargă se afl ă sub infl uența unui eveniment capabil să le modifi ce tipul de convergenţă, fi e că ele reprezintă economii NUTS3 care converg către diferite „steady-state”, cu alte cuvinte că β-convergenţa identifi cată pentru aceste regiuni este condiţională şi nu absolută (Monfort Ph., 2008). De asemenea, faptul că aplicarea modelului de convergenţă asupra economiilor regionale grupate după organizarea lor administrativă nu demonstrează totdeauna convergenţa între regiuni ar putea induce necesitatea aplicării în viitor a conceptului de cluburi de convergenţă, mult mai bine adaptat realităţii.
Recunoaştere
Această lucrare a fost cofi nanţată din Fondul Social European, prin Programul Operaţional Sectorial Dezvoltarea Resurselor Umane 2007-2013, proiect numărul POSDRU/159/1.5/S/138907 „Excelenţă în Cercetarea Ştiinţifi că, Interdisciplinară, Doctorală şi Postdoctorală, în Domeniile Economic, Social şi Medical - EXCELIS”, coordonator Academia de Studii Economice din Bucureşti”.
Romanian Statistical Review - Supplement nr. 5 / 201554
BIBLIOGRAFIE
- Artelaris, P., Kalioras, D., Petrakos, G. (2010). Editing journal articles, Regional Inequalities and Convergence Clubs in the European Union New Members-States. In: Eastern Journal of European Studies, Volum 1, Issue 1, June 2010
- Barro, R. and Sala–i-Martin, X. (1992). Editing journal articles: Convergence. In: Journal of Political Economy, 100(2): 223-251.
- Cornett, A. P., Sørensen, N. K. (2008) Editing journal articles: International vs. Intra-national Convergence in Europe – an Assessment of Causes and Evidence. In: Investigaciones Regionales 13 – Páginas 35 a 56 Sección ARTÍCULOS
- Dunford, M. (2009) Editing journal articles: Regional Development Models. In: Working Papers, No. 3/2009, University ofSussex
- Eckey, H.F., Turck, M. (2010). Editing journal articles: Convergence of EU-Regions. A Lierature Report. In: Investigaciones Regionales10 - Paginas 5 a 32, Seccion Articulus
- Monfort Ph. (2008). Editing journal articles:Convergence of EU regions. Measures and Evolution./ In: Regional Policy, nr.01/2008
- Solow, R. M. (1956). Editing journal articles: A Contribution to the Theory of Economic Growth. Quarterly Journal of Economics 70, pp. 65-94.
- Young, A.T., Higgins, M.J., Levy, D.M.J. (2008) Editing journal articles: Sigma Convergence versus Beta Convergence: Evidence from U.S. County-Level Data. In: Journal of Money, Credit and Banking, Vol. 40, No. 5

Revista Română de Statistică - Supliment nr. 5 / 2015 55
CONVERGENCE REGIONAL STUDY COMPARING
EU MEMBER STATESAbstract
Following the great interest shown by the EU to the concept of regional convergence as objective of its cohesion policy, as well as of the theoretical and applied debates carried out by scientifi c researchers, I realized a brief statistical analysis of the economic evolution of a few member states considered as representative for the stage and role they played in the economic development of the Union in the period covering both last extension waves. To this purpose, I applied the concept of β- and σ-convergence, defi ned in the frame of the neoclassical growth model developed by Barro and Sala-i-Martin, in analyzing the statistical data, i.e. the GDP per capita at NUTS3 level in the 2000-2011 period, provided by EUROSTAT for France, Germany, and Greece.
INTRODUCTION
Regional convergence is one of the main objectives pursued by the Cohesion Policy devised by EU, the strategy for effi ciently attaining this goal being fi nancially supported by the Structural Funds in order to meet the needs of the disadvantaged countries and regions. Lower fi nancial assistance is required for closing the gaps if convergence has reached a high level. Whereas, in the case of a low degree of convergence, there is a demand for a more substantial material aid. Seen as a declared and determining aim since the moment of the Union΄s establishment the setting up of a balanced and prosperous Single Market, together with the diminishing of discrepancies turned out to be the topics of endless heated debates over the concepts involved in the perspective of this impressive accomplishment. Moreover, certain economic and political developments that came after, such as the accession of Eastern Europe closed economies in the EU (Artelaris, P., Kalioras, D., Petrakos, G., 2010), as well as the wide and heterogeneous range of socio-economic and cultural aspects highly representative of our continent have added complexity to this endeavor. This background favored the world wide appearance of a rich literature concerning not only theoretical, but also empirical aspects of the regional convergence models, research focused on quantifying this

Romanian Statistical Review - Supplement nr. 5 / 201556
economic phenomenon. Although for the time being a satisfying answer is far from having been found. Anyhow, two concepts of this complex process have been identifi ed, theorized and made measurable so far, namely β- and σ-convergence. Regional convergence is a process in which different levels of local economic development are likely to meet in the long run, either by themselves or under control, so that fi nally disparities will come to an end. In spite of its being challenged in account of its failure to grasp all the details that generate this process or have an impact on it, GDP per capita has been adopted as the measuring unit for the effi ciency of the EU cohesion policy. In the frame of the regional convergence theory, this study aims at identifying a possible impact of the EU enlargement on the different European countries economy using the published econometric data. Using the special instruments and techniques necessary for the empirical econometric research this paper concerns also understanding the evolution of some foremost reference economies of the EU. Therefore, for each of the three chosen EU member-states, we have decided to identify a subinterval of convergence between the NUTS3 regions belonging to the same NUTS1 region. We were also interested in emphasizing some facets specifi c to the correlation between the two statistical concepts of convergence, meaning between β and σ behaviour. This study is covering the fi rst decade of the XXI century, i.e. 2000-2011, a relatively short but crucial period in building up EU27, and most important for which we could access corrected statistical data. Our work is structured into fi ve chapters. The chapter next to the Introduction defi nes the theoretical basics of the used statistical model and the quantitative formulae used in performing the empirical analysis of the database presented in Chapter 3. The corresponding description of data processing and the obtained results are given in Chapter 4 by plots and tables. Finally, Chapter 5 presents briefl y the most important conclusions of this report.
β-CONVERGENCE AND σ-CONVERGENCE
The concept of β-convergence emphasizing the process through which poor regions undergo a more rapid development than the richer ones, was introduced by Solow (1955) and is based on the well-known economic principle of diminishing rate of return all along production. This means that during its development an economy shows a tendency to reach a steady state and this process is actually the result of a gradual diminishing of its growth rate until the economy has attained its stability level. Therefore, assuming that
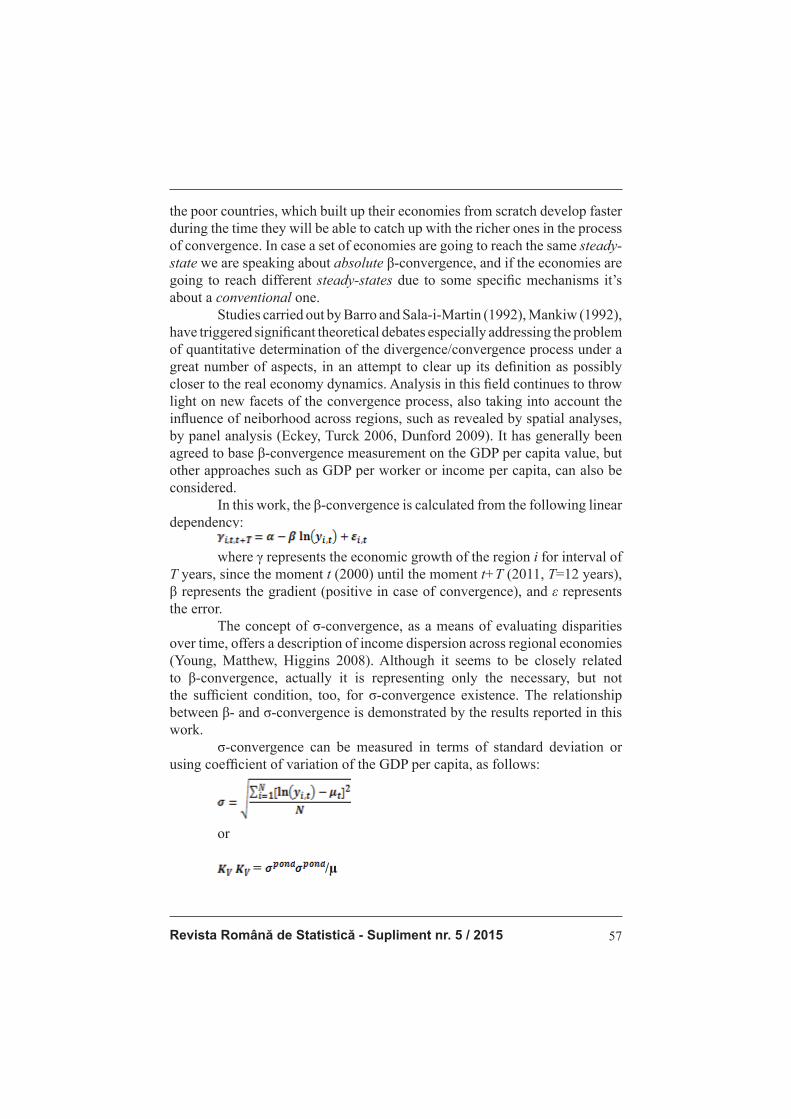
Revista Română de Statistică - Supliment nr. 5 / 2015 57
the poor countries, which built up their economies from scratch develop faster during the time they will be able to catch up with the richer ones in the process of convergence. In case a set of economies are going to reach the same steady-state we are speaking about absolute β-convergence, and if the economies are going to reach different steady-states due to some specifi c mechanisms it’s about a conventional one. Studies carried out by Barro and Sala-i-Martin (1992), Mankiw (1992), have triggered signifi cant theoretical debates especially addressing the problem of quantitative determination of the divergence/convergence process under a great number of aspects, in an attempt to clear up its defi nition as possibly closer to the real economy dynamics. Analysis in this fi eld continues to throw light on new facets of the convergence process, also taking into account the infl uence of neiborhood across regions, such as revealed by spatial analyses, by panel analysis (Eckey, Turck 2006, Dunford 2009). It has generally been agreed to base β-convergence measurement on the GDP per capita value, but other approaches such as GDP per worker or income per capita, can also be considered. In this work, the β-convergence is calculated from the following linear dependency: where γ represents the economic growth of the region i for interval of T years, since the moment t (2000) until the moment t+T (2011, T=12 years), β represents the gradient (positive in case of convergence), and ε represents the error. The concept of σ-convergence, as a means of evaluating disparities over time, offers a description of income dispersion across regional economies (Young, Matthew, Higgins 2008). Although it seems to be closely related to β-convergence, actually it is representing only the necessary, but not the suffi cient condition, too, for σ-convergence existence. The relationship between β- and σ-convergence is demonstrated by the results reported in this work. σ-convergence can be measured in terms of standard deviation or using coeffi cient of variation of the GDP per capita, as follows:
or
= /μ
Romanian Statistical Review - Supplement nr. 5 / 201558
In spite of the extension and differentiation of its theoretical area, as well as that of its empirical means of evolution the study of convergence still remains indebted to the new classical model set by Barro and Sala-i-Martin. Using the main concepts mentioned above, in the followings I report a statistical analysis on the evolution of β- and σ- regional convergence in 3 EU member states.
DATABASE
The numerical data sets have been supplied by the EUROSTAT database and they refer to the GDP per capita at the level of the EU NUTS3, expresed in €. The fundamental reason for choosing the time period lower limit was the availability of relevant data for all the member states at the NUTS3 level, thus being free to extend the geographic area of research. The upper limit was established by the most recent data available on EUROSTAT. Therefore, the chosen series of statistical values refer to the best covered interval 2000-2011. The data have been processed and organized using MS-Offi ce Excel and eViews program. The number of processed data varies from country to country, according to the number of its territorial units NUTS1 and the number of the included territorial units NUTS3.
RESULTS
After studying a whole range of European countries, I focused on three of them: France, Germany and Greece, for their signifi cant role played during EU development. In fact, France and Germany laid the Union foundation in 1957, together with Belgium, Luxembourg and Holland and their economies rank foremost in point of strength and stability. On the other hand, Greece, which joined the Union in 1981 as an economically assisted country represents besides Portugal the fi rst experiment of economic development subsidized by EU. β-convergence was determined using the growth equation proposed by Sala-i-Martin (1996). Based on the EUROSTAT data for each NUTS3 unit, I calculated the logarithm of GDP per capita (namely ln y) for both limits of the time interval, i.e. for 2000 and for 2011. The regional economic growth (γ) for every NUTS3 unit was calculated as the mean value of the series of logarithms of the y_2011/y_2000 ratio. Further, the regression for the independent value of ln y_2000 and the dependent value γ was applied. Secondly, σ-convergence was determined using the well-known Barro equation (1992). For each year of the selected time period, I added up the
Revista Română de Statistică - Supliment nr. 5 / 2015 59
squared values of the difference between the logarithm standing for the GDP per capita ascribed to each territorial unit NUTS3, and the average logarithm value of all the NUTS3 units belonging to the same NUTS1 unit, in every country. The standard square deviation generically named σ represents the measure of dispersion was calculated in terms of the ratio between the above mentioned sum and the number of years which make up the period of time under study.
France I studied β-convergence for the NUTS3 territorial units corresponding to all the 98 departments organized in 8 NUTS1 territorial units (afterwards excluding the NUTS1-Île de France, for not being relevant to this regional research; in the high level of agglomeration within Paris and its surroundings the GDP per capita values diverge of the rest of the country, so the effect on the general situation could be misleading). Consequently, I processed a number of 1164 data expressing the GDP per capita values at regional European NUTS3 level for the twelve years period 2000-2011. The fi gures used by me were obtained from the EUROSTAT database, which is published by EU based on statistics reported by each country national institute. The numerical values of the statistic parameters obtained by applying the non-linear regression are shown in the Table 1. It can be noticed that within the 2000-2011 period, the GDP per capita varies between its maximum value of 39.000€ per habitant in the NUTS3-Rhône, belonging to the NUTS1-Centre-Est and the minimum value of 15.900€ per habitant in the NUTS3-Haute-Corse, belonging to NUTS1-Mediteranée. As can be observed in Table 1, excepting one case, the σ non-linear regression has been applied on two different sub-intervals of the period under study, in order to emphasize the clear empirical tendency. The NUTS3-Sud-Ouest region offers the image of a statistically signifi cant σ-convergence for both sub-intervals, whereas β is divergent.

Romanian Statistical Review - Supplement nr. 5 / 201560
β- and σ- convergence for France 2000-2011Tabel 1
FRANCE (NUTS1) β σ
Bassin Parisien -0,00551452000-2003 2004-2011-0,0027783 -0,0008594
Nord –Pas-de-Calais -0,0029157
2000-2006 2009-2011-0,0023838 -0,00025628
Ouest 0,00977772000-2003 2004-2007 2009-2011
0,00175 -0,000707 -0,000111
Sud-Ouest 0,007481652000-2005 2007-20110,0030829 -0,00092103
Centre-Est -0,00040642000-2005 2007-2011
-0,00101015 -0,00129019
Méditerranée 0,00673972000-2006 2007-2011-0,0001569 0,0013798
(Source: Author, 2015)
The Western NUTS1 regions (located on the Atlantic Ocean coast) display a low β-divergence, meanwhile recording a quite signifi cant σ-convergence, especially in the case of NUTS1-Sud-Ouest (Table 1).
Non-linear regression emphsizing β- and σ-convergence for the NUT3 units belonging to NUTS1-Bassin Parisien of France, calculated for the
2000–2011 time periodFigure 1
(Source: Author, 2015)
As shown in Figure 1 for the NUTS1-Bassin Parisien region, the empirical behavior is clearly convergent for both statistical values, but the σ-convergence is obviously marked by 2005.
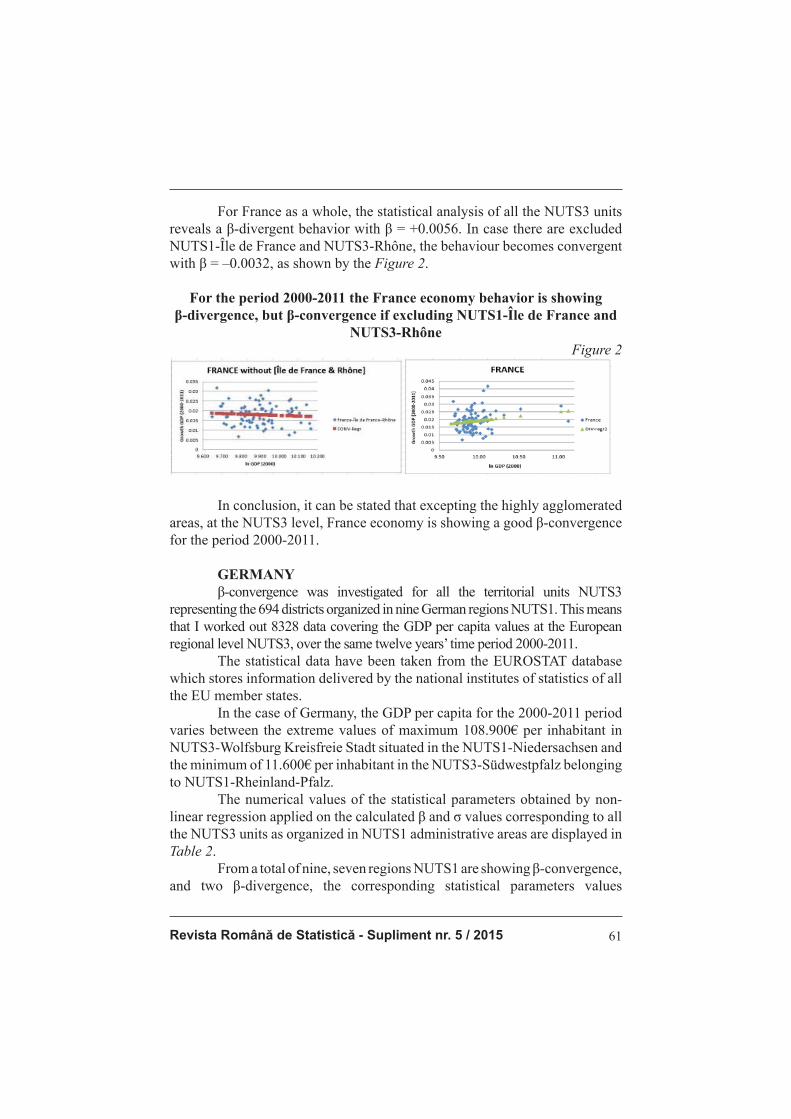
Revista Română de Statistică - Supliment nr. 5 / 2015 61
For France as a whole, the statistical analysis of all the NUTS3 units reveals a β-divergent behavior with β = +0.0056. In case there are excluded NUTS1-Île de France and NUTS3-Rhône, the behaviour becomes convergent with β = –0.0032, as shown by the Figure 2.
For the period 2000-2011 the France economy behavior is showing β-divergence, but β-convergence if excluding NUTS1-Île de France and
NUTS3-RhôneFigure 2
In conclusion, it can be stated that excepting the highly agglomerated areas, at the NUTS3 level, France economy is showing a good β-convergence for the period 2000-2011.
GERMANY β-convergence was investigated for all the territorial units NUTS3 representing the 694 districts organized in nine German regions NUTS1. This means that I worked out 8328 data covering the GDP per capita values at the European regional level NUTS3, over the same twelve years’ time period 2000-2011. The statistical data have been taken from the EUROSTAT database which stores information delivered by the national institutes of statistics of all the EU member states. In the case of Germany, the GDP per capita for the 2000-2011 period varies between the extreme values of maximum 108.900€ per inhabitant in NUTS3-Wolfsburg Kreisfreie Stadt situated in the NUTS1-Niedersachsen and the minimum of 11.600€ per inhabitant in the NUTS3-Südwestpfalz belonging to NUTS1-Rheinland-Pfalz. The numerical values of the statistical parameters obtained by non-linear regression applied on the calculated β and σ values corresponding to all the NUTS3 units as organized in NUTS1 administrative areas are displayed in Table 2. From a total of nine, seven regions NUTS1 are showing β-convergence, and two β-divergence, the corresponding statistical parameters values

Romanian Statistical Review - Supplement nr. 5 / 201562
obtained by the non-linear regression being listed in the Table 2. Excepted NUTS1-Schleswig-Holstein for which the σ-standard behavior is showing three distinct time sub-periods for the rest of them there are emphasized only two. The σ-regression statistical parameters values are listed in the Table 2 for all the sub-periods. It is worth to note that in the great majority of NUTS1 units, both β and σ have the same type of tendency, excepted two antagonistic cases, meaning NUTS1-Bayern showing β-convergent with σ-divergent, and NUTS1-Niedersachsen showing β-divergent with σ-convergent.
β- and σ-convergence for 2000-2011 in GermanyTable 2
GERMANY (NUTS1) β 2000-2011 σ
Baden-Württemberg -0.00863 2002-2006 2007-2011-0.003170075 -0.00211861
Bayern -0.00109 2000-2007 2008-20110.002913835 0.002709473
Nordrhein-Westfalen -0.0071 2000-2006 2006-2011-0.00446324 -0.00982079
Niedersachsen 0.00303 2000-2004 2005-2009-0.004093826 -0.00409383
Hessen -0.01454 2002-2006 2007-2011-0.004323431 -0.00418941
Rheinland-Pfalz -0.00551 2000-2003 2004-2011-0.00219914 -0.00195885
Saarland 0.01896 2000-2008 2009-20110.007241928 0.010204448
Schleswig-Holstein -0.00241 2000-2004 2004-2007 2008-20110.006523 -0.006109 -0.005343
Thüringen -0.03335 2000-2008 2009-2011-0.007752977 -0.002995859
(Source: Author, 2004: 31)
The opposite behavior for NUTS1-Bayern: β-convergence and two distinct sub-periods of σ-divergence in the time period 2000–2011
Figure 3
(Sourse: Author, 2015: 31)
The absence of the σ-convergence for the NUTS3 units belonging to NUTS1-Bayern represents a clear example that the convergence of β is
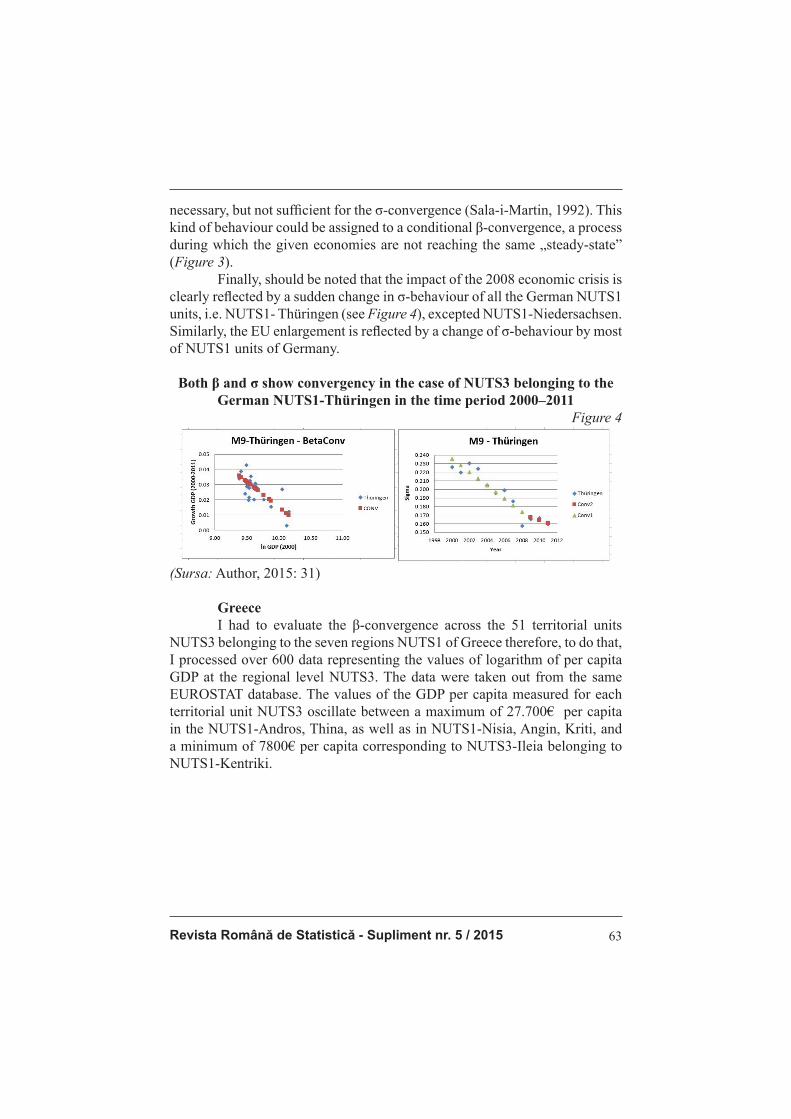
Revista Română de Statistică - Supliment nr. 5 / 2015 63
necessary, but not suffi cient for the σ-convergence (Sala-i-Martin, 1992). This kind of behaviour could be assigned to a conditional β-convergence, a process during which the given economies are not reaching the same „steady-state” (Figure 3). Finally, should be noted that the impact of the 2008 economic crisis is clearly refl ected by a sudden change in σ-behaviour of all the German NUTS1 units, i.e. NUTS1- Thüringen (see Figure 4), excepted NUTS1-Niedersachsen. Similarly, the EU enlargement is refl ected by a change of σ-behaviour by most of NUTS1 units of Germany.
Both β and σ show convergency in the case of NUTS3 belonging to the German NUTS1-Thüringen in the time period 2000–2011
Figure 4
(Sursa: Author, 2015: 31)
Greece I had to evaluate the β-convergence across the 51 territorial units NUTS3 belonging to the seven regions NUTS1 of Greece therefore, to do that, I processed over 600 data representing the values of logarithm of per capita GDP at the regional level NUTS3. The data were taken out from the same EUROSTAT database. The values of the GDP per capita measured for each territorial unit NUTS3 oscillate between a maximum of 27.700€ per capita in the NUTS1-Andros, Thina, as well as in NUTS1-Nisia, Angin, Kriti, and a minimum of 7800€ per capita corresponding to NUTS3-Ileia belonging to NUTS1-Kentriki.
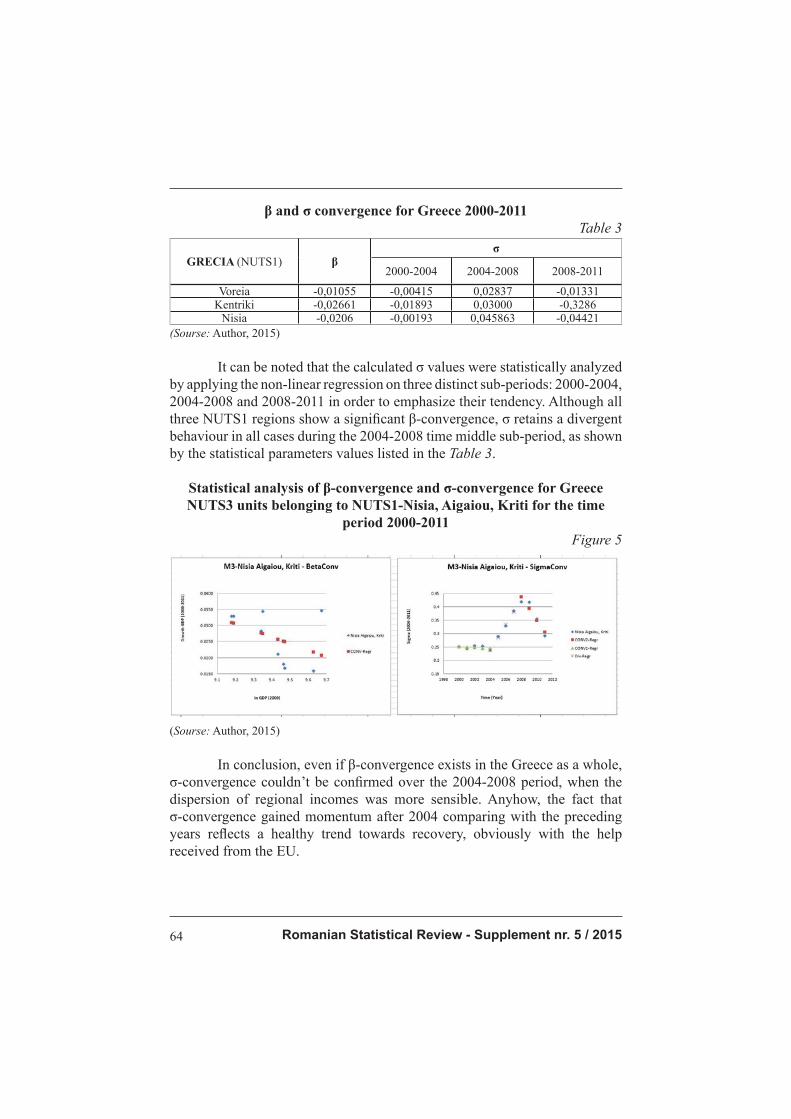
Romanian Statistical Review - Supplement nr. 5 / 201564
β and σ convergence for Greece 2000-2011Table 3
GRECIA (NUTS1) βσ
2000-2004 2004-2008 2008-2011
Voreia -0,01055 -0,00415 0,02837 -0,01331Kentriki -0,02661 -0,01893 0,03000 -0,3286
Nisia -0,0206 -0,00193 0,045863 -0,04421(Sourse: Author, 2015)
It can be noted that the calculated σ values were statistically analyzed by applying the non-linear regression on three distinct sub-periods: 2000-2004, 2004-2008 and 2008-2011 in order to emphasize their tendency. Although all three NUTS1 regions show a signifi cant β-convergence, σ retains a divergent behaviour in all cases during the 2004-2008 time middle sub-period, as shown by the statistical parameters values listed in the Table 3.
Statistical analysis of β-convergence and σ-convergence for Greece NUTS3 units belonging to NUTS1-Nisia, Aigaiou, Kriti for the time
period 2000-2011Figure 5
(Sourse: Author, 2015)
In conclusion, even if β-convergence exists in the Greece as a whole, σ-convergence couldn’t be confi rmed over the 2004-2008 period, when the dispersion of regional incomes was more sensible. Anyhow, the fact that σ-convergence gained momentum after 2004 comparing with the preceding years refl ects a healthy trend towards recovery, obviously with the help received from the EU.

Revista Română de Statistică - Supliment nr. 5 / 2015 65
CONCLUSIONS
This work aims at revealing the correspondence between some of the signifi cant stages in the evolution of the EU and their impact upon regional convergence at NUTS3 level, by showing the way in which an aggregate body made up of apparently separate elements responds to outside infl uences of socio-economic and cultural cohesion. In analyzing the history landmarks of the EU development, we cannot overlook the major importance of the economic effort required by its extension in 2004, when ten new member states joined the Union, as well as the consequences of the economic crisis of 2008. France and Germany, responsible in their capacity as economically advanced countries for the foundation of the Union, are models of development dedicated to Europe’s dive towards a straight, constant and effective commitment in the recovery of the economies that still lag behind. Greece can serve as an example of a country sustained by the EU Group and represents an early experience of this type.
ACKNOWLEDGMENT „This paper was co-fi nanced from the European Social Fund, through the Sectorial Operational Programme Human Resources Development 2007-2013, project number POSDRU/159/1.5/S/138907 “Excellence in scientifi c interdisciplinary research, doctoral and postdoctoral, in the economic, social and medical fi elds -EXCELIS”, coordinator The Bucharest University of Economic Studies”.
Refferences - Artelaris, P., Kalioras, D., Petrakos, G. – Regional Inequalities and Convergence
Clubs in the European Union New Members-States. In: Eastern J. of European Studies, 1(1), pp.113-133 (2010).
- Barro, R. and Sala–i-Martin, X. – Convergence, J. of Political Economy, 100(2): pp.223-251 (1992).
- Cornett, A.P., Sørensen, N.K. – International vs. Intra-national Convergence in Europe – an Assessment of Causes and Evidence. In: Investigaciones Regionales, 13, pp.35-56 (2008).
- Dunford, M. – Regional Development Models. In: Working Papers, No. 3/2009, Univ. of Sussex (2009)
- Eckey, H.F., Turck, M. – Convergence of EU-Regions. A Lierature Report. In: Investigaciones Regionales10 - Paginas 5 a 32, Seccion Articulus (2010)
- Monfort, Ph. – Convergence of EU regions. Measures and Evolution./ In: Regional Policy, nr.01 (2008).
- Solow, R.M. – A Contribution to the Theory of Economic Growth, Quarterly Journal of Economics, 70 (1), pp.65-94 (1956).
- Young, A.T., Higgins, M.J., Levy, D.M.J. Editing journal articles: Sigma Convergence versus Beta Convergence: Evidence from U.S. County-Level Data. In: Journal of Money, Credit and Banking, Vol. 40, No. 5 (2008)
Romanian Statistical Review - Supplement nr. 5 / 201566
Principalele variabile în evaluarea impactului gazelor de şist asupra preţurilor energiei
Drd. Valentina IVAN Academia de Studii Economice
Abstract
Descoperirile recente în tehnologia de forare a hidrocarburilor au dus la extragerea profi tabilă de gaze naturale din formațiunile de gaze de șist. Gazele de șist au schimbat efi ciența economică a producției de gaze naturale în SUA având în vedere că această creștere bruscă a ofertei de resurse a dus la prețuri ale gazelor semnifi cativ mai mici. Începând cu anul 2008, diferența dintre prețurile la gaze în Statele Unite și Europa a crescut, cu prețuri la gazele europene chiar de trei ori mai mari comparativ cu cele din SUA. În America de Nord cărbunele a fost înlocuit cu gaze naturale în sectorul producției energiei electrice datorită scăderii semnifi cative a prețurilor la gaze. În plus, rezervele de cărbune au fost parțial exportate în UE, fapt ce a condus la o scădere a prețurilor și o înlocuire a cărbunelor de către gaze în sectorul de producere a energiei electrice în UE. Cu toate acestea, efectul nu poate fi atribuit în totalitate revoluției gazelor de șist, deaorece și alți factori au contribuit, cum ar fi prețuri minime istorice pentru prețurile certifi catelor de emisii de carbon în ultimii ani și un consum în scădere ca urmare a recesiunii economice. Succesul gazelor de șist din SUA a determinat companiile și guvernele să evalueze posibilitățile de replicare a experienței producției de gaze de șist în Europa. Cuvinte cheie: fracturare hidraulică, gaze de șist, prețuri gaze natural, prețuri cărbune, prețuri electricitate Coduri clasifi care JEL: O13, Q30, Q38, Q40, Q43
Introducere
SUA au benefi ciat de unele premise pentru succesul în dezvoltar-ea resurselor de gaze neconvenționale, cum ar fi voința politică și coerența politicilor publicilor; slabă rezistență din partea comunităților locale, în princi-pal datorită faptului că cetățenii au dreptul să primească redevențe în schimbul drepturilor lor asupra resurselor subsolului, situație complet diferită de Eu-ropa unde statul deține resurselor naturale; progresele tehnologice în fractura-rea hidraulică; cartografi erea detaliată a resurselor naturale și o infrastructură operațională (rețele de conducte), precum și o industrie de servicii adecvată, în
Revista Română de Statistică - Supliment nr. 5 / 2015 67
măsură să ofere echipamente si forță de muncă califi cată. Europa se confruntă cu diferite obstacole în dezvoltarea resurselor de gaze de șist, cum ar fi geolo-gia diferită, o densitate a populației mai mare, un cadru de reglementare mai strict în ceea ce privește respectarea legislației de mediu - managementul apei și particularitățile în privința dreptului de utilizare a terenurilor. Impactul gazelor de șist asupra piețelor de energie din Europa va fi diferit de la o țară la alta, având în vedere cererea domestică de gaze, accept-abilitatea socială și cantitatea resurselor recuperabile în fi ecare țară. În primul rând, articolul va indica pe scurt impactul pozitiv al dezvoltării resurselor de gaze de șist în SUA și impactul indirect asupra prețurilor energiei la nivel european, evidențiind predicții în ceea ce privește cererea și oferta. În al doi-lea rând, articolul descrie contextul în care resursele de gaze neconvenționale pot fi dezvoltate în România. Acesta nu intenționează să efectueze o analiză aprofundată cost-benefi ciu cu privire la impactul economic al resurselor neconvenționale în România sau o evidență a tuturor benefi ciilor probabile, dar va avansa estimări în ceea ce privește cererea și oferta de gaze naturale. Ar-ticolul va indica principalele variabile care trebuie luate în considerare atunci când se evaluează impactul: cererea și oferta de gaze naturale din producția internă, impactul trecerii de la producerea de energie electrică pe bază de cărbune la producția pe bază de gaze naturale, impactul asupra bugetului de stat (regim fi scal, inclusiv redevențe), impactul asupra industriilor mari con-sumatoare de energie, cum ar fi sectorul petrochimic. Articolul concluzionează că abundența de resurse este benefi că pentru economia europeană în ansam-blu; cu toate acestea, impactul dezvoltării resurselor de gaze de șist în Europa este de așteptat să fi e limitat și progresiv, și nu similar cu boom-ul gazelor de șist în Statele Unite.
Methodologia
Articolul revizuiește literatura internațională și, în special, evoluțiile europene asupra sectorului de gaze de șist subliniind aspectele economice atașate gazelor de șist și impactul asupra piețelor de energie din Europa, cu accent pe prețurile la gaze, cărbune și energie electrică. Datorită faptului că cercetarea în sectorul gazelor de șist este un subiect de dată recentă (revoluția gazelor de șist a început în America în 2008), există un defi cit al articolelor revizuite (peer-reviewed) cu privire la impactul economic, cele mai multe dintre articole concentrându-se pe impactul asupra mediului sau asupra aspectelor geologice sau tehnologia folosită. Kinnaman (2011) susține că mai multe rapoarte au fost sponsorizate de industria de gaze și au estimat efectele economice ale extracției gazelor de șist asupra veniturilor, ocupării forței de
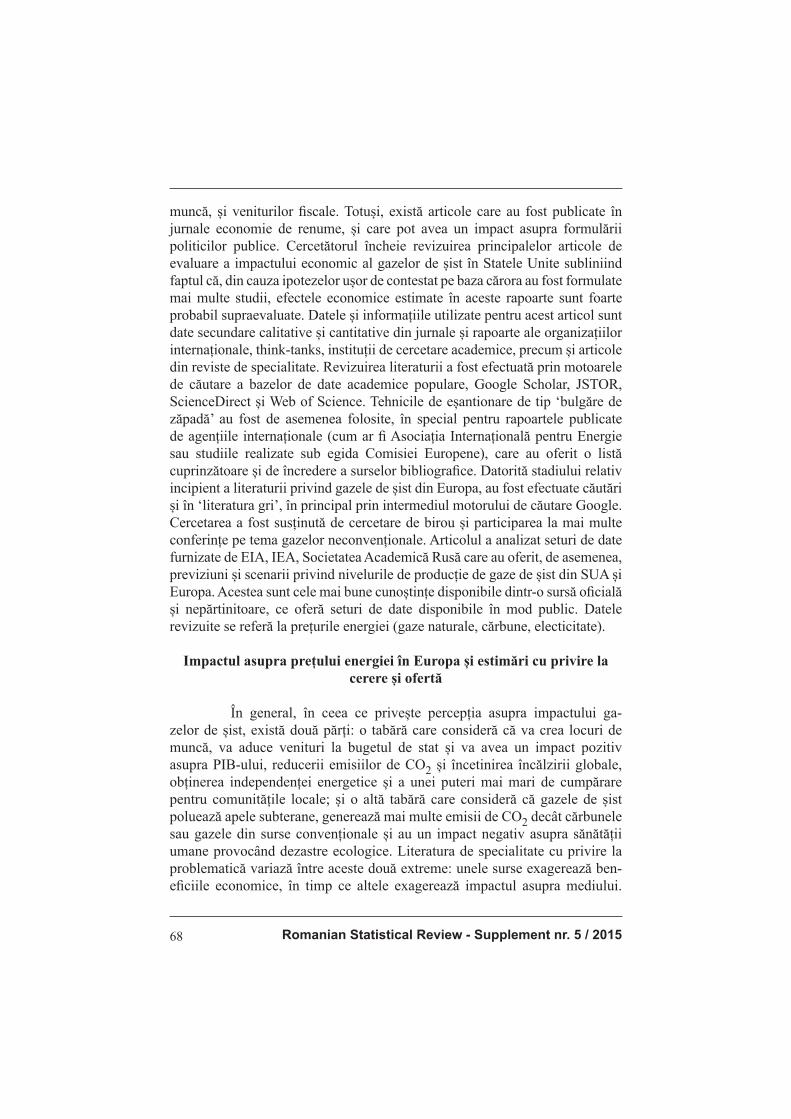
Romanian Statistical Review - Supplement nr. 5 / 201568
muncă, și veniturilor fi scale. Totuși, există articole care au fost publicate în jurnale economie de renume, și care pot avea un impact asupra formulării politicilor publice. Cercetătorul încheie revizuirea principalelor articole de evaluare a impactului economic al gazelor de șist în Statele Unite subliniind faptul că, din cauza ipotezelor ușor de contestat pe baza cărora au fost formulate mai multe studii, efectele economice estimate în aceste rapoarte sunt foarte probabil supraevaluate. Datele și informațiile utilizate pentru acest articol sunt date secundare calitative și cantitative din jurnale și rapoarte ale organizațiilor internaționale, think-tanks, instituții de cercetare academice, precum și articole din reviste de specialitate. Revizuirea literaturii a fost efectuată prin motoarele de căutare a bazelor de date academice populare, Google Scholar, JSTOR, ScienceDirect și Web of Science. Tehnicile de eșantionare de tip ‘bulgăre de zăpadă’ au fost de asemenea folosite, în special pentru rapoartele publicate de agențiile internaționale (cum ar fi Asociația Internațională pentru Energie sau studiile realizate sub egida Comisiei Europene), care au oferit o listă cuprinzătoare și de încredere a surselor bibliografi ce. Datorită stadiului relativ incipient a literaturii privind gazele de șist din Europa, au fost efectuate căutări și în ‘literatura gri’, în principal prin intermediul motorului de căutare Google. Cercetarea a fost susținută de cercetare de birou și participarea la mai multe conferințe pe tema gazelor neconvenționale. Articolul a analizat seturi de date furnizate de EIA, IEA, Societatea Academică Rusă care au oferit, de asemenea, previziuni și scenarii privind nivelurile de producție de gaze de șist din SUA și Europa. Acestea sunt cele mai bune cunoștințe disponibile dintr-o sursă ofi cială și nepărtinitoare, ce oferă seturi de date disponibile în mod public. Datele revizuite se referă la prețurile energiei (gaze naturale, cărbune, electicitate).
Impactul asupra prețului energiei în Europa și estimări cu privire la cerere și ofertă
În general, în ceea ce privește percepția asupra impactului ga-zelor de șist, există două părți: o tabără care consideră că va crea locuri de muncă, va aduce venituri la bugetul de stat și va avea un impact pozitiv asupra PIB-ului, reducerii emisiilor de CO2 și încetinirea încălzirii globale, obținerea independenței energetice și a unei puteri mai mari de cumpărare pentru comunitățile locale; și o altă tabără care consideră că gazele de șist poluează apele subterane, generează mai multe emisii de CO2 decât cărbunele sau gazele din surse convenționale și au un impact negativ asupra sănătății umane provocând dezastre ecologice. Literatura de specialitate cu privire la problematică variază între aceste două extreme: unele surse exagerează ben-efi ciile economice, în timp ce altele exagerează impactul asupra mediului.

Revista Română de Statistică - Supliment nr. 5 / 2015 69
O scădere a prețurilor la energie în Europa va fi benefi că, deoarece are po-tentialul de a reduce importurile de petrol și gaze și, prin urmare, ar diminua factura la importuri a UE; în al doilea rând, prețurile scăzute la gaze pot ajuta industriile mari consumatoare de energie (în special fabricile de oțel și cele de petrochimie) în a își îmbunătăți competitivitatea; în al treilea rând, gazele de șist reprezintă o oportunitate ieftină de a reduce emisiile de dioxid de car-bon având în vedere că gazele naturale au o efi ciență sporită în comparație cu cărbunele. Pöyry și Cambridge Econometrics (2013) au evaluat impactul macro-economic al producției de gaze de șist în Europa și au concluzionat că gazele de șist ar putea adăuga un total de 1,7 trilioane euro - 3,8 trilioane economiei europeane între 2020 și 2050. Cu toate acestea, în ciuda unor ben-efi cii vizibile obținute prin producția de gaze de șist în SUA privind securi-tatea energetică internă și piețele de energie, există încă temeri cu privire la potențialul impact negativ asupra mediului și sănătății umane. Deși mai multe țări din Europa se afl ă în prezent în etapa de evaluare a potențialul resurselor de gaze de șist viabile comercial, procesul de demarare a fazei de producție a fost mult mai lent în comparație cu America de Nord. În anul 2010, prețul mediu spot al gazelor naturale pe platforma de tranzacționare Henry Hub în SUA a fost de numai 4 $ MBtu, în timp ce în 2008 a fost în jur de 8-9 $ pe MBtu (a se vedea fi gura 1 de mai jos). În anul 2010, în comparație cu alte regiuni care nu sunt producătoare de gaze de șist, prețul gazului în SUA a fost de 4 $ pe MBtu, considerabil mai mic decât, de exemplu, în Europa continentală (8$/MBtu) sau în Japonia (11$/MBtu). In numai cinci ani, un boom al gazelor de șist a avut loc în Statele Unite, fapt ce a redus prețurile interne de gaze la o treime din prețul anterior. Prețul spot al gazelor naturale la Henry Hub a fost, în medie de 4.32$ / MMBtu în 2014, 16 % mai mare decât în 2013.
Prețul spot al gazelor naturael, platforma Henry HubFigura 1
Sursa: EIA

Romanian Statistical Review - Supplement nr. 5 / 201570
Prețurile cu gaze naturale au scăzut semnifi cativ din 2008, în princi-pal ca urmare a producției interne în creștere a gazelor de șist, precum și datorită unei cereri moderate care a avut un impact pozitiv asupra consumatorilor (de la consumatorii casnici până la întreprinderi), asupra sectorului transporturilor, și producerii de energie electrică. Două prognoze asupra prețurilor gazelor natu-rale realizate de instituții de renume în acest sens vor fi luate în considerare (a se vedea fi gura 2). Prima se bazează pe World Energy Outlook 2013 a Agenției Internaționale pentru Energie (IEA). Cea de a doua prognoză este preluată din Global and Russian Energy Outlook realizată de Institutul de Energie al Acade-miei de Științe a Rusiei (RAS). Acest articol consideră că aceste două predicții pot fi considerate drept scenariul minim (previziune RAS) și maxim (prognoza IEA) pentru prețul gazelor naturale din Europa. Agenția Internațională pentru Energie se așteaptă ca cererea de gaze să crească ușor în următorii 20 de ani, plecând de la asumpția că energiilor regenerabile vor continua să câștige importanță în sec-torul energetic. Cu toate acestea, cererea de gaze nu va scădea deoarece Agenția consideră că gazele vor înlocui centralele pe cărbune și centralele nucleare ce vor fi scoase din folosință, în special centralele pe huilă care vor fi decomision-ate din cauza legislației cu privire la poluarea aerului și prețurilor mai mari ale certifi catelor de CO2. Pe de altă parte, IEA estimează că mai multe centrale nucleare urmează să fi e retrase decât construite. Ambele asumpții arată faptul că gazele naturale vor rămâne un combustibil cheie în mixul energetic european și, ca urmare, prețurile vor crește, chiar dacă încet. Pe de altă parte, Academia Rusă de Științe consideră că până în 2030 Europa va înregistra o scădere a prețurilor la gaze cauzată în principal de cererea scăzută și surplusul de gaze. Numai după 2030 va începe să crească cererea deoarece cererea sporită din partea Asiei va pune presiune pe prețurile din Europa ducând la creșterea acestora.
Prognoze asupra prețurilor gazelor naturale în EuropaFigura 2
22,46 22,46 22,4625,26
26,80
31,03 31,29 32,08 33,12
10
15
20
25
30
35
2013 2020 2025 2030 2035
€/MWh
RAS
IEA
Sursa: IEA, RAS

Revista Română de Statistică - Supliment nr. 5 / 2015 71
Dezvoltarea gazelor de șist în Statele Unite a condus la înlocuirea cărbunelui de către gaze în producerea de energie electrică în SUA și a gazelor de către cărbune în sectorul producerii energiei electrice în Europa. Scăderea semnifi cativă a prețurilor la gaze în SUA din cauza boom-ului gazelor de șist au făcut rezervele de cărbune din SUA redundante. Acestea au fost redirecționate spre alte piețe, în special cele europene și asiatice. Rezervele de cărbune au fost parțial exportate în UE, fapt ce a dus la scăderea prețului cărbunelui în Europa și înlocuirea gazelor de către cărbune în sectorul producerii energiei electrice. Pe termen lung însă, prețurile cărbunelui importat de către UE nu s-au diminuat, iar cantitățile de cărbune importate de către Europa nu au cres-cut. Prin urmare, contribuția exactă a dezvoltării gazelor de șist în SUA asupra trecerii de la gaze la cărbune în alimentarea cu energie electrică a UE nu este dovedită. Articolul susține că există factori mai relevanți, cum ar fi prețurile minime ale certifi catelor de emisii de CO2, factor mult mai probabil a fi con-tribuit la trecerea de la gaze la cărbune în Europa. Cu toate acestea, în Europa, gazele naturale ar putea avea un rol în înlocuirea capacităților învechite de pro-ducere a energiei electrice pe bază de cărbune. Conform EIA(2012), a folosi gazele naturale pentru producerea de electricitate generează numai 20% din totalul emisiilor produse prin arderea cărbunelui. În 2008, pentru prima dată din 1990, nivelul emisiilor de CO2 au scăzut în mod semnifi cativ în America de Nord (Taskinsoy 2013), fapt ce poate fi pus în mare parte pe seama recesi-unii economice ce a redus activitatea industrială, dar și pe seama dezvoltării gazelor de șist. Un raport al Tripe E Consulting (2014), arată că prețurile cărbunelui în Europa a scăzut în mod nesemnifi cativ între 2010-2012, însă pe termen lung s-a înregistrat o tendință de creștere. Producția centralelor pe bază de gaze din Europa a scăzut cu aproximativ 25% între 2010 și 2012, în timp ce capacitatea instalată în centralele pe cărbune au crescut cu 10%. Cu toate acestea, gazele de șist reprezintă doar unul dintre motivele care au condus la această trecere de la gaze la cărbune în sectorul de producere a electricității în Europa. Aici, consumul de cărbune a crescut după 2010 pe seama scăderii prețului cărbunelui din America (Eurostat, 2012, vezi fi gura 3 de mai jos). La aceasta, alți factori de adaugă, precum prețuri minime istoric pentru certifi -catele de emisii de carbon după 2010, ierni mai blânde, un consum (atât din partea consumatorilor casnici, cât și industriali) în scădere datorită recesiunii economice. Declinul gazelor naturale poate fi parțial atribuit creșterii rolului energiilor regenerabile în producerea de energie electrică în Europa în aceeași perioadă. Prețurile la gaze în Europa au crescut substanțial începând cu 1990, fapt ce reprezintă un alt motiv pentru atractivitatea cărbunelui. Broderick și alții (2011) evidențiază faptul că argumentul potrivit căruia gazele de șist ar trebui exploatate drept un combusitibil de tranzitie cu intenția de a face trans-
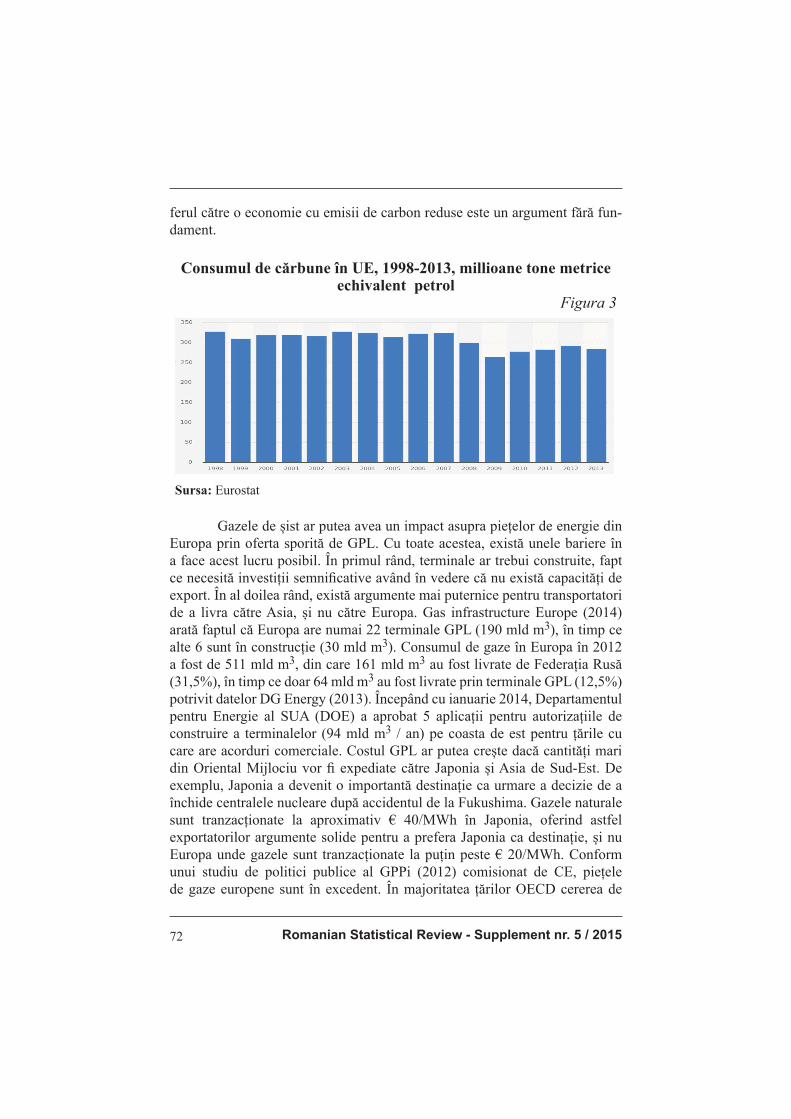
Romanian Statistical Review - Supplement nr. 5 / 201572
ferul către o economie cu emisii de carbon reduse este un argument fără fun-dament.
Consumul de cărbune în UE, 1998-2013, millioane tone metrice echivalent petrol
Figura 3
Sursa: Eurostat
Gazele de șist ar putea avea un impact asupra piețelor de energie din Europa prin oferta sporită de GPL. Cu toate acestea, există unele bariere în a face acest lucru posibil. În primul rând, terminale ar trebui construite, fapt ce necesită investiții semnifi cative având în vedere că nu există capacități de export. În al doilea rând, există argumente mai puternice pentru transportatori de a livra către Asia, și nu către Europa. Gas infrastructure Europe (2014) arată faptul că Europa are numai 22 terminale GPL (190 mld m3), în timp ce alte 6 sunt în construcție (30 mld m3). Consumul de gaze în Europa în 2012 a fost de 511 mld m3, din care 161 mld m3 au fost livrate de Federația Rusă (31,5%), în timp ce doar 64 mld m3 au fost livrate prin terminale GPL (12,5%) potrivit datelor DG Energy (2013). Începând cu ianuarie 2014, Departamentul pentru Energie al SUA (DOE) a aprobat 5 aplicații pentru autorizațiile de construire a terminalelor (94 mld m3 / an) pe coasta de est pentru țările cu care are acorduri comerciale. Costul GPL ar putea crește dacă cantități mari din Oriental Mijlociu vor fi expediate către Japonia și Asia de Sud-Est. De exemplu, Japonia a devenit o importantă destinație ca urmare a decizie de a închide centralele nucleare după accidentul de la Fukushima. Gazele naturale sunt tranzacționate la aproximativ € 40/MWh în Japonia, oferind astfel exportatorilor argumente solide pentru a prefera Japonia ca destinație, și nu Europa unde gazele sunt tranzacționate la puțin peste € 20/MWh. Conform unui studiu de politici publice al GPPi (2012) comisionat de CE, piețele de gaze europene sunt în excedent. În majoritatea țărilor OECD cererea de
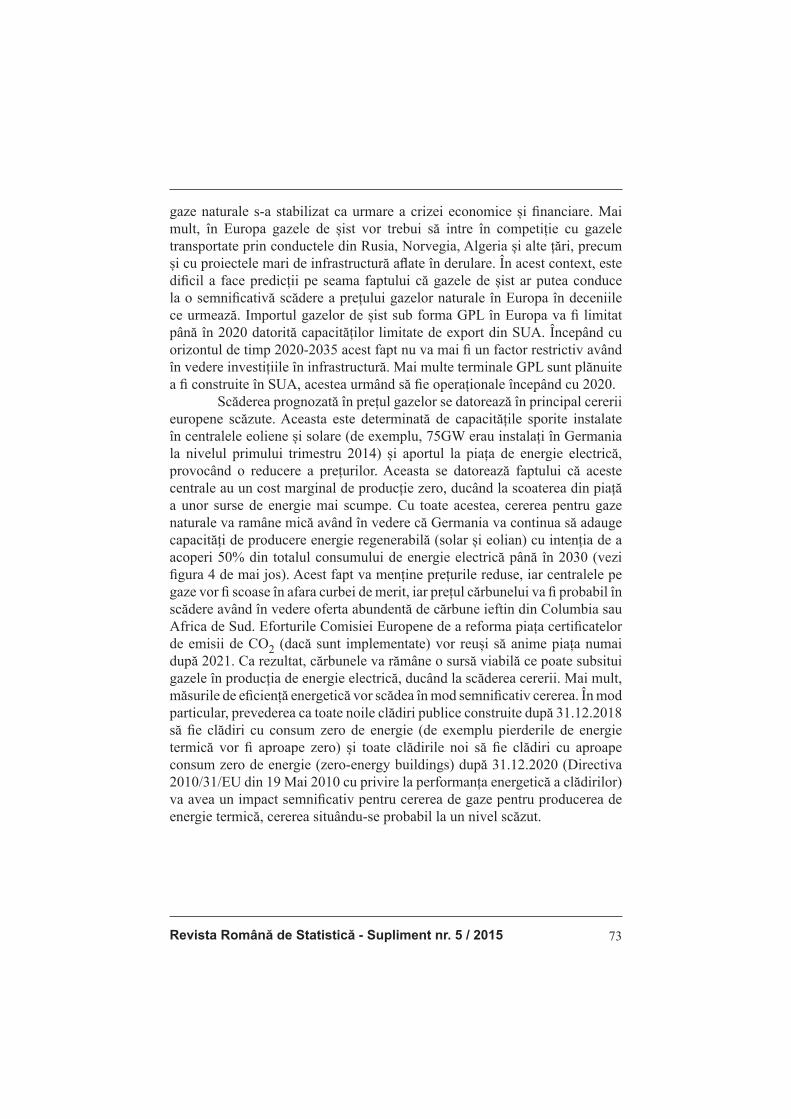
Revista Română de Statistică - Supliment nr. 5 / 2015 73
gaze naturale s-a stabilizat ca urmare a crizei economice și fi nanciare. Mai mult, în Europa gazele de șist vor trebui să intre în competiție cu gazele transportate prin conductele din Rusia, Norvegia, Algeria și alte țări, precum și cu proiectele mari de infrastructură afl ate în derulare. În acest context, este difi cil a face predicții pe seama faptului că gazele de șist ar putea conduce la o semnifi cativă scădere a prețului gazelor naturale în Europa în deceniile ce urmează. Importul gazelor de șist sub forma GPL în Europa va fi limitat până în 2020 datorită capacităților limitate de export din SUA. Începând cu orizontul de timp 2020-2035 acest fapt nu va mai fi un factor restrictiv având în vedere investițiile în infrastructură. Mai multe terminale GPL sunt plănuite a fi construite în SUA, acestea urmând să fi e operaționale începând cu 2020. Scăderea prognozată în prețul gazelor se datorează în principal cererii europene scăzute. Aceasta este determinată de capacitățile sporite instalate în centralele eoliene și solare (de exemplu, 75GW erau instalați în Germania la nivelul primului trimestru 2014) și aportul la piața de energie electrică, provocând o reducere a prețurilor. Aceasta se datorează faptului că aceste centrale au un cost marginal de producție zero, ducând la scoaterea din piață a unor surse de energie mai scumpe. Cu toate acestea, cererea pentru gaze naturale va ramâne mică având în vedere că Germania va continua să adauge capacități de producere energie regenerabilă (solar și eolian) cu intenția de a acoperi 50% din totalul consumului de energie electrică până în 2030 (vezi fi gura 4 de mai jos). Acest fapt va menține prețurile reduse, iar centralele pe gaze vor fi scoase în afara curbei de merit, iar prețul cărbunelui va fi probabil în scădere având în vedere oferta abundentă de cărbune ieftin din Columbia sau Africa de Sud. Eforturile Comisiei Europene de a reforma piața certifi catelor de emisii de CO2 (dacă sunt implementate) vor reuși să anime piața numai după 2021. Ca rezultat, cărbunele va rămâne o sursă viabilă ce poate subsitui gazele în producția de energie electrică, ducând la scăderea cererii. Mai mult, măsurile de efi ciență energetică vor scădea în mod semnifi cativ cererea. În mod particular, prevederea ca toate noile clădiri publice construite după 31.12.2018 să fi e clădiri cu consum zero de energie (de exemplu pierderile de energie termică vor fi aproape zero) și toate clădirile noi să fi e clădiri cu aproape consum zero de energie (zero-energy buildings) după 31.12.2020 (Directiva 2010/31/EU din 19 Mai 2010 cu privire la performanța energetică a clădirilor) va avea un impact semnifi cativ pentru cererea de gaze pentru producerea de energie termică, cererea situându-se probabil la un nivel scăzut.
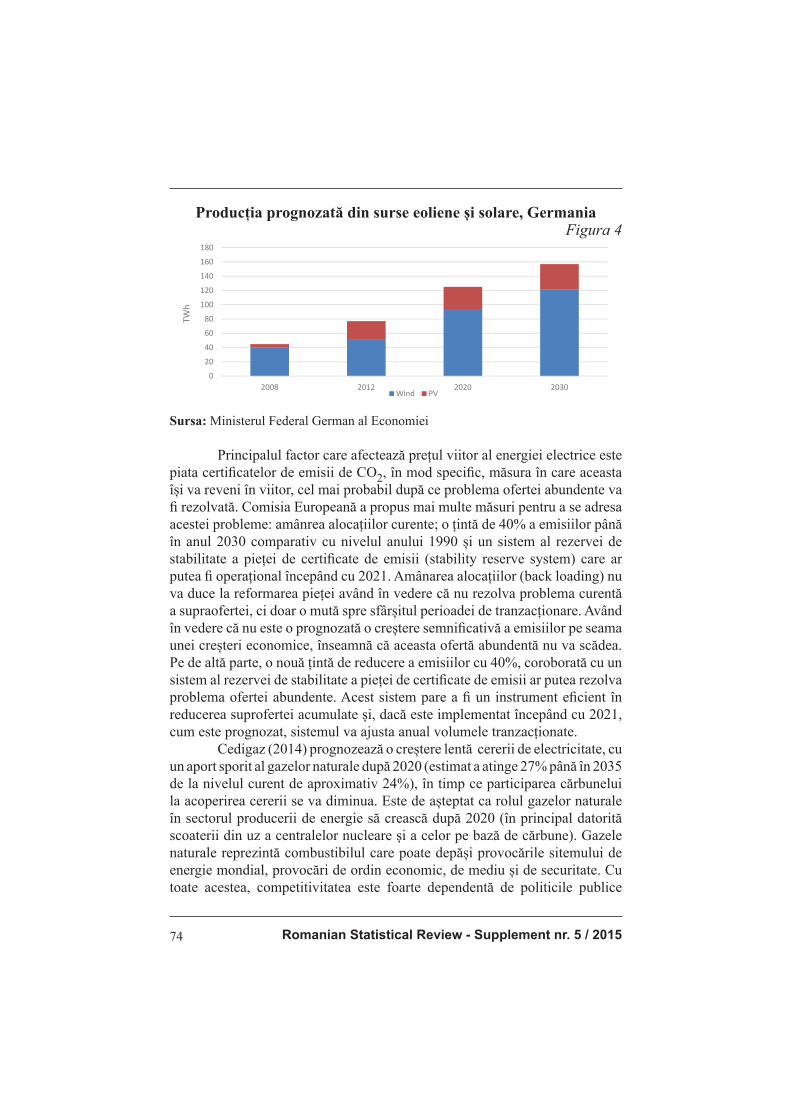
Romanian Statistical Review - Supplement nr. 5 / 201574
Producția prognozată din surse eoliene și solare, GermaniaFigura 4
0
20
40
60
80
100
120
140
160
180
2008 2012 2020 2030
TWh
Wind PV
Sursa: Ministerul Federal German al Economiei
Principalul factor care afectează prețul viitor al energiei electrice este piata certifi catelor de emisii de CO2, în mod specifi c, măsura în care aceasta își va reveni în viitor, cel mai probabil după ce problema ofertei abundente va fi rezolvată. Comisia Europeană a propus mai multe măsuri pentru a se adresa acestei probleme: amânrea alocațiilor curente; o țintă de 40% a emisiilor până în anul 2030 comparativ cu nivelul anului 1990 și un sistem al rezervei de stabilitate a pieței de certifi cate de emisii (stability reserve system) care ar putea fi operațional începând cu 2021. Amânarea alocațiilor (back loading) nu va duce la reformarea pieței având în vedere că nu rezolva problema curentă a supraofertei, ci doar o mută spre sfârșitul perioadei de tranzacționare. Având în vedere că nu este o prognozată o creștere semnifi cativă a emisiilor pe seama unei creșteri economice, înseamnă că aceasta ofertă abundentă nu va scădea. Pe de altă parte, o nouă țintă de reducere a emisiilor cu 40%, coroborată cu un sistem al rezervei de stabilitate a pieței de certifi cate de emisii ar putea rezolva problema ofertei abundente. Acest sistem pare a fi un instrument efi cient în reducerea suprofertei acumulate și, dacă este implementat începând cu 2021, cum este prognozat, sistemul va ajusta anual volumele tranzacționate. Cedigaz (2014) prognozează o creștere lentă cererii de electricitate, cu un aport sporit al gazelor naturale după 2020 (estimat a atinge 27% până în 2035 de la nivelul curent de aproximativ 24%), în timp ce participarea cărbunelui la acoperirea cererii se va diminua. Este de așteptat ca rolul gazelor naturale în sectorul producerii de energie să crească după 2020 (în principal datorită scoaterii din uz a centralelor nucleare și a celor pe bază de cărbune). Gazele naturale reprezintă combustibilul care poate depăși provocările sitemului de energie mondial, provocări de ordin economic, de mediu și de securitate. Cu toate acestea, competitivitatea este foarte dependentă de politicile publice
Revista Română de Statistică - Supliment nr. 5 / 2015 75
energetice și implementarea reglementărilor de mediu necesare. Este puţin probabil ca UE să reproducă experienţa SUA în ceea ce priveşte amploarea producţiei. Există incertitudini semnifi cative în privinţa dimensiunii exacte a rezervelor de gaze de şist recuperabile din punct de vedere tehnic. Un scenariu mediu dezvoltat de Thomas și alții prevede posibilitatea ca UE să-şi asigure din gazele de şist 3 - 10% din cererea totală de gaze până în 2035. Prin urmare, dependenţa de importuri de combustibilii fosili a UE va continua să crească, iar preţurile acestora vor rămane in mare măsură determinate de pieţele internaţionale. BP, în World Energy Outlook 2035 publicat în 2014 arată că gazele de șist vor avea o contribuție modestă de numai 6% în acoperirea cererii, în timp ce dependența de importuri va crește de la nivelul curent de 60-65% la 84% până în 2035, în principal datorită declinului în oferta internațională. Ce mai probabil Europa va demara procesul de producere a gazelor din resurse neconventionale după 2017, însă nu are mari șanse de a deveni un jucător important (Kavalov and Pelletier 2012) în special datorită limitărilor de ordin geologic, social, ecologic, politic, tehnico-economic și al mediului de afaceri, și mai recent datorită unei scăderi semnifi cative a prețului petrolului. Un alt studiu comisionat de CE (Pearson și alții 2012) arată că gazele europene vor putea exercita un impact pe scară largă asupra pieţelor de gaze la nivel mondial, numai în ipoteze foarte optimiste în ceea ce priveşte costurile de producţie şi cuantumul rezervelor recuperabile din punct de vedere economic și tehnic; și ar putea avea o contribuţie semnifi cativă la crearea unor pieţe europene mai lichide, mai integrate şi mai competitive de gaze naturale.
Contextul românesc: oferta și cererea de gaze naturale și impactul gazelor de șist
Conform BP Statistical Review of World Energy, rezervele de gaze naturale ale României în 2012 au fost de 100 miliarde de metri cubi, aproximativ 1/5 față de nivelul anului 1992. Strategia energetică românească estimează că rezervele de gaze din România se vor diminua treptat până în 2020, așa cum este prezentat în fi gura 5 de mai jos. Rata de declin a rezervelor de hidrocarburi este de 10% pe an, ceea ce înseamnă că dependența de importurile de gaze va crește în următorii 15 ani de la aproximativ până în 10% în prezent la 50% (așa cum prevede Strategia Energetică 2012-2035). Producția domestică de gaze este de așteptat să scadă la 5,3 miliarde de metri cubi până în 2021, solicitând importuri anuale de 13,6 miliarde de metri cubi, cu excepția cazului în care noi depozite de gaze sunt dezvoltate. O serie de evoluții noi, mici resurse de gaze naturale, sporirea producției din câmpurile

Romanian Statistical Review - Supplement nr. 5 / 201576
mature ar putea încetini eventual rata de declin a producției locale; dar, cel mai important, dezvoltarea unui câmp offshore de mare amploare care este în curs de explorare (resursele au fost estimate a fi de până la 84 miliarde de metri cubi) și resursele neconvenționale recuperabile tehnic și comercial (gazele de șist) ar putea fi adăugate mix-ului de combustibili al țării începând cu anul 2020.
Rezervele de gaze naturale: date istorice și proiecție (mld m3)Figura 5
170162 155 148 141 134 127 120 114 107 101 95 89 83 77
0
20
40
60
80
100
120
140
160
180
2006 2007 2008 2009 2010 2011 2012 2013 2014 2015 2016 2017 2018 2019 2020
bcm
Sursa: Strategia energetică românească 2012-2035 (martie, 2012)
Un studiu realizat de PwC (2014) arată că producția de gaze din România întâmpină costuri mai mari și efi ciență mai mică în comparație cu alte țări europene: de exemplu, costurile de operare pentru o sondă de gaze în România sunt de 17 $ / baril echivalent petrol (bep), comparativ cu Croația, Danemarca și Polonia (12 dolari / bep), Norvegia (7 $ / bep) și Italia (10 dolari / bep), în timp ce media de 21 bep / sondă / zi înregistrată în România este cea mai scăzută rată de producție din țările studiate. Cel mai probabil, combustibilii fosili vor rămâne o sursă dominantă a producției de energie electrică din România în deceniile următoare. În prezent, gaze naturale au un aport de 20% la mixul energetic al țării, contribuția fi ind prognozată să crească nesemnifi cativ în anii următori, într-un ritm progresiv după 2020 datorită în principal noilor centrale pe gaze și consumului industrial mai mare. Până în 2020, consumul de gaze poate crește ușor datorită următoarele motive: • capacități noi instalate în centrale pe gaze sunt prognozate a fi
instalate până în 2020 (aceasta include retehnologizarea centralelor electrice învechite pe gaze, dar și noi centrale), dar acest lucru nu va înclina balanța, având în vedere că alte centrale mai vechi vor fi dezafectate;
• consumul casnic este estimat a crește din cauza unui număr tot mai mare de gospodării deconectate de la sistemul centralizat de
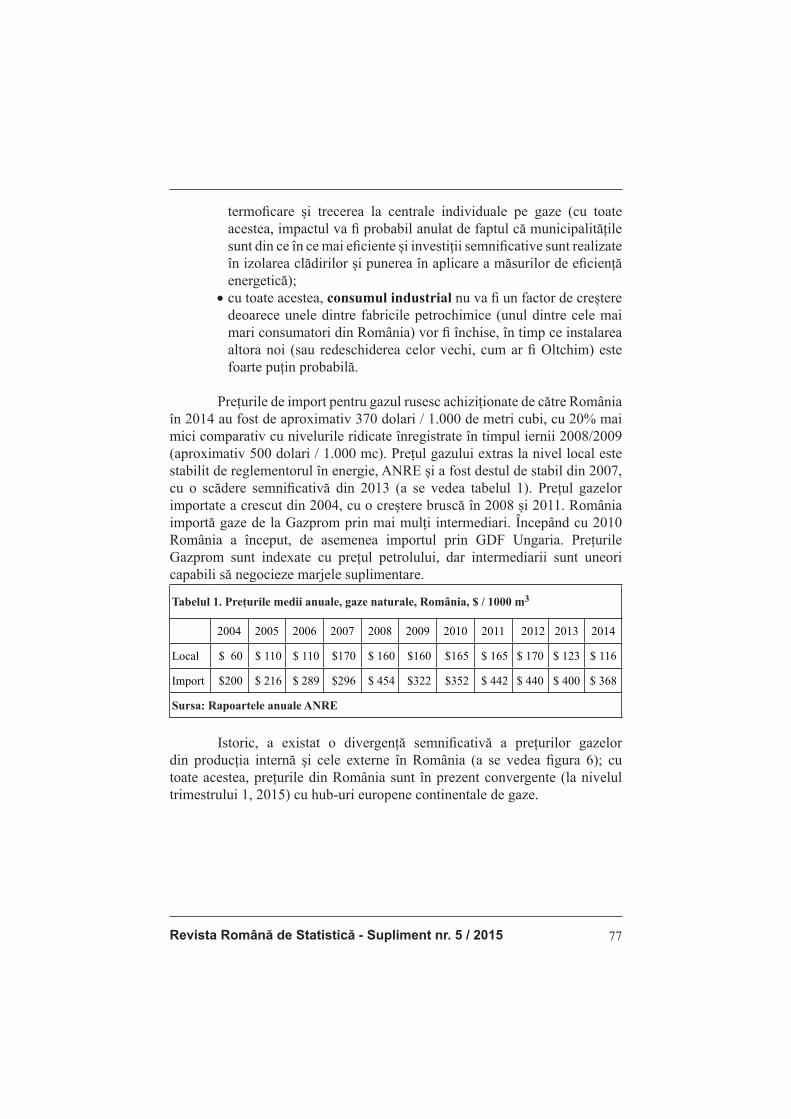
Revista Română de Statistică - Supliment nr. 5 / 2015 77
termofi care și trecerea la centrale individuale pe gaze (cu toate acestea, impactul va fi probabil anulat de faptul că municipalitățile sunt din ce în ce mai efi ciente și investiții semnifi cative sunt realizate în izolarea clădirilor și punerea în aplicare a măsurilor de efi ciență energetică);
• cu toate acestea, consumul industrial nu va fi un factor de creștere deoarece unele dintre fabricile petrochimice (unul dintre cele mai mari consumatori din România) vor fi închise, în timp ce instalarea altora noi (sau redeschiderea celor vechi, cum ar fi Oltchim) este foarte puțin probabilă.
Prețurile de import pentru gazul rusesc achiziționate de către România în 2014 au fost de aproximativ 370 dolari / 1.000 de metri cubi, cu 20% mai mici comparativ cu nivelurile ridicate înregistrate în timpul iernii 2008/2009 (aproximativ 500 dolari / 1.000 mc). Prețul gazului extras la nivel local este stabilit de reglementorul în energie, ANRE și a fost destul de stabil din 2007, cu o scădere semnifi cativă din 2013 (a se vedea tabelul 1). Prețul gazelor importate a crescut din 2004, cu o creștere bruscă în 2008 și 2011. România importă gaze de la Gazprom prin mai mulți intermediari. Începând cu 2010 România a început, de asemenea importul prin GDF Ungaria. Prețurile Gazprom sunt indexate cu prețul petrolului, dar intermediarii sunt uneori capabili să negocieze marjele suplimentare.
Tabelul 1. Prețurile medii anuale, gaze naturale, România, $ / 1000 m3
2004 2005 2006 2007 2008 2009 2010 2011 2012 2013 2014
Local $ 60 $ 110 $ 110 $170 $ 160 $160 $165 $ 165 $ 170 $ 123 $ 116
Import $200 $ 216 $ 289 $296 $ 454 $322 $352 $ 442 $ 440 $ 400 $ 368
Sursa: Rapoartele anuale ANRE
Istoric, a existat o divergență semnifi cativă a prețurilor gazelor din producția internă și cele externe în România (a se vedea fi gura 6); cu toate acestea, prețurile din România sunt în prezent convergente (la nivelul trimestrului 1, 2015) cu hub-uri europene continentale de gaze.
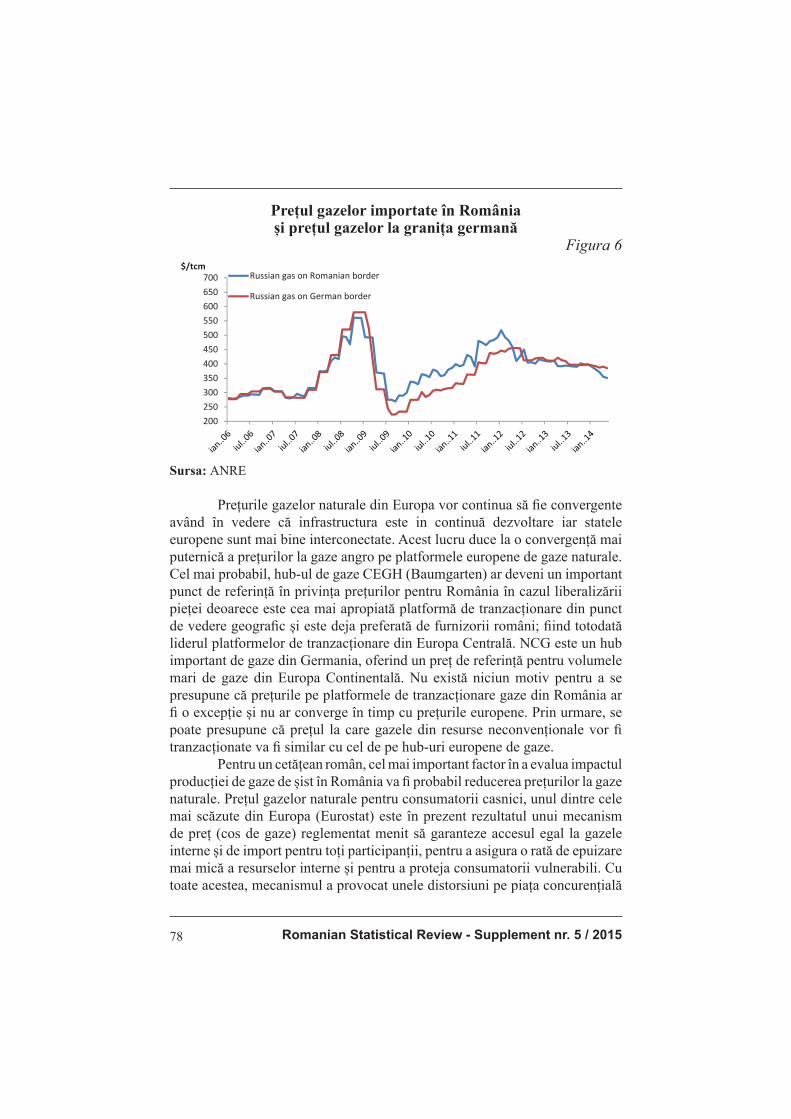
Romanian Statistical Review - Supplement nr. 5 / 201578
Prețul gazelor importate în România și prețul gazelor la granița germană
Figura 6
200250300350400450500550600650700
$/tcmRussian gas on Romanian border
Russian gas on German border
Sursa: ANRE
Prețurile gazelor naturale din Europa vor continua să fi e convergente având în vedere că infrastructura este in continuă dezvoltare iar statele europene sunt mai bine interconectate. Acest lucru duce la o convergență mai puternică a prețurilor la gaze angro pe platformele europene de gaze naturale. Cel mai probabil, hub-ul de gaze CEGH (Baumgarten) ar deveni un important punct de referință în privința prețurilor pentru România în cazul liberalizării pieței deoarece este cea mai apropiată platformă de tranzacționare din punct de vedere geografi c și este deja preferată de furnizorii români; fi ind totodată liderul platformelor de tranzacționare din Europa Centrală. NCG este un hub important de gaze din Germania, oferind un preț de referință pentru volumele mari de gaze din Europa Continentală. Nu există niciun motiv pentru a se presupune că prețurile pe platformele de tranzacționare gaze din România ar fi o excepție și nu ar converge în timp cu prețurile europene. Prin urmare, se poate presupune că prețul la care gazele din resurse neconvenționale vor fi tranzacționate va fi similar cu cel de pe hub-uri europene de gaze. Pentru un cetățean român, cel mai important factor în a evalua impactul producției de gaze de șist în România va fi probabil reducerea prețurilor la gaze naturale. Prețul gazelor naturale pentru consumatorii casnici, unul dintre cele mai scăzute din Europa (Eurostat) este în prezent rezultatul unui mecanism de preț (cos de gaze) reglementat menit să garanteze accesul egal la gazele interne și de import pentru toți participanții, pentru a asigura o rată de epuizare mai mică a resurselor interne și pentru a proteja consumatorii vulnerabili. Cu toate acestea, mecanismul a provocat unele distorsiuni pe piața concurențială
Revista Română de Statistică - Supliment nr. 5 / 2015 79
care au trebuit să fi e supra-reglementate. Piața pentru consumatorii casnici urmează să fi e liberalizată și acest lucru va însemna renunțarea la mecanismul coșului de gaze și, prin urmare va duce la o creștere treptată a prețului pentru consumatorii fi nali. O nouă sursă de energie în mixul energetic al țării nu va scădea însă în mod semnifi cativ prețurile gazelor pentru consumatorii casnici care sunt proiectate să crească din cauza calendarului de liberalizare a pieței gazelor naturale. În România, cel puțin până în 2020, înlocuirea cărbunelui de către gaze în producerea de energie electrică va fi un proces limitat, și este puțin probabil să asistăm la o substituție. Cu toate acestea, România se afl ă în procesul de închidere a ultimelor patru mine de huilă (până în 2018), în timp ce minele de lignit vor rămâne operaționale. România importă cărbune, însă ponderea cărbunelui importat a scăzut la un sfert față de 1990 (IAE). Din motive sociale, România a importat cantități de cărbune nesemnifi cative, deși lignitul produs în țară are o valoare calorifi că relativ scăzută în comparație cu cărbunele din Republica Cehă și Germania, în timp ce costurile de producție sunt mai mari decât în alte țări. Aproximativ 30% din energia electrică produsă în România este în prezent asigurată de centralele pe cărbune, din care 80% sunt operaționale din anii ‘70 -’80, necesitând astfel investiții semnifi cative pentru a respecta standardele de mediu. Sectorul de cărbune (huilă), va primi până în 2018 ajutor de stat și vor trebui închise până atunci cele 4 mine considerate în prezent viabile punct de vedere economic, în timp ce aproximativ 1.200 MW instalați în centralele de la Mintia și Paroșeni (parte a Complexului Energetic Hunedoara) vor trebui scoși din funcțiune. Mai mult, chiar Strategia Energetică 2012-2035 arată că aproximativ 13.540 MW vor fi dezafectați în sectorul energetic până în 2035, dintre care probabil mai mult de 30% din centralele cărbune. Având în vedere că guvernul actualizează în prezent strategia energetică (T1 2015), evaluarea opțiunilor de politici publice între electricitatea produsă din cărbune sau gaze naturale este esențială pentru deciziile viitoare din sectorul producției de energie electrică. Investițiile pot fi direcționate pentru remodelarea mixului energetic al țării, iar sprijinul (subvenții / ajutoare de stat în conformitate cu legislația europeană) ar trebui să fi e acordat tehnologiilor în mod specifi c sau prin măsuri de politici publice (de exemplu, scheme de tranzactionare a certifi catelor de CO2, liberalizarea completă a piețelor de energie). Dezvoltarea gazelor de șist în România în următorii 10 ani este puțin probabil să ducă la o schimbare a paradigmei în sectorul energiei electrice (așa cum s-a întâmplat în SUA), dar presiunea poate veni din creșterea prețurilor certifi catelor de CO2 care pot avea un impact semnifi cativ. Există, de asemenea, alte variabile care trebuie luate în considerare atunci când se evaluează

Romanian Statistical Review - Supplement nr. 5 / 201580
impactul economic al gazelor de șist în România: În primul rând, costurile de producție sunt în prezent necunoscute, deoarece există puține informații geologice actuale, în timp ce perimetrele sunt foarte diferite, cu foraje în aceeași zonă care pot duce la rezultate foarte diferite. Institutul Geologic din Polonia a estimat în 2011 că operațiunile din Polonia implică costuri de până la trei ori mai mari în comparație cu nivelurile din America de Nord, în timp ce costurile de producție au fost estimate a fi de până la 2-3 ori mai mari. Pragul exploatării rentabilitabile a gazelor de șist în UE se va situa la un nivel mai ridicat decât în Statele Unite. În al doilea rând, România are un sistem fi scal pe redevențe bazat pe venituri care necesită rate diferențiate impuse de valoarea producției de petrol, în funcție de producția, calitatea și nivelul producției de petrol și gaze pe rezervor. În prezent, în România taxa pentru hidrocarburile convenționale variază între 3,5-13% și sunt printre dintre cele mai scăzute din Europa. Nivelul redevențelor ar trebuie să fi e reevaluat în anul 2015. În al treilea rând, se spune că industria poate aduce locuri de muncă. Un studiu comandat de compania care explorează potențialul gazelor de șist în Marea Britanie, Cuadrilla (2014) arată că industria va crea 74.000 de locuri de muncă în Marea Britanie, în timp ce un studiu comandat de guvernul britanic arată că noile locuri de muncă create s-ar situa între 16.000-32.000 (inclusiv locurile de muncă indirecte). Având o abordare conservatoare, un studiu al Consiliului Mondial al Energiei din România (2013) ajunge la un total de 4.517 de locuri de muncă directe și 13.552 de locuri de muncă indirecte la nivel national. Cu toate acestea, având în vedere că aceasta este o industrie mai degrabă intensivă din punct de vedere al capitalului necesar, impactul general asupra ratei de ocupare a forței de muncă va fi nesemnifi cativ. În al patrulea rând, gaze naturale mai ieftin ar putea, în principiu îmbunătăți competitivitatea industriei mari consumatoare de energie și, în special a celei de petrochimie, oțel și aluminiu. Intr-un studiu lansat în 2014, compania de petrol și gaze ExxonMobil consideră că unul dintre principalele benefi cii aduse de exploatarea gazelor de șist este faptul că oferă un combustibil ieftin pentru industria petrochimică din SUA. În plus, același studiu prezintă argumentele pentru care cererea de produse petrochimice (îngrășăminte) va crește cu 50% până în 2020, în timp ce aproximativ 125 de proiecte noi cu o valoare a investițiilor estimată la 84 miliarde dolari vor fi efectuate până în 2020. Este posibil ca aceste noi proiecte să sporească oferta de produse petrochimice din America de Nord, care ar putea conduce la exportul produselor către Europa și la o concurență acerbă. Cu toate acestea, pentru a concluziona, cea mai importantă piesă a puzzle-ului în dezbatere pe gazele de șist este cantitatea de resurse viabile pe care România le deține ce pot fi exploatate din punct de vedere economic.

Revista Română de Statistică - Supliment nr. 5 / 2015 81
Concluzii
Deși resursele neconvenționale sunt răspândite pe tot globul, producția gazelor de șist va rămâne probabil concentrată în America de Nord, în timp ce factorii care au contribuit la creșterea semnifi cativă a producției cel mai probabil nu vor fi transpuși în mod alert în altă parte. Impactul evoluției gazelor de șist în România și Europa nu va fi similar cu boom-ul recent al gazelor de șist din Statele Unite și va fi cel mai probabil limitat și dezvoltat în mod progresiv. În general, este puțin probabil ca Europa să puncteze rezultate semnifi cative în ceea ce privește impactul gazelor de șist. Cu toate acestea, în funcție de nivelul de resurse și rolul gazelor naturale în mixul energetic, unele țări sunt susceptibile a prezenta efecte importante. Dacă România decide să producă gaze de șist (în cazul în care acest lucru este o resursă viabilă economic) și modul în care acest proces se deruleză vor avea un efect considerabil, nu numai asupra pieței domestic a energiei, dar și pe piețele energetice regionale. În concluzie, impactul economic global al resurselor de gaze neconvenționale ar trebui să fi e evaluat prin analize cost-benefi ciu naționale care să ia în considerare impactul direct și indirect, toate externalități, pozitive și negative.
Recunoaștere “Această lucrare a fost cofi nanţată din Fondul Social European, prin Programul Operaţional Sectorial Dezvoltarea Resurselor Umane 2007-2013, proiect numărul POSDRU/159/1.5/S/138907„Excelenţă în Cercetarea Ştiinţifi că, Interdisciplinară, Doctorală şi Postdoctorală, în Domeniile Economic, Social şi Medical - EXCELIS”, coordonator Academia de Studii Economice din Bucureşti”
Bibliografi e - Academia Științelor din Rusia, Institutul de Cercetare în Energie, Pespectivele în
sectorul energiei la nivel global și în Rusia, disponibil la http://www.eriras.ru/fi les/Global_and_Russian_energy_outlook_up_to_2040.pdf.
- ANRE (Autoritatea Națională de Reglementare în domeniul Energiei), Rapoarte anuale piața gazelor naturale disponibile la http://www.anre.ro/ro/gaze-naturale/rapoarte/rapoarte-piata-gaze-naturale.
- BP, 2014, Energy Outlook 2035 disponibil la http://www.bp.com/content/dam/bp/pdf/Energy-economics/Energy-Outlook/Energy_Outlook_2035_booklet.pdf.
- BP, 2014, Statistical Review of World Energy 2014, disponibil la: http://www.bp.com/content/dam/bp/pdf/Energy-economics/statistical-review-2014/BP-statistical-review-of-world-energy-2014-full-report.pdf.
- Broderick, J., Anderson, K., Wood, R., Gilbert, P., Sharmina, M., Footitt, A., 2011 Gazele de șist: o analiză recentă a impactului de mediu și schimbărilor climaterice, Manchester: Tyndall Centre, Universitatea Manchester.
Romanian Statistical Review - Supplement nr. 5 / 201582
- Cedigaz, 2015, Medium and Long Term Gas Outlook. - Comisia Europeană, DG JRC F.3 – Securitatea Energetică, 2012, Gazele de șist:
perspective și impact asupra piețelor de gaze din Europa, prezentare susținută în cadrul Conferinței de la Vilnius pe tema Securității Energetice, 05/11/2012.
- Comitetul Naţional Român al Consiliului Mondial al Energiei, 2013, Centgas, Resurse de gaze naturale din zăcăminte neconvenţionale, Potenţial şi valorifi care, noiembrie 2013, disponibil la http://www.cnr-cme.ro/pdf/Raport_CENTGAS_100%20pag.pdf.
- Consiliului Mondial al Energiei din România, 2013, Centgas, Resurse de gaze naturale din zăcăminte neconvenţionale, Potenţial şi valorifi care, noiembrie 2013, disponibil la http://www.cnr-cme.ro/pdf/Raport_CENTGAS_100%20pag.pdf.
- - Cuadrilla, 2014, conform mențiunilor Parlamentul Marii Britanii, disponibil la http://
www.publications.parliament.uk/pa/cm201415/cmselect/cmwelaf/284/28406.htm. - DG Energy, 2013, Raport Trimestrial Energie asupra Piețelor Europene de Gaze,
Market Observatory for Energy, Volumul 6, Primul Trimestru 2013. - Directiva 2010/31/EU din 19 Mai 2010 asupra performanței energetice a clădirilor. - Energy Informtion Administration, Prețul spot al gazelor naturale pe platforma Henry
Hub disponibil la http://www.eia.gov/dnav/ng/hist/rngwhhdm.htm. - Eurostat, Prețul gazelor în funcție de tipul de consumator, disponibil la: http://epp.
eurostat.ec.europa.eu/tgm/table.do?tab=table&init=1&language=en&pcode=ten00118&plugin=1.
- Eurostat, Consumul de cărbune în UE, 1998-2013, disponibil la: - http://ec.europa.eu/eurostat/statistics-explained/index.php/Coal_consumption_
statistics. - ExxonMobil Corporation, 2014, Dezvoltarea Resurselor Neconvenționale –
Administrarea Riscurilor, disponibil la: http://cdn.exxonmobil.com/~/media/global/Files/Other/2014/Unconventional_Resources_Development_Risk_Management_Report.
- Gas infrastructure Europe, Rolul și întrebuințarea GPL în 2013 și contribuțiile estimate pentru 2014, prezentare realizată de Wim Groenendijk, Președinte GLE, Gas Coordination Group, Bruxelles, 14 Februarie 2014.
- Global Public Policy Institute, Studiu de Politici Publice sprijinit de Comisia Europeană, Impactul gazelor de șist asupra securității energetice, Studiu de Politici Publice Nr 14, Februarie 2012.
- Institutul Geologic din Polonia, 2011, Gazele de șist – se schimbă aspectele economice și de reglementare la frontiera dintre Germania și Polonia, prezentare relizată în cadrul BSEC, Berlin, 01.12.2011, dispobilă la http://climatepolicyinitiative.org/wp-content/uploads/2012/03/2011-12-01-BSEC-Shale-Gas-Polish-Geological-Inst-P.-Poprova.pdf.
- International Energy Agency, 2013, World Energy Outlook. - Kavalov, B., Nathan Pelletier, N., 2012, Gaze de Șist pentru Europa – A revizuire
a literaturii cu privire la principalele aspecte sociale și de mediu, Joint Research Centre, Comisia Europeană.
- Kinnaman, T. C., 2011, Impactul economic al extracției de gaze de șist: O analiză a studiilor existente, Ecological Economics 70 (7), 1243-1249.
- Ministerul Economiei din România, 2012, Strategia Energetică a României 2012-2035.

Revista Română de Statistică - Supliment nr. 5 / 2015 83
- Ministerul Federal al Economie din Germniei. - Pearson, I., Zeniewski, P., Gracceva, F., Zastera, P., McGlade,C,, Sorrel, S., Speirs, J.,
Thonhauser , G., 2012, Gazele neconvenșionale: Impactul potențial asupra piețelor de energie din Europa, Comisia Europeană, Directorate General Joint Research Centre, Institutul pentru Energie și Transport.
- Poyry și Cambridge Econometrics, 2013, Efectele macroeconomice ale producției de gaze de șist în Europa, Studiu comisionat de Asociația Internațională a Producătorilor de Petrol și Gaze, disponibil la http://www.poyry.co.uk/sites/poyry.co.uk/fi les/public_report_ogp__v5_0.pdf.
- PwC, 2014, Sistemul de impozitre în industria de petrol și gaze, disponibil la http://www.ey.com/Publication/vwLUAssets/EY-Global-oil-and-gas-tax-guide-2014/$FILE/EY-Global-oil-and-gas-tax-guide-2014.pdf.
- Spencer, T., Sartor, O., Mathieu, M., 2014, Înțelepciunea neconvențională: o analiză economică a gazelor de șist și implicațiile pentru UE, IDDRI Studiul nr 2, Paris, disponibil la http://www.iddri.org/Publications/Collections/Syntheses/PB0514.pdf.
- Taskinsoy, J., 2013, Implicațiile Economice și Ecologice ale Fracturării Hidraulice, prezentare realizată în cadrul Conferinței WEI International Academic Conference, Antalia, Turcia, 14-16 ianuarie, 2013.
- Triple E Consulting – Energy, Environment & Economics B.V., 2014, Impactul Economic al gazelor de șist în Olanda, disponibil la http://www.tripleeconsulting.com/sites/default/fi les/Economic%20Impacts%20of%20Shale%20Gas%20in%20the%20Netherlands%20-%20FINAL%20REPORT.pdf.
Romanian Statistical Review - Supplement nr. 5 / 201584
KEY DETERMINANTS OF SHALE GAS IMPACT ON ENERGY PRICES
Valentina Ivan PhD Student Bucharest University of Economic Studies
Abstract
Recent advances in drilling technology have led to profi table extraction of natural gas from shale gas formations. Shale gas has changed the economics of natural gas production in US as the sudden increase in supply has resulted in signifi cantly lower gas prices. Starting 2008, the difference between gas prices in the United States and Europe has widened, with European gas prices even three times higher as compared to US ones. In North America, coal has been replaced by gas in the US electricity generating sector due to the sharp decrease of gas prices. Furthermore, coal reserves were partly exported to the EU, which has led to a decrease in prices in the EU and a replacement of gas by coal in the EU electricity sector. However, the effect cannot be entirely attributed to shale gas revolution, as other factors contributed such as minimum historical prices for carbon emission allowances in recent years and a decreasing consumption due to economic recession. The success of shale gas in the US has prompted companies and governments to assess the possibilities of replicating the shale gas production in Europe. Keywords: Hydraulic fracturing, shale gas, gas prices, coal prices, electricity prices JEL Classifi cation Code: O13, Q30, Q38, Q40, Q43
Introduction
US benefi ted of some prerequisites for success in developing unconventional gas resources such as political will and policy coherence; little resistance from local communities mainly because they are entitled to receive royalties in exchange for their mineral rights, situation completely different from Europe where the state owns natural resources; technological advances in hydraulic fracking; thorough mapping of natural resources and an existing infrastructure (pipeline networks) as well as an adequate service industry, able to provide equipment and skilled workforce. Europe faces different hurdles in developing its shale gas resources such as different geology, higher density population, more stringent regulatory framework in terms of environmental compliance – water management and land-use particularities. The impact
Revista Română de Statistică - Supliment nr. 5 / 2015 85
of shale gas on energy markets in Europe will be different from country to country, given the local demand for gas, social acceptability and the size of recoverable resources in each country. First, the article will briefl y point to the positive impact of developing shale gas resources in US and the indirect impact on energy prices at European level, highlighting predictions in terms of supply and demand. Second, it portrays the context in which unconventional gas resources can be developed in Romania. It does not intend to conduct a thorough cost-benefi t analysis on the economic impact of unconventional resources in Romania and provide a tally of all the likely benefi ts, but it will make predications in terms of natural gas supply and demand. The article will point to the main variables which should be considered when evaluating the impact: domestic demand and supply of natural gas, the impact of switching from coal fi red power plants to natural gas when producing electricity, the impact on the state budget (of fi scal regime, including royalties), the impact on energy-intensive industries such as the petrochemical sector. The article concludes that resource abundance is benefi cial to overall European economy; nonetheless, the impact of shale gas developments on Europe is expected to be limited and gradual, and not similar to the shale gas boom in the United States.
Methodology
The article reviews literature of international and in particular European shale gas developments emphasizing the economics of shale gas and impacts on energy markets in Europe with a key focus on gas, coal and electricity prices. Due to the novelty of the topic (shale gas revolution kicked off in America in 2008), there is a scarcity peer-reviewed articles on the economic impact of shale gas topic, with most of them focusing on the environmental impact or on geological aspects or technology used. Kinnaman (2011) argues that several reports were sponsored by the gas industry and have estimated the economic effects of the shale gas extraction on incomes, employment, and tax revenues. Still, there are articles that have been published in reputed economics journal, and are likely to be infl uential to the formation of public policy. The scholar concludes his review of main articles assessing the economic impact of shale gas in US by emphasizing that due to questionable assumptions of most of the studies, the economic impacts estimated in these reports are very likely overstated. The data and information used for this article is qualitative and quantitative secondary data from peer-reviewed journals and reports from international organisations, think-tanks, academic research institutions, as well as newspaper articles. The literature
Romanian Statistical Review - Supplement nr. 5 / 201586
review was conducted using search engines of popular academic databases, Google Scholar, JStor, ScienceDirect and Web of Science. Snowball sampling techniques were also employed, especially for the reports published by international agencies (such as International Energy Association or studies commissioned by European Commission) which provided a comprehensive and trustworthy list of references. Due to the relatively nascent stage of the literature on shale gas in Europe, grey literature searches were also conducted, predominantly through Google. The research was supported by desk research, and participation in several unconventional gas conferences. The article has reviewed data sets provided by Energy Information Association, International Energy Association, Russian Academy Society which also provided forecasts and scenarios regarding production levels of shale gas in US and Europe. Those are the best available knowledge from an authoritative and un-biased source, with good, publicly available data sets. Data reviewed concerns gas prices, coal prices, and electricity prices.
Impact on European energy prices and supply and demand estimates
Overall, in terms of perception on the impact of shale gas, there are two sides: one that believes that it will create jobs, bring revenues to the state budget and have a positive impact on GDP, reduce CO2 emissions and slowdown global warming, achieve energy independence and increased purchasing power for local communities; and another side which believes that shale gas pollutes groundwater, generates more CO2 emissions than coal or gas from conventional sources and negatively impacts human health and leads to environmental disasters. The literature on the issue varies between these two extremes: some sources overstate economic benefi ts, while others exaggerate environmental impact. A decrease in energy prices in Europe will be benefi cial as it has the potential to reduce oil and gas imports and thus lower EU’s import bill; second, low gas prices can help energy intensive industries (especially the steel and petrochemical plants) and improve their competitiveness; third, shale gas represents a cheaper opportunity to reduce carbon emissions, considering that natural gas has an increased effi ciency as compared to coal. Pöyry and Cambridge Econometrics (2013) assess the macro-economic impact of shale gas production in Europe and conclude that shale gas could add a total of € 1.7 trillion to 3.8 trillion to the European economy between 2020 and 2050. However, in spite of the some visible benefi ts portrayed by shale gas production in US on domestic energy security and the energy markets, there are still fears that shale gas could have negative impacts on the environment and human health. Although several countries in Europe are currently exploring potential

Revista Română de Statistică - Supliment nr. 5 / 2015 87
for commercially viable shale gas resources, the process of getting into the production phase has been much slower as compared to the North American region. In 2010, the average gas spot price at the Henry Hub in the US was only $4 per Million British Thermal Units (MBtu), while in 2008 it was for about $8-9 per MBtu (see Figure 1 below). In 2010, compared to other regions which are not producing shale gas, the US gas price of $4 per MBtu was considerably lower than for example in Continental Europe ($8/MBtu) or in Japan ($11/MBtu). In only fi ve years’ a shale gas boom has taken place in the United States that has reduced domestic gas prices to one third of the previous price. The spot natural gas price at Henry Hub averaged $4.32/MMBtu in 2014, 16% higher than in 2013.
Natural gas spot price at Henry HubFigure 1
Source: EIA
Natural gas commodity prices have signifi cantly declined since 2008 mainly due to the rising domestic production of shale gas, as well a moderate demand which had positive impact over consumers (from homeowners to businesses), the transportation sector, and power generation. Two forecasts for future gas prices provided by reputed organisations in this respect will be taken into consideration (see fi gure 2). The fi rst one is based on the 2013 World Energy Outlook of the International Energy Agency (IEA). The second forecast is taken from the Global and Russian Energy Outlook of the Energy Search Institute of the Russian Academy of Sciences. This article assumes that that these two predictions can be considered as the minimum scenario (RAS forecast) and maximum (IEA forecast) for gas prices in Europe. The International Energy Agency expects gas demand to increase only slightly in the next 20 years, as it believes renewables will continue to gain importance in the power sector. However, gas demand will not fall as the agency believes gas will replace aging coal and nuclear power plants, in particular aging hard coal plants which will be put offl ine because of air pollution legislation and

Romanian Statistical Review - Supplement nr. 5 / 201588
higher CO2 prices. On the other hand, the IEA also expects more nuclear power plants to be retired than built. Both assumptions mean that gas will remain a key fuel in the European fuel mix and as a result its prices will rise, albeit slowly. On the other hand, the Russian Academy of Sciences believes that until 2030 Europe will experience a decline in gas prices, mainly caused by low demand and oversupply of gas. Only after 2030 will prices start to rise as increased demand in Asia will put pressure on European prices and will lead to increase.
Forecasts of future gas prices in EuropeFigure 2
22,46 22,46 22,4625,26
26,80
31,03 31,29 32,08 33,12
10
15
20
25
30
35
2013 2020 2025 2030 2035
€/MWh
RAS
IEA
Source: IEA, RAS
Shale gas developments in the United States have lead to a shift from coal to gas in the United States electricity sector and from gas to coal in the EU electricity sector. The signifi cant drop in gas prices in US due to the shale gas boom made coal reserves in US redundant. Those were redirected towards other markets, and in particular European and Asian. Coal reserves were partly exported to the EU, which decreased coal prices in the EU and gas was replaced by coal in the electricity sector. Over the longer term however, coal import prices to the EU have not decreased, neither has overall coal import to the EU increased. Therefore, the exact contribution of US shale gas developments to the gas-coal fuel shift in EU electricity supply is not proven. The article argues that there are more relevant factors such as historically low prices for CO2 emission certifi cates which are more likely to have contributed to the gas-to-coal shift within Europe. In Europe, natural gas could have a role in replacement of outdated (coal fi red) production capacity. According to the EIA (2012), using natural gas to produce electricity generates only 20% of total emissions when burning coal. In 2008, for the fi rst time since 1990, CO2 emissions have decreased
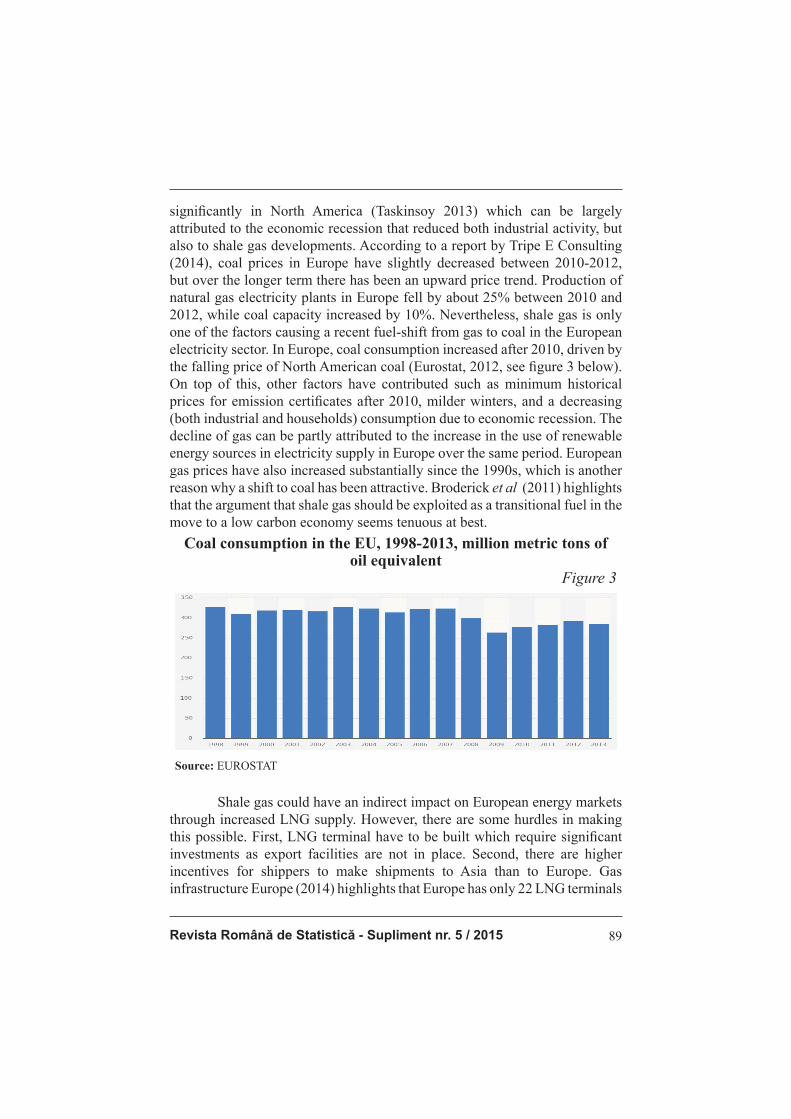
Revista Română de Statistică - Supliment nr. 5 / 2015 89
signifi cantly in North America (Taskinsoy 2013) which can be largely attributed to the economic recession that reduced both industrial activity, but also to shale gas developments. According to a report by Tripe E Consulting (2014), coal prices in Europe have slightly decreased between 2010-2012, but over the longer term there has been an upward price trend. Production of natural gas electricity plants in Europe fell by about 25% between 2010 and 2012, while coal capacity increased by 10%. Nevertheless, shale gas is only one of the factors causing a recent fuel-shift from gas to coal in the European electricity sector. In Europe, coal consumption increased after 2010, driven by the falling price of North American coal (Eurostat, 2012, see fi gure 3 below). On top of this, other factors have contributed such as minimum historical prices for emission certifi cates after 2010, milder winters, and a decreasing (both industrial and households) consumption due to economic recession. The decline of gas can be partly attributed to the increase in the use of renewable energy sources in electricity supply in Europe over the same period. European gas prices have also increased substantially since the 1990s, which is another reason why a shift to coal has been attractive. Broderick et al (2011) highlights that the argument that shale gas should be exploited as a transitional fuel in the move to a low carbon economy seems tenuous at best.
Coal consumption in the EU, 1998-2013, million metric tons of oil equivalent
Figure 3
Source: EUROSTAT
Shale gas could have an indirect impact on European energy markets through increased LNG supply. However, there are some hurdles in making this possible. First, LNG terminal have to be built which require signifi cant investments as export facilities are not in place. Second, there are higher incentives for shippers to make shipments to Asia than to Europe. Gas infrastructure Europe (2014) highlights that Europe has only 22 LNG terminals

Romanian Statistical Review - Supplement nr. 5 / 201590
(190 bcm) while other 6 are under construction (30 bcm). The gas consumption in Europe in 2012 was 511 bcm, out of which 161 bcm came from the Russian Federation (31.5%), while only 64 bcm came through the LNG terminals (12.5%) according to data from DG Energy (2013). As of January 2014, the U.S. Department of Energy (DOE) has approved fi ve applications (94 bcm / annum) for permits to export liquefi ed natural gas (LNG) from the east coast to trade agreement nations. The cost of LNG may further increase if large LNG quantities from Middle East are shipped to Japan and South-East Asia. In particular Japan has become large LNG shipping destination following closure of nuclear power plants following the Fukushima accident. Gas trades at close to € 40/MWh in Japan, giving more incentives to shippers to make shipments to Japan rather than to Europe were it is traded at slightly over € 20/MWh. According to a GPPi Policy Paper (2012) supported by EC, European gas markets are in fl ux. In most of the OECD world, gas demand has faltered, a result of the fi nancial and economic crisis. Furthermore, in Europe, shale gas will compete with abundant availability of piped gas from countries like Russia, Norway, Algeria and others, as well as mega infrastructure projects that are currently developed. In these circumstances, it is hard to predict that shale gas production could lead to a signifi cant drop in the price of natural gas in the EU in the coming decades. Shale gas import as LNG to the EU will be limited until 2020, due to limited export capacities in the US. From 2020-2035 this will probably no longer be a limiting factor considering the current investments in infrastructure. Many additional LNG terminals are planned in the US, and these are expected to come online after 2020. The expected decrease in gas prices is mainly driven by weak European demand. This is caused by deployment of a large number of wind and solar plants (for example, 75GW in Germany as of 1Q 2014) on the wholesale electricity market, causing a reduction in electricity prices. This is because wind and solar power plants have 0 marginal cost of production and therefore move more expensive sources out of the market. Nonetheless, the demand for gas will stay low as Germany will continue adding wind and solar capacity eventually reaching 50% of German consumption in 2030 (see fi gure 4 below). This will keep power prices down and gas-fi red plants out of merit order, while hard-coal prices are likely to fall given robust supply of cheap coal from Columbia and South Africa. The efforts undertaken by the European Commission to reform the CO2 market will (if implemented) manage to revive the CO2 market only from 2021 onwards. As a result, hard-coal will remain a viable substitute for gas, pushing demand down. Finally, energy effi ciency measures will signifi cantly hamper demand. In particular a requirement that all new public buildings be nearly zero-energy buildings
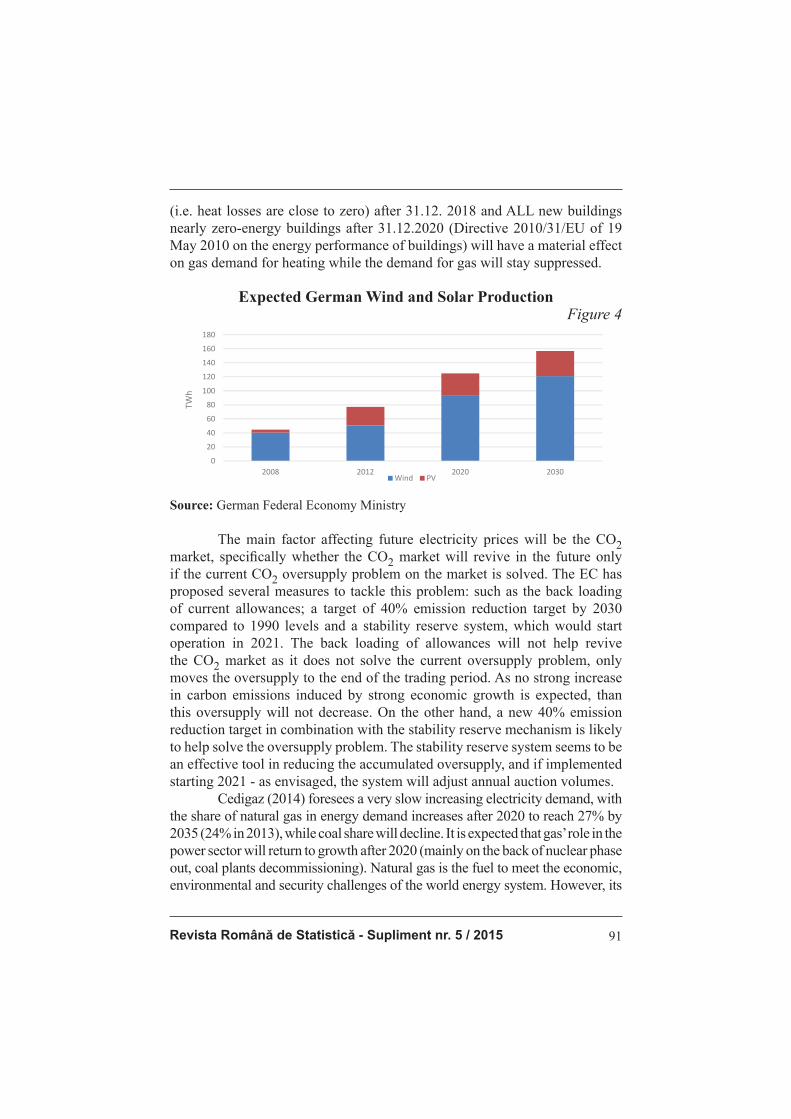
Revista Română de Statistică - Supliment nr. 5 / 2015 91
(i.e. heat losses are close to zero) after 31.12. 2018 and ALL new buildings nearly zero-energy buildings after 31.12.2020 (Directive 2010/31/EU of 19 May 2010 on the energy performance of buildings) will have a material effect on gas demand for heating while the demand for gas will stay suppressed.
Expected German Wind and Solar ProductionFigure 4
0
20
40
60
80
100
120
140
160
180
2008 2012 2020 2030
TWh
Wind PV
Source: German Federal Economy Ministry The main factor affecting future electricity prices will be the CO2 market, specifi cally whether the CO2 market will revive in the future only if the current CO2 oversupply problem on the market is solved. The EC has proposed several measures to tackle this problem: such as the back loading of current allowances; a target of 40% emission reduction target by 2030 compared to 1990 levels and a stability reserve system, which would start operation in 2021. The back loading of allowances will not help revive the CO2 market as it does not solve the current oversupply problem, only moves the oversupply to the end of the trading period. As no strong increase in carbon emissions induced by strong economic growth is expected, than this oversupply will not decrease. On the other hand, a new 40% emission reduction target in combination with the stability reserve mechanism is likely to help solve the oversupply problem. The stability reserve system seems to be an effective tool in reducing the accumulated oversupply, and if implemented starting 2021 - as envisaged, the system will adjust annual auction volumes. Cedigaz (2014) foresees a very slow increasing electricity demand, with the share of natural gas in energy demand increases after 2020 to reach 27% by 2035 (24% in 2013), while coal share will decline. It is expected that gas’ role in the power sector will return to growth after 2020 (mainly on the back of nuclear phase out, coal plants decommissioning). Natural gas is the fuel to meet the economic, environmental and security challenges of the world energy system. However, its

Romanian Statistical Review - Supplement nr. 5 / 201592
competiveness is highly dependent on the energy policies and implementation of appropriate environmental regulations. It is unlikely that EU could reproduce US experience in terms of level of production. There are signifi cant uncertainties regarding the amount of technical recoverable resources. A medium case scenario developed by Thomas et al (2014) put forward the argument that EU could cover about 3-10% of total demand from unconventional gas resources by 2035. Thus, the import dependency on fossil fuels is likely to grow, with prices determined by international markets. BP, in its World Energy Outlook 2035 published in 2014 argues that shale gas will have a modest contribution of only 6% in covering the demand, with import dependency rising from current 60-65% at present to 84% by 2035 mainly on the back of the decline in international supply. Europe is likely to kick of production of unconventional gas resources no earlier than 2017, but it does not have high chances of becoming an important player (Kavalov and Pelletier, 2012) due to geological, social, ecological, political, technical-economical and business environment limitations, and more recent due o a signifi cant drop in international oil prices. Another study commissioned by EC (Pearson et al, 2012) emphasizes that European shale gas is likely to have a signifi cant impact on international markets only under optimistic scenarios with regard to production costs and technically and economically recoverable resources and a more important role in setting up a more liquid European market, more integrated and competitive. Romanian context: Supply and demand of natural gas and the impact of
shale gas According to BP Statistical Review of World Energy 2014, Romania’s natural gas reserves in 2012 were 100 Bcm, about 1/5 compared to 1992 level. The Romanian energy strategy estimates that Romanian gas reserves will gradually diminish by 2020, as presented in fi gure 5 below. The rate of decline of hydrocarbon reserves is 10% per year, which means that the dependence on gas imports will increase in the next 15 years from about up to10% today to 50% (as foreseen by Romanian Energy Strategy 2012-2035). Local gas production is expected to decline to 5.3 Bcm by 2021, requiring annual imports of 13.6 Bcm, unless new gas deposits are developed. A number of new, relatively small natural gas plays or rejuvenation of depleted oil fi elds could possibly slow down the rate of decline in domestic supply, as could the development of a major offshore fi eld, which is currently being explored (resources have been estimated at up to 84 Bcm) and technically and commercially available unconventional resources (shale gas) could add to the country’s fuel mix starting with 2020.

Revista Română de Statistică - Supliment nr. 5 / 2015 93
Natural gas reserves: historical and projection (Bcm)Figure 5
170162 155 148 141 134 127 120 114 107 101 95 89 83 77
0
20
40
60
80
100
120
140
160
180
2006 2007 2008 2009 2010 2011 2012 2013 2014 2015 2016 2017 2018 2019 2020
bcm
Source: Romanian Energy Strategy 2012-2035 (March, 2012)
A study conducted by PwC (2014) shows that gas production in Romania incurs higher costs and lower effi ciency as compared to other European countries: for example, the operating costs for a gas well in Romania are $ 17/barrel of oil equivalent (boe), compared to Croatia, Denmark and Poland ($ 12/boe), Norway (7 $/boe) and Italy ($ 10/boe) while the average 21 boe /well /day recorded in Romania is the lowest production rate from the countries surveyed. Most likely, fossil fuels will remain a dominant source of electricity production in Romania in the decades to come. Currently, natural gas accounts for 20% of the country’s energy mix, and is expected to grow insignifi cantly in the following years gradually picking up after 2020 mainly due to possible new gas fi red power plants coming online and higher industrial consumption. By 2020, gas consumption can slightly increase for the following reasons: • new installed capacities in gas fi red power plants are likely to go
online by 2020 ( this includes the retrofi tting of old gas fi red power plants and new plants), but this will not change the balance as other legacy plants will be decommissioned;
• household consumption is likely to go up due to an increasing number of households disconnected from the district heating system and switching to gas fi red individual boilers (nonetheless, the impact will probably be cancelled by the fact that municipalities are becoming more effi cient and signifi cant investments are being made into insulating buildings and implementing energy effi ciency measures);
• however, industrial consumption will not be a driver as some of the petrochemical plants (one of the largest consumers in Romania)
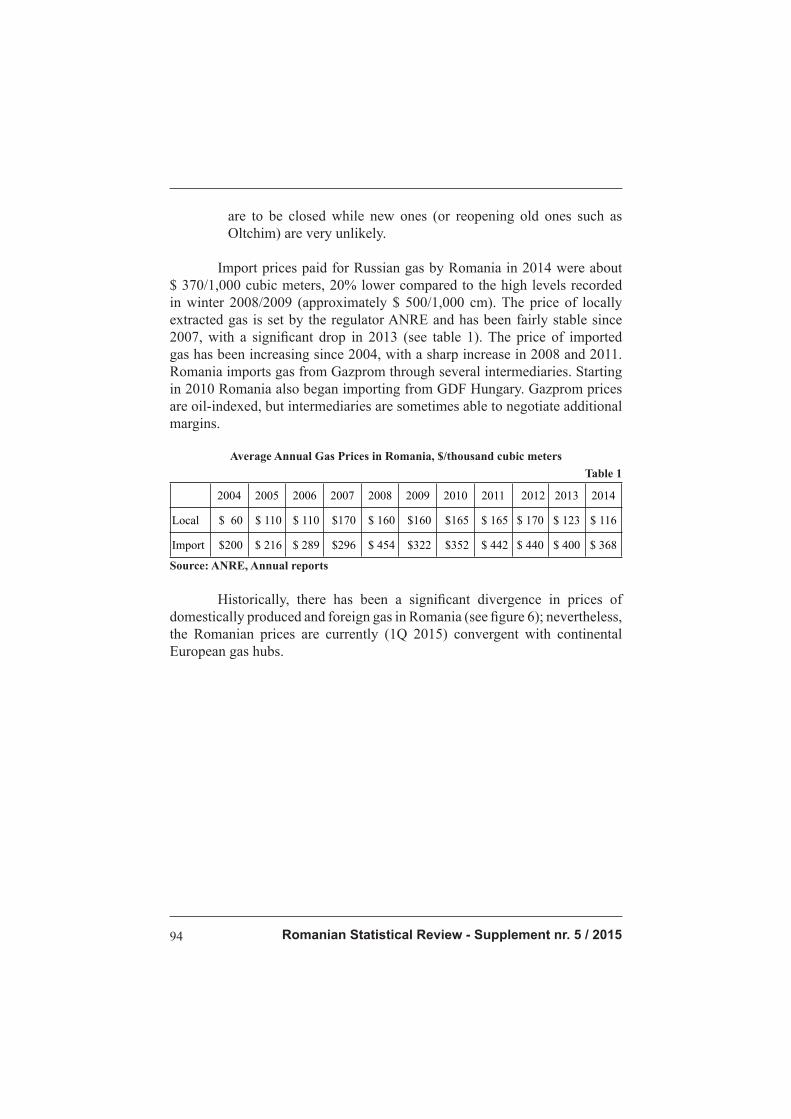
Romanian Statistical Review - Supplement nr. 5 / 201594
are to be closed while new ones (or reopening old ones such as Oltchim) are very unlikely.
Import prices paid for Russian gas by Romania in 2014 were about $ 370/1,000 cubic meters, 20% lower compared to the high levels recorded in winter 2008/2009 (approximately $ 500/1,000 cm). The price of locally extracted gas is set by the regulator ANRE and has been fairly stable since 2007, with a signifi cant drop in 2013 (see table 1). The price of imported gas has been increasing since 2004, with a sharp increase in 2008 and 2011. Romania imports gas from Gazprom through several intermediaries. Starting in 2010 Romania also began importing from GDF Hungary. Gazprom prices are oil-indexed, but intermediaries are sometimes able to negotiate additional margins.
Average Annual Gas Prices in Romania, $/thousand cubic meters Table 1
2004 2005 2006 2007 2008 2009 2010 2011 2012 2013 2014
Local $ 60 $ 110 $ 110 $170 $ 160 $160 $165 $ 165 $ 170 $ 123 $ 116
Import $200 $ 216 $ 289 $296 $ 454 $322 $352 $ 442 $ 440 $ 400 $ 368
Source: ANRE, Annual reports
Historically, there has been a signifi cant divergence in prices of domestically produced and foreign gas in Romania (see fi gure 6); nevertheless, the Romanian prices are currently (1Q 2015) convergent with continental European gas hubs.

Revista Română de Statistică - Supliment nr. 5 / 2015 95
Price of imported gas in Romania and price of natural gas on the German border
Figure 6
200250300350400450500550600650700
$/tcmRussian gas on Romanian border
Russian gas on German border
Source: ANRE
Wholesale Gas prices in Europe will continue to converge as infrastructure is developed and the European states are better interconnected. This will result in a stronger convergence of wholesale gas prices in European gas hubs. Most likely, CEGH gas hub (Baumgarten) would become an important price reference hub for Romania in case of market liberalisation as it is geographically the nearest hub and is already favoured by Romanian traders, aside from being already the leading gas hub in Central Europe. NCG is one of Germany’s major gas hubs, serving as a reference price for large volume of continental gas products. There is no reason to assume that Romanian gas hub prices would be an exception and would not converge with European gas prices over time. Therefore, it is assumed that the price at which gas from unconventional resources will be traded will be similar to the one on European gas hubs. For an average Romanian, the most perceptible consequence of shale gas production in Romania will probably be the reduction of natural gas prices. The natural gas price for households, one of the lowest in Europe (Eurostat) is currently the outcome of a regulated (gas basket) price mechanism aimed to guarantee equal access to import and domestic gas to all participants, to ensure a lower depletion rate of domestic resources and to protect vulnerable consumers. Nevertheless, the mechanism has caused distortions on the competitive market, which had to be over-regulated. The market for households is due to be liberalised and this will mean abolishing the gas basket mechanism and thus gradually increasing the price for the end
Romanian Statistical Review - Supplement nr. 5 / 201596
consumers. The entry of new gas sources into the country’s fuel mix will not signifi cantly decrease the gas prices for households which are projected to increase due to the gas market liberalisation calendar. In Romania, at least until 2020, substitution between coal fi red and gas fi red capacities when producing electricity will be limited, and the country is unlikely to witness a hash for gas. Nevertheless, Romania is in the process of closing the last four hard coal mines (by 2018), with lignite mines to remain operational. Romania imports coal, but the share of imported coal has dropped to a quarter compared to 1990 (IEA). For social reasons, Romania imported insignifi cant coal quantities, although locally produced lignite has a relatively low calorifi c value compared with coal from Czech Republic and Germany, and production costs are even higher than production costs in other countries. About 30% of electricity in Romania is currently provided by coal fi red plants, 80% of which went into operation in the ‘70–‘80s, thus requiring signifi cant investment to comply with environmental standards. Coal sector (hard coal) will receive by 2018 state aid and will have to close by then the 4 mines currently considered economically viable, while about 1,200 MW in Mintia and Paroşeni (part of Hunedoara Energy Compound) to be taken offl ine. Moreover, even the Energy Strategy 2012-2035 states that about 13,540 MW will be decommissioned in the energy sector by 2035, of which probably more than 30% of coal powered units. Since the government is currently updating the energy strategy (1Q 2015), assessment of policy options between coal and gas energy is essential for future decisions in the electricity production sector. Investments may be directed to reshape the country’s fuel mix and the support (subsidies / state aid according to European legislation) to be granted to specifi c technologies or through public policy measures (for example, trading CO2 certifi cates schemes or full energy markets liberalization). The development of shale gas in Romania in the next 10 years is unlikely to lead to a paradigm shift in the electricity sector (as it happened in the USA), but pressure coming from increasing CO2 prices can have a signifi cant impact. There are also other variables to be taken into consideration when assessing the economic impact of shale gas in Romania: First, production costs are currently unknown as there is little current geological information, while perimeters differentiate a lot, with wells in the same area showing different results. Polish Geological Institute estimated in 2011 that the operations in Poland will imply costs up to three times higher when compared with levels in North America; while production costs were estimated to be up to 2-3 times higher. Breakeven exploitation of shale gas in the EU will be higher than in the United States. Second, Romania has a royalty tax system based on income that requires differentiated rates imposed on the value of oil production, depending on the production, quality and level of oil production
Revista Română de Statistică - Supliment nr. 5 / 2015 97
per reservoir. Currently in Romania, conventional hydrocarbons are charged fees ranging from 3.5 to 13% and are one of the lowest in Europe. Royalties’ levels are to be reassessed end of 2014. Third, it is said that the industry can bring jobs. An industry study commissioned by the company exploring shale gas potential in the UK, Cuadrilla (2014) shows that the industry will create 74,000 jobs in the U.K., while government study shows that the new jobs created would amount between 16,000-32,000 (including indirect jobs). Following a conservative line, a study by Romanian member committee of World Energy Council (2013) reaches a total of 4,517 direct jobs and 13,552 indirect jobs nationally. Nevertheless, considering that this is a more capital intensive industry, the overall employment impact will be insignifi cant. Fourth, cheaper gas could, in principle improve the competitiveness of energy intensive industry and in particular petrochemical, steel and aluminium one. ExxonMobil (2014) believes that one of the main benefi ts of shale gas is to provide cheap fuel for petrochemical industry in the USA. Furthermore, the same study puts forward the arguments for which the demand for petrochemical products (fertilizers) will increase by 50% by 2020, while about 125 new projects with an estimated investment value of $ 84 billion are to be carried by 2020. It is possible that these new projects will lead to oversupply of petrochemicals in North America, and commodities’ export to Europe, leading to fi erce competition. Nevertheless, to conclude with, the most important piece to the puzzle is the amount of economically viable shale gas resources that Romania holds.
Conclusion
Although unconventional resources are spread across the globe, production is likely to remain concentrated in North America while factors that have contributed to the dramatic growth of production are unlikely to be quickly replicated elsewhere. The impact of shale gas developments in Romania and Europe will not be similar to the recent shale gas boom in the United States and will most likely be limited and gradual. Overall, Europe is unlikely to score signifi cant results in terms of impact of shale gas. However, depending on the level of resources and role of natural gas in the fuel mix, some countries are likely to witness important effects. Whether Romania decides to produce shale gas itself (if this is an economically viable resource) and how this plays out will have a considerable effect not only on its own energy market, but also on the regional energy markets. To conclude with, the overall socio economic impact of unconventional gas resources should be subject to a national cost-benefi t analysis, which will take into consideration direct and indirect impact, all externalities, positive and negatives.

Romanian Statistical Review - Supplement nr. 5 / 201598
Acknowledgement „This paper was co-fi nanced from the European Social Fund, through the Sectorial Operational Programme Human Resources Development 2007-2013, project number POSDRU/159/1.5/S/138907 “Excellence in scientifi c interdisciplinary research, doctoral and postdoctoral, in the economic, social and medical fi elds -EXCELIS”, coordinator The Bucharest University of Economic Studies”.
References - ANRE (Autoritatea Naționala de Reglementare în domeniul Energiei), Annual gas
market reports available at http://www.anre.ro/ro/gaze-naturale/rapoarte/rapoarte-piata-gaze-naturale.
- BP, 2014, Statistical Review of World Energy 2014, available at: http://www.bp.com/content/dam/bp/pdf/Energy-economics/statistical-review-2014/BP-statistical-review-of-world-energy-2014-full-report.pdf.
- BP, 2014, Energy Outlook 2035 available at http://www.bp.com/content/dam/bp/pdf/Energy-economics/Energy-Outlook/Energy_Outlook_2035_booklet.pdf.
- Broderick, J., Anderson, K., Wood, R., Gilbert, P., Sharmina, M., Footitt, A., 2011, Shale gas: an updated assessment of environmental and climate change impacts. Manchester: The Tyndall Centre, University of Manchester.
- Cedigaz, 2015, Medium and Long Term Gas Outlook. - Cuadrilla Study, 2014, as reported by UK Parliament, http://www.publications.
parliament.uk/pa/cm201415/cmselect/cmwelaf/284/28406.htm. - DG Energy, 2013, Quarterly Report Energy on European Gas Markets, Market
Observatory for Energy, Volume 6, First quarter 2013. - Directive 2010/31/EU of 19 May 2010 on the energy performance of buildings. - Energy Informtion Administration, Natural gas spot price at Henry Hub, available
at http://www.eia.gov/dnav/ng/hist/rngwhhdm.htm. - European Comission, DG JRC F.3 – Energy Security, 2012, Shale Gas: perspectives
and impact to the gas market in Europe, presentation delivered in Vilnius Conference on Energy Security, 15/11/2012.
- Eurostat, Gas prices by type of users, available at: http://epp.eurostat.ec.europa.eu/tgm/table.do?tab=table&init=1&language=en&pcode=ten00118&plugin=1.
- Eurostat, Coal consumption in the EU, 1998-2013, available - http://ec.europa.eu/eurostat/statistics-explained/index.php/Coal_consumption_
statistics. - ExxonMobil Corporation, 2014, Unconventional Resources Development-Managing
the Risks. - Gas infrastructure Europe, Use and role of LNG in 2013 and expected contribution
to SoS in 2014, presentation delivered by Wim Groenendijk, GLE President, Gas Coordination Group, Brussels, 14 February 2014.
- German Federal Economy Ministry. - Global Public Policy Institute, Policy Paper supported by EC, The Impact of Shale
Gas on European Energy Security, Policy Paper No. 14, Berlin, February 2012. - International Energy Agency 2013 World Energy Outlook. - Kavalov, B., Nathan Pelletier, N., 2012, Shale Gas for Europe – Main Environmental
Revista Română de Statistică - Supliment nr. 5 / 2015 99
and Social Considerations A Literature Review, Joint Research Centre, European Commission.
- Kinnaman, T. C., 2011, The economic impact of shale gas extraction: A review of existing studies. Ecological Economics 70 (7), 1243-1249.
- Pearson, I., Zeniewski, P., Gracceva, F., Zastera, P., McGlade,C,, Sorrel, S., Speirs, J., Thonhauser , G., 2012, Unconventional Gas: Potential Energy Market Impacts in the European Union, European Commission, Directorate General Joint Research Centre, Institute for Energy and Transport.
- Polish Geological Institute, 2011, Shale gas –do economics and regulation change at the German-Polish border, presentation delivered within BSEC, Berlin, 01.12.2011 available at http://climatepolicyinitiative.org/wp-content/uploads/2012/03/2011-12-01-BSEC-Shale-Gas-Polish-Geological-Inst-P.-Poprova.pdf.
- Poyry and Cambridge Econometrics, 2013, Macroeconomic effects of European shale gas production, report to the International Association of Oil and Gas Producers, available at http://www.poyry.co.uk/sites/poyry.co.uk/fi les/public_report_ogp__v5_0.pdf.
- PwC, 2013, Tax system for oil and gas industry, available at http://www.ey.com/Publication/vwLUAssets/EY-Global-oil-and-gas-tax-guide-2014/$FILE/EY-Global-oil-and-gas-tax-guide-2014.pdf.
- Romanian Ministry of Economy, 2012, Romanian Energy Strategy 2012-2035. - Russian Academy of Sciences, Energy Research Institute, 2013, Global and Russian
Energy Outlook up to 2040, available at http://www.eriras.ru/fi les/Global_and_Russian_energy_outlook_up_to_2040.pdf.
- Taskinsoy, J., 2013, Economic and Ecological Implications of Hydraulic Fracturing, presentation delivered within the WEI International Academic Conference, Antalya, Turkey, 14-16 January, 2013.
- Spencer, T., Sartor, O., Mathieu, M., 2014, Unconventional wisdom: an economic analysis of US shale gas and implications for the EU, IDDRI Study no2, Paris, available at http://www.iddri.org/Publications/Collections/Syntheses/PB0514.pdf.
- Triple E Consulting – Energy, Environment & Economics B.V., 2014, Economic Impacts of Shale Gas in the Netherlands, available at http://www.tripleeconsulting.com/sites/default/fi les/Economic%20Impacts%20of%20Shale%20Gas%20in%20the%20Netherlands%20-%20FINAL%20REPORT.pdf.
- World Energy Council of Romania, 2013, Centgas, Gas resources from unconventional formation, Potential and development, November 2013, available at http://www.cnr-cme.ro/pdf/Raport_CENTGAS_100%20pag.pdf.

Romanian Statistical Review - Supplement nr. 5 / 2015100
Director: Cristina SACALĂEchipa logistică:
Oana NICOLAU, Costin GOGONEA, Adrian VIŞOIU
Condiţii pentru prezentarea materialelor spre publicare
Lucrările ştiinţifi ce sau tehnice, originale, se pot prezenta redacţiei spre publicare fi e sub formă de articole, fi e sub formă de scurte comunicări în limba română şi în limba engleză (traducere integrală). Precizările privind condiţiile tehnice pentru predarea materialelor se afl ă pe site-ul www.revistadestatistica.ro, secţiunea „Procesul de recenzare”.
Conditions for the articles designated for the Romanian Statistical Review
The original scientifi c or technical works can be sent to be published either under article form or short communications in Romanian and English (complete translation). The technical conditions for the articles to be presented can be found at www.revistadestatistica.ro in the “Peer review” section.
ISSN 1018-046X
Reproducerea conţinutului articolelor fără acordul Institutului Naţional de Statistică este interzisă, iar utilizarea conţinutului acestei publicaţii, cu titlul explicativ sau justifi cativ, în diferite lucrări este autorizată numai cu precizarea clară a sursei.
Se precizează că punctele de vedere, datele şi informaţiile cuprinse în articolele publicate aparţin autorilor şi nu angajează răspunderea Institutului Naţional de Statistică