CONSERVAREA CALITĂII APEI I PROTECIEI MEDIULUI ÎN …...PIB în anul 2004 ajungând la 2,0 –...
174
Transcript of CONSERVAREA CALITĂII APEI I PROTECIEI MEDIULUI ÎN …...PIB în anul 2004 ajungând la 2,0 –...

Revista Română de Statistică - Supliment nr. 9 / 2017
SUMAR / CONTENTS 9/2017REVISTA ROMÂNĂ DE STATISTICĂ SUPLIMENT
ANALIZA STRATEGIEI UNIUNII EUROPENE ÎN DOMENIUL ŞTIINŢEI ŞI TEHNOLOGIEI 3ANALYSIS OF THE EUROPEAN UNION’S SCIENCE AND TECHNOLOGY STRATEGY 17Prof. Constantin ANGHELACHE PhDAssoc. prof. Mădălina-Gabriela ANGHEL PhDAndreea – Ioana MARINESCU Ph.D Student Maria MIREA PhD Student
SPECIFIC APPROACHES TO YHE METHODOLOGY OF THE INDUSTRIAL PRODUCTION INDEX CALCULATION AT COUNTY LEVEL 31
Viorel Ţarcă, PhD.
DEZVOLTAREA SOCIETĂŢII INFORMAŢIONALE ÎN UNIUNEA EUROPEANĂ ŞI STATELE MEMBRE 47THE DEVELOPING THE INFORMATION SOCIETY IN THE EUROPEAN UNION AND THE MEMBER STATES 55Assoc. prof. Mădălina-Gabriela ANGHEL PhD Prof. Constantin ANGHELACHE PhDProf. Radu Titus MARINESCU PhD
ANALIZĂ ÎN SISTEM GIS A ATRACTIVITĂŢII REŢELEI DE LOCALITĂŢI URBANE ŞI RURALE PENTRU EVALUAREA FACTORILOR COMPETITIVI LA NIVEL NAŢIONAL 62 GIS MATHEMATIC MODEL ANALYZING THE ATTRACTIVENESS OF THE ROMANIAN SETTLEMENTS NETWORK, ASSESSING THE COMPETITIVENESS FACTORS AT NATIONAL LEVEL83 Main researcher 3 Antonio TACHE Main researcher 3 Oana-Cătălina PopescuMain researcher Monica Tache
ANALIZA STRATEGIEI ROMÂNIEI DE ALINIERE LA DIRECTIVELE UNIUNII EUROPENE ÎN DOMENIUL MEDIULUI 103ANALYSIS OF ROMANIA’S STRATEGY OF ALIGNMENT WITH THE EU ENVIRONMENTAL DIRECTIVES 116Prof. Constantin ANGHELACHE PhD Assoc. prof. Mădălina-Gabriela ANGHEL PhD Lecturer Ana CARP PhD
www.revistadestatistica.ro/supliment
Romanian Statistical Review - Supplement nr. 9 / 20172
CALITATEA MEDIULUI ÎNCONJURĂTOR – FACTOR AL CREŞTERII SUSTENABILE 128QUALITY OF THE ENVIRONMENT - A FACTOR OF SUSTAINABLE GROWTH 141Assoc. prof. Mădălina-Gabriela ANGHEL PhD Assoc. prof. Florin Paul Costel LILEA PhD Ec. Ștefan Gabriel DUMBRAVĂ
CONSERVAREA CALITĂŢII APEI ŞI PROTECŢIEI MEDIULUI ÎN CONTEXTUL CREŞTERII ECONOMICE 153CONSERVATION OF WATER QUALITY AND ENVIRONMENTAL PROTECTION IN THE CONTEXT OF ECONOMIC GROWTH 164Prof. Constantin ANGHELACHE PhD Doina AVRAM Ph.D Student Doina BUREA PhD Student
Revista Română de Statistică - Supliment nr. 9 / 2017 3
Analiza strategiei Uniunii Europene în domeniul ştiinţei şi tehnologiei
Prof. univ. dr. Constantin ANGHELACHE ([email protected])
Academia de Studii Economice din București / Universitatea „Artifex” din București
Conf. univ. dr. Mădălina-Gabriela ANGHEL ([email protected])
Universitatea „Artifex” din București
Drd. Andreea – Ioana MARINESCU ([email protected])
Academia de Studii Economice din București
Drd. Maria MIREA ([email protected])Academia de Studii Economice din București
Abstract
În acest articol, autorii au cercetat modul în care Uniunea Europeană și statele membre acționează pe linia dezvoltării științei, tehnologiei și inovării, în vederea îmbunătățirii calitative a activității economice. În acest context, se analizează prevederile strategiei Uniunii europene până în anul 2020, lansată în octombrie 2010. Accentul este pus pe prezentarea datelor privind cheltuielile efectuate de Uniunea Europeană și fi ecare stat membru în domeniul cercetării și dezvoltării. Pentru a fi relevante, datele respective sunt comparate și cu indicatorii în acest domeniu ai altor state cu standard ridicat al economiei, cum sunt S.U.A., Japonia și China. Rezultă că ponderea cea mai mare a cheltuielilor pentru cercetare-dezvoltare din Produsul Intern Brut o înregistrează Japonia, în jur de 4,0-4,2% în perioada 2013-2016. În toate statele membre ale Uniunii Europene, cheltuielile cu cercetarea-dezvoltarea au crescut an de an, din 2004 până în 2014, așa cum rezultă și din reprezentarea grafi că. S-au prezentat date cu privire la personalul de specialitate angajat în aceasta activitate în Uniunea Europeană, precum și în fi ecare stat membru. Cuvinte cheie: cercetare, inovație, știință, strategie, uniune inovativă Clasifi carea JEL: O31, O32
Introducere
Statisticile Uniunii Europene în domeniul științei, tehnologiei și inovației acoperă o gamă sufi cient de importantă fi ind numită activitatea de cercetare și dezvoltare (R&D). În acest sens, dezvoltarea inovației, a științei și tehnologiei presupune și o utilizare mai bună și mai consistentă a resurselor umane. Știința este parte a dezvoltării societății. Numai prin dezvoltarea științei adică a inovației, invențiilor, în toate domeniile se asigură fundamentul pentru progresul economic al fi ecărei țări. Europa are o lungă tradiție în domeniul cercetării și inovării, existând numeroase proiecte de prestigiu și de mare efi ciență economică în
Romanian Statistical Review - Supplement nr. 9 / 20174
domeniul industrial, al biologiei, farmaceutic, telecomunicațiilor sau în domeniul aerospațial. De regulă, R&D este întotdeauna considerat ca vârful de lance care stă în spatele creșterii ecoonmice și al sporirii numărului de locuri atât în domeniul creației cât și în domeniul activității economice. Oricum, extinderea infl uenței cercetării în domeniul sferei economice asigură o protecție a mediului înconjurător, a mediului de afaceri internațional, a îmbunătățirii calității produselor realizate în toate domeniile, mai ales în domeniul medicinii, cea care asigură prin progresele dobândite o stare de sănătate mult superioară a persoanelor din fi ecare țară. În octombrie 2010, Uniunea Europeană a lansat programul de dezvoltare până în 2020, programul numindu-se Uniunea inovativă, care are ca scop dezvoltarea climatului de cercetare în domeniul energiei, securității alimentare, al sănătății și al calității vieții populației. În Uniunea Europeană, inovațiile sunt monitorizate și implementate prin această Uniune inovativă. În acest domeniu, au fost și sunt atrase și țări care nu sunt membre ale Uniunii Europene, avându-se în vedere pe de o parte posibilitatea atragerii altor țări în Uniunea Europeană, sau atragerea la proiecte de cercetare și inovare a altor specialiști, a altor țări, care au tradiție în acest domeniu.
Literature review Buesaa, Heijsa și Baumert (2010) analizează factorii determinanți ai inovării regionale în Europa. Isaic-Maniu, Anghelache, Mitruț și Voineagu (2007) analizează evoluția activității de cercetare, dezvoltare și inovare în România. Akçomaka și ter Weel (2009) se concentrează asupra capitalului social, a inovării și a creșterii economice în Europa. Cincera și Veugelers (2013) analizează tinerii lideri inovatori în corelație cu decalajul intensității cercetării și dezvoltării din Uniunea Europeană. Rodríguez-Pose (2008) evaluează impactul cercetării și dezvoltării, difuzarea, sistemele de inovare asupra creșterii regionale în Europa. Cruz-Jesus, Oliveira și Bacao (2012) sunt preocupați de disparitățile digitale europene, în intervalul de referință 2008-2010. Dachs și Pyka (2010) analizează factorii care infl uențează internaționalizarea inovației. Pinto (2009) studiază caracteristicile diversității inovării în cadrul Uniunii Europene. Moncada-Paternò-Castello și colab. (2010) discută despre sistemul de cercetare și dezvoltare corporativă din UE, în comparație cu cel din afara UE, în ceea ce privește performanța. Srholec (2009) discută despre impactul proprietății străine asupra cooperării în domeniul inovării. Anghelache, Niță și Badiu (2016) evaluează poziția și rolul remitențelor migranților în dezvoltarea economică a unei țări. Voigt și Moncada-Paternò-Castello (2012) evaluează impactul posibil al întreprinderilor mici și mijlocii cu creștere rapidă în domeniul cercetării și dezvoltării asupra structurii economice a Uniunii Europene la orizontul anului 2020. Barbosa și Faria (2011) sunt preocupate de diferențele instituționale în Europa în materie de inovații. Block (2012) analizează cazul
Revista Română de Statistică - Supliment nr. 9 / 2017 5
investițiilor în cercetare și dezvoltare în fi rme de familie și fondatoare. Onetti et.al. (2012) prezintă modele de afaceri competitive pentru noile fi rme bazate pe tehnologie. Bravo-Ortega și Marín (2011) dezvoltă relațiile dintre cercetare și dezvoltare și productivitate. Farole, Rodríguez-Pose și Storper (2011) analizează caracteristicile politicii de coeziune a UE.
Metodologia cercetării, date, rezultate şi discuţii
• Costurile cercetării și dezvoltării
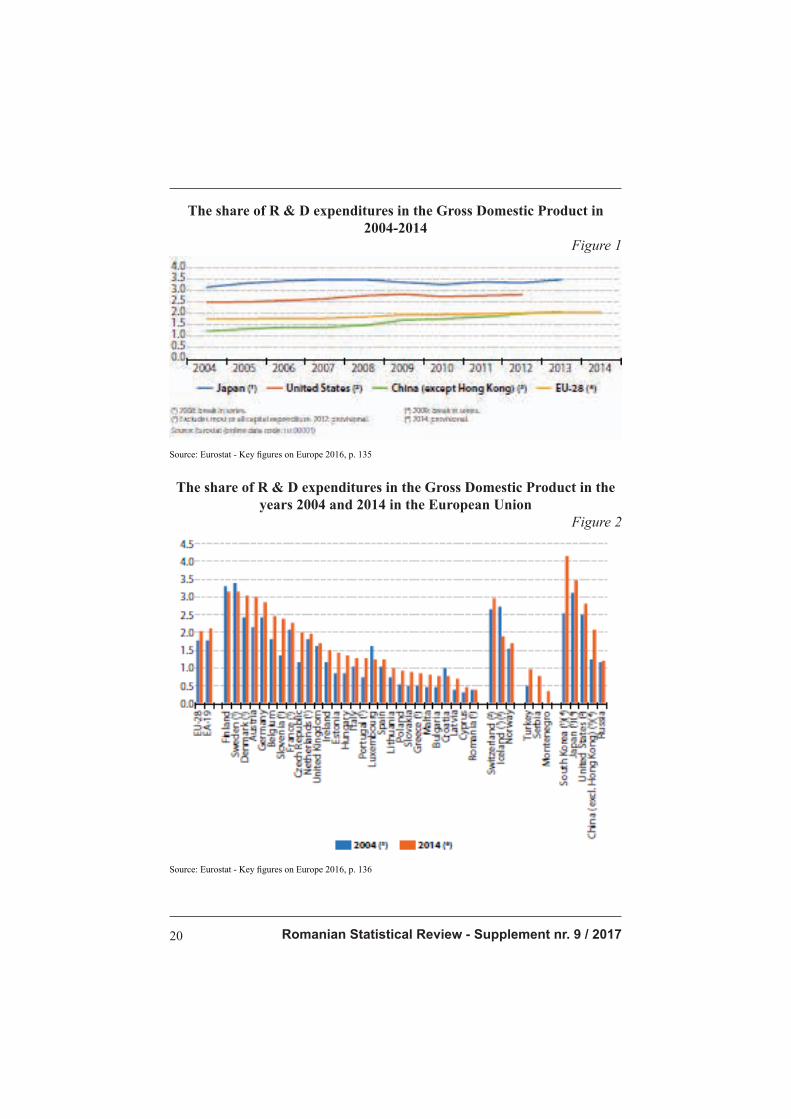
Unul dintre obiectivele-cheie ale strategiei Uniunii Europene în domeniul creșterii activității de cercetare și dezvoltare îl reprezintă fi nanțarea. În Uniunea Europeană, strategia stabilită în 2010 până în 2020 a vizat obiective pe termen lung care preconizau o creștere anuală cu 3% a fi nanțării în acest domeniu. Cheltuielile globale în acest domeniu al cercetării și dezvoltării au fost de 284 mld. de euro în 2014, reprezentând o creștere de 3,4% față de anul anterior, fi iind cu 42% mai ridicată decât în anul 2004. În domeniul creșterii cercetării și dezvoltării Uniunea Europeană are în vedere ca pe această cale, să crească productivitatea muncii, să crească numărul de locuri de muncă oferite populației așa încât, prin rezultatul concret al creșterii produsului intern brut să se asigure și posibilitatea unei îmbunătățiri a condițiilor de evoluție în continuare a economiei în ansamblu ei, ca și a creșterii condițiilor de viață, în ultimă instanță a calității vieții. În anul 2012 s-a înregistrat o creștere de 2,01% față de 2010, iar în 2013 de 2,03% față de 2012, iar 2014, 2015, 2016 înregistrând în principiu aceeași rata de creștere, 2,10-2,20% față de perioadele anterioare. În ceea ce privește utilizarea rezultatelor dobândite în cercetare, s-a asigurat dezvoltarea și creșterea produsului intern brut în majoritatea statelor din Uniunea Europeană, cu un accent mai ridicat în unele țări din estul și chiar centrul Europei, care desigur au avut un nivel mai redus al dezvoltării, dar care prin accesarea rezultatelor cercetării au dobândit o creștere mai intensă. Un studiu comparativ l-am efectuat între nivelul de creștere al cheltuielilor în domeniul cercetării și dezvoltării în Uniunea Europeană comparativ cu Japonia, Statele Unite și China (exceptând Hong Kong-ul). Constatăm că cel mai înalt ritm de creștere al cercetării și dezvoltării l-a înregistrat Japonia care a avut o creștere cuprinsă între 3,1% în 2004, menținându-se la 3,5-3,6% în 2013, 2014 și 2015. Statele Unite au urmat același trend, ușor crescător, cuprins între 2,5% al creșterii cheltuielilor din PIB în anul 2004 ajungând la 2,0 – 2,1% în 2015, 2016. China la rândul ei a înregistrat un ritm crescător mai ales din 2008 fi ind la același nivel al alocării din produsul intern brut egal cu al Statelor Unite. Uniunea Europeană a urmat un trend aproape constant, de 1,7% în 2004, ajungând la 2% în ultimii patru ani. Se constată că toate țările luându-le pe acestea ca țări individuale sau grup de state în cadrul Uniunii Europene, au acordat o atenție ridicată în ceea ce privește
Romanian Statistical Review - Supplement nr. 9 / 20176
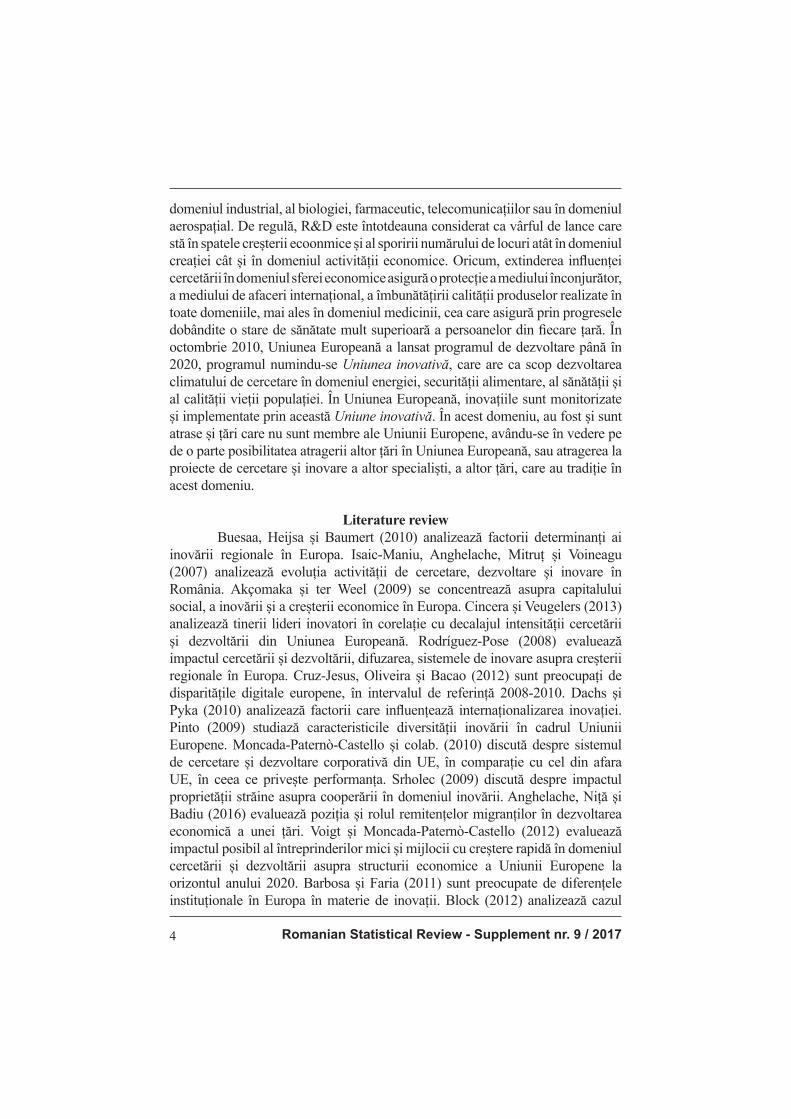
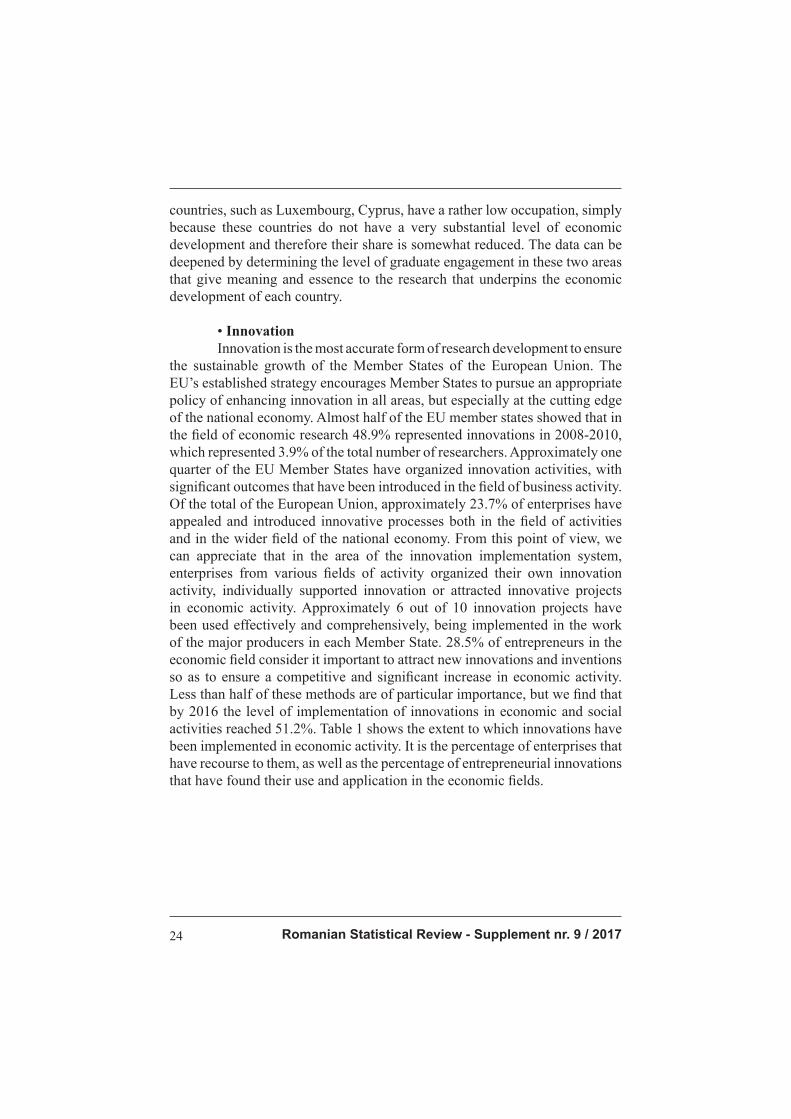
creșterea alocărilor din produsul intern brut pentru cercetare și dezvoltare. În fi gura 1 este reprezentată grafi c alocarea cheltuielilor din produsul intern brut pentru cercetare și dezvoltare, iar în fi gura 2 se arată evoluția creșterii alocărilor din produsul intern brut pentru cercetare și dezvoltare în perioada 2004-2015. Ponderea cheltuielilor pentru cercetare și dezvoltare în Produsul Intern
Brut, în perioada 2004-2014
Figura 1
Sursa: Eurostat - Key fi gures on Europe 2016, pag. 135
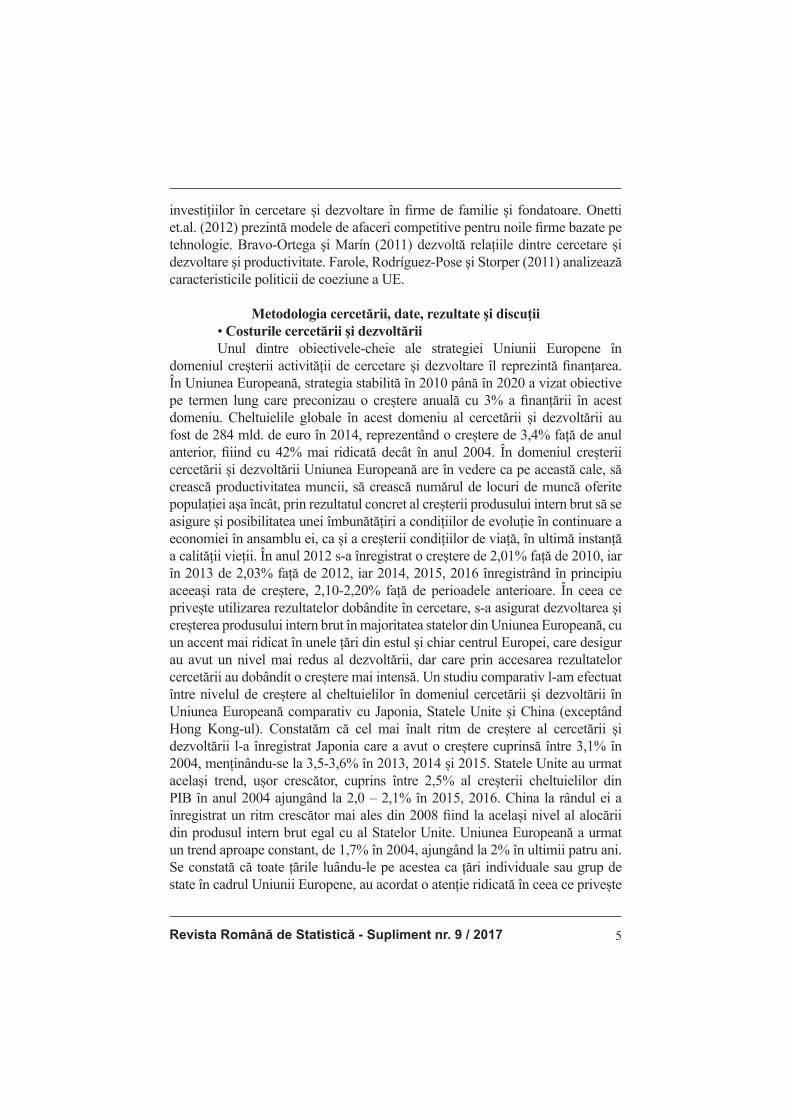
Ponderea cheltuielilor pentru cercetare și dezvoltare în Produsul Intern
Brut, în perioada în anii 2004 și 2014 în Uniunea Europeană
Figura 2
Sursa: Eurostat - Key fi gures on Europe 2016, pag. 136

Revista Română de Statistică - Supliment nr. 9 / 2017 7
Se constată că un ritm ridicat al utilizării din PIB a unor sume pentru cercetare și dezvoltare au înregistrat Finlanda, Suedia, Danemarca, Austria, Germania, Belgia, Slovenia, Franța, Republica Cehă, Olanda, Regatul Unit al Marii Britanii și Irlandei de Nord. Acestea au ajuns la rate de alocare de 3,3 – 3,4 %, iar în cazul Regatului Unit la aproximativ 2%. În cazul României constatăm că această alocare atât în 2004 cât și în 2014 a rămas constantă, de aproximativ 0,4% din Produsul Intern Brut. Este esențial faptul că, aproape toate statele Uniunii Europene, cu excepția Luxemburgului și Croației sau Finlandei și Suediei, au alocat fonduri sporite în 2014 față de 2004. România a rămas la un nivel constant, ceea ce presupune necesitatea unei creșteri a alocărilor respective.
• Personalul cuprins în cercetare și dezvoltare
Un element esențial în realizarea îmbunătățirii cercetării și dezvoltării îl reprezintă numărul de cercetători, inovatori, care sunt atrași în aceste domenii de maximă importanță, pentru dezvoltarea rezultatelor cercetării în Uniunea Europeană. Numărul cercetătorilor în Uniunea Europeană a crescut în anii din urmă, existând un număr de 1.760.000 de cercetători în 2014, care a marcat o creștere de 441.000 de cercetători, adică aproximativ 33,6% față de anul 2004. Din studiul personalului implicat în cercetare și dezvoltare, constatăm că 48% au fost concentrați în cercetarea în domeniul sectorului de afaceri, în domeniul învățământului superior, sau în domeniul altor sectoare importante din cadrul economiei naționale. Așa cum am arătat, în o serie de state cum ar fi Suedia, Olanda, Austria, Irlanda, Franța, Malta, Danemarca, s-a înregistrat un număr important de cercetători în toate aceste domenii. În contrast cu situația din aceste țări, în sectorul de stat din Bulgaria și România există un număr important de cercetători angrenați în activitate dintre cei care au această posibilitate, numai că numărul total al acestora este redus față de celelalte state. Analizând cercetarea și numărul de persoane cuprinse în principalele domenii de activitate constatăm că 67% dintre aceștia erau de gen masculin, iar cel al persoanelor de gen feminin fi ind la aproape jumătate din numărul personalului. În domeniul personalului cuprins în activitatea de cercetare și dezvoltare, constatăm că în Danemarca 2% din forța de muncă, în Finlanda 1,9% sau în Luxemburg erau persoane care activau în domeniul cercetării și dezvoltării. La nivelul Uniunii Europene, 28 de state, gradul de cuprindere în activitatea de cercetare era de 1,1% din totalul forței de muncă angajate. În România nivelul angrenării în totalul forței de muncă este de 0,3% ca și în Cipru, iar în Suedia de 1,6%. Un studiu pe grupe de vârstă, artă că în ultimii ani, a sporit numărul cercetătorilor cu vârsta cuprinsă între 20 și 29 de ani, numărul absolvenților de studii superiaore care s-au dedicat cercetării a ajuns
Romanian Statistical Review - Supplement nr. 9 / 20178
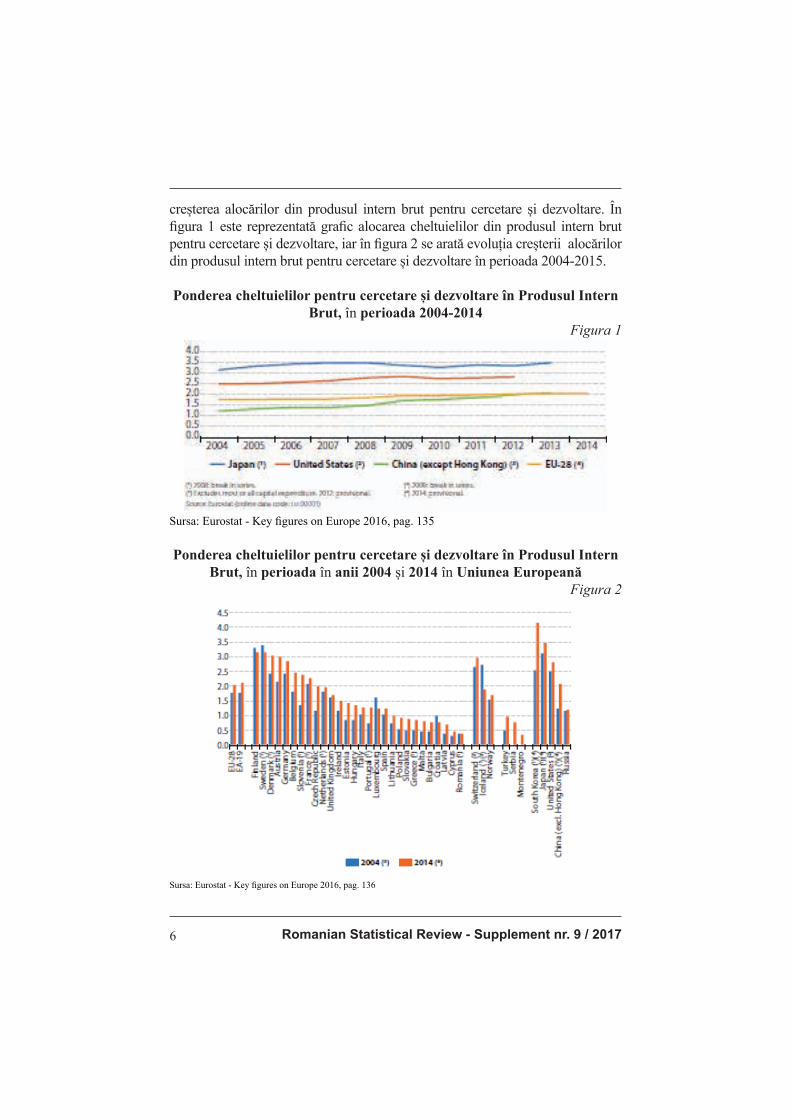
la 12,7‰ , desigur existând diferențe de la o țară la alta. În fi gura 3 se prezintă ponderea pe care o are rata de ocupare în timp complet de muncă, cu contract de muncă în domeniul cercetării.
Cercetători cu normă întreagă, pe sectoare de activitate, în anul 2014
(% din total)
Figura 3
Sursa: Eurostat - Key fi gures on Europe 2016, pag. 138
S-au considerat patru domenii în această privință, respectiv, sectorul întreprinderilor din domeniul afacerilor, sectorul învățământ superior, sectorul guvernamental și sectorul non-profi t privat. Se constată că ponderea cea mai mare o deține angajarea în domeniul sectorului de afaceri și apoi sectorul învățământului superior în aceste țări. În România constatăm că trei domenii dețin ponderea
Revista Română de Statistică - Supliment nr. 9 / 2017 9
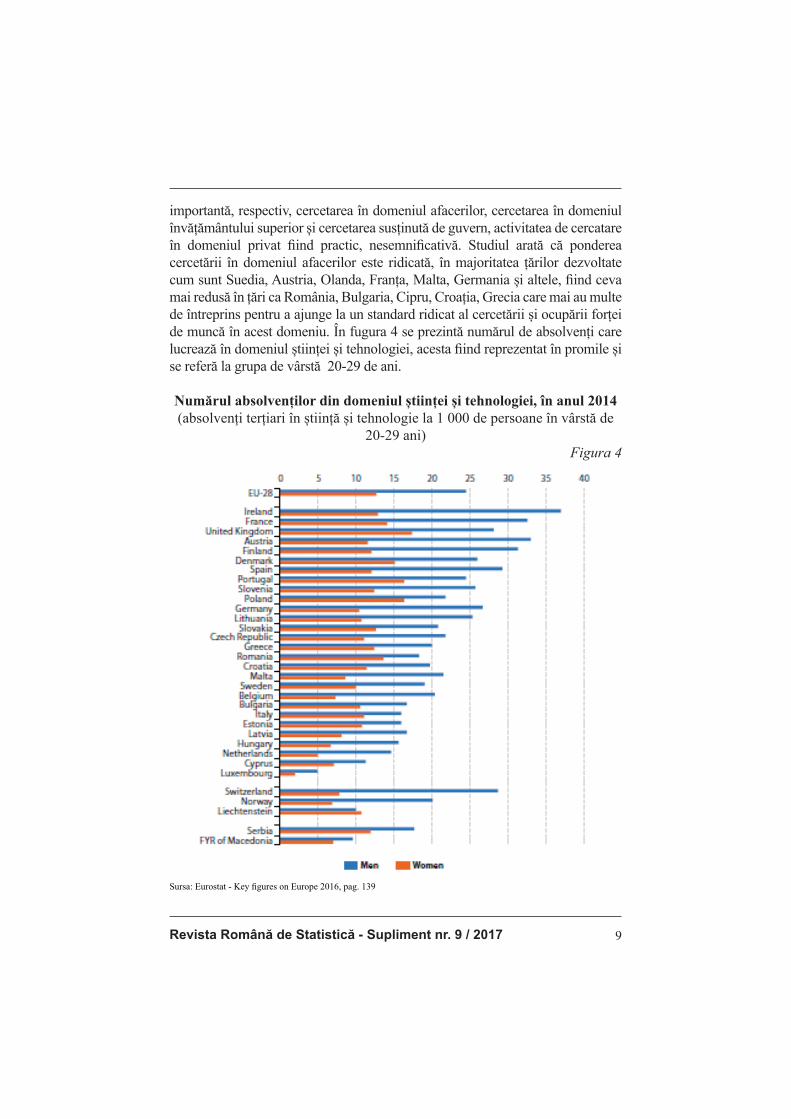
importantă, respectiv, cercetarea în domeniul afacerilor, cercetarea în domeniul învățământului superior și cercetarea susținută de guvern, activitatea de cercatare în domeniul privat fi ind practic, nesemnifi cativă. Studiul arată că ponderea cercetării în domeniul afacerilor este ridicată, în majoritatea țărilor dezvoltate cum sunt Suedia, Austria, Olanda, Franța, Malta, Germania și altele, fi ind ceva mai redusă în țări ca România, Bulgaria, Cipru, Croația, Grecia care mai au multe de întreprins pentru a ajunge la un standard ridicat al cercetării și ocupării forței de muncă în acest domeniu. În fugura 4 se prezintă numărul de absolvenți care lucrează în domeniul științei și tehnologiei, acesta fi ind reprezentat în promile și se referă la grupa de vârstă 20-29 de ani.
Numărul absolvenților din domeniul științei și tehnologiei, în anul 2014
(absolvenți terțiari în știință și tehnologie la 1 000 de persoane în vârstă de 20-29 ani)
Figura 4
Sursa: Eurostat - Key fi gures on Europe 2016, pag. 139

Romanian Statistical Review - Supplement nr. 9 / 201710
Reține atenția faptul că în majoritatea statelor numărul bărbaților angajați în acest domeniu este net superior. Și în România sunt aproximativ 18‰ persoane de gen masculin angrenate în cercetare și în domeniul tehnologic și doar 13,5‰ din rândul femeilor. Unele țări cum sunt Luxemburg, Cipru, au o ocupare destul de redusă, simplu pentru că aceste țări nu au un nivel de dezvoltare economică prea substanțial și de aceea și ponderea lor este oarecum redusă. Datele pot fi adâncite constatându-se nivelul de cuprindere al absolvenților în aceste două domenii care dau sens și esență cercetării care stă la baza dezvoltării economice a fi ecărei țări.
• Inovația
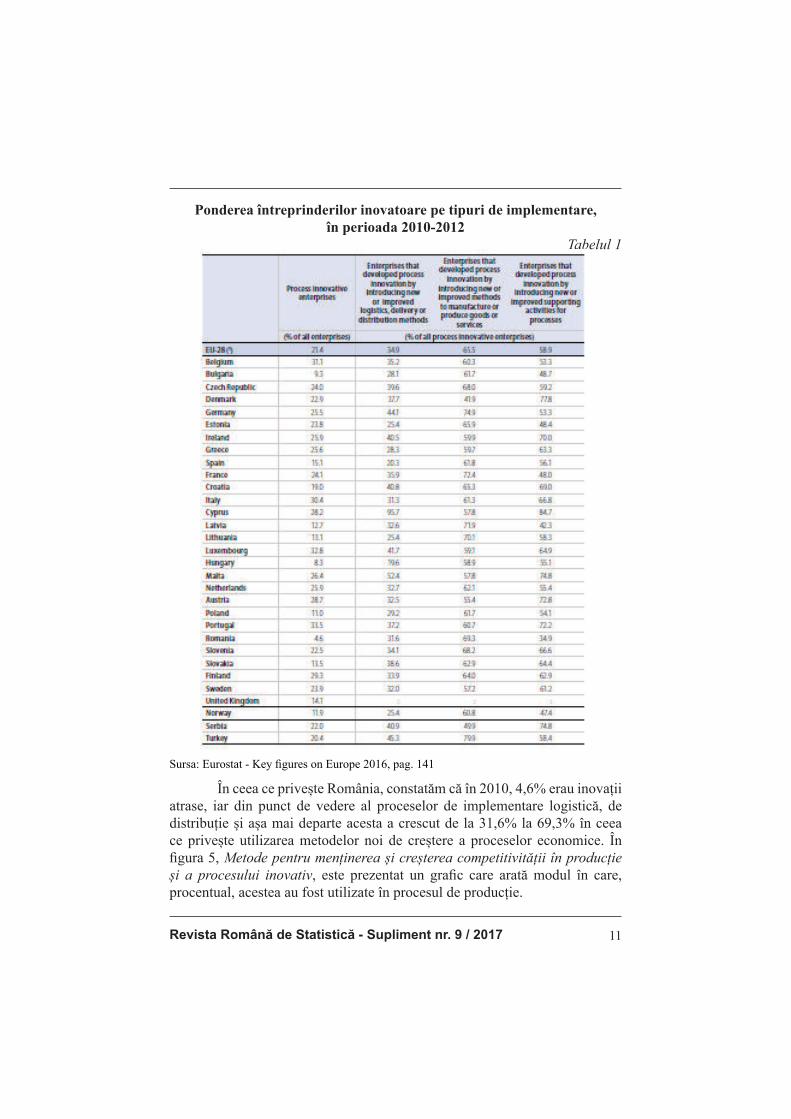
Inovația este forma cea mai precisă în ceea ce privește dezvoltarea cercetării, care să asigure creșterea sustenabilă a statelor membre ale Uniunii Europene. Strategia Uniunii Europene stabilită, încurajează statele membre să urmeze o politică adecvată de sporire a inovației în toate domeniile, dar mai ales în cele de vârf ale economiei naționale. Aproape jumătate din întreprinderile membre ale Uniunii Europene arătau că în domeniul cercetării economice 48,9% o reprezentau inovațiile în perioada 2008-2010, care reprezenta un nivel de 3,9% din totalul cercetătorilor. Aproximativ un sfert dintre statele membre ale Uniunii Europene au activități organizate în domeniul inovației, acestea fi ind cu rezultate semnifi cative care s-au introdus în domeniul activității întreprinderilor economice. Pe totalul Uniunii Europene aproximativ 23,7% din întreprinderi au apelat și au introdus procesele inovative atât în domeniul unor activități, cât și în domeniul mai larg al economiei naționale. Din acest punct de vedere putem aprecia că în domeniul sistemului de implementare a inovațiilor, an de an, întreprinderile din domenii diverse de activitate și-au organizat propria activitate de inovație, au sprijinit în mod individual inovarea sau au atras proiectele inovative în activitatea economică. Aproximativ 6 din 10 proiecte de inovații au fost folosite în mod efi cient și comprtitiv fi ind implementate în activitatea marilor producători din fi ecare stat membru. 28,5% dintre antreprenorii din domeniul economic consideră important să atragă inovațiile și invențiile noi, așa încât să asigure creșterea competitivă și semnifi cativă a activității economice. Mai puțin de jumătate dintre aceste metode au o importanță deosebită, dar, constatăm că an de an, până în 2016, nivelul implementării inovațiilor în activitățile economico-sociale au ajuns la 51,2%. În tabelul 1, se prezintă proporția în care inovațiile au fost impelementate în activitatea economică. Este vorba de procentul întreprinderilor care au recurs la acestea, precum și la procentul inovațiilor antreprenoriale care și-au găsit utilizare și aplicare în domeniile economice.
Revista Română de Statistică - Supliment nr. 9 / 2017 11
Ponderea întreprinderilor inovatoare pe tipuri de implementare,
în perioada 2010-2012
Tabelul 1
Sursa: Eurostat - Key fi gures on Europe 2016, pag. 141
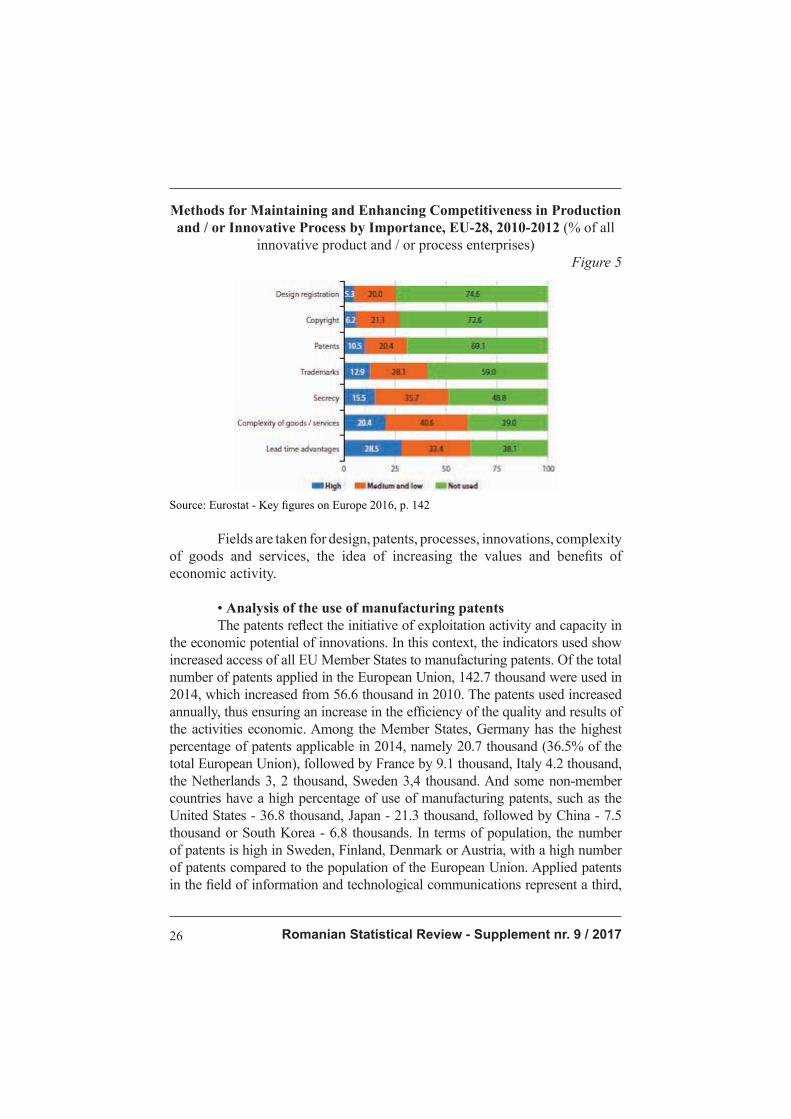
În ceea ce privește România, constatăm că în 2010, 4,6% erau inovații atrase, iar din punct de vedere al proceselor de implementare logistică, de distribuție și așa mai departe acesta a crescut de la 31,6% la 69,3% în ceea ce privește utilizarea metodelor noi de creștere a proceselor economice. În fi gura 5, Metode pentru menținerea și creșterea competitivității în producție
și a procesului inovativ, este prezentat un grafi c care arată modul în care, procentual, acestea au fost utilizate în procesul de producție.

Romanian Statistical Review - Supplement nr. 9 / 201712
Metode pentru menținerea și creșterea competitivității în producție și/
sau a procesului inovativ după gradul de importanță, UE-28, 2010-2012
(% din toate întreprinderile inovatoare de produse și / sau procese)Figura 5
Sursa: Eurostat - Key fi gures on Europe 2016, pag. 142
Sunt luate domenii ca designul, patentele, procesele, inovațiile, complexitatea bunurilor și serviciilor, ideea creșterii valorilor și avantajelor activității economice. • Analiza utilizării patentelor de fabricație
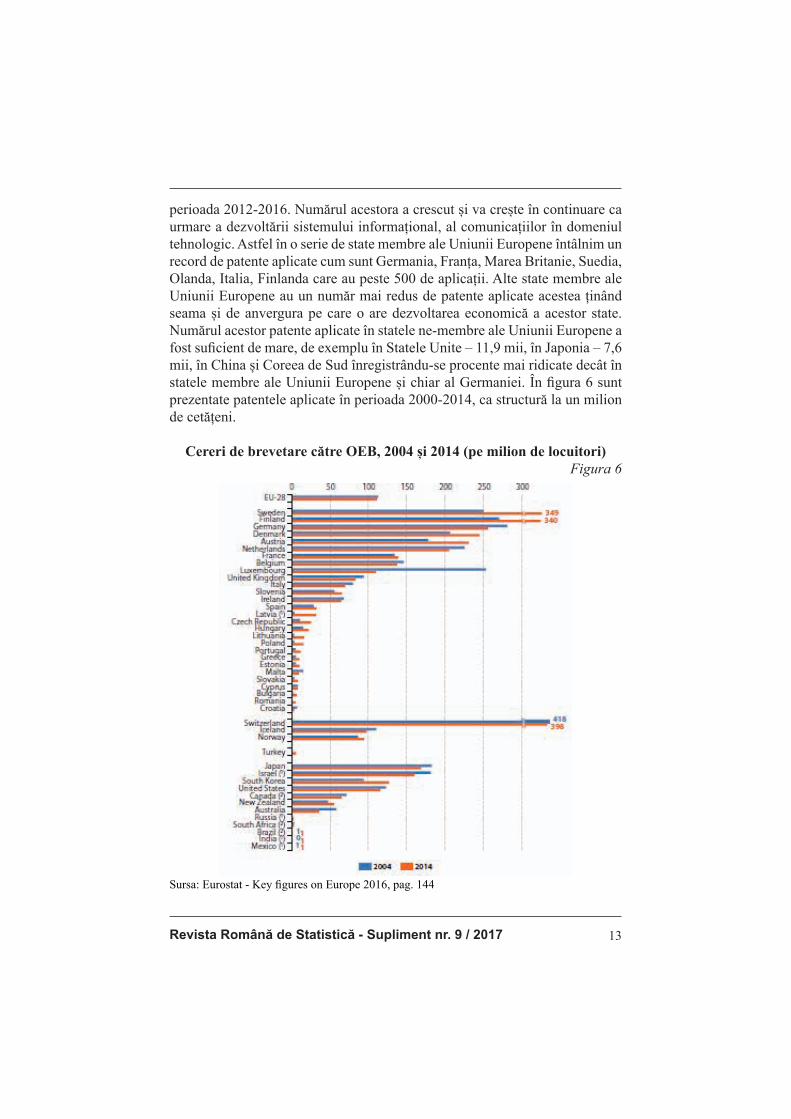
Patentele refl ectă inițiativa activității și a capacității de exploatare în potențialul economic al inovațiilor. În acest context, indicatorii utilizați arată un acces sporit al tuturor țărilor membre ale Uniunii Europene la patentele de fabricație. Din totalul numărului de patente aplicate în Uniunea Europeană, 142,7 mii au fost utilizate în 2014, care a crescut de la 56,6 mii în 2010. Patentele utilizate au crescut an de an, asigurând astfel o sporire a efi cienței calității și rezultatelor activităților economice. Dintre statele membre, Germania are cel mai înalt procent de patente aplicabile în 2014, respectiv 20,7 mii (36,5% din totalul Uniunii Europene), urmată de Franța cu 9,1 mii, Italia 4,2 mii, Olanda 3,2 mii, Suedia 3,4 mii. Și unele state ne-membre au procent ridicat de utilizare a patentelor de fabricație, cum este cazul Statelor Unite - 36,8 mii, Japonia- 21,3 mii, urmată de China – 7,5 mii sau Coreea de Sud - 6,8 mii. Relativ la numărul populației, numărul de patente este ridicat în Suedia, Finlanda, Danemarca sau Austria care au un număr de patente ridicat, comparat prin raportare la numărul populației din Uniunea Europeană. Patentele aplicate în domeniul informațiilor și comunicațiilor tehnologice reprezintă o treime, aproape 32% din totalul celor utilizate în
Revista Română de Statistică - Supliment nr. 9 / 2017 13
perioada 2012-2016. Numărul acestora a crescut și va crește în continuare ca urmare a dezvoltării sistemului informațional, al comunicațiilor în domeniul tehnologic. Astfel în o serie de state membre ale Uniunii Europene întâlnim un record de patente aplicate cum sunt Germania, Franța, Marea Britanie, Suedia, Olanda, Italia, Finlanda care au peste 500 de aplicații. Alte state membre ale Uniunii Europene au un număr mai redus de patente aplicate acestea ținând seama și de anvergura pe care o are dezvoltarea economică a acestor state. Numărul acestor patente aplicate în statele ne-membre ale Uniunii Europene a fost sufi cient de mare, de exemplu în Statele Unite – 11,9 mii, în Japonia – 7,6 mii, în China și Coreea de Sud înregistrându-se procente mai ridicate decât în statele membre ale Uniunii Europene și chiar al Germaniei. În fi gura 6 sunt prezentate patentele aplicate în perioada 2000-2014, ca structură la un milion de cetățeni.
Cereri de brevetare către OEB, 2004 și 2014 (pe milion de locuitori)
Figura 6
Sursa: Eurostat - Key fi gures on Europe 2016, pag. 144

Romanian Statistical Review - Supplement nr. 9 / 201714
Iată, pe primele locuri se clasează și în 2004 și în 2014, existând un ritm crescător, Suedia, Finlanda, Germania, Danemarca, Austria, Olanda, Franța sau Belgia. În Luxemburg ca și în Germania sau Olanda numărul patentelor aplicate în 2014 a fost inferior celor utilizate și implementate în anul 2004. În ceea ce privește România, constatăm că în 2004, ori nu există date ori fi ind mai sinceri, nivelul de aplicare a patentelor în acet domeniu a fost redus, ajungând la circa 2 procente în 2014. De asemenea, în fi gura 7 se prezintă grafi c aplicarea patentelor în domeniul informației și comunicațiilor. Acesta se referă la numărul de astfel de patente utilizate.
Cereri de brevet la OEP - TIC, 2012 (număr)
Figura 7
Sursa: Eurostat - Key fi gures on Europe 2016, pag. 145

Revista Română de Statistică - Supliment nr. 9 / 2017 15
La nivelul Uniunii Europene nivelul a fost de 10.367 pe total, din care Germania implementa 4.787, Franța 2.693, urmând apoi în ordine, Marea Britanie, Olanda, Italia, Finlanda. În ceea ce privește situația României, constatăm că aceasta a implementat doar 10-15 patente annual, din 2012 până în 2016. Comparativ cu statele non-membre, constatăm că cele patru, Statele Unite ( 11.933 patente), Japonia (7.581 patente), China (3.299 patente), Coreea de Sud ( 3.170 patente) sau situat net deasupra întregii comunități a Uniunii Europene, din punct de vedere al utilizării patentelor de fabricație.
Concluzii
În ceea ce privește studiul efectuat, în legătură cu evoluția științei, constatăm în primul rând o creștere a nivelului de cercetare și dezvoltare, a angrenării unui număr de personal din ce în ce mai mare în aceste domenii, creșterea inovațiilor și a patentelor aplicate în activitatea social-economică. Se constată că nivelul cercetării și al dezvoltării a cuprins ponderi din ce în ce mai ridicate care au asigurat o îmbunătățire a calității producției, a îmbunătățirii managementului economic, social și administrativ, asigură un acces neîngrădit la informații și capacitatea de documentare foarte ridicată. Cifrele analizate relevă preocuparea Uniunii Europene ca prin strategia pentru ultimul deceniu 2010-2020, în acest domeniu, să se atingă scopul și să asigure o implementare net superioară a rezultatelor cercetării și inovării în activitatea economică. Articolul evidențiază preocuparea Uniunii Europene de a perfectiona cercetarea și dezvoltarea în statele membre, care să permită inițierea de proiecte comune de anvergură.
Bibliografi e
1. Akçomaka, I. S. and ter Weel, B. (2009). Social capital, innovation and growth: Evidence from Europe. European Economic Review, 53 (5), 544-567
2. Anghelache, C., Manole, A., Anghel, M. G. and Popovici, M. (2016). Human resources: their role and development in the national economy. Romanian
Statistical Review Supplement, 4, 59-65 3. Anghelache, C., Niță, G. and Badiu, A. (2016). Migrants remittances – an important
and stable source of external funds, in the economic development of a country, Romanian Statistical Review, Supplement, 12, 83-90
4. Barbosa, N. and Faria, A. P. (2011). Innovation across Europe: How important are institutional differences?. Research Policy, 40 (9), 1157-1169
5. Block, J. H. (2012). R&D investments in family and founder fi rms: An agency perspective. Journal of Business Venturing, 27 (2), 248-265
6. Bravo-Ortega, C. and Marín, A. G. (2011). R&D and Productivity: A Two Way Avenue?. World Development, 39 (7), 1090-1107
7. Buesaa, M., Heijsa, J. and Baumert, T. (2010). The determinants of regional innovation in Europe: A combined factorial and regression knowledge production function approach. Research Policy, 39 (6), 722-735

Romanian Statistical Review - Supplement nr. 9 / 201716
8. Cincera, M. and Veugelers, R. (2013). Young leading innovators and the EU’s R&D intensity gap. Economics of Innovation and New Technology, 22 (2), 177-198
9. Cruz-Jesus, F., Oliveira, T. and Bacao, F. (2012). Digital divide across the European Union. Information & Management, 49 (6), 278-291
10. Dachs, B. and Pyka, A. (2010). What drives the internationalisation of innovation? Evidence from European patent data. Economics of Innovation and
New Technology, 19 (1), 71-86 11. Farole. T., Rodríguez-Pose, A. and Storper, M. (2011). Cohesion Policy in the
European Union: Growth, Geography, Institutions. Journal of Common Market
Studies, 49 (5), 1089–1111 12. Isaic-Maniu, A., Anghelache, C., Mitruţ, C. and Voineagu, V. (2007). Evoluţii în
activitatea de Cercetare-Dezvoltare-Inovare (CDI). Revista Română de Statistică, Supliment, decembrie 2007, 10-17
13. Moncada-Paternò-Castello, P. et al. (2010). Does Europe perform too little corporate R&D? A comparison of EU and non-EU corporate R&D performance. Research Policy, 39 (4), 523-536
14. Onetti, A., Zucchella, A., Jones, M. V. and McDougall-Covin, P. P. (2012). Internationalization, innovation and entrepreneurship: business models for new technology-based fi rms. Journal of Management & Governance, 16 (3), 337–368
15. Pinto, H. (2009). The Diversity of Innovation in the European Union: Mapping Latent Dimensions and Regional Profi les. European Planning Studies, 17 (2), 303-326
16. Rodríguez-Pose, A. (2008). Research and Development, Spillovers, Innovation Systems, and the Genesis of Regional Growth in Europe. Regional Studies, 42 (1), 51-67
17. Srholec, M. (2009). Does foreign ownership facilitate cooperation on innovation? Firm-level evidence from the enlarged European Union. The European Journal of Development Research, 21 (1), 47–62
18. Voigt, P. and Moncada-Paternò-Castello, P. (2012). Can Fast Growing R&D-Intensive Smes Affect the Economic Structure of the Eu Economy?: A Projection to the Year 2020. Eurasian Business Review, 2 (2), 96–128
*** Eurostat - Key fi gures on Europe 2016
Revista Română de Statistică - Supliment nr. 9 / 2017 17
ANALYSIS OF THE EUROPEAN UNION’S SCIENCE AND TECHNOLOGY STRATEGY
Prof. Constantin ANGHELACHE PhD ([email protected])
Bucharest University of Economic Studies / „Artifex” University of Bucharest
Assoc. prof. Mădălina-Gabriela ANGHEL PhD ([email protected])
„Artifex” University of Bucharest
Andreea – Ioana MARINESCU Ph.D Student ([email protected])
Bucharest University of Economic Studies
Maria MIREA PhD Student ([email protected])
Bucharest University of Economic Studies
Abstract
In this article, the authors have explored how the European Union
and the Member States are working towards the development of science,
technology and innovation, in order to improve the quality of economic
activity. In this context, the provisions of the European Union Strategy until
2020, launched in October 2010, are analyzed. The focus is on presenting
the data on the spending of the European Union and each Member State in
the fi eld of research and development. To be relevant, these data are also
compared with the indicators in this area of other high-standard economies
such as the U.S., Japan and China. As a result, the largest share of R & D
spending in the Gross Domestic Product is recorded by Japan, around 4.0-
4.2% in the period 2013-2016. In all EU Member States, spending on research
and development increased year-on-year from 2004 to 2014, as shown by
graphical representation. Data was provided on the staff involved in this
activity in the European Union as well as in each Member State.
Keywords: research, innovation, science, strategy, innovative union
JEL Classifi cation: O31, O32
Introduction
EU statistics on science, technology and innovation cover a suffi ciently important range, being called R & D activity. In this respect, the development of innovation, science and technology implies a better and more consistent use of human resources. Science is part of the development of society. Only through the development of science, ie innovation, inventions, in all fi elds is provided the foundation for the economic progress of each country. Europe has a long tradition of research and innovation, with many prestigious and high-effi ciency projects in the industrial, biology, pharmaceutical, telecommunication or aerospace industries. As a rule, R & D is always considered to be the tip of

Romanian Statistical Review - Supplement nr. 9 / 201718
the lance that is behind the economic growth and the increase of the number of places both in the fi eld of creation and in the fi eld of economic activity. However, expanding the infl uence of research in the economic sphere ensures
the protection of the environment, the international business environment, and
the improvement of the quality of the products made in all fi elds, especially in
the fi eld of medicine, which ensures, through the progress achieved, a much
higher state of health people in each country. In October 2010, the European
Union launched the development program by 2020, the program called the
Innovation Union, which aims to develop the research climate in the fi elds of
energy, food security, health and the quality of life of the population. In the
European Union, innovations are monitored and implemented through this
Innovative Union. In this fi eld, non-EU countries have also been attracted,
considering, on the one hand, the possibility of attracting other countries to
the European Union, or attracting other specialists, other specialists, other
countries that have a tradition in this area.
Literature review
Buesaa, Heijsa, and Baumert (2010) analyze the determinants of
regional innovation in Europe. Isaic-Maniu, Anghelache, Mitruţ, and Voineagu
(2007) analyze the evolution of research, development and innovation activity
in Romania. Akçomaka and ter Weel (2009) develop on social capital,
innovation and growth in Europe. Cincera and Veugelers (2013) analyze the
young leading innovators in correlation with the European Union’s Research
and Development intensity gap. Rodríguez-Pose (2008) evaluates the impact
of research and development, spillovers, innovation systemson the regional
growth in Europe. Cruz-Jesus, Oliveira, and Bacao (2012) are preoccupied by
the European digital disparities, across the reference interval 2008-2010. Dachs
and Pyka (2010) analyze the factors that infl uence the internationalisation of
innovation. Pinto (2009) studies the characteristics of innovation diversity
within the European Union. Moncada-Paternò-Castello et al. (2010) discuss
on the corporate research and development system in the EU, compared to the
non-EU one, in terms of performance. Srholec (2009) discusses on the impact
of foreign ownership on cooperation in innovation issues. Anghelache, Niță,
and Badiu (2016) evaluate the position and role of migrants remittances in
the economic development of a country. Voigt and Moncada-Paternò-Castello
(2012) evaluate the possible impact of fast growing R&D-Intensive small and
medium enterprises on the economic structure of the European Union at the
horizon of 2020. Barbosa and Faria (2011) are preoccupied by the institutional
differences across Europe in matters regarding innovations. Block (2012)
analyzes the case of Research & Development investments in family and

Revista Română de Statistică - Supliment nr. 9 / 2017 19
founder fi rms. Onetti et.al. (2012) present competitive business models for new technology-based fi rms. Bravo-Ortega and Marín (2011) develop on the relationships between Research & Development and Productivity. Farole, Rodríguez-Pose, and Storper (2011) analyze the characteristics of the EU cohesion policy.
Research methodology, data, results and discussions
• Research and development costs
One of the key objectives of the European Union’s strategy for increasing research and development is funding. In the European Union, the strategy set in 2010 by 2020 was targeted at long-term objectives which foresaw an annual 3% increase in funding in this area. Global R & D spending amounted to € 284 billion in 2014, up 3.4% year-on-year, up 42% higher than in 2004. In the fi eld of research and development growth The European Union intends in this way to increase labor productivity and to increase the number of jobs offered to the population so that the concrete result of the growth of the gross domestic product will also ensure the possibility of improving the conditions of further development of the economy as a whole, as well as increasing living conditions, ultimately the quality of life. In 2012, there was an increase of 2.01% compared to 2010 and in 2013 by 2.03% as compared to 2012 and by 2014, 2015, 2016, basically the same growth rate, 2.10-2.20% compared to previous periods. As regards the use of research results, gross domestic product growth and growth has been ensured in most European Union countries with a stronger focus on some eastern and even central European countries, of course with a lower level of development , but which, by accessing the research results, have gained more intense growth. A comparative study was carried out between the level of R & D spending in the European Union compared to Japan, the United States and China (excluding Hong Kong). We fi nd that Japan’s highest growth rate of R & D has risen from 3.1% in 2004 to 3.5-3.6% in 2013, 2014 and 2015. The United States the same trend, slightly rising, ranging from 2.5% of GDP growth in 2004 to 2.0-1.2% in 2015, 2016, followed. China, for its part, rose steadily in 2008 being at the same level of gross domestic product allocation equal to that of the United States. The European Union has followed an almost constant trend of 1.7% in 2004, reaching 2% over the last four years. It is noted that all countries taking these as individual countries or a group of countries within the European Union have paid great attention to increasing R & D allocations for R & D. Figure 1 graphically represents the allocation of R & D spending for R & D and Figure 2 shows the evolution of R & D allocations for R & D over the period 2004-2015.
Romanian Statistical Review - Supplement nr. 9 / 201720
The share of R & D expenditures in the Gross Domestic Product in
2004-2014
Figure 1
Source: Eurostat - Key fi gures on Europe 2016, p. 135
The share of R & D expenditures in the Gross Domestic Product in the
years 2004 and 2014 in the European Union
Figure 2
Source: Eurostat - Key fi gures on Europe 2016, p. 136

Revista Română de Statistică - Supliment nr. 9 / 2017 21
It is noted that Finland, Sweden, Denmark, Austria, Germany, Belgium, Slovenia, France, the Czech Republic, the Netherlands, the United Kingdom of Great Britain and Northern Ireland recorded a high rate of R & D spending. They have reached allocation rates of 3.3-3.4%, and in the UK around 2%. In the case of Romania, we fi nd that this allocation in both 2004 and 2014 remained constant, of about 0.4% of the Gross Domestic Product. It is essential that almost all EU Member States, with the exception of Luxembourg and Croatia or Finland and Sweden, have allocated more funds in 2014 than in 2004. Romania has remained at a constant level, which implies the need for an increase in these allocations.
• Staff in research and development
An essential element in achieving R & D is the number of researchers, innovators, who are attracted to these areas of greatest importance for the development of research results in the European Union. The number of researchers in the European Union has increased in the last few years, with 1,760,000 researchers in 2014, an increase of 441,000 researchers, or about 33,6% over 2004. From the study of the staff involved research and development, we fi nd that 48% were concentrated in business sector research, in higher education, or in other key sectors of the national economy. As we have seen, in a number of countries such as Sweden, the Netherlands, Austria, Ireland, France, Malta, Denmark, there has been a signifi cant number of researchers in all these areas. In contrast to the situation in these countries, in the state sector in Bulgaria and Romania there is a large number of researchers engaged in activity among those who have this possibility, but their total number is reduced compared to the other states. Analyzing the research and the number of people in the main fi elds of activity, we fi nd that 67% of them were of the same gender and that of the females being almost half of the staff. In R & D staff, we fi nd that 2% of the workforce in Denmark, 1.9% in Finland, or in Luxembourg were R & D. At the European Union level, 28 states, the extent of research activity was 1.1% of total employment. In Romania, the level of engagement in the total labor force is 0.3% as in Cyprus, and in Sweden by 1.6%. An age group study, an art that in recent years has increased the number of researchers aged 20-29, the number of graduate graduates dedicated to research has reached 12.7 ‰, of course there are differences from one country to another. Figure 3 shows the share of the full-time occupation rate with a labor contract in the fi eld of research.

Romanian Statistical Review - Supplement nr. 9 / 201722
Full-time researchers by sectors of activity in 2014 (% of total)
Figure 3
Source: Eurostat - Key fi gures on Europe 2016, p. 138
Four areas were considered in this regard, namely the business sector, the higher education sector, the government sector and the private non-profi t sector. It is noted that the highest share is occupied in the business sector and then the higher education sector in these countries. In Romania we fi nd that three areas have the important share of research in the fi eld of business, research in the fi eld of higher education and government-supported research, the research activity in the private fi eld being practically insignifi cant. The study shows that the share of business research is high in most developed countries such as Sweden, Austria, the Netherlands, France, Malta, Germany

Revista Română de Statistică - Supliment nr. 9 / 2017 23
and others, being somewhat lower in countries such as Romania, Bulgaria, Cyprus, Croatia and Greece much to undertake to achieve a high standard of research and employment in this area. Fugue 4 shows the number of graduates working in science and technology, this being represented in promiles and refers to the age group of 20-29 years.
Number of graduates in science and technology in 2014 (tertiary science and technology graduates from 1 000 people aged 20-29)
Figure 4
Source: Eurostat - Key fi gures on Europe 2016, p. 139
Please note that in most countries the number of men employed in this area is signifi cantly higher. And in Romania there are about 18 ‰ men in the research and technological fi eld and only 13.5 ‰ among women. Some
Romanian Statistical Review - Supplement nr. 9 / 201724
countries, such as Luxembourg, Cyprus, have a rather low occupation, simply because these countries do not have a very substantial level of economic development and therefore their share is somewhat reduced. The data can be deepened by determining the level of graduate engagement in these two areas that give meaning and essence to the research that underpins the economic development of each country.
• Innovation
Innovation is the most accurate form of research development to ensure the sustainable growth of the Member States of the European Union. The EU’s established strategy encourages Member States to pursue an appropriate policy of enhancing innovation in all areas, but especially at the cutting edge of the national economy. Almost half of the EU member states showed that in the fi eld of economic research 48.9% represented innovations in 2008-2010, which represented 3.9% of the total number of researchers. Approximately one quarter of the EU Member States have organized innovation activities, with signifi cant outcomes that have been introduced in the fi eld of business activity. Of the total of the European Union, approximately 23.7% of enterprises have appealed and introduced innovative processes both in the fi eld of activities and in the wider fi eld of the national economy. From this point of view, we can appreciate that in the area of the innovation implementation system, enterprises from various fi elds of activity organized their own innovation activity, individually supported innovation or attracted innovative projects in economic activity. Approximately 6 out of 10 innovation projects have been used effectively and comprehensively, being implemented in the work of the major producers in each Member State. 28.5% of entrepreneurs in the economic fi eld consider it important to attract new innovations and inventions so as to ensure a competitive and signifi cant increase in economic activity. Less than half of these methods are of particular importance, but we fi nd that by 2016 the level of implementation of innovations in economic and social activities reached 51.2%. Table 1 shows the extent to which innovations have been implemented in economic activity. It is the percentage of enterprises that have recourse to them, as well as the percentage of entrepreneurial innovations that have found their use and application in the economic fi elds.

Revista Română de Statistică - Supliment nr. 9 / 2017 25
Share of innovative enterprises by type of implementation, 2010-2012
Table 1
Source: Eurostat - Key fi gures on Europe 2016, p. 141
As far as Romania is concerned, we fi nd that in 2010, 4.6% were attracted innovations, and from the point of view of logistics, distribution, and so on, it increased from 31.6% to 69.3% with regard to the use of new methods of increasing economic processes. Figure 5, Methods for Maintaining and Enhancing Competitiveness in Production and Innovative Process, presents a graph showing how the percentage was used in the production process.
Romanian Statistical Review - Supplement nr. 9 / 201726
Methods for Maintaining and Enhancing Competitiveness in Production
and / or Innovative Process by Importance, EU-28, 2010-2012 (% of all innovative product and / or process enterprises)
Figure 5
Source: Eurostat - Key fi gures on Europe 2016, p. 142
Fields are taken for design, patents, processes, innovations, complexity of goods and services, the idea of increasing the values and benefi ts of economic activity.
• Analysis of the use of manufacturing patents
The patents refl ect the initiative of exploitation activity and capacity in
the economic potential of innovations. In this context, the indicators used show
increased access of all EU Member States to manufacturing patents. Of the total
number of patents applied in the European Union, 142.7 thousand were used in
2014, which increased from 56.6 thousand in 2010. The patents used increased
annually, thus ensuring an increase in the effi ciency of the quality and results of
the activities economic. Among the Member States, Germany has the highest
percentage of patents applicable in 2014, namely 20.7 thousand (36.5% of the total European Union), followed by France by 9.1 thousand, Italy 4.2 thousand, the Netherlands 3, 2 thousand, Sweden 3,4 thousand. And some non-member countries have a high percentage of use of manufacturing patents, such as the United States - 36.8 thousand, Japan - 21.3 thousand, followed by China - 7.5 thousand or South Korea - 6.8 thousands. In terms of population, the number of patents is high in Sweden, Finland, Denmark or Austria, with a high number of patents compared to the population of the European Union. Applied patents in the fi eld of information and technological communications represent a third,

Revista Română de Statistică - Supliment nr. 9 / 2017 27
almost 32% of the total used in 2012-2016. Their number has increased and will further increase as a result of the development of the information system, of the technological communications. Thus, in a number of EU Member States, we have a record of applied patents such as Germany, France, Great Britain, Sweden, Holland, Italy, Finland, which have over 500 applications. Other Member States of the European Union have a lower number of patents applied to them, also taking into account the extent of their economic development. The number of these patents applied in non-EU countries was high enough, for example in the United States - 11.9 thousand, in Japan - 7.6 thousand, in China and South Korea registering higher percentages than in the Member States of the European Union and even in Germany. Figure 6 shows patents applied over the period 2000-2014 as a structure for one million citizens.
Patent applications to the EPO, 2004 and 2014 (per million inhabitants)Figure 6
Source: Eurostat - Key fi gures on Europe 2016, p. 144

Romanian Statistical Review - Supplement nr. 9 / 201728
Here are the top places in 2004 and 2014, with Sweden, Finland, Germany, Denmark, Austria, Holland, France or Belgium rising. In Luxembourg as well as in Germany or the Netherlands, the number of patents applied in 2014 was lower than those used and implemented in 2004. As far as Romania is concerned, we fi nd that in 2004, there are no data or more sincere, the level of patent application in that domain was reduced, reaching about 2 percent in 2014. Figure 7 also shows graphically applying patents in the fi eld of information and communications. It refers to the number of such patents used.
Patent applications at EPO - ICT, 2012 (number)
Figure 7
Source: Eurostat - Key fi gures on Europe 2016, p. 145
At the European Union level, the level was 10,367 per total, of which Germany implemented 4.787, France 2,693 followed by Great Britain,

Revista Română de Statistică - Supliment nr. 9 / 2017 29
Holland, Italy, Finland. Regarding Romania’s situation, we fi nd that it has implemented only 10-15 annual patents from 2012 to 2016. Compared with non-member states, we fi nd that the four United States (11,933 patents), Japan (7,581 patents) China (3,299 patents), South Korea (3,177 patents) or located net above the entire community of the European Union, from the point of view of the use of manufacturing patents.
Conclusions
Regarding the study carried out in relation to the evolution of science, we fi rst notice an increase in the level of research and development, the engagement of an increasing number of staff in these fi elds, the increase of the innovations and the patents applied in the activity social and economic. It is noted that the level of research and development included ever higher weightings that ensured improved production quality, improved economic, social and administrative management, ensure unrestricted access to information and high documentation capability. The fi gures analyzed reveal the European Union’s concern that the strategy for the last decade 2010-2020 in this area is to achieve the goal and ensure a superior implementation of the results of research and innovation in the economic activity. The article highlights the European Union’s concern to improve research and development in the Member States, allowing for the launch of large-scale joint projects.
References
1. Akçomaka, I. S. and ter Weel, B. (2009). Social capital, innovation and growth: Evidence from Europe. European Economic Review, 53 (5), 544-567
2. Anghelache, C., Manole, A., Anghel, M. G. and Popovici, M. (2016). Human resources: their role and development in the national economy. Romanian
Statistical Review Supplement, 4, 59-65 3. Anghelache, C., Niță, G. and Badiu, A. (2016). Migrants remittances – an important
and stable source of external funds, in the economic development of a country, Romanian Statistical Review, Supplement, 12, 83-90
4. Barbosa, N. and Faria, A. P. (2011). Innovation across Europe: How important are institutional differences?. Research Policy, 40 (9), 1157-1169
5. Block, J. H. (2012). R&D investments in family and founder fi rms: An agency perspective. Journal of Business Venturing, 27 (2), 248-265
6. Bravo-Ortega, C. and Marín, A. G. (2011). R&D and Productivity: A Two Way Avenue?. World Development, 39 (7), 1090-1107
7. Buesaa, M., Heijsa, J. and Baumert, T. (2010). The determinants of regional innovation in Europe: A combined factorial and regression knowledge production function approach. Research Policy, 39 (6), 722-735
8. Cincera, M. and Veugelers, R. (2013). Young leading innovators and the EU’s R&D intensity gap. Economics of Innovation and New Technology, 22 (2), 177-198
9. Cruz-Jesus, F., Oliveira, T. and Bacao, F. (2012). Digital divide across the European Union. Information & Management, 49 (6), 278-291
Romanian Statistical Review - Supplement nr. 9 / 201730
10. Dachs, B. and Pyka, A. (2010). What drives the internationalisation of innovation? Evidence from European patent data. Economics of Innovation and
New Technology, 19 (1), 71-86 11. Farole. T., Rodríguez-Pose, A. and Storper, M. (2011). Cohesion Policy in the
European Union: Growth, Geography, Institutions. Journal of Common Market
Studies, 49 (5), 1089–1111 12. Isaic-Maniu, A., Anghelache, C., Mitruţ, C. and Voineagu, V. (2007). Evoluţii în
activitatea de Cercetare-Dezvoltare-Inovare (CDI). Revista Română de Statistică, Supliment, decembrie 2007, 10-17
13. Moncada-Paternò-Castello, P. et al. (2010). Does Europe perform too little corporate R&D? A comparison of EU and non-EU corporate R&D performance. Research Policy, 39 (4), 523-536
14. Onetti, A., Zucchella, A., Jones, M. V. and McDougall-Covin, P. P. (2012). Internationalization, innovation and entrepreneurship: business models for new technology-based fi rms. Journal of Management & Governance, 16 (3), 337–368
15. Pinto, H. (2009). The Diversity of Innovation in the European Union: Mapping Latent Dimensions and Regional Profi les. European Planning Studies, 17 (2), 303-326
16. Rodríguez-Pose, A. (2008). Research and Development, Spillovers, Innovation Systems, and the Genesis of Regional Growth in Europe. Regional Studies, 42 (1), 51-67
17. Srholec, M. (2009). Does foreign ownership facilitate cooperation on innovation? Firm-level evidence from the enlarged European Union. The European Journal of Development Research, 21 (1), 47–62
18. Voigt, P. and Moncada-Paternò-Castello, P. (2012). Can Fast Growing R&D-Intensive Smes Affect the Economic Structure of the Eu Economy?: A Projection to the Year 2020. Eurasian Business Review, 2 (2), 96–128
*** Eurostat - Key fi gures on Europe 2016
Revista Română de Statistică - Supliment nr. 9 / 2017 31
Specifi c Approaches to yhe Methodology of the Industrial Production Index Calculation at
County Level
Viorel ŢARCĂ, PhD. ([email protected])
Statistics Directorate of Iaşi County
Abstract Industrial production index is an extremely important statistical
indicator, which should refl ect as faithfully as possible the actual variations of the industrial production volume evolution, both at the national level and in each self-governing territorial unit. Considering the high number of mainly theoretical approaches to the study of these methodologically complex issues, this paper aims at describing the theoretical aspects in a logically structured manner, while referring in a consistent manner to the main practical steps that need to be taken. The fi nal goal is to disseminate statistical indicators that satisfy the information needs of all categories of benefi ciaries. At the same time, one should also bear in mind that the statistical information about the short-term evolution of this industrial indicator must be provided in a consistent manner for all the European Union member states. In our paper, special emphasis is laid on ensuring an adequate sample representativeness level, both from the viewpoint of the number, structure and value of the industrial products composing it, seen through the eyes of families (CAEN Rev. 2 and PROD1), and from the viewpoint of the reporting businesses, mainly as concerns their turnover percentage in the self-governing territorial unit under consideration, in the year used as reference reporting year. Key words: industrial production index, turnover, average monthly production, average selling price, PRODROM and CAEN Rev. 2 classifi cations.JEL Classifi cation: L11, L16
1. Introduction The industrial production index determines the production results or volume and it aims at identifying production volume variations over a time period determined in reference to a time period considered the reposting basis. Industrial production indices measure its evolution overall, on sections (extractive industry, manufacturing industry and electricity, heating, gas, hot water and air conditioning production and supply), CAEN Rev. 2 divisions (05÷35 divisions, excluding group 353) and large industrial groups

Romanian Statistical Review - Supplement nr. 9 / 201732
(intermediate supplies industry, capital goods industry, durable goods industry, current goods industry and energy industry). The issue of specifi c industrial production index (IPI) calculation methodologies has gained a very important place lately, especially due to the need of harmonization with the European Union laws and practices. Thus, researchers produced a series of studied focused mainly on a purely theoretical approach, designed to contribute to a better understanding of the statistical notions involved in the analysis of this complex phenomenon (Alexevici et al, 2010, Pârţachi and Cara, 2012).
The object of our statistical research is both the value indicators on
the industrial production achieved, on the products delivered to both domestic
and foreign consumers, on the whole set of industrial products and services
provided by businesses over a particular time period, using their own and their
clients’ raw material (lohn system).
The industrial products and services classifi cation (PRODROM) used
to collect the industrial production data (CAEN Rev. 2 sections: B, C and D)
is fully harmonized with the EU classifi cation, namely the PRODCOM list.
The businesses which provide data on their industrial production on a
monthly basis, in the statistical research – Short-term industry indicators, make
up a representative group of companies with their business object in the industrial
sector, i.e. all the companies with more than 50 employees, and a partial group
of companies with 4 to 49 employees, which were selected to ensure 90%
representativeness of the whole industry and at least 80% representativeness of
the CAEN Rev.2 division, from the standpoint of their turnover.
2. Material and Method
The Laspeyres weighting system is used to calculate the group indices
of industrial production, the industrial production volume variation being
weighted with the basic level of the qualitative factor, i.e. the average price of
the products in the year set as reporting standard (U.N.S.D, 2010).
According to the industrial production index calculation methodology
approved by the order no. 231 / 27.05.2002 of the National Statistics Institute
(I.N.S.) chairman, the aggregation of the primary industrial production indices
is done by a system of successive weightings, where the fi rst aggregation level
uses the average unit price of the product, and the superior levels (divisions)
rely on gross value added at factor costs (VABCF). Both weighting elements
are those reported for the year set as reporting standard.
Traditionally, when each industrial product is reported and registered in
quantitative units of measurement (kg, tons, m2, m3, pieces, thousands of kWh,
Gcal, etc.), the industrial production volume is determined according to the formula:

Revista Română de Statistică - Supliment nr. 9 / 2017 33
100
100
101
0/1 ⋅
⋅
⋅
=
∑
∑
=
=
k
iii
k
iii
Q
PQ
PQI (1)
where: Qi1 = quantity of product i manufactured in the current period Qi0 = quantity of product i manufactured in the reference period Pi0 = average price of product i in the reference period The average price pertaining to the reference year for each industrial product „i” in the sample is calculated using the following formula:
)int( 000
00
iii
ii LmatLextL
VP
++= (2)
where: Vi0 = value of product i manufactured in the reference period (year) Linti0 = physical production of product i delivered in the country in the reference period Lexti0 = physical production of product i delivered outside the country in the reference period Lmati0 = physical production of product i manufactured with the clients’ material in the reference period
However, in practice, depending on the units of measurement used in the monthly statistical research of short-term industry indicators (IND TS) for each basic PRODROM product in the sample, one may distinguish between two different approaches to industrial production: A. Value-based, specifi c to (PRODROM) products / families of
products – control series (PROD1) the production of which is reported directly
in monetary units (lei); in this situation, after its aggregation on divisions, the
value-based volume of industrial production will be defl ated by adjusting it
using the industrial production price index (IPPI) with fi xed monthly base, at
national level, communicated by the National Statistics Institute;
1000/1
1
11
⋅
⋅
=
∑=
IPPI
PQPRODVAL
v
iii
(3)
where: Qi1 = quantity of product i manufactured in the current period Pi1 = average price of product i in the current period IPPI1/0 = industrial production price index at national level in the current month as compared to the corresponding month in the reference year
Romanian Statistical Review - Supplement nr. 9 / 201734
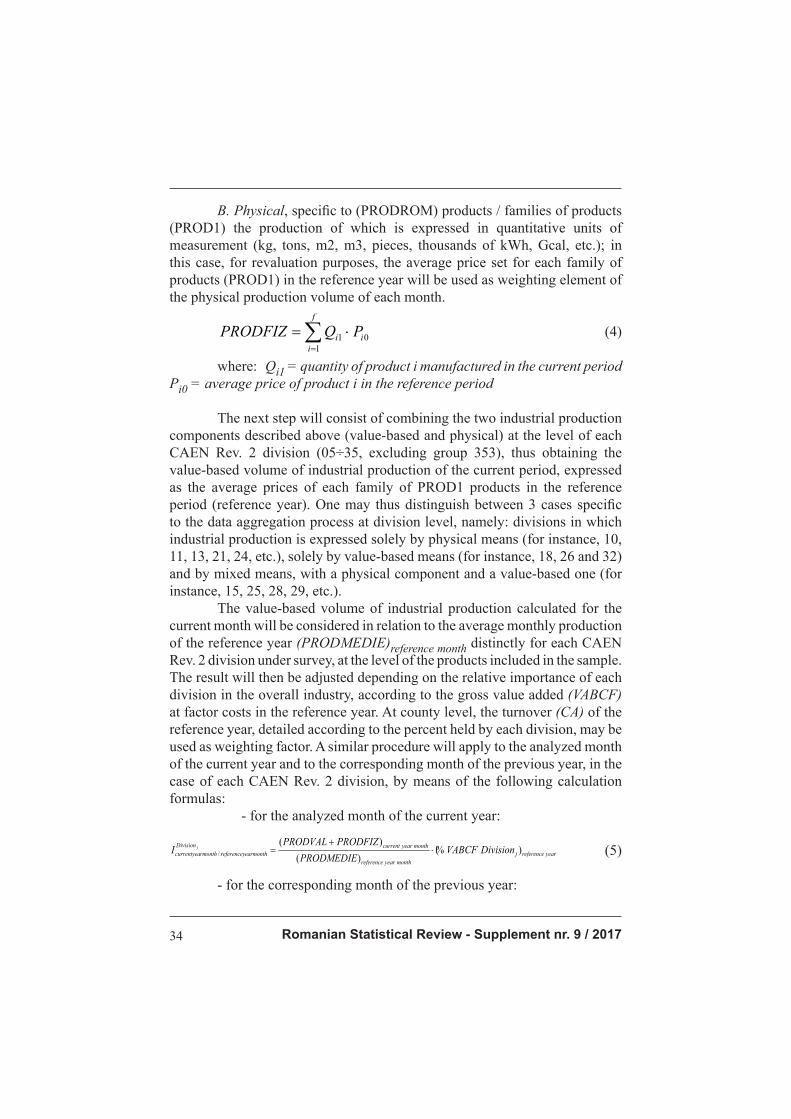
B. Physical, specifi c to (PRODROM) products / families of products
(PROD1) the production of which is expressed in quantitative units of
measurement (kg, tons, m2, m3, pieces, thousands of kWh, Gcal, etc.); in
this case, for revaluation purposes, the average price set for each family of
products (PROD1) in the reference year will be used as weighting element of
the physical production volume of each month.
∑=
⋅=
f
iii PQPRODFIZ
1
01 (4)
where: Qi1 = quantity of product i manufactured in the current periodPi0 = average price of product i in the reference period
The next step will consist of combining the two industrial production
components described above (value-based and physical) at the level of each
CAEN Rev. 2 division (05÷35, excluding group 353), thus obtaining the
value-based volume of industrial production of the current period, expressed
as the average prices of each family of PROD1 products in the reference
period (reference year). One may thus distinguish between 3 cases specifi c
to the data aggregation process at division level, namely: divisions in which
industrial production is expressed solely by physical means (for instance, 10,
11, 13, 21, 24, etc.), solely by value-based means (for instance, 18, 26 and 32)
and by mixed means, with a physical component and a value-based one (for
instance, 15, 25, 28, 29, etc.).
The value-based volume of industrial production calculated for the
current month will be considered in relation to the average monthly production
of the reference year (PRODMEDIE)reference month distinctly for each CAEN
Rev. 2 division under survey, at the level of the products included in the sample.
The result will then be adjusted depending on the relative importance of each
division in the overall industry, according to the gross value added (VABCF) at factor costs in the reference year. At county level, the turnover (CA) of the
reference year, detailed according to the percent held by each division, may be
used as weighting factor. A similar procedure will apply to the analyzed month
of the current year and to the corresponding month of the previous year, in the
case of each CAEN Rev. 2 division, by means of the following calculation
formulas:
- for the analyzed month of the current year:
yearreferencejmonthyearreference
monthyearcurrentDivision
earmonthreferenceyrmonthcurrentyea DivisionVABCFMEDIEPROD
PRODFIZPRODVALI j )(%
)(
)(/ ⋅
+=
(5)
- for the corresponding month of the previous year:

Revista Română de Statistică - Supliment nr. 9 / 2017 35
yearreferencejmonthyearreference
yearmonthpreviousDivision
monthyearreferencemonthyearprevious DivisionVABCFMEDIEPROD
PRODFIZPRODVALI j )(%
)(
)(/ ⋅
+=
(6)
The general index, which characterizes the overall industrial production volume variation in the current month (or the corresponding month of the previous year) in relation to the average level of the indicator determined in the reference period, for the entire industry, is calculated by summing up the aforementioned fi xed base indices (formulas 5 and 6) for each
CAEN division.
- for the analyzed month of the current year:
∑=
=n
j
Division
monthyearreferencemonthyearcurrentindustryTotal
monthyearreferencemonthyearcurrentjII
1
// (7)
- for the corresponding month of the previous year:
∑=
=n
j
Division
monthyearreferencemonthyearpreviousindustrieTotal
monthyearreferencemonthyearpreviousjII
1
//
(8)
The industrial production index quantifying the changes occurred in
the evolution of the production volume in the analyzed month of the current
year as compared to the similar month of the previous year is determined for
each division as the ratio of the two fi xed base indices described above in the
(5) and (6) formulas, namely:
100/
/
/ ⋅=j
j
j
Division
monthyearreferencemonthyearprevious
Division
monthyearreferencemonthyearcurrentDivision
monthyearpreviousmonthyearcurrentI
II (9)
The general index, which characterizes the overall industrial production
volume variation in the current month as compared to the corresponding
month of the previous year, for the entire industry, is calculated in the same
manner, in relation to the fi xed base indices in the (6) and (7) formulas:
100/
/
/ ⋅=industryTotal
monthyearreferencemonthyearprevious
industryTotalmonthyearreferencemonthrcurrentyeaindustryTotal
monthyearpreviousmonthyearcurrent I
II (10)
In order to determine the aggregated industrial production volume
indices for the current quarter / year in relation to the corresponding period of
the previous year, the simple arithmetic mean of the monthly indices calculated
by means of the (9) and (10) formulas is used in practice:
a) for each CAEN division:
- for a quarter:
3
3
1
/
./
∑== i
Division
rmonthpreviousyarmonthcurrentyeaDivision
quarteryearpreviousryearquartecurrent
j
iij
II (11)
Romanian Statistical Review - Supplement nr. 9 / 201736
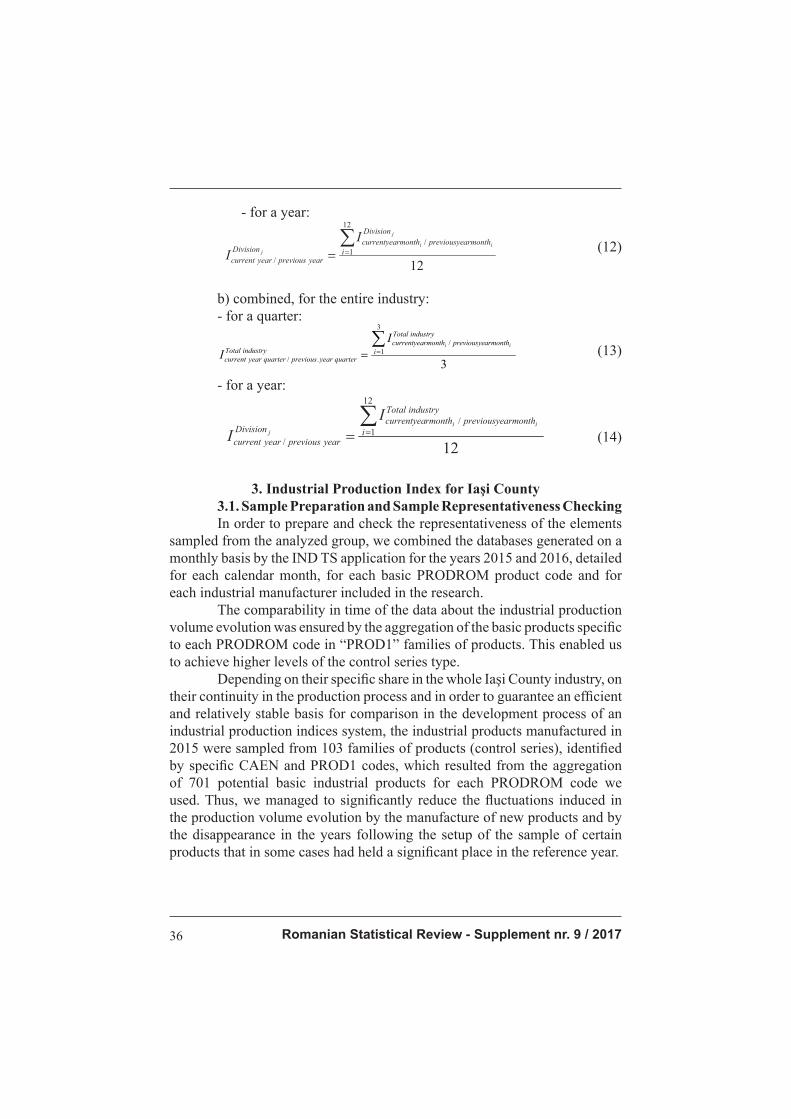
- for a year:
12
12
1
/
/i
Division
armonthpreviousyermonthcurrentyeaDivision
yearpreviousyearcurrent
j
ii
j
I
I (12)
(12)
b) combined, for the entire industry: - for a quarter:
3
3
1/
./
∑== i
industryTotalarmonthpreviousyermonthcurrentyea
industryTotalquarteryearpreviousquarteryearcurrent
iiI
I (13)
- for a year:
12
12
1
/
/i
industryTotal
armonthpreviousyermonthcurrentyeaDivision
yearpreviousyearcurrent
ii
j
I
I (14) (14)
3. Industrial Production Index for Iaşi County 3.1. Sample Preparation and Sample Representativeness Checking In order to prepare and check the representativeness of the elements sampled from the analyzed group, we combined the databases generated on a monthly basis by the IND TS application for the years 2015 and 2016, detailed for each calendar month, for each basic PRODROM product code and for each industrial manufacturer included in the research. The comparability in time of the data about the industrial production volume evolution was ensured by the aggregation of the basic products specifi c
to each PRODROM code in “PROD1” families of products. This enabled us
to achieve higher levels of the control series type.
Depending on their specifi c share in the whole Iaşi County industry, on
their continuity in the production process and in order to guarantee an effi cient
and relatively stable basis for comparison in the development process of an
industrial production indices system, the industrial products manufactured in
2015 were sampled from 103 families of products (control series), identifi ed
by specifi c CAEN and PROD1 codes, which resulted from the aggregation
of 701 potential basic industrial products for each PRODROM code we
used. Thus, we managed to signifi cantly reduce the fl uctuations induced in
the production volume evolution by the manufacture of new products and by
the disappearance in the years following the setup of the sample of certain
products that in some cases had held a signifi cant place in the reference year.
Revista Română de Statistică - Supliment nr. 9 / 2017 37
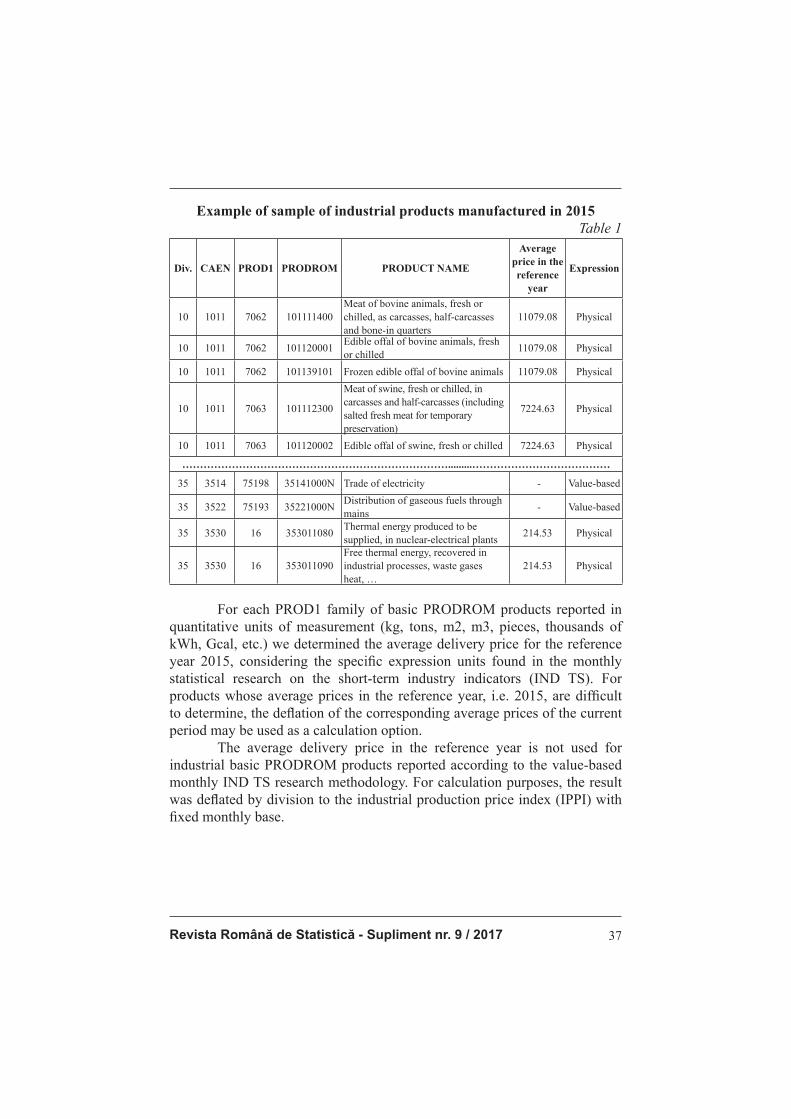
Example of sample of industrial products manufactured in 2015 Table 1
Div. CAEN PROD1 PRODROM PRODUCT NAME
Average price in the reference
year
Expression
10 1011 7062 101111400Meat of bovine animals, fresh or chilled, as carcasses, half-carcasses and bone-in quarters
11079.08 Physical
10 1011 7062 101120001Edible offal of bovine animals, fresh or chilled
11079.08 Physical
10 1011 7062 101139101 Frozen edible offal of bovine animals 11079.08 Physical
10 1011 7063 101112300
Meat of swine, fresh or chilled, in carcasses and half-carcasses (including salted fresh meat for temporary preservation)
7224.63 Physical
10 1011 7063 101120002 Edible offal of swine, fresh or chilled 7224.63 Physical
………………………………………………………………….........…………………………………
35 3514 75198 35141000N Trade of electricity - Value-based
35 3522 75193 35221000NDistribution of gaseous fuels through mains
- Value-based
35 3530 16 353011080Thermal energy produced to be supplied, in nuclear-electrical plants
214.53 Physical
35 3530 16 353011090Free thermal energy, recovered in industrial processes, waste gases heat, …
214.53 Physical
For each PROD1 family of basic PRODROM products reported in quantitative units of measurement (kg, tons, m2, m3, pieces, thousands of kWh, Gcal, etc.) we determined the average delivery price for the reference year 2015, considering the specifi c expression units found in the monthly
statistical research on the short-term industry indicators (IND TS). For
products whose average prices in the reference year, i.e. 2015, are diffi cult
to determine, the defl ation of the corresponding average prices of the current
period may be used as a calculation option.
The average delivery price in the reference year is not used for
industrial basic PRODROM products reported according to the value-based
monthly IND TS research methodology. For calculation purposes, the result
was defl ated by division to the industrial production price index (IPPI) with
fi xed monthly base.

Romanian Statistical Review - Supplement nr. 9 / 201738
Value-based industrial production in the sample and for all reporting businesses in the monthly IND TS research
- lei -SAMPLE (191 companies and 235 products) TOTAL (219 businesses and 314 products)
YEAR MONTH PRODUCTION YEAR MONTH PRODUCTION2015 1 396,521,961 2015 1 401,692,7402015 2 400,652,800 2015 2 407,058,1872015 3 432,427,412 2015 3 439,704,7282015 4 446,269,050 2015 4 453,121,4722015 5 425,676,738 2015 5 432,210,5972015 6 438,167,866 2015 6 444,844,7892015 7 406,545,202 2015 7 412,294,0912015 8 347,253,117 2015 8 352,425,1542015 9 446,227,414 2015 9 452,285,8672015 10 450,517,537 2015 10 459,118,7912015 11 447,265,365 2015 11 453,078,6312015 12 407,827,441 2015 12 413,758,082
TOTAL 5,045,351,903 TOTAL 5,121,593,129
Representativeness 2015: 98.5%ESANTION (188 companies and 233 products) TOTAL (216 companies and 306 products)
YEAR MONTH PRODUCTION YEAR MONTH PRODUCTION2016 1 434,143,515 2016 1 439,904,7072016 2 463,615,703 2016 2 471,022,3392016 3 493,246,010 2016 3 501,498,0932016 4 488,334,896 2016 4 497,257,8572016 5 457,334,169 2016 5 465,858,3242016 6 455,650,684 2016 6 465,711,4302016 7 400,651,864 2016 7 410,744,9502016 8 384,475,258 2016 8 391,463,6342016 9 414,318,205 2016 9 423,389,0382016 10 470,479,362 2016 10 478,437,6882016 11 490,802,708 2016 11 502,116,5312016 12 430,447,968 2016 12 439,341,595
TOTAL 5,383,500,342 TOTAL 5,486,746,186
Representativeness 2016: 98.1%
The sample, which is based on 103 PROD1 groups as shown above, includes, for the reference year 2015, 235 products of the 314 assortments reported by all the businesses which provided data in the monthly IND TS researches. It represents 98.5% of the total value-based production of that period. In order to check representativeness for the following year, we calculated the value-based production percentage of the 233 products of the 306 industrial assortments for 2016. In this case, the representativeness percentage was 98.1%.
Revista Română de Statistică - Supliment nr. 9 / 2017 39
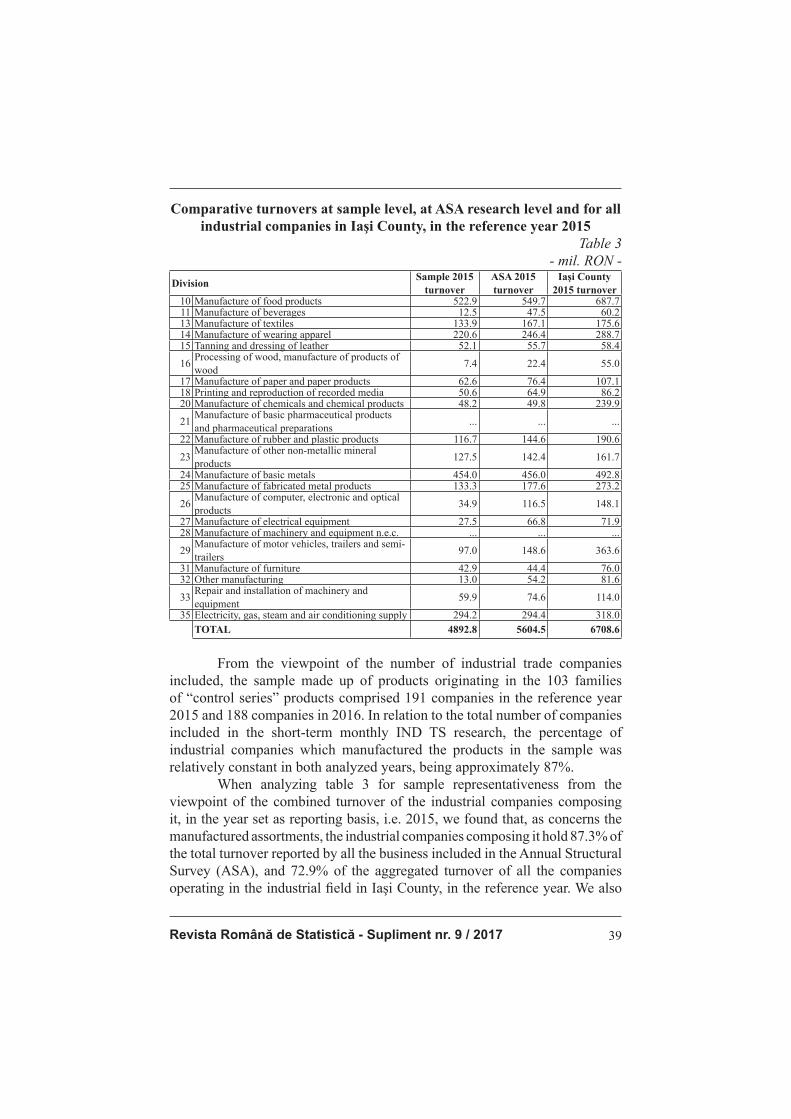
Comparative turnovers at sample level, at ASA research level and for all industrial companies in Iaşi County, in the reference year 2015
Table 3- mil. RON -
DivisionSample 2015
turnover ASA 2015 turnover
Iaşi County 2015 turnover
10 Manufacture of food products 522.9 549.7 687.711 Manufacture of beverages 12.5 47.5 60.213 Manufacture of textiles 133.9 167.1 175.614 Manufacture of wearing apparel 220.6 246.4 288.715 Tanning and dressing of leather 52.1 55.7 58.4
16Processing of wood, manufacture of products of wood
7.4 22.4 55.0
17 Manufacture of paper and paper products 62.6 76.4 107.118 Printing and reproduction of recorded media 50.6 64.9 86.220 Manufacture of chemicals and chemical products 48.2 49.8 239.9
21Manufacture of basic pharmaceutical products and pharmaceutical preparations
... ... ...
22 Manufacture of rubber and plastic products 116.7 144.6 190.6
23Manufacture of other non-metallic mineral products
127.5 142.4 161.7
24 Manufacture of basic metals 454.0 456.0 492.825 Manufacture of fabricated metal products 133.3 177.6 273.2
26Manufacture of computer, electronic and optical products
34.9 116.5 148.1
27 Manufacture of electrical equipment 27.5 66.8 71.928 Manufacture of machinery and equipment n.e.c. ... ... ...
29Manufacture of motor vehicles, trailers and semi-trailers
97.0 148.6 363.6
31 Manufacture of furniture 42.9 44.4 76.032 Other manufacturing 13.0 54.2 81.6
33Repair and installation of machinery and equipment
59.9 74.6 114.0
35 Electricity, gas, steam and air conditioning supply 294.2 294.4 318.0TOTAL 4892.8 5604.5 6708.6
From the viewpoint of the number of industrial trade companies included, the sample made up of products originating in the 103 families of “control series” products comprised 191 companies in the reference year 2015 and 188 companies in 2016. In relation to the total number of companies included in the short-term monthly IND TS research, the percentage of industrial companies which manufactured the products in the sample was relatively constant in both analyzed years, being approximately 87%. When analyzing table 3 for sample representativeness from the viewpoint of the combined turnover of the industrial companies composing it, in the year set as reporting basis, i.e. 2015, we found that, as concerns the manufactured assortments, the industrial companies composing it hold 87.3% of the total turnover reported by all the business included in the Annual Structural Survey (ASA), and 72.9% of the aggregated turnover of all the companies operating in the industrial fi eld in Iaşi County, in the reference year. We also

Romanian Statistical Review - Supplement nr. 9 / 201740
noted that the representativeness percentages in the aggregated turnover of all the reporting companies included in ASA 2015, for 10 divisions, i.e. 10, 14, 15, 20, 21, 23, 24, 28, 31 and 35, which hold together about 85% of the turnover of the whole sample, range between 90 and 100% for each of them.
3.2. Determination of the Average Value-Based Level of Industrial Production in the Reference Year
Using the aggregated monthly industrial production database in the reference year, which comprises the industrial companies and industrial products included in the research, we extracted the monthly industrial productions separately for each analyzed division in both versions mentioned above, namely physical and value-based, and we then combined them for each CAEN Rev. 2 division (table 4), considering all the three cases that may occur in practice: 1. divisions in which industrial production is expressed solely by
physical means (for instance, 10, 11, 13, 21, 24, etc.);
Physical and value-based aggregation of monthly industrial production in the sample on divisions, in the reference year 2015
Table 4- thousands of lei -
Division JAN FEB … DECAVERAGE
VALUE PER YEAR
10 Manufacture of food products 46,413.27 45,660.13 … 67,970.85 56,072.4311 Manufacture of beverages 545.41 707.44 … 563.36 1,140.3112 Manufacture of textiles - - - - -13 Manufacture of wearing apparel 10,405.27 8,313.72 … 10,458.58 17,547.9414 Tanning and dressing of leather 31,399.01 34,982.57 … 14,688.35 27,497.1915 Processing of wood, manufacture of products of wood 2,771.78 3,346.01 … 1,590.74 2,357.1016 Manufacture of paper and paper products 104.75 231.05 … 202.93 174.0017 Printing and reproduction of recorded media 4,902.49 4,974.54 … 4,149.41 4,961.9318 Manufacture of chemicals and chemical products 3,030.08 3,052.30 … 3,501.51 3,828.46
19 Manufacture of basic pharmaceutical products and pharmaceutical preparations - - - - -
20 Manufacture of rubber and plastic products 2,541.95 2,288.02 … 3,565.56 3,319.1121 Manufacture of other non-metallic mineral products ... ... … ... ...22 Manufacture of basic metals 2,645.56 2,481.02 … 3,298.55 2,991.1123 Manufacture of fabricated metal products 4,886.62 8,059.96 … 6,658.14 9,077.5024 Manufacture of computer, electronic and optical products 37,193.26 37,913.86 … 37,629.81 43,676.3025 Manufacture of electrical equipment 7,766.21 9,982.78 … 7,062.25 10,416.9726 Manufacture of machinery and equipment n.e.c. 1,701.95 2,055.06 … 3,083.25 2,580.4227 Manufacture of motor vehicles, trailers and semi-trailers 1,161.23 1,148.73 … 1,049.69 1,193.9928 Manufacture of furniture ... ... … ... ...29 Other manufacturing 5,354.85 6,798.02 … 5,709.51 6,116.5830 Repair and installation of machinery and equipment - - - - -31 Electricity, gas, steam and air conditioning supply 2,983.97 3,222.07 … 3,884.81 2,969.4832 Manufacture of food products 697.97 950.10 … 1,064.70 1,178.1433 Manufacture of beverages 1,463.88 4,414.27 … 8,302.71 4,529.4335 Manufacture of textiles 40,269.30 36,348.61 … 39,502.90 27,900.95
Revista Română de Statistică - Supliment nr. 9 / 2017 41
2. divisions in which industrial production is expressed solely by value-based means (for instance, 18, 26 and 32);
3. divisions in which industrial production is expressed by mixed means, with a physical component and a value-based one (de ex. 15, 25, 28, 29, etc.).
We then determined the simple arithmetic mean of the monthly value-based production fi gures for the reference year, an element which will be used
as reporting base in the IPI system, each fi xed base index at division level
being calculated in relation to these average values and then adjusted with the
weight of each CAEN division in the entire industry from the viewpoint of
the gross value added (VABCF) at cost factors or, in an alternative calculation
version, of the turnover (CA) in the reference year.
3.3. Turning the Monthly Average Industrial Production in the Two Reporting Years into Reference Period Prices For example purposes, we considered the industrial production of
the month of January 2017 (tables 5 and 6) and the two main sub-systems
composing it:
a) the component expressed directly in monetary units, when the value-
based volume of industrial production, and then the aggregation
on divisions, will be defl ated by adjusting it with the industrial
production price index (IPPI) with fi xed monthly base (formula 3);
b) physical component, in case of industrial assortments the production
of which is expressed in quantitative units of measurement (kg,
tons, m2, m3, pieces, thousands of kWh, Gcal, etc.), case in which,
for reassessment purposes, the average price originally set for each
family of products (PROD1) in the reference year (formula 4) will
be used as weighting factor for each product with quantitative
expression.

Romanian Statistical Review - Supplement nr. 9 / 201742
Turning components of the (physical and value-based) monthly industrial production into value-based version and reference year prices,
for division 15 “Tanning and dressing of leather”Table 5
5.1. Physical component
Div. Unit. PROD1 PRODROM Product Name UMPhysical
production
Average
price per
reference
year
(RON)
Physical
production
in basic
prices
(thousands
of RON)15 A 3547 152013520 Footwear with leather uppers... pairs 3551 149.62 531.3
15 A 3547 152013620 Women’s sandals, with uppers... pairs 1007 149.62 150.7
15 A 3574 151212200 Leather handbags... pieces 163 12.43 2.0
15 B 3547 152013510 Footwear with leather uppers... pairs 0 149.62 0.0
15 B 3547 152013520 Footwear with leather uppers... pairs 9400 149.62 1406.4
15 C 3574 151212300 Pocket-sized articles... pieces 47510 12.43 590.5
15 D 3547 152013510 Footwear with leather uppers... pairs 862 149.62 129.0
15 D 3547 152013520 Footwear with leather uppers... pairs 558 149.62 83.5
15 E 3574 151212100 Trunks, suitcases and vanity cases... pieces 4921 12.43 61.2
15 H 3547 152013510 Footwear with leather uppers... pairs 51 149.62 7.6
15 I 3547 152013510 Footwear with leather uppers... pairs 531 149.62 79.4
15 I 3547 152013520 Footwear with leather uppers... pairs 130 149.62 19.5
15 I 3547 152031500 Footwear with leather uppers... pairs 122 149.62 18.3
TOTAL division 15 (physical component) 3079.4
5.2. Value-based component
Div. Unit. PROD1 PRODROM Product Name UM
Value-
based
production
(RON)
IPPI
(%)
Value-based
production in basic
prices
(thousands of RON)15 J 75428 152040200 Leather uppers for footwear... lei 578306 105.45 548.4
15 K 75428 152040200 Leather uppers for footwear... lei 668 105.45 0.6
TOTAL division 15 (value-based component) 549.1
Value-based expression aggregation at the CAEN Rev. 2 division level is done starting from each basic PRODROM product in relation to the companies included in the analyzed sample, by using the average price of the PROD1 families in the reference period, in case of quantitative direct expression, and defl ation with industrial production price index (IPPI) with fi xed monthly
base, for the value-based component. Here is a detailed presentation of the
products belonging to the PROD1 families included in division 15 “Tanning
and dressing of leather”, in which case both situations described above occur.
The synthetic representation of the statistical data in all the CAEN
Rev. 2 divisions is similar to that applying in the case of division 15 “Tanning
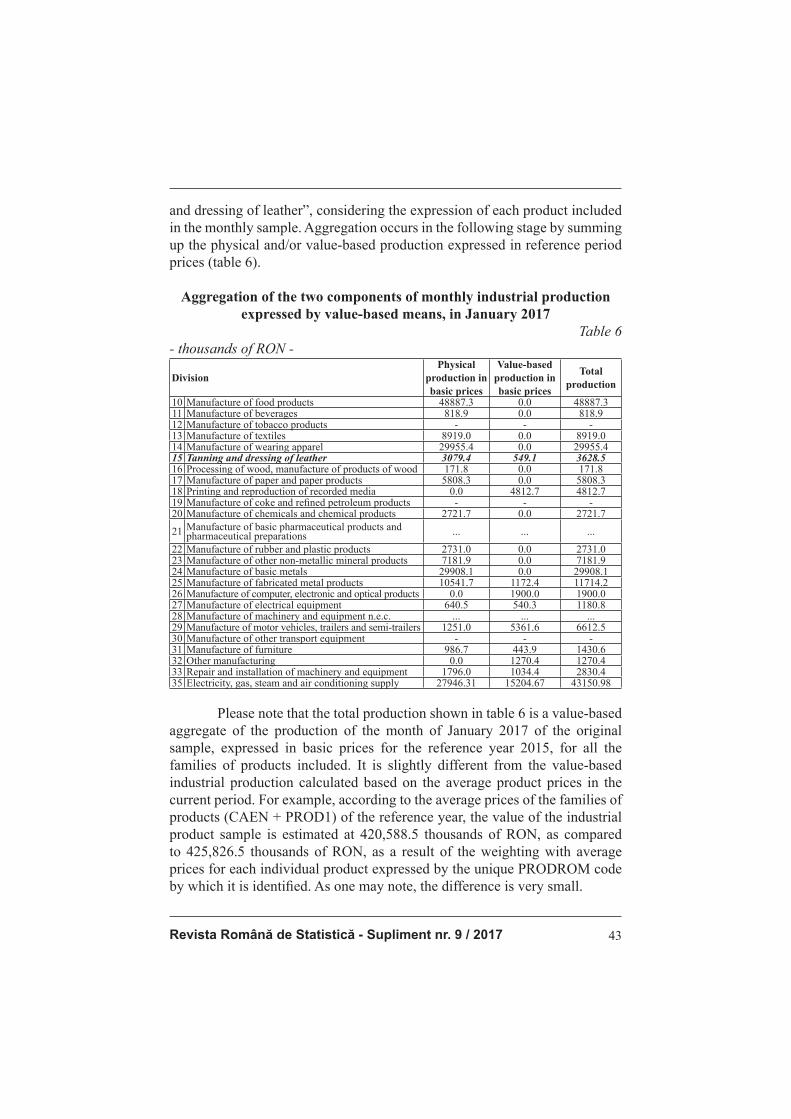
Revista Română de Statistică - Supliment nr. 9 / 2017 43
and dressing of leather”, considering the expression of each product included in the monthly sample. Aggregation occurs in the following stage by summing up the physical and/or value-based production expressed in reference period prices (table 6).
Aggregation of the two components of monthly industrial production expressed by value-based means, in January 2017
Table 6- thousands of RON -
DivisionPhysical
production in basic prices
Value-based production in basic prices
Total production
10 Manufacture of food products 48887.3 0.0 48887.311 Manufacture of beverages 818.9 0.0 818.912 Manufacture of tobacco products - - -13 Manufacture of textiles 8919.0 0.0 8919.014 Manufacture of wearing apparel 29955.4 0.0 29955.415 Tanning and dressing of leather 3079.4 549.1 3628.516 Processing of wood, manufacture of products of wood 171.8 0.0 171.817 Manufacture of paper and paper products 5808.3 0.0 5808.318 Printing and reproduction of recorded media 0.0 4812.7 4812.719 Manufacture of coke and refi ned petroleum products - - -20 Manufacture of chemicals and chemical products 2721.7 0.0 2721.7
21 Manufacture of basic pharmaceutical products and pharmaceutical preparations ... ... ...
22 Manufacture of rubber and plastic products 2731.0 0.0 2731.023 Manufacture of other non-metallic mineral products 7181.9 0.0 7181.924 Manufacture of basic metals 29908.1 0.0 29908.125 Manufacture of fabricated metal products 10541.7 1172.4 11714.226 Manufacture of computer, electronic and optical products 0.0 1900.0 1900.027 Manufacture of electrical equipment 640.5 540.3 1180.828 Manufacture of machinery and equipment n.e.c. ... ... ...29 Manufacture of motor vehicles, trailers and semi-trailers 1251.0 5361.6 6612.530 Manufacture of other transport equipment - - -31 Manufacture of furniture 986.7 443.9 1430.632 Other manufacturing 0.0 1270.4 1270.433 Repair and installation of machinery and equipment 1796.0 1034.4 2830.435 Electricity, gas, steam and air conditioning supply 27946.31 15204.67 43150.98
Please note that the total production shown in table 6 is a value-based
aggregate of the production of the month of January 2017 of the original
sample, expressed in basic prices for the reference year 2015, for all the
families of products included. It is slightly different from the value-based
industrial production calculated based on the average product prices in the
current period. For example, according to the average prices of the families of
products (CAEN + PROD1) of the reference year, the value of the industrial
product sample is estimated at 420,588.5 thousands of RON, as compared
to 425,826.5 thousands of RON, as a result of the weighting with average
prices for each individual product expressed by the unique PRODROM code
by which it is identifi ed. As one may note, the difference is very small.

Romanian Statistical Review - Supplement nr. 9 / 201744
3.4. Calculation of the Industrial Production Index The model described extensively in this paper used the turnover distributed as percentages on divisions as weighting element for industrial production aggregation at CAEN Rev. 2 division level, in accordance with the structure of industrial companies at county level in the reference year (similarly, the gross value added at cost factors in the reference year may be used as weighting element for each division).
Determination of the industrial production index in January 2017 as compared to January 2016
Table 7
DivisionTurnover
2015(%)
Average 2015 prod.(thousands
of RON)
Jan. 2016 prod.
(thousands of RON)
Jan. 2017 prod.
(thousands of RON)
Jan. 2016 / average
2015 prod.
Jan. 2017 / average 215 prod.
Jan. 2017 / Jan. 2016
index
0 1 2 3 4 5 6=(4/3)*2 7=(5/3)*2 8 = 7 / 610 Manufacture of food products 10.2 56,072.4 54,733.2 48,887.3 10.0 8.9 89.311 Manufacture of beverages 0.9 1,140.3 471.9 818.9 0.4 0.7 173.512 Manufacture of tobacco products - - - - - - - 13 Manufacture of textiles 2.7 17,547.9 9,428.7 8,919.0 1.4 1.4 94.614 Manufacture of wearing apparel 4.3 27,497.2 32,772.1 29,955.4 5.1 4.7 91.415 Tanning and dressing of leather 0.9 2,357.1 1,555.6 3,628.5 0.6 1.4 234.2
16 Processing of wood, manufacture of products of wood 0.8 174.0 121.1 171.8 0.6 0.8 141.8
17 Manufacture of paper and paper products 1.6 4,961.9 4,331.4 5,808.3 1.4 1.9 134.1
18 Printing and reproduction of recorded media 1.3 3,828.5 3,592.2 4,812.7 1.2 1.7 134.0
19 Manufacture of coke and refi ned petroleum products
- - - - - - -
20Manufacture of chemicals and chemical products
3.6 3,319.1 3,244.7 2,721.7 3.5 2.9 83.9
21Manufacture of basic pharmaceutical products and pharmaceutical preparations
... … … … … … …
22Manufacture of rubber and plastic products
2.9 2,991.1 2,405.9 2,731.0 2.3 2.6 113.5
23Manufacture of other non-metallic mineral products
2.5 9,077.5 7,333.9 7,181.9 2.0 1.9 97.9
24 Manufacture of basic metals 7.4 43,676.3 43,433.7 29,908.1 7.3 5.0 68.9
25Manufacture of fabricated metal products
4.1 10,417.0 11,131.1 11,714.2 4.4 4.6 105.2
26Manufacture of computer, electronic and optical products
2.2 2,580.4 1,560.9 1,900.0 1.4 1.7 121.7
27 Manufacture of electrical equipment 1.0 1,194.0 1,094.2 1,180.8 0.9 1.0 107.9
28Manufacture of machinery and equipment n.e.c.
... … … … … … …
29Manufacture of motor vehicles, trailers and semi-trailers
5.4 6,116.6 5,257.5 6,612.5 4.7 5.9 125.8
30Manufacture of other transport equipment
- - - - - - -
31 Manufacture of furniture 1.1 2,969.5 2,295.5 1,430.6 0.9 0.5 62.3
32 Other manufacturing 0.9 1,178.1 1,227.3 1,270.4 1.0 1.0 103.5
33Repair and installation of machinery and equipment
1.7 4,529.4 3,119.4 2,830.4 1.2 1.1 90.7
35Electricity, gas, steam and air conditioning supply
4.7 27,901.0 45,050.0 43,151.0 7.6 7.3 95.8
TOTAL 100.0 420,597.6 427,750.2 420,588.5 98.0 99.6 101.6

Revista Română de Statistică - Supliment nr. 9 / 2017 45
In order to calculate the industrial production index with a view to the statistical characterization of the variation of the volume of this indicator in January 2017 as compared to the same month of the previous year, for each CAEN Rev. 2 division and for the entire industrial production of Iaşi County, the data may be structured using table 7 by describing in parallel the monthly value-based level of industrial production in the reference year and the monthly average industrial productions in the months of January of each reporting year; the values are expressed in reference period prices, for comparability reasons (table 7). The average industrial production values for the months of January of the two reporting years (2016 and 2017) are then reported in related to the monthly average level of industrial production in the reference year (2015), by adequately adjusting them with the weight of each division from the viewpoint of the turnover of the reference year. The fi nal industrial production index for the months considered will be determined as a ratio of these two previously calculated fi xed base indices and will be expressed as a percentage. As shown in table 7, the results for each CAEN Rev. 2 division are identical to the ones obtained by the mere reporting of the monthly value-based production in the considered years expressed as reference period prices, as the adjustment with the weighting factors of the divisions trigger absolutely no change to the fi nal result. The percentages of each industrial division have an important infl uence as a weighting system on the total values of the industrial production indices, on sections or on the entire industry, at higher aggregation levels. The aspect mentioned above is also noted in the example above, in the sense that, when analyzing the total values in table 7 regarding the average industrial production in the months of January of the two years under scrutiny (2016 and 2017), one may notice, at fi rst glance, a slight decrease (of 1.7%), from 427,750.2 thousands of RON in January 2016, to 420,588.5 thousands of RON in January 2017, and a total industrial production index not infl uenced by the division weights of 98.3%. The fi nal result shown in the last column of table 7 is 101.6%, a percentage determined by the more signifi cant increases in the divisions with higher weight, which fi nally triggered a general tendency of industrial production volume increase at county level of 1.6%. This result is also anticipated by the total values of fi xed base indices calculated for the months of January 2017 and 2016 in comparison with the mean of the year 2015 (columns 6 and 7), when the apparent absolute value increase of 7152.6 thousands of RON between January 2016 and the mean of the year 2015 is actually a diminution by 2%, and the balance between the indicator values in January 2017 in relation to the same reporting base actually reveals a 0.4% decrease.

Romanian Statistical Review - Supplement nr. 9 / 201746
4. Conclusions According to the statistical data in the presented example, one may say that the industrial production of Iaşi County increased in absolute volume in January 2017 as compared to the same month of the previous year by 1.6%, the most important increases being recorded in the divisions 15 “Tanning and dressing of leather” and 11 “Manufacturing of beverages”, whereas the most signifi cant decreases in the production process occurred in the divisions 31 “Manufacture of furniture” and 24 “Manufacture of basic metals”.The infl uence of the weighting system is only visible in the higher aggregation levels, for industrial activities grouped on sections or overall, for the entire industrial production at county level, so that the use of adequate weighting factors, able to structurally refl ect the relative importance of the composing divisions objectively, becomes an essential element, which may translate the evolution of the absolute industrial production volume in a direction as close as possible to the real tendency of the analyzed phenomenon.
References 1. ALEXEVICI NINA, CHIRA MIRCEA, ASTALÎŞ DIANA, BURIAN MIRCEA
(2010), Considerente teoretice şi demersuri practice privind calculul IPI şi ICA, Revista Română de Statistică nr. 2 / 2010, Institutul Naţional de Statistică, Bucureşti
2. HARJA EUGENIA, TURCU AUREL (2001), Indicele de volum al producţiei industriale, InfoSTAT nr. 3 / 2001, Institutul Naţional de Statistică şi Studii Economice – Direcţia Generală Bacău
3. ORDINUL nr. 231 emis de Preşedintele Institutului Naţional de Statistică în data de 27.05.2002 privind Metodologia de calcul a indicelui producţiei industriale cu baza anul 1998, aliniată la legislaţia şi metodologia Uniunii Europene, Institutul Naţional de Statistică, Bucureşti
4. PÂRŢACHI ION, CARA OLEG (2012), Evolution regarding the Reform of Industry Statistics in the Republic of Moldavia, Revista Română de Statistică Supliment Trim IV 2012, Institutul Naţional de Statistică, Bucureşti
5. ŢARCĂ MIHAI (1998), Tratat de Statistică Aplicată, Editura Didactică şi Pedagogică, Bucureşti
6. *** EUROSTAT (2006), Methodology of Short – term Business Statistics,
Interpretation and Guidelines, European Communities, 2006, Luxembourg
7. *** UNITED NATIONS STATISTICS DIVISION (2010), International
Recommendations for the Index of Industrial Production 2010, Statistical
Commission, Forty-fi rst session, 23 - 26 February 2010, New York

Revista Română de Statistică - Supliment nr. 9 / 2017 47
Dezvoltarea societăţii informaţionale în Uniunea Europeană şi statele membre
Conf. univ. dr. Mădălina-Gabriela ANGHEL ([email protected])
Universitatea „Artifex” din București
Prof. univ. dr. Constantin ANGHELACHE ([email protected])
Academia de Studii Economice din București / Universitatea „Artifex” din București
Prof. univ. dr. Radu Titus MARINESCU ([email protected])
Universitatea „Artifex” din București
Abstract
În acest articol, autorii s-au concentrat pe analiza și prezentarea dezvoltării societății informaționale, ca tendință de amploare în evoluția cercetării și aplicării acesteia în activittea social-economică. În această direcție, Uniunea Europeană a aprobat o agendă digitală în care s eprezință pașii care pot și trebuie întreprinși în perioada de zece ani (2010-2020), precum și pe termen mai lung. În agenda digitală a Uniunii Europene se prevăd șapte etape (pași) de urmat care se referă la domeniile în care se pot aplica, pentru a se crea piața digitală unică în Uniunea Europeană. Autorii efectuează o atentă analiză asupra perspectivei dezvoltării societății informaționale în statele membre ale comunității europene. Datele sunt prezentate prin grafi ce sugestive, evidențiind că România se afl ă pe ultimul loc dintre cele 28 de state membre. Se întreprinde și o analiză comparativă, utilizând indicatorii înregsitrați în 2012 și 2015. La toate statele membre se înregistrează creșteri în ceea ce privește evoluția societății informaționale. Cuvinte cheie: agenda digitală, societate informațională, internet, rețea socială, comunicații tehnologice
Clasifi carea JEL: L86, O33
Introducere Dezvoltarea general-europeană se referă la creșterea rezultatelor științifi ce, sporirea rolului conducător al dezvoltării industriale în țările europene și asigurarea unor condiții de producție efi cientă și profi tabilă. În domeniul programului de dezvoltare a Uniunii inovative, Comisia Europeană are în vedere dezvoltarea Agendei Digitale pentru Europa. Aceasta reprezintă o strategie care promovează îmbunătățirea pregătirii în domeniul digital, care să crească an de an până în 2020 și apoi mai departe. Agenda evoluției digitale reprezintă una din principalele șapte inițiative fundamentale ale strategiei Uniunii Europene până în anul 2020. Această agendă cuprinde priorități în
Romanian Statistical Review - Supplement nr. 9 / 201748
domeniul în domeniul creației, în domeniul digital și al implementării acesteia în viața Uniunii Europene. Dezvoltarea societății informaționale este privită ca o cerință a societății, în general și a dezvoltării economice a țărilor membre, în mod special.
Literature review Anghelache, Stanciu și Prodan (2014) au analizat indicatorii privind rezultatele și comerțul cu servicii IT & C din România. Briglauer (2014) analizează extinderea rețelelor de bandă largă pe bază de fi bre, din punct de vedere al reglementării și al concurenței, studiul său este justifi cat de dovezile statelor membre ale Uniunii Europene. Pulignano (2009) analizează corelațiile dintre cooperarea internațională, restructurarea transnațională și rețelele virtuale în Europa. Annoni și colab. (2012) descriu perspectiva europeană asupra Pământului digital. Manole (2008) abordează utilizarea sistemelor software în procesul decizional fi nanciar-contabil. Chalmers (2013) compară infl uența grupurilor de interese din Uniunea Europeană, Chalmers (2013) se referă la strategiile de lobby la nivel informațional. Anghelache, Manole, Anghel și Popovici (2016) au analizat rolul resurselor umane în economia națională. Maggioni, Nosvelli și Uberti (2007) analizează situația europeană în studiul geografi ei inovației. Eberlein și Newman (2008) se concentrează asupra rețelelor încorporate transguvernamentale constituite în Uniunea Europeană. Anghelache, Anghel, Manole și Lilea (2016) reprezintă o lucrare de referință în modelarea economică. Panagiotopoulos (2012) consideră reevaluarea audienței implicării în mediile sociale. Billon, Lera-Lopez and Marco (2010) cercetează diferențele în adoptarea tehnologiilor informației și comunicațiilor (TIC) pentru un eșantion de 142 de țări dezvoltate și în curs de dezvoltare, examinând relațiile dintre combinațiile specifi ce de tehnologii și factorii care le explică. Kyriakidou, Michalakelis and Sphicopoulos (2011) prezintă o metodologie de măsurare a decalajului digital, împreună cu previziunile privind convergența în bandă largă, evaluarea fi ind efectuată pentru țările europene examinate în perioada 2001-2009. Cilan, Bolat and Coskun (2009) studiază existența unei diviziuni digitale între membrii Uniunii Europene, noii membri și țările candidate. Vicente și López (2011) analizează decalajul digital regional în cele 27 de state membre ale Uniunii Europene.
Metodologia cercetării, date, rezultate şi discuţii Dezvoltarea informației în domeniul societății a devenit un element critic în sensul că, informațiile și comunicațiile tehnologice afectează populația în cele mai diverse feluri, în primul rând în domeniul activității sau în domeniul vieții individuale. Aceasta a adus multe facilități în sensul

Revista Română de Statistică - Supliment nr. 9 / 2017 49
că pe baza comunicațiilor și informațiilor on-line se dezvoltă comerțul intern, se efectuează plata de taxe, s-a dezvoltat e-comerțul care protejează viață individuală, a persoanelor și le asigură economisirea timpului necesar. Informațiile și comunicațiile au devenit publice și accesibile la un cost care este ușor de accesat de toate persoanele din cadrul unei societăți. Nivelul veniturilor poate infl uența utilizarea internetului, poate asigura într-o proporție ridicată cunoașterea celor mai noi aspecte din viața economică, tehnico-științifi că, culturală, și altele. În principiu, 62% dintre gospodării utilizează cuceririle societății informaționale, pentru scopurile gospodăriei sau în scop individual. În general statele membre au un acces ridicat la internet, unele state evidențiind că, nivelul relativ de utilizare a accesului la internet acopră o pondere deosebit de ridicată din populația țării. În această categorie se afl ă Luxemburg, Malta și alte țări mici, cu o economie mai puțin dezvoltată, dar în care accesul este deosebit. În fi gura 1 este prezentat accesul gospodăriilor la internet în 2015, ca procent al tuturor gospodăriilor.
Accesul la internet în gospodării pe quartile de venit, 2015 (% din totalul gospodăriilor)
Figura 1
Sursa: Eurostat - Key fi gures on Europe 2016, pag. 146
În grafi c sunt prezentate veniturile din prima cuartilă, veniturile din a doua cuartilă, veniturile din a treia cuartilă și din a patra cuartilă, care se constată o accesare mai diferită. Spre exemplu, în cea de-a patra cuartilă,

Romanian Statistical Review - Supplement nr. 9 / 201750
accesul la internet este aproape general de 90 până la 100% pentru toate statele membre. Urmează accesul în a treia cuartilă, care este și el situat peste 80% în toate statele membre. Mai redus este accesul la prima cuartilă, fi ind destul de redus în unele state, cum este în Bulgaria, de 18%, în România de 25%. Celelalte state, în special Luxemburg, Olanda, Danemarca, Germania, Finlanda, Suedia, Franța, Belgia, Austria, și în cazul acestei prime cuartile accesul este destul de ridicat. În 2015, două treimi (67%) din populația
individuală a statelor membre ale Uniunii Europene au avut acces la internet, zilnic, din care 9% au folosit cel puțin o dată pe săptămână internetul. 7% din utilizatorii permanenți de internet în ceea ce privește Agenda Digitală, acesta s-a ridicat la 75% în 2015, procentul fi ind în creștere. Statele membre precum România cu 66%, Polonia 76% sau Slovenia 77%, s-au situat după Danemarca, Olanda, Malta, care au avut un procent foarte ridicat de acces al populației la sistemul, sau Agenda Digitală. Unul dintre cele mai cuprinzătoare și utilizabile domenii în această Agendă Digitală s-a înregistrat în 2015, când jumătate din populația între 16 și 74 de ani au folosit Agenda Digitală. De asemenea, 66-68% din populația Marii Britanii, Belgiei, Luxemburgului, au folosit site-urile sau alte elemente noi la care se referă Agenda Digitală. În fi gura 2 este prezentat accesul la serviciile de internet private în intervalul de 12 luni al fi ecărui an. În grafi c sunt prezentate procentele populației care au acces la internet cu vârsta cuprinsă între 16 și 74 de ani.
Persoanele care au comandat bunuri sau servicii prin internet pentru uz privat în cele 12 luni anterioare sondajului, 2012 și 2015 (% dintre
persoanele cu vârste cuprinse între 16 și 74 ani)Figura 2
Sursa: Eurostat - Key fi gures on Europe 2016, pag. 147

Revista Română de Statistică - Supliment nr. 9 / 2017 51
Constatăm că din nou, din 2012 până în 2015, cu mici excepții, acest procent a crescut în mod substanțial. Media în Uniunea Europeană a fost în 2015 de 51%, dar în state precum Marea Britanie, Danemarca, Luxemburg, Germania, Olanda, Finlanda, Suedia, Franța, Estonia, Austria, Belgia, Irlanda, Malta sau Slovenia aceasta a fost net superioară. În cea ce privește România constatăm că în 2012, procentul era de aproximativ 5% ajungând în 2015 la 10%. Sunt și alte date care arată că între statele membre ale Uniunii Europene există o discrepanță substanțială dar în anul 2015, cu excepția Suediei care a înregistrat un recul toate celelalte state membre au înregistrat un procent mult mai ridicat de acces individual la internet.
Societatea informațională și antreprenoriatul sau activitatea economică
Progresele înregistrate în domeniul economic digital este considerat un element important al creșterii competitivității industriei și în general al dezvoltării economice. Sistemul informațional și de comunicare a devenit parte integrantă a funcționării întreprinderilor prin accea că asigură un impact rapid al managementului, asigură îmbunătățirea organizării și comunicării interioare, așa încât sistemul de comunicații și informații a devenit un element uzual care se întâlnește în toate activitățile economice. În 2015, o mare majoritate a întreprinderilor, aproximativ 93% pe total state membre ale Uniunii Europene, cu cel puțin 10 salariați au avut un acces mai ridicat sau mai redus la societatea informațională, la Agenda Digitală. Astfel, aceste societăți s-au concentrat pe cunoașterea informațiilor, a elementelor de evoluție a piețelor, a prețurilor și a evoluției acestora, a aplicării tehnologiei și multe altele, putând să-și reglementeze, să-și organizeze activitatea de management antreprenorial. Utilizarea potențialului în domeniul societății informaționale a avut un rol important asupra creșterii și îmbunătățirii soluțiilor în domeniul procesului de afaceri, care, în trei sferturi din totalul întreprinderilor, apreciază că internetul le-a asigurat o posibilitate de documentare foarte rapidă. În ultima decadă, s-a folosit tot mai mult, utilizarea datelor și a cunoștiințelor care au rezultat din societatea informațională. În fi gura 3 se prezintă situația, în perioada 2011-2015 pentru întreaga Uniune Europeană, privind utilizarea internetului.
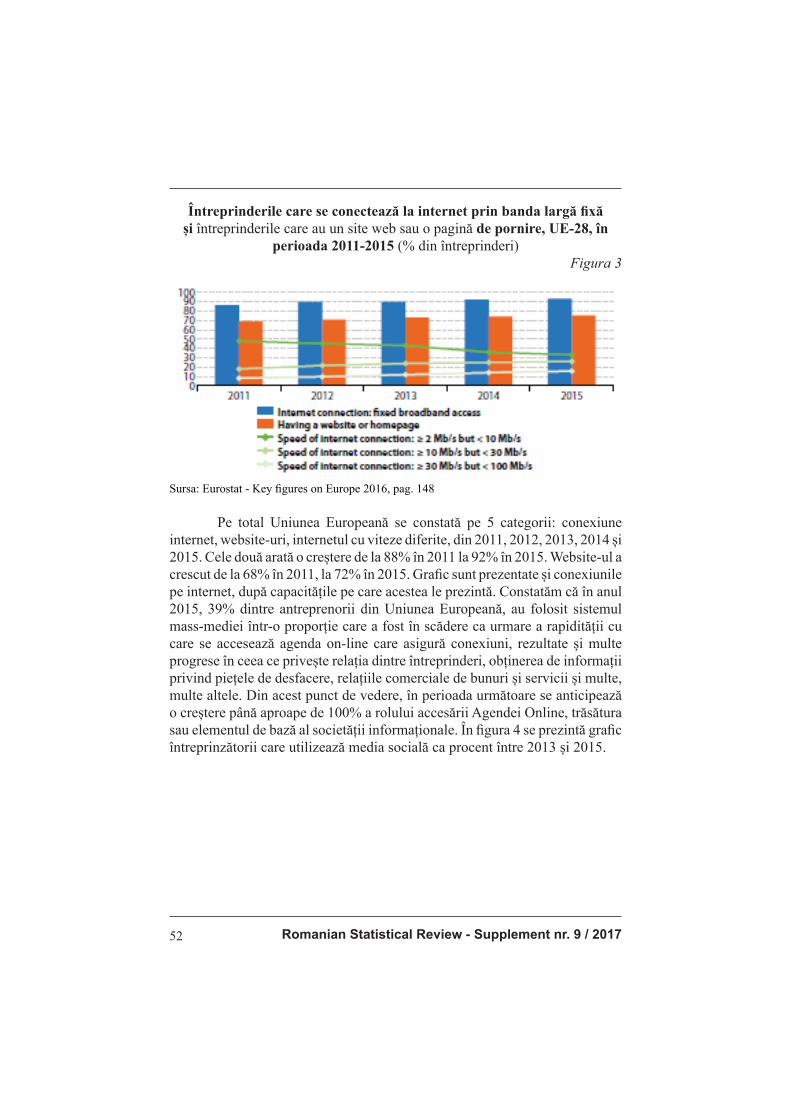
Romanian Statistical Review - Supplement nr. 9 / 201752
Întreprinderile care se conectează la internet prin banda largă fi xă
și întreprinderile care au un site web sau o pagină de pornire, UE-28, în
perioada 2011-2015 (% din întreprinderi)Figura 3
Sursa: Eurostat - Key fi gures on Europe 2016, pag. 148
Pe total Uniunea Europeană se constată pe 5 categorii: conexiune internet, website-uri, internetul cu viteze diferite, din 2011, 2012, 2013, 2014 și
2015. Cele două arată o creștere de la 88% în 2011 la 92% în 2015. Website-ul a
crescut de la 68% în 2011, la 72% în 2015. Grafi c sunt prezentate și conexiunile
pe internet, după capacitățile pe care acestea le prezintă. Constatăm că în anul 2015, 39% dintre antreprenorii din Uniunea Europeană, au folosit sistemul mass-mediei într-o proporție care a fost în scădere ca urmare a rapidității cu care se accesează agenda on-line care asigură conexiuni, rezultate și multe
progrese în ceea ce privește relația dintre întreprinderi, obținerea de informații
privind piețele de desfacere, relațiile comerciale de bunuri și servicii și multe,
multe altele. Din acest punct de vedere, în perioada următoare se anticipează o creștere până aproape de 100% a rolului accesării Agendei Online, trăsătura sau elementul de bază al societății informaționale. În fi gura 4 se prezintă grafi c
întreprinzătorii care utilizează media socială ca procent între 2013 și 2015.

Revista Română de Statistică - Supliment nr. 9 / 2017 53
Întreprinderile care utilizează medii sociale, pe tipuri de media sociale,
UE-28, 2013 și 2015 (% din întreprinderi)Figura 4
Sursa: Eurostat - Key fi gures on Europe 2016, pag. 149
Se constată că în 2013 și 2015 rețeaua socială a fost de 28-36%, în domeniul micro-blogurilor a fost de 10 până la 14%, în domeniul multimedia procentul a fost de 10 până la 13%, iar Wikibase Known a fost destul de redus, între 5 și 6%.
Concluzii În urma analizei întreprinse se concluzionează că rolul societății informaționale în ultimul deceniu a crescut semnifi cativ. Dezvoltarea tehnologiei informatice și de comunicare este analizată prin prisma modului în care aceasta este aplicată în viața social-economică. În acest sens, este relevant faptul că, în statele membre ale Uniunii Europene, proportția gospodăriilor care au acces la internet a fost de 62% în 2015 și 63,8% în 2016. Statele în care ponderea populației cu acces la internet mai redus sunt cele din ultima etapă de primiri în Uniunea Europeană., respectiv din sudul și estul Europei. Tehnologia informatică și de comunicare este resimțită de populație sub cele mai diverse forme, atât la locul de muncă cât și în vița particulară. Strategia Uniunii Europene are în vedere reglementarea strictă a întregii activități, urmărind în același timp și protejarea datelor individuale ale persoanelor.
Bibliografi e 1. Anghelache, C., Anghel, M. G., Manole, A. and Lilea, F. P. C. (2016). Modelare
economică, fi nanciar-monetar-bancară şi informatică, Editura Artifex, Bucureşti 2. Anghelache, C., Stanciu, E. and Prodan L. (2014). Producerea şi comercializarea
bunurilor şi serviciilor informatice. ART ECO - Review of Economic Studies and Research, 5 (4), 88-94
3. Annoni, A. et al. (2012). A European perspective on Digital Earth. International Journal of Digital Earth, 4 (4), 271-284
4. Billon, M., Lera-Lopez, F. and Marco, R. (2010). Differences in digitalization levels: a multivariate analysis studying the global digital divide. Review of World Economics, 146 (1), 39–73
Romanian Statistical Review - Supplement nr. 9 / 201754
5. Briglauer, W. (2014). The impact of regulation and competition on the adoption of fi ber-based broadband services: recent evidence from the European union member
states. Journal of Regulatory Economics, 46 (1), 51–79
6. Chalmers A. W. (2013). Trading information for access: informational lobbying
strategies and interest group access to the European Union. Journal of European Public Policy, 20 (1), 39-58
7. Chalmers A. W. (2013). Interests, Infl uence and Information: Comparing the
Infl uence of Interest Groups in the European Union. Journal of European Integration, 33 (4), 471-486
8. Cilan, C.A., Bolat, B.A. and Coskun, E. (2009). Analyzing digital divide within
and between member and candidate countries of European Union. Government Information Quarterly, 26 (1), 98-105
9. Eberlein, B. and Abraham L. Newman, A. (2008). Escaping the International
Governance Dilemma? Incorporated Transgovernmental Networks in the
European Union. Governance: An International Journal of Policy, Administration and Institutions, 21 (1), 25–52
10. Kyriakidou, V., Michalakelis, C. and Sphicopoulos, T. (2011). Digital divide gap
convergence in Europe. Technology in Society, 33 (3–4), 265-270
11. Maggioni, M. A., Nosvelli, M. and Uberti, T. E. (2007). Space versus networks
in the geography of innovation: A European analysis. Regional Science, 86 (3),
471–493
12. Manole, A. (2008). Sistemul informatic pentru modelarea deciziei fi nanciar-
contabile, Editura Artifex, Bucureşti
13. Panagiotopoulos, P. (2012). Towards unions 2.0: rethinking the audience of social media engagement. New Technology, Work and Employment, 27 (3), 178–192
14. Pulignano, V. (2009). International Cooperation, Transnational Restructuring and Virtual Networking in Europe. European Journal of Industrial Relations, 15 (2), 187-205
15. Vicente, M.R. and López, A.J. (2011). Assessing the regional digital divide across the European Union-27. Telecommunications Policy, 35 (3), 220-237
*** Eurostat - Key fi gures on Europe 2016

Revista Română de Statistică - Supliment nr. 9 / 2017 55
THE DEVELOPING THE INFORMATION SOCIETY IN THE EUROPEAN UNION AND
THE MEMBER STATES
Assoc. prof. Mădălina-Gabriela ANGHEL PhD ([email protected])
„Artifex” University of Bucharest
Prof. Constantin ANGHELACHE PhD ([email protected])
Bucharest University of Economic Studies / „Artifex” University of Bucharest
Prof. Radu Titus MARINESCU PhD ([email protected])
„Artifex”University of Bucharest
Abstract
In this article, the authors focused on analyzing and presenting the development of the information society as a major trend in the evolution of research and its application in socio-economic activity. In this regard, the European Union has approved a digital agenda which describes the steps that can and must be taken over the ten-year period (2010-2020) as well as in the longer run. The EU Digital Agenda foresees seven steps (steps) to be followed, which relate to the areas in which they can be applied, in order to create the unique digital market in the European Union. The authors carry out a careful analysis of the perspective of the development of the information society in the member states of the European community. The data are presented with suggestive charts, highlighting Romania as the last of the 28 member states. A comparative analysis is also carried out using the indicators registered in 2012 and 2015. Increases in the evolution of the information society are recorded in all Member States. Key words: digital agenda, information society, internet, social networking, technological communications JEL Classifi cation: L86, O33
Introduction
General European development refers to increasing scientifi c
results, increasing the leading role of industrial development in European
countries and ensuring effi cient and profi table production conditions. In the
fi eld of innovative Union development program, the European Commission
is considering the development of the Digital Agenda for Europe. This is a
strategy that promotes digital literacy improvement, increasing annually by
2020 and beyond. The Digital Agenda is one of the top seven core initiatives
of the European Union’s strategy by 2020. This agenda includes priorities in
the fi eld of creative, digital and its implementation in the life of the European

Romanian Statistical Review - Supplement nr. 9 / 201756
Union. The development of the information society is seen as a requirement of the society, in general, and of the economic development of the member countries, in particular.
Literature review Anghelache, Stanciu and Prodan (2014) have analyzed the indicators regarding to the outputs and trade of IT&C services in Romania. Briglauer (2014) analyzes the expansion of the fi ber-based broadband networks, from the
viewpoint of regulation and competition, his study is substantiated by evidence
from the European union member states. Pulignano (2009) analyzes the
correlations between international cooperation, transnational restructuring and
virtual networking within Europe. Annoni et al. (2012) describe the European
perspective on the Digital Earth. Manole (2008) develops on the use of software
systems within the fi nancial-accounting decisional process. Chalmers (2013)
compares the infl uence of interest groups in the European Union, Chalmers
(2013) develops on the lobby strategies at the informational level. Anghelache,
Manole, Anghel, and Popovici (2016) have analyzed the role of human resources
in the national economy. Maggioni, Nosvelli, and Uberti (2007) analyze the
European situation in the study of the geography of innovation. Eberlein and
Newman (2008) develop on the incorporated transgovernmental networks
in the European Union. Anghelache, Anghel, Manole, and Lilea (2016) is a
reference work in economic modeling. Panagiotopoulos (2012) considers the
re-assesment of the audience of social media engagement. Billon, Lera-Lopez
and Marco (2010) investigate the differences in the adoption of information
and communication technologies (ICT) for a sample of 142 developed and
developing countries, examining the relationships between specifi c technology
combinations and the factors that explain them. Kyriakidou, Michalakelis and
Sphicopoulos (2011) presents a methodology for measuring the digital divide,
along with broadband predictions, with the assessment being conducted for
the European countries examined during 2001-2009. Cilan, Bolat and Coskun
(2009) study the existence of a digital divide between members of the European
Union, new members and candidate countries. Vicente and López (2011) analyze
the regional digital divide in the 27 Member States of the European Union.
Research methodology, data, results and discussions The development of information in the fi eld of society has become a
critical element in the sense that information and technological communications
affect the population in a variety of ways, primarily in the fi eld of activity or
in the fi eld of individual life. This has brought many facilities in the sense
that on the basis of on-line communications and information, internal trade

Revista Română de Statistică - Supliment nr. 9 / 2017 57
is developed, tax payments are being made, e-commerce has been developed that protects individual life, people, and saves them time. Information and communications have become public and accessible at a cost that is easily accessible to all people within a company. Income level can infl uence the
use of the Internet, can provide a high proportion of knowledge of the latest
aspects of economic, technical, scientifi c, cultural, and other life. In principle,
62% of households use conquests of the information society for household
purposes or for individual purposes. In general, Member States have high
Internet access, with some countries highlighting that the relative level of
access to the Internet has a particularly high share of the country’s population.
This category includes Luxembourg, Malta and other small countries with a
less developed economy, but with particular access. Figure 1 shows household
access to Internet in 2015 as a percentage of all households.
Internet access in households by quartile of income, 2015 (% of total
households)
Figure 1
Sursa: Eurostat - Key fi gures on Europe 2016, pag. 146
The graph shows fi rst quartz income, second quartz earnings, third quartz and fourth quartz income, which shows a different approach. For example, in the fourth quartet, internet access is almost 90% to 100% for all Member States. There is access to the third quartz, which is also over 80% in all Member States. Lower access is the fi rst quartz, being quite low in some countries, as in Bulgaria, 18%,

Romanian Statistical Review - Supplement nr. 9 / 201758
in Romania by 25%. The other states, especially Luxembourg, the Netherlands, Denmark, Germany, Finland, Sweden, France, Belgium, Austria, and in this fi rst
quark, access is quite high. In 2015, two-thirds (67%) of the individual population
of the EU Member States had daily internet access, of which 9% used the Internet
at least once a week. 7% of Permanent Internet users on the Digital Agenda, it stood
at 75% in 2015, with the percentage rising. Member States such as Romania with
66%, Poland 76% or Slovenia 77%, were located after Denmark, the Netherlands,
Malta, which had a very high percentage of population access to the system, or
the Digital Agenda. One of the most comprehensive and usable domains in this
Digital Agenda was recorded in 2015, when half the population aged 16 to 74 used
the Digital Agenda. Also, 66-68% of the population of Great Britain, Belgium,
Luxembourg, used the sites or other new items that the Digital Agenda refers to.
Figure 2 shows access to private internet services over the 12-month period of
each year. The graph shows the percentages of the population who have internet
access between the ages of 16 and 74.
People who ordered goods or services over the Internet for private use in the 12 months prior to the survey, 2012 and 2015 (% of people aged 16 to 74)
Figure 2
Sursa: Eurostat - Key fi gures on Europe 2016, pag. 147
We fi nd that again, from 2012 to 2015, with few exceptions, this
percentage has increased substantially. The average in the European Union
was 51% in 2015, but in countries such as the UK, Denmark, Luxembourg,
Germany, the Netherlands, Finland, Sweden, France, Estonia, Austria,
Belgium, Ireland, Malta or Slovenia, this was clearly superior. As far as
Romania is concerned, we fi nd that in 2012, the percentage was about 5%,
reaching 20% in 2015. There are other data showing that there is a substantial

Revista Română de Statistică - Supliment nr. 9 / 2017 59
discrepancy between the Member States of the European Union, but in 2015, with the exception of Sweden that recorded a rebound, all other Member States recorded a much higher percentage of individual Internet access.
Information Society and Entrepreneurship or Economic Activity Progress in the digital economy is seen as an important element in increasing the competitiveness of industry and, in general, economic development. The information and communication system has become an integral part of business operations by ensuring a rapid impact of management, improving the organization and communication of the interior, so that the communication and information system has become a common feature in all economic activities. In 2015, a large majority of businesses, around 93% of the total EU Member States, with at least 10 employees, had access to the Digital Agenda, either higher or lower. Thus, these companies focused on the knowledge of the information, the evolution of the markets, their prices and their evolution, the application of technology and many more, being able to regulate and organize their entrepreneurial management activity. The use of information society potential has played an important role in increasing and improving business process solutions, which, in three quarters of all businesses, appreciates the fact that the internet has provided a very quick documentation opportunity. Over the past decade, the use of data and knowledge that has emerged from the information society has been increasingly used. Figure 3 presents the situation for the whole of the European Union over the period 2011-2015 regarding the use of the Internet.
Enterprises that connect to the fi xed broadband internet and businesses with a web site or home page, EU-28, 2011-2015 (% of enterprises)
Figure 3
Sursa: Eurostat - Key fi gures on Europe 2016, pag. 148
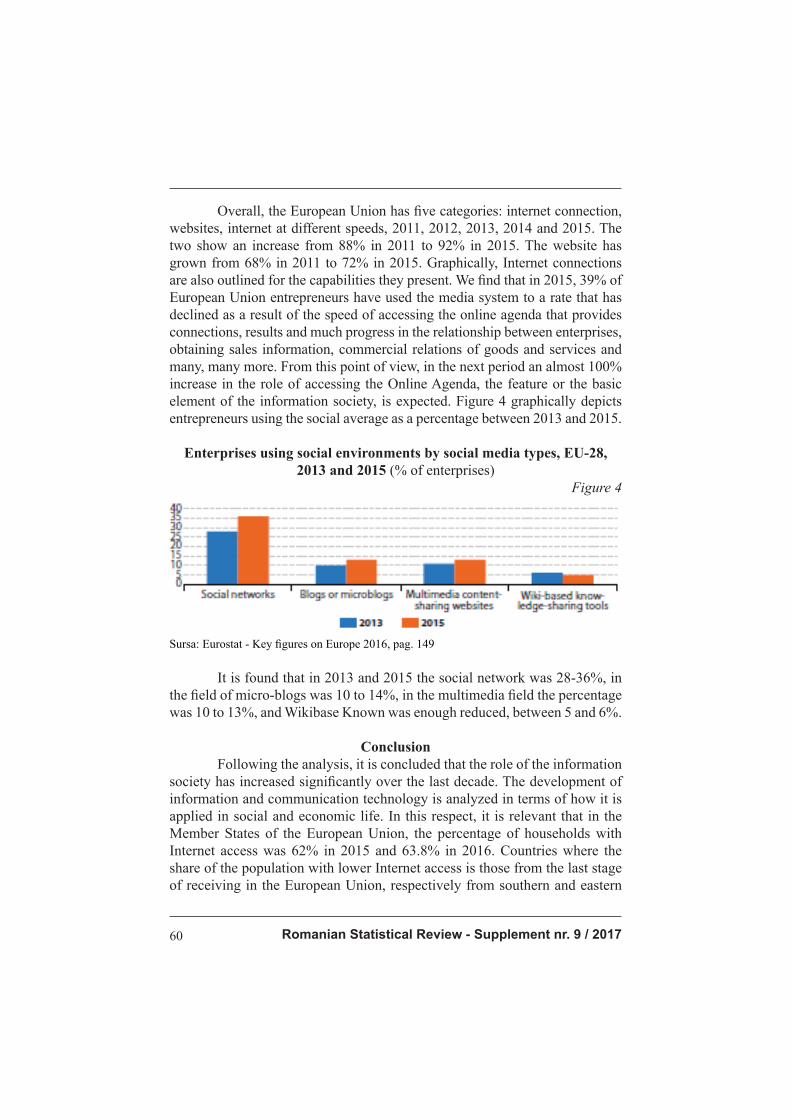
Romanian Statistical Review - Supplement nr. 9 / 201760
Overall, the European Union has fi ve categories: internet connection,
websites, internet at different speeds, 2011, 2012, 2013, 2014 and 2015. The
two show an increase from 88% in 2011 to 92% in 2015. The website has
grown from 68% in 2011 to 72% in 2015. Graphically, Internet connections
are also outlined for the capabilities they present. We fi nd that in 2015, 39% of
European Union entrepreneurs have used the media system to a rate that has
declined as a result of the speed of accessing the online agenda that provides
connections, results and much progress in the relationship between enterprises,
obtaining sales information, commercial relations of goods and services and
many, many more. From this point of view, in the next period an almost 100%
increase in the role of accessing the Online Agenda, the feature or the basic
element of the information society, is expected. Figure 4 graphically depicts
entrepreneurs using the social average as a percentage between 2013 and 2015.
Enterprises using social environments by social media types, EU-28, 2013 and 2015 (% of enterprises)
Figure 4
Sursa: Eurostat - Key fi gures on Europe 2016, pag. 149
It is found that in 2013 and 2015 the social network was 28-36%, in
the fi eld of micro-blogs was 10 to 14%, in the multimedia fi eld the percentage
was 10 to 13%, and Wikibase Known was enough reduced, between 5 and 6%.
Conclusion Following the analysis, it is concluded that the role of the information
society has increased signifi cantly over the last decade. The development of
information and communication technology is analyzed in terms of how it is
applied in social and economic life. In this respect, it is relevant that in the
Member States of the European Union, the percentage of households with
Internet access was 62% in 2015 and 63.8% in 2016. Countries where the
share of the population with lower Internet access is those from the last stage
of receiving in the European Union, respectively from southern and eastern

Revista Română de Statistică - Supliment nr. 9 / 2017 61
Europe. Information and communication technology is felt by the population in the most diverse forms, both in the workplace and in the particular vine. The European Union’s strategy is aimed at strict regulation of the whole activity while pursuing the protection of individual data of individuals.
References 1. Anghelache, C., Anghel, M. G., Manole, A. and Lilea, F. P. C. (2016). Modelare
economică, fi nanciar-monetar-bancară şi informatică, Editura Artifex, Bucureşti 2. Anghelache, C., Stanciu, E. and Prodan L. (2014). Producerea şi comercializarea
bunurilor şi serviciilor informatice. ART ECO - Review of Economic Studies and Research, 5 (4), 88-94
3. Annoni, A. et al. (2012). A European perspective on Digital Earth. International Journal of Digital Earth, 4 (4), 271-284
4. Billon, M., Lera-Lopez, F. and Marco, R. (2010). Differences in digitalization levels: a multivariate analysis studying the global digital divide. Review of World Economics, 146 (1), 39–73
5. Briglauer, W. (2014). The impact of regulation and competition on the adoption of fi ber-based broadband services: recent evidence from the European union member states. Journal of Regulatory Economics, 46 (1), 51–79
6. Chalmers A. W. (2013). Trading information for access: informational lobbying strategies and interest group access to the European Union . Journal of European Public Policy, 20 (1), 39-58
7. Chalmers A. W. (2013). Interests, Infl uence and Information: Comparing the Infl uence of Interest Groups in the European Union. Journal of European Integration, 33 (4), 471-486
8. Cilan, C.A., Bolat, B.A. and Coskun, E. (2009). Analyzing digital divide within and between member and candidate countries of European Union. Government Information Quarterly, 26 (1), 98-105
9. Eberlein, B. and Abraham L. Newman, A. (2008). Escaping the International Governance Dilemma? Incorporated Transgovernmental Networks in the European Union. Governance: An International Journal of Policy, Administration and Institutions, 21 (1), 25–52
10. Kyriakidou, V., Michalakelis, C. and Sphicopoulos, T. (2011). Digital divide gap convergence in Europe. Technology in Society, 33 (3–4), 265-270
11. Maggioni, M. A., Nosvelli, M. and Uberti, T. E. (2007). Space versus networks in the geography of innovation: A European analysis. Regional Science, 86 (3), 471–493
12. Manole, A. (2008). Sistemul informatic pentru modelarea deciziei fi nanciar-contabile, Editura Artifex, Bucureşti
13. Panagiotopoulos, P. (2012). Towards unions 2.0: rethinking the audience of social media engagement. New Technology, Work and Employment, 27 (3), 178–192
14. Pulignano, V. (2009). International Cooperation, Transnational Restructuring and Virtual Networking in Europe. European Journal of Industrial Relations, 15 (2), 187-205
15. Vicente, M.R. and López, A.J. (2011). Assessing the regional digital divide across the European Union-27. Telecommunications Policy, 35 (3), 220-237
*** Eurostat - Key fi gures on Europe 2016
Romanian Statistical Review - Supplement nr. 9 / 201762
Analiză în sistem GIS a atractivităţii reţelei de localităţi urbane şi rurale pentru evaluarea
factorilor competitivi la nivel naţional
Cercetător principal III Antonio TACHE ([email protected]) Institutul Naţional de Cercetare-Dezvoltare în Construcţii, Urbanism şi Dezvoltare Teritorială Durabilă „URBAN-INCERC”
Cercetător principal III Oana-Cătălina Popescu ([email protected])
Institutul Naţional de Cercetare-Dezvoltare în Construcţii, Urbanism şi Dezvoltare Teritorială Durabilă „URBAN-INCERC”
Cercetător principal Monica Tache ([email protected])
Institutul Naţional de Cercetare-Dezvoltare în Construcţii, Urbanism şi Dezvoltare Teritorială Durabilă „URBAN-INCERC”
Rezumat
Planifi carea reţelei urbane este esenţială pentru dezvoltarea teritorială.
Oraşele au un rol catalizator asupra dezvoltării economice şi pentru constituirea
unor reţele teritoriale funcţionale. Articolul are ca scop evaluarea potențialului
economic al localităților din România pentru dezvoltare, stabilitate sau declin, prin
identifi carea factorilor care determină apariția și dezvoltarea acestor tendințe.
Metoda utilizată este una inovativă. Astfel, pentru fi ecare indicator studiat s-a
realizat o grupare a valorilor înregistrate la nivelul unităților administrativ
teritoriale pe 10 intervale conform schemei standard de clasifi care Natural breaks
(Jencks), obţinându-se în acest mod 10 grupe, cărora, în ordinea crescătoare a
valorilor, li s-au atribuit punctaje de la 1 la 10. Pentru fi ecare domeniu studiat,
s-a calculat indicele corespunzător UAT-urilor ca medie a punctajelor acordate
indicatorilor ponderată cu coefi cienţii de importanţă. În mod similar s-a acordat un indice fi nal de atractivitate la nivel de UAT, ca medie a indicilor corespunzători
acestor domenii ponderată cu coefi cienţii de importanţă. Indicii calculați pentru
fi ecare domeniu și indicele fi nal de atractivitate la nivel de UAT au fost transpuși
în hărți tematice cu ajutorul ARCGIS 10.2.2. și al suportului său statistic. Articolul
a fost elaborat pe baza studiilor realizate în cadrul proiectului PN 16.10.07.01 -
faza a-III-a: ”Analiza atractivității rețelei de localități urbane și rurale ca entități
competitive, dinamice și inovative în vederea racordării la rețeaua europeană
de poli și coridoare de dezvoltare” și a proiectului 63PED/2017 având titulul:
”Model inovativ de planifi care teritorială a rețelei de localități policentrice și
echilibrate în contextul specializărilor inteligente a orașelor din România.
Cuvinte cheie: atractivitate, indice, orașe, domeniu, hărți, LAU2.
JEL: C22, R11, R12, R23, R42, R58

Revista Română de Statistică - Supliment nr. 9 / 2017 63
Introducere Studierea factorilor ce pot genera competitivitate regională constituie un demers actual la nivelul Uniunii Europene, în ceea ce priveşte abordarea în domeniul planifi cării spaţiale. Provocarea majoră a politicilor europene
destinate dezvoltării teritoriale constă în încercarea de a evidenţia conexiunea
dintre conceptele de dezvoltare policentrica şi competitivitate regională şi totodată între coeziune şi competitivitate, în scopul sprijinirii dezvoltării teritoriale. Provocările dezvoltării metropolitane competitive au devenit subiectul unei ample discuţii academice despre guvernare ( Parkinson, 1997 şi 2003; Begg, 1999; Ottgaar et al., 2008; Salet et al., 2003; Healy, 1997). În acelaşi timp, provocărilor dezvoltării intra-urbane li se acordase deja atenţie în dezbaterea asupra politicilor din cadrul iniţiativei URBAN din prima şi a doua perioadă de programare la nivel european. Bazată pe Agenda Lisabona 2000, dezbaterea politică s-a concentrat timp de câţiva ani cu precădere pe competitivitate. Din 2008, Cartea Verde a Coeziunii Teritoriale subliniază trei aspecte privind coeziunea teritorială: - Concentrarea şi specializarea zonelor urbane şi rurale - regiunile
periferice consolidează legăturile regionale funcţionale;
- Conectarea prin diferite infrastructuri: echipamente, TIC (tehnologia
informaţiei şi comunicaţiilor), reţelele în economia bazată pe cunoaştere şi în cercetare;
- Cooperarea la diferite niveluri, guvernanţa multi-nivel orizontală şi
verticală.
De câţiva ani, discuţia politică s-a mutat la problemele legate de
coeziunea socială şi teritorială, în faţa proceselor problematice şi divergente,
cel puţin la nivel interregional. Recent, Strategia Europa 2020 ridică din nou
problema coeziunii şi pune accentul pe obiectivul “creştere inteligentă”.
Referitor la Politica de coeziune a UE după 2013, acest document se
concentrează asupra creşterii inteligente, durabile şi favorabile incluziunii.
Această iniţiativă de politică se bazează pe premisa că:
- metropolele au o importanţă decisivă pentru competitivitatea Europei;
- este de o importanţă crucială conectivitatea între locurile foarte
dezvoltate şi cele specializate şi zonele metropolitane cu accesibilitate
bună;
- reţelele la diferite scări geografi ce leagă pieţele la nivel mondial ;
- buna guvernare şi cooperarea teritorială sunt elemente vitale pentru
punerea în aplicare a coeziunii economice şi sociale (ESPON 2010).
Din perspectiva spaţială, creşterea favorabilă incluziunii ar trebui
să se bazeze pe competitivitatea urbană şi regională dar, în acelaşi timp, ea
este considerată “...nu doar coeziune economică şi socială, ci şi coeziune
Romanian Statistical Review - Supplement nr. 9 / 201764
teritorială.” (ESPON, 2010). Oraşele reprezintă motoarele economiei regionale şi pot fi considerate drept agenţi de catalizare pentru creativitate şi inovare, la momentul actual. Cu toate acestea, tot aici se manifestă acut o serie de probleme cum ar fi şomajul şi sărăcia. Diversele aspecte ale vieţii urbane – economică, socială, culturală şi de mediu – sunt strâns legate între ele şi o politică de succes în domeniul dezvoltării urbane durabile presupune o abordare integrată. Această abordare capătă o importanţă sporită în actuala perioadă, dată fi ind seriozitatea problemelor cu care se confruntă oraşele (schimbările demografi ce, consecinţele stagnării economice, impactul schimbărilor climatice). Totuși, dezvoltarea teritoriului actual al Uniunii Europene din punct de vedere economic poate fi caracterizată ca un proces de metropolizarea a potențialelor zone de dezvoltare economică cu capacități de inovare (Krátke, 2007). De asemenea, noua politică urbană va fi organizată diferit prin implicarea mult mai activă a populației, ceea ce duce la o schimbare în guvernarea acestor zone metropolitane (Andersen, 2003). Astfel, guvernarea locală în zonele metropolitane va fi puternic infl uențată și modelată de relația cu societatea civilă (Feiock, 2004). Metropolizarea este un proces de atragere de noi activități specifi ce, locuri de muncă și locuitori, bazându-se predominant pe competitivitate. Acest lucru înseamnă că atragerea de funcțiuni și activități metropolitane specifi ce se bazează pe anumite atuuri ale orașelor, de obicei cele mai puternice dintre ele, precum și pe potențialul lor, care oferă avantaje specifi ce în funcție de zonă. În acest context, modalitățile de guvernare metropolitane sunt de o importanță crucială în ceea ce privește dezvoltarea teritorială prin întărirea competitivității și atragerea de noi specializări funcționale. În literatura de specialitate este refl ectată problematica procesului de metropolizare a marilor oraşe în concordanţă cu studiile de policentricitate. Policentricitatea este considerată la ora actuală un instrument de planifi care spaţială util pentru a spori competitivitatea oraşelor, coeziunea socială şi durabilitatea mediului (Davoudi, 2003). Un nou concept pentru maximizarea procesului de dezvoltare a zonelor metropolitane îl constituie specializarea inteligentă care reprezintă un instrument important în realizarea strategiilor alternative de dezvoltare durabilă bazate pe cercetare-dezvoltare-inovare. O condiție pentru atingerea obiectivelor dezvoltării economice a zonelor metropolitane este prezența unei viziuni și a strategiilor de dezvoltare durabilă. Demarată prin Hotărârea de Guvern nr. 998/2008, politica polilor de creştere în România şi-a propus inducerea unei creşteri economice rapide, crearea de locuri de muncă, impulsionarea productivităţii care să iradiaze dezvoltare în oraşele mici şi mijlocii, precum şi în zonele rurale adiacente polilor. Pentru a contribui la dezvoltarea economiei întregii regiuni de infl uenţă, au fost defi nite mai multe categorii de centre urbane: 7 poli de
Revista Română de Statistică - Supliment nr. 9 / 2017 65
creştere (câte unul pentru fi ecare regiune de dezvoltare, cu excepţia regiunii
Bucureşti-Ilfov) şi 13 centre de dezvoltare urbană de importanţă regională. De
asemenea Legea nr. 264/2011 stipulează că, în vederea dezvoltării echilibrate
a teritoriului din zona Capitalei României şi a municipiilor de rangul I sau a
municipiilor reşedinţă de judeţ, unităţile administrativ-teritoriale de bază din
aceste zone se pot asocia într-un parteneriat voluntar în scopul înfi inţării de
zone metropolitane aferente spaţiului urban. Asocierea contribuie la întărirea
complementarităţilor între aceste unităţi şi factorii de decizie interesaţi în
dezvoltarea teritoriului.
Prioritatea acestor măsuri vizează creșterea coerenţei, efi cacităţii
şi durabilităţii rezultatelor resurselor investite în dezvoltarea urbană prin
dezvoltarea și implementarea unor proiecte în cadrul unor strategii integrate
de dezvoltare. Investitiile teritoriale integrate (ITI) sunt instrumente de
dezvoltare teritorială care presupun existența unei strategii de dezvoltare
teritorială integrată aferentă unui teritoriu desemnat, a unui set de acțiuni care
pot fi puse în aplicare pentru atingerea obiectivelor stabilite prin strategia de
dezvoltare teritorială integrată. Aceste instrumente sprijină dezvoltarea urbană
integrată printr-o abordare intersectorială şi multidimensională, în sensul că
oferă posibilitatea combinării fi nanţărilor legate de diferite obiective tematice,
inclusiv din axele prioritare şi programele operaţionale sprijinite de FEDR,
FSE şi FC. Pornind de la noţiunile de policentricitate şi modul de evaluare a
acesteia la nivel european pe diferite nivele administrative şi analizând noile
tendinţe de dezvoltare spaţială europeană referitoare la oraşele inteligente, este
necesară realizarea unei baze de date spaţiale la nivel de unități administrativ-
teritoriale (LAU 2), care să evidențieze atât aspecte cantitative cât şi aspecte
calitative în legătură cu coeziunea teritorială naţională, dezvoltarea echilibrată
şi tendinţele de evoluţie a oraşelor și comunelor din România. Articolul de față
prezintă rezultatele obținute privind gradul de atractivitate a localităților din
România din punct de vedere al dezvoltării spațiale.prin utilizarea suportului
statistic al sistemelor informaționale geografi ce.
Metodologia de evaluare a atractivității orașelor din România
Metodologia bazei de date spațiale se bazează pe: 1) indicatori
statistici relevanti din diverse domenii specifi ce amenajării teritoriului, și
2) pe soluția inovativă de evaluare bazată pe schema standard de clasifi care
– Natural breaks (Jenks), prezentata în articolul ”ASSESSMENT OF
FUNCTIONAL POLICENTRICITY IN ROMANIAN COUNTY RESIDENCE
MUNICIPALITIES” (Tache A. et al., 2016). Pentru fi ecare indicator studiat s-a
realizat o grupare a valorilor înregistrate la nivelul UAT-urilor pe 10 intervale
conform schemei standard de clasifi care Natural breaks (Jencks), obţinându-se

Romanian Statistical Review - Supplement nr. 9 / 201766
în acest mod 10 grupe, cărora, în ordinea crescătoare a valorilor, li s-au atribuit
punctaje de la 1 la 10. Clasifi carea lui Jencks pe baza grupǎrii naturale a valorilor se realizează prin identifi carea punctelor de rupturǎ cǎutând acele modele de grupare implicite ale datelor. Valorile sunt împǎrţite în clase acolo unde graniţele sunt marcate prin salturi mari de la o valoare la alta. În cazul în care un indicator a înregistrat valoarea 0 la un UAT studiat, punctajul atribuit acelui UAT la acest indicator va fi tot 0. Prin urmare, toate valorile indicatorilor selectaţi au fost transformate în punctaje ale grupelor din care fac parte (1,2,…,10, eventual 0), iar acest lucru a fost realizat cu ajutorul suportului statistic al programului ArcGIS 10.2.2. În cadrul fi ecărui domeniu, mai mulţi specialişti în dezvoltare locală au stabilit coefi cienţi de importanţă (ponderi) pentru toţi indicatorii. Pentru fi ecare domeniu, s-a calculat indicele corespunzător UAT-urilor ca medie a punctajelor acordate indicatorilor ponderată cu coefi cienţii de importanţă. În mod similar, s-au acordat coefi cienţi de importanţă (ponderi) fi ecărui domeniu de interes şi s-a calculat un indice de atractivitate la nivel LAU 2, ca medie a indicilor corespunzători acestor domenii ponderată cu coefi cienţii de importanţă. Astfel, pentru analiza la nivel LAU 2, au fost analizați indicatori statistici din următoarele domenii: Domeniul POPULAȚIE - Volumul populației (2015); - Sporul natural (2015); - Sporul migratoriu (2015); - Evoluția populației 2015/2011; - Evoluția populației 2011/2008. Specialiștii sociologi din cadrul institutului URBAN-INCERC București au identifi cat 5 indicatori semnifi cativi pentru evaluarea domeniului Populație. O parte din acești indicatori au fost calculați și apoi valorile lor au fost transformate în cifre de la 1 la 10 conform standardului de clasifi care Natural breaks (Jencks). După transformarea tuturor acestor indicatori în valori de la 1 la 10, specialiștii institutului din domeniul dezvoltării teritoriale și din domeniul sociologiei au stabilit ponderi acestor indicatori pentru a calcula un indice fi nal pentru domeniul Populație, ca medie a a indicatorilor corespunzători domeniului. În acest fel., fi ecărei unități administrativ teritorială din România îi corespunde un indice fi nal, cel mai mic indice 1,1 aparținând comunei Întregalde (județul Alba) și cea mai mare valoare (7,4) municipiului Iași. Domeniul TRANSPORTURI - Accesibilitate la drumuri naționale, drumuri europene, autostrăzi; - Accesibilitate la stațiile de cale ferată; - Accesibilitate la aeroporturi; - Accesibilitate la porturi.
Revista Română de Statistică - Supliment nr. 9 / 2017 67
Ca și în cazul domeniului Populație, specialiștii în domeniul Transporturi și dezvoltării teritoriale ai institutului Urban-Incerc București au identifi cat 4 indicatori din domeniul Transporturilor, și conform metodologiei prezentate a fost calculat un indice fi nal la nivelul UAT-urilor din România. Conform acestui clasament a rezultat un indice minim 0 pentru 991 UAT-uri și un indice maxim de 8,6 pentru municipiul Constanța. Domeniul ECONOMIE Indicatori studiați pentru analiză: - Număr salariați (2015); - Evoluția numărului de salariați 2015/2011; - Raportul dintre numărul de salariați și populație 2015; - Numărul de înnoptări turistice din fi ecare UAT-2015. În cazul domeniului Economie, numărul de indicatori studiați au fost destul de scăzuți, datorită lipsei datelor economice la nivel de unități administrativ teritoriale. Conform metodologiei și pe baza experților din institutul Urban-Incerc au fost acordate ponderi pentru fi ecare indicator economic și calculat un indice fi nal economic. Astfel, valoarea cea mai scăzută a fost de 0,8 pentru un număr de 64 UAT-uri și valoarea cea mai ridicată a fost de 8,2 puncte pentru municipiul București. Domeniul EDILITARE: - Lungimea străzilor modernizate raporată la Lungimea străzilor
totale - 2015; - Cantitatea de apă pentru uz casnic distribuită – 2015; - Cantitate de gaz pentru uz casnic distribuită – 2015; - Lungime rețea canalizare – 2015; - Număr de locuințe noi raportat la numărul de locuințe totale – 2015. Specialiștii în domeniul ingineriei edilitare și amenajării teritoriului au identifi cat 5 indicatori relevanți pentru domeniul studiat și conform metodologiei și ponderilor acordate a fost calculat indicele fi nal în domeniul edilitar. Valorea cea mai scăzută a fost 0 pentru 368 UAT-uri ceea ce reprezintă o mare problemă pentru România, iar valoarea cea mai ridicată a fost de 9,5 în orașul Popești-Leordeni. DOMENIUL CONDIȚII NATURALE
- Suprafața UAT-ului - 2015; - Suprafața pădurilor - 2015; - Prezența parcurilor naționale sau naturale - 2015; - Prezența biosferelor la nivelul UAT-urilor - 2015; - Prezența siturilor RAMSAR la nivelul UAT-urilor - 2015; - Prezența SCI sau SPA la nivelul UAT-urilor - 2015.

Romanian Statistical Review - Supplement nr. 9 / 201768
Specialiștii INCD Urban-Incerc în domeniul geografi ei fi zice au propus pentru evaluarea condițiilor naturale la nivel de UAT din România 6 indicatori. Pe baza metodologiei și a ponderilor acordate acestor indicatori a fost calculat un indice fi nal la nivel de UAT pentru Condiții Naturale. Cea mai scăzută valoare a fost de 0,5 puncte și o regăsim în 167 UAT-uri, iar cea mai ridicată valoare este de 5,38 în comuna Padeș și orașul Borșa. DOMENIUL SOCIAL - Număr grădinițe - 2015; - Număr școli – 2015; - Număr licee – 2015; - Număr facultăți – 2015; - Număr studenți – 2015; - Număr studenți raportat la volumul populației în anul 2015; - Număr paturi spital - 2015; - Număr paturi spital raportat la volumul populației în anul 2015; - Număr dispensare - 2015; - Număr spitale - 2015; - Număr medici – 2015; - Număr medici raportat la volumul populație în anul 2015; - Număr cadre medicale - 2015; - Număr cadre medicale raportat la volumul populației în anul 2015. În cazul domeniului Social a fost identifi cat un număr însemnat de indicatori, ceea ce a condus și la rezultate mult mai concludente. Utilizând metodologia propusă și alegerea ponderilor conform specialiștilor în domeniul sociologiei și amenajării teritoriului din institutul Urban-Incerc s-a obținut indicele fi nal pentru domeniul Social. Valoarea cea mai scăzută a fost 0 în 5 UAT-uri, iar valoarea cea mai ridicată a fost 7,85 în municipiul București și municipiul Cluj-Napoca. DOMENIUL CULTURĂ - Număr spectatori – 2015; - Număr spectatori 2015 raportat la număr spectatori 2008; - Număr de spectatori raportat la volumul populației în 2015; - Număr vizitatori muzeu – 2015; - Număr vizitatori muzeu 2015 raportat la număr vizitatori muzeu 2008; - Număr de vizitatori muzeu raportat la volumul populației în 2015. Pentru domeniul Cultură s-au utilizat numai datele TEMPO furnizate de Institutul Național de Statistică. Pe baza metodologiei și ponderilor acordate pentru acest domeniu cele mai scăzute valori s-au înregistrat în 2786 unități administrativ teritoriale, respectiv valoarea 0, iar cele mai mari valori s-au în registrat în municipiul Sibiu și municipiul București (valoarea 8).

Revista Română de Statistică - Supliment nr. 9 / 2017 69
Rezultate și analize
3.1. Analiza domeniului POPULAȚIE
Pentru analiza domeniului POPULAȚIE, specialiștii din domeniul
sociologiei au ales următoarele ponderi pentru indicatorii studiați: Populație
(2015) – 40%, Spor natural (2015) – 15%, Spor migratoriu (2015 – 2011) – 15%
, Evoluția populației 2015/2011 – 20%, Evoluția populației 2011/2008 – 10%.
Utilizând capabilitățile softului ARCGIS 10.2.2. și clasifi carea lui
Jencks pe baza grupǎrii naturale a valorilor indicatorilor s-a obținut următoarea
cartogramă (Fig. 1):
Analiza indicatorului fi nal pentru domeniul POPULAȚIE
Figure 1
Zonele cu un indicator fi nal mare și foarte mare pentru domeniul
POPULAȚIE, ceea ce implică o evaluare pozitivă pentru acest domeniu sunt:
- Zona compactă ce cuprinde municipiul București, județul Ilfov,
nordul județului Giurgiu, sudul județului Dâmbovița și culoarul București-
Ploiești cu tendințe pozitive spre municipiul Brașov;
- Zona compactă compusă din jumătățile vestice ale județelor Arad și
Timiș;
- Zona compactă ce cuprinde județul Sibiu, județul Brașov, zona de
vest a județului Covasna, județul Hargita și sudul județului Mureș;

Romanian Statistical Review - Supplement nr. 9 / 201770
- Culoarul de dezvoltare Baia Mare – Satu Mare;
- Culoarul de legătură dintre municipiul Bacău și municipiul Piatra Neamț; - Zona compactă din jurul municipiului Oradea cu tendință de extindere atât spre sud (municipiul Arad), cât și spre nord (municipiul Satu-Mare); - Zona compactă din jurul municipiilor Cluj-Napoca, Constanța, Iași, Târgu Mureș, Suceava, Pitești și parțial zonele din jurul municipiilor Craiova, Râmnicu Vâlcea, Târgoviște, Bistrița. Zonele cu un indicator fi nal mic și foarte mic pentru domeniul POPULAȚIE, ceea ce implică o evaluare negativă pentru acest domeniu sunt: - Zona compactă a munților Apuseni și a împrejurimilor acestuia (zona de sud-vest a județului Cluj, nord-vestul județului Alba, estul județului Arad, nordul județului Hunedoara); - Zona compactă a județului Teleorman, sudul județului Argeș, estul județului Olt și sud-estul județului Giurgiu; - Zona compactă a nordului și estului județului Mehedinți cu zona de vest a județului Dolj; - Zona compactă a nordului județului Ialomița, sudul județelor Brăila și Bacău; - Zona compactă a nordului județului Buzău cu sudul județului Vrancea; - Zona compactă a zonei de est și sud-est a județului Vaslui cu zona de nord a județului Galați; - Jumătatea estică a județului Caraș-Severin, zona din est și sud a județului Sălaj, jumătatea estică a județului Botoșani, jumătatea vestică a municipiului Călărași, sudul județului Vâlcea și o mare majoritate din județul Tulcea. Zonele cu potențial demografi c le întâlnim în zona marilor orașe sau pe culoarele de dezvoltare dintre marile orașe, dar și zone compacte de dimensiuni mari cum este zona Regiunii de Centru. De asemenea, se observă că valorile cele mai mari ale indicelui fi nal POPULAȚIE îl dețin UAT-urile limitrofe marilor orașe: Florești (Cluj-Napoca), Chiajna, Popești-Leordeni, Bragadiru, Pantelimon, Voluntari (București), Giroc, Dumbrăvița (Timișoara), Șelimbăr (Sibiu) sau Miroslava (Iași). Cele mai mici valori ale UAT-urilor se înregistrează în zonele compacte cu probleme demografi ce; dintre acestea menționăm Întregalde, Ceru-Băcăinți din zona munților Apuseni, Măceșu de Sus, Seaca de Pădure Brabova din zona compactă a județelor Dolj-Mehedinți, Slobozia Mândră, Făgețelu, Bărăști din zona compactă a județelor Olt, Teleorman, Argeș, Giurgiu.În concluzie se observă că marile probleme demografi ce sunt în Muntenia, în Transilvania în zona munților Apuseni și împrejurimile și în județul Caraș-Severin din zona Banatului.

Revista Română de Statistică - Supliment nr. 9 / 2017 71
3.2. Analiza domeniului ECONOMIE
Pentru analiza domeniului ECONOMIE, specialiștii din domeniul economic au ales următoarele ponderi pentru indicatorii studiați: Număr salariați (2014) – 35%, Raportul dintre numărul de salariați 2014 și numărul de salariați 2011 – 20%, Raportul dintre numărul de salariați 2014 și volumul populației 2014 – 25%, Numărul de înnoptări turistice – 20%. Ca și în cazul domeniului POPULAȚIE clasifi carea indicatorilor pentru domeniul ECONOMIC a avut la bază gruparea naturală a valorilor indicatorilor (metoda Jencks) și capabilitățile suportului statistic al softului ARCGIS 10.2.2. În fi nal s-a obținut următoarea cartogramă pentru capitolul ECONOMIE (Fig. 2):
Analiza indicatorului fi nal pentru domeniul ECONOMICFigure 2
Analizând cartograma observăm următoarele: zonele cu un indicator fi nal ridicat și foarte ridicat pentru domeniul ECONOMIE, ceea ce implică o evaluare pozitivă pentru acest domeniu sunt: - Regiunea București-Ilfov; - Zona compactă ce cuprinde o mare parte din județul Timiș (exceptând partea de est) și zona de sud-vest a municipiului Arad; - Zona metropolitană a județului Sibiu și un viitor culoar Sibiu-Rm. Vâlcea;
Romanian Statistical Review - Supplement nr. 9 / 201772
- Zona Alba-Iulia – Sebeș din județul Alba; - Zona metropolitană Brașov, Ploiești, Oradea, Baia Mare și parțial zonele metropolitane ale municipiilor Cluj-Napoca, Târgu-Mureș, Constanța, Satu-Mare, Deva, Buzău; - Zonă compactă a estului județului Maramureș și nord-estul județului Bistrița. Zonele cu un indicator scăzut și foarte scăzut al indicatorului fi nal domeniul ECONOMIC sunt: - Zona compactă constituită din zona de est a județului Suceava, județul Botoșani, județul Iași, zona de est a județelor Bacău și Neamț, județul Vaslui și o mare parte din județul Galați (exceptând sudul județului); - Zona compactă constituită din județul Mehedinți, Dolj, Olt, sudul județelor Vâlcea, Gorj, Argeș, majoritatea județului Dâmbovița; - Zonă compactă ce cuprinde județul Ialomița, Călărași, Brăila, Tulcea și o parte din județul Constanța; - Zona de nord a județului Buzău și zona de sud a județului Vrancea; - Zonă compactă din nordul județului Cluj, estul județului Bistrița-Năsăud, sudul județului Maramureș; - Zone compacte din județele Caraș Severin, Hunedoara, Alba, Sălaj, Satu Mare, Sibiu, Mureș, Covasna, Harghita. În concluzie observăm că există 2 zone compacte cu un nivel al indicatorului fi nal ECONOMIC ridicat – regiunea București-Ilfov și zona compactă a județelor Timiș și Arad. În rest sunt câteva zone metropolitane cu un nivel ridicat al indicelui fi nal în jurul marilor orașe, în special din Transilvania. Se observă defi nirea pe viitor al unor culoare de dezvoltare cum ar fi București-Ploiești-Brașov; Alba-Iulia-Sibiu-Brașov; Oradea-Arad-Timișoara; Baia Mare-Satu Mare; Bacău-Piatra Neamț. Ca și în cazul indicelui fi nal POPULAȚIE, UAT-urile afl ate în jurul
marilor orașe au un indicator ridicat pentru domeniul ECONOMIC. Dintre
acestea se remarcă orașul Otopeni, comuna Ghimbav, orașul Mioveni, comuna
Bascov, comuna Cristian, orașul Voluntari, orașul Eforie, orașul Sebeș sau
comuna Giroc.
3.3. Analiza domeniului TRANSPORTURI
Pentru analiza domeniului TRANSPORTURI, specialiștii din
domeniul mobilității teritoriale au ales următoarele ponderi pentru indicatorii
studiați: acces aeroport – 35%, acces port – 15%, acces DN, DE, Autostradă –
25%, acces stații de cale ferată – 25% (Fig. 3).
Cartograma pentru domeniul TRANSPORTURI se prezintă astfel:

Revista Română de Statistică - Supliment nr. 9 / 2017 73
Analiza indicatorului fi nal pentru domeniul TRANSPORTURIFigure 3
Zonele cu o accesibilitate ridicată și foarte ridicată la nivelul României sunt cele cu accesibilitate la aeroporturi prin care tranzitează un număr mare de pasageri. În acest sens putem evidenția UAT-urile situate în nordul Bucureștiului, UAT-urile situate lângă municipiile Timișoara, Arad, Cluj-Napoca, Constanța, Târgu-Mureș, Iași, Bacău, Craiova, Baia Mare, Satu Mare și Suceava. Accesibilitate relativ ridicată apare pe culoarul București-Constanța. O accesibilitate medie prezintă UAT-urile situate pe culoarele 4 (feroviar Arad – Deva – Sibiu – Brașov – București - Constanța și Timișoara – Lugoj – Caransebeș - Drobeta Turnu – Severin – Craiova – București - Constanța) și 9 (feroviar și rutier – București – Ploiești – Buzău – Focșani – Roman - Iași sau București – Buzău – Focșani - Huși). Accesbilitate medie avem și pe culoarul Sebeș-Alba Iulia-Cluj Napoca-Oradea, București-Urziceni-Brăila-Galați sau Brașov-Sfântu Gheorghe- Miercurea Ciuc-Toplița. Zone cu accesibilitate redusă întâlnim în special în zonele de deal și munte, dar și pe culoarul 7 al Dunării, în special în zona de sud a țării.

Romanian Statistical Review - Supplement nr. 9 / 201774
3.4. Analiza domeniului EDILITARE
Pentru analiza domeniului EDILITARE, specialiștii reprezentați de ingineri specializați pe diverse ramuri au ales următoarele ponderi pentru indicatorii studiați: Raport dintre lungimea străzilor modernizate și lungimea străzilor totale – 20%, cantitatea de apă pentru uz casnic – 30%, cantitatea de
gaze pentru uz casnic – 10%, lungimea rețelei de canalizare – 20% și raportul
dintre numărul de locuințe noi și numărul total de locuințe – 20%.
Acest indicator este relevant, în special pentru orașele din România,
relevând foarte bine zonele cu defi ciențe mari în ceea ce privește echiparea
edilitară. Cartograma domeniului EDILITARE se prezintă astfel (Fig. 4):
Analiza indicatorului fi nal pentru domeniul EDILITAREFigura4
Zonele cu un indicator fi nal ridicat și foarte ridicat pentru domeniul
EDILITARE se regăsește în regiunea București-Ilfov și într-o mare parte din
UAT-urile componente ale județelor Cluj, Timiș, Bihor, Arad, Maramureș,
Sibiu, Brașov, Harghita, Prahova. Dintre UAT-urile cu cel mai ridicat indice
fi nal pentru domeniul EDILITARE enumerăm: Cisnădie (județul Sibiu),
Popești-Leordeni (județul Ilfov), Ștefănești (județul Argeș), Râșnov (județul
Brașov), Tălmaciu (județul Sibiu) sau Ghimbav (județul Brașov).
La polul opus, unde indicatorul fi nal EDILITARE este redus și foarte
redus sunt UAT-urile din județe ca Mehedinți, Dolj, Olt, Teleorman, Giurgiu,

Revista Română de Statistică - Supliment nr. 9 / 2017 75
Botoșani, Suceava, Iași sau Vaslui. Din totalul UAT-urilor din România există totuși 368 de UAT-uri care au indicele fi nal pentru domeniul EDILITARE egal cu zero, ceea ce relevă faptul că nu există nici măcar alimentare cu apă potabilă. Cele mai multe UAT-uri cu indicele fi nal pentru domeniul EDILITARE egal cu zero sunt în județele Teleorman, Dolj, Vaslui, Mehedinți.
3.5. Analiza domeniului CONDIȚII NATURALE
Pentru analiza domeniului CONDIȚII NATURALE, specialiștii reprezentați de geografi specializați în domeniul geografi ei fi zice au stabilit următoarele procente pentru indicatorii studiați: Suprafața UAT-ului 2015 – 30%; Suprafața pădurilor 2015 – 20%; Prezența parcurilor naționale sau naturale 2015 – 15%; Prezența biosferelor la nivelul UAT-urilor 2015 – 15%; Prezența siturilor RAMSAR la nivelul UAT-urilor 2015 – 12%; Prezența SCI sau SPA la nivelul UAT-urilor 2015 – 8%. Cartograma domeniului CONDIȚII NATURALE se prezintă astfel (Fig. 5):
Analiza indicatorului fi nal pentru domeniul CONDIȚII NATURALEFigura 5
Indicatorul fi nal pentru domeniul CONDIȚII NATURALE evidențiază prezența ariilor naturale protejate în special în zona arcului carpatic și în Delta Dunării, avantajând județele situate în zona de centru a țării. Județele cu un
Romanian Statistical Review - Supplement nr. 9 / 201776
indicator fi nal scăzut sunt cele din sudul țării, în special Olt și Teleormen, dar și județele din estul țării, în special județul Botoșani. Concluzia este, în special pentru județele dunărene, de a maximiza potențialul turistic al fl uviului Dunărea, în condițiile implementării Strategiei Europene a Dunării.
3.6. Analiza domeniului SOCIAL
Pentru domeniul SOCIAL au fost analizați de specialiștii în sociologie și geografi e economică un număr însemnat de indicatori statistici, cărora li s-au acordat următoarele ponderi: numărul grădinițe 2015 – 4%, număr școli 2015 – 4%, număr licee 2015 – 5%; număr facultăți 2015 – 8%; număr studenți 2015 – 8%; număr studenți raportat la volumul populației în anul 2015 – 10%, număr paturi spital 2015 – 8%, număr paturi spital raportat la volumul populației în anul 2015 – 11%, număr dispensare 2015 – 4%, număr spitale 2015 – 5%; număr medici 2015 – 8%; număr medici raportat la volumul populație în anul 2015 – 10%, număr cadre medicale 2015 – 6%, număr cadre medicale raportat la volumul populației în anul 2015 – 8%. Pe baza acestor indicatori și ponderi a fost realizată următoarea cartogramă (Fig. 6):
Analiza indicatorului fi nal pentru domeniul SOCIALFigura 6

Revista Română de Statistică - Supliment nr. 9 / 2017 77
Așa cum era de așteptat indicele fi nal pentru domeniul SOCIAL are valori ridicate și foarte ridicate în marile orașe și orașele de mărime medie și mică. Dintre județele cu mari probleme privind echiparea socială menționăm
în primul rând județul Tulcea, urmat de județele Bacău, Botoșani, Covasna, Brăila și Mehedinți. De menționat că există 5 comune care are indicele fi nal pentru domeniul Social egal cu zero, cele 5 comune fi ind: Ciocârlia din județul Ialomița, Bunila și Bătrâna din județul Hunedoara, Brebu Nou din comuna Caraș-Severin și Mahmudia (județul Tulcea). Putem estima că în următorii ani în județul Tulcea situația se va îmbunătăți simțitor, datorită programului de Investiții Teritoriale Integrate ce se va derula în Delta Dunării, restul județelor necesitând programe speciale de dezvoltare în domeniul social fi nanțate atât din surse interne, cât și externe.
3.7. Analiza domeniului CULTURA
Pentru domeniul cultural, specialiștii din domeniul urbanismului și amenajării teritoriului au inclus 6 indicatori cărora le-au acordat următoarele ponderi: număr spectatori 2015 – 25%; număr spectatori 2015 raportat la număr spectatori 2008 – 10%; număr de spectatori raportat la volumul populației în 2015 – 15%, număr vizitatori muzeu 2015 – 25%; număr vizitatori muzeu 2015 raportat la număr vizitatori muzeu 2008 – 10% și număr de vizitatori muzeu raportat la volumul populației în 2015 – 15%. De menționat că analiza domeniului CULTURAL este relativ concludentă, datorită neincluderii datelor privind monumentele ce aparțin patrimoniului UNESCO și monumentele de arhitectură de importanță națională la nivel de LAU 2. Cartograma pentru acest domeniu se prezintă astfel (Fig. 7):

Romanian Statistical Review - Supplement nr. 9 / 201778
Analiza indicatorului fi nal pentru domeniul CULTURĂFigura 7
Se evidențiază încă o dată faptul că fenomenul cultural este generat în sprcial de marile orașe sau de orașe medii și mici cu vechi tradiții culturale. De asemenea, punctaje ridicate prezintă și comunele care administrează pe teritoriul lor muzee sau monumente istorice de importanță națională. Dintre acestea menționăm Comuna Bran (județul Brașov), Sucevița (județul Suceava), Dâmbovicioara (județul Argeș) sau Sarmizegetusa (județul Hunedoara).
3.8. Indice fi nal de analiză la nivel LAU 2
Indicele fi nal de analiză a atractivității unităților administrativ-teritoriale la nivel LAU 2 a fost calculat prin ponderarea tuturor indicatorilor calculați pentru domeniile studiate. Astfel, ponderile stabilite de specialiștii din domeniul planifi cării teritoriale se prezintă astfel: Indicele pentru domeniul POPULAȚIE – 17%, Indicele pentru domeniul TRANSPORTURI – 17%, Indicele pentru domeniul ECONOMIC – 28%, Indicele pentru domeniul CONDIȚII NATURALE – 10%, Indicele pentru domeniul EDILITARE – 10%, Indicele pentru domeniul SOCIAL – 10%, Indicele pentru domeniul CULTURĂ – 8%. Pe baza acestor indici ponderați a fost realizată harta indicelui de atractivitate la nivelul administrativ LAU 2. Gruparea valorilor indicelui de atractivitate la nivel LAU 2 a fost realizată pe 10 intervale conform schemei standard de clasifi care Natural breaks (Jencks), obţinându-se în acest mod 10

Revista Română de Statistică - Supliment nr. 9 / 2017 79
grupe, cărora, în ordinea crescătoare a valorilor, li s-au atribuit punctaje de la 1 la 10. Cu ajutorul softului ARCGIS 10.2.2., harta atractivității UAT-urilor din România se prezintă astfel (Fig. 8):
Indice fi nal de atractivitate LAU2 la nivel național
Figura 8
Punctele tari ale acestei hărți de atractivitate se regăsesc în special în Transilvania și regiunea București-Ilfov. - Regiunea București-Ilfov infl uențează pozitiv și unitățile administrativ-teritoriale alăturate, existând posibilitatea ca în câțiva ani să existe o axă de dezvoltare reală București-Ploiești. - Zona metropolitană a municipiilor Timișoara și Arad constituie un sistem urban de dezvoltare care infl uențează pozitiv jumătatea de vest a județului Timiș și vestul județului Arad. - De asemenea, există un potențial de dezvoltare în zona metropolitană Oradea ce poate conduce la o zonă relativ atractivă pe culoarul Oradea-Arad. - Zonele metropolitane din jurul municipiilor Baia-Mare și Satu-Mare sunt zone relativ atractive, cu potențial de dezvoltare în viitor pe culoarul Satu Mare-Baia Mare. - Există deja un culoar de atractivitate pe culoarul Alba Iulia – Sebeș – Sibiu cu potențial ridicat de dezvoltare. Zona metropolitană Sibiu s-a conturat destul de bine cu tendința de dezvoltare spre sudul județului.

Romanian Statistical Review - Supplement nr. 9 / 201780
- Zona metropolitană Brașov s-a conturat de asemenea ca o zonă de atractivitate cu potențial de dezvoltare pe axa Brașov-Ploiești. - Zona metropolitană Cluj-Napoca este o zonă relativ atractivă, chiar dacă potențialul de dezvoltare este ridicat. - Zona metropolitană Constanța este o zonă relativ atractivă cu potențial de dezvoltare pe axa Constanța-București. - Zone metropolitane relativ atractive, dar cu potențial ridicat de dezvoltare se regăsesc în jurul municipiilor Târgu-Mureș, Pitești, Bacău, Craiova, Iași. - Culoare cu potențial de dezvoltare, dar încă nefructifi cate se regăsesc între municipiile Galați și Brăila sau între municipiile Bacău și Piatra Neamț. - Zone relativ atractive pot fi considerate în nordul județelor Vâlcea și Gorj sau zonele situate în nordul județului Bistrița Năsăud și estul județului Maramureș. Problemele de atractivitate le regăsim în județele din sudul și estul țării, și anume Mehedinți, Dolj, Olt, Teleorman, Giurgiu, Călărași, Ialomița, Brăila, Botoșani. Vaslui. De asemenea, regăsim multe UAT-uri cu probleme de atractivitate în județele Iași, Vrancea, Buzău, Caraș-Severin, Hunedoara, Bistrița-Năsăud, Bacău, Neamș și sudul județelor Vâlcea, Gorj, Argeș. În concluzie, putem evidenția faptul că foarte multe dintre UAT-urile atractive au indicii calculați pe fi ecare domeniu ridicați sau relativ ridicați, în timp ce zonele cu atractivitate redusă au valorile indicilor calculați pe domeniile studiate scăzute sau relativ scăzute.
Concluzii Studiul propus a avut ca obiectiv evaluarea potențialului localităților din România pentru dezvoltare economică, stabilitate sau declin și identifi carea factorilor care determină apariția și dezvoltarea unor astfel de tendințe, utilizând indicatori statistici în evoluție și un suport statistic în sistem GIS. Comparând analizele realizate în cadrul studiului (prin stabilirea indicilor fi nali pentru domeniile specifi ce planifi cării teritoriale și a indicelui fi nal la nivel de LAU 2) cu analizele realizate în urmă cu 10 ani în lucrarea ”Sisteme geo-spaţiale pentru dezvoltarea durabilă a României”, (în care s-au
realizat analize teritoriale la nivel NUTSV utilizând metoda ELECTRE de
evaluare fi nală), putem concluziona următoarele: - Din punct de vedere al potențialului demografi c, analizele demonstrează aceleași puncte tari și puncte slabe ca și în urmă cu 10 ani, respectiv zone cu indicatori ridicați pentru localitățile din jurul marilor orașe sau culoare de dezvoltare și zone cu indicatori scăzuți în sudul țării și în zona munților Apuseni.

Revista Română de Statistică - Supliment nr. 9 / 2017 81
- Din punct de vedere al dezvoltării economice, se constată creșterea decalajelor dintre zonele cu potențial de dezvoltare și zonele slab dezvoltate. În acest context se observă o dezvoltare accentuată a zonelor limitrofe mailor orașe cu potențial de dezvoltare (București, Timișoara, Arad, Cluj, Oradea, Sibiu, Brașov) și parțial zonele limitrofe din jurul orașelor Constanța, Târgu Mureș, Alba Iulia, Iași, Baia Mare, Satu Mare, Craiova. Acest decalaj care s-a accentuat în ultimii 10 ani se datorează investițiilor străine care s-au concentrat în special în zona Transilvaniei și a municipiului București, dar și absobției fondurilor europene cu precădere în aceste zone. - Această absobție a fondurilor europene în zonele preponderent dezvoltate este relevantă și pentru domeniul edilitar, unde diferența dintre analizele realizate în această fază și analizele realizate în urmă cu 10 ani demonstrează o reabilitare consistentă a zonelor cu potențial de dezvoltare, în timp ce în zonele sărace se observă un ritm lent de reabilitare edilitară. - Identifi carea punctelor tari, conform strategiilor inteligente și implicarea statului în reindustrializarea regiunilor sărace din punct de vedere economic este singura soluție pentru realizarea unuia dintre dezideratele Uniunii Europene și anume coeziunea teritorială. - Planifi carea spaţială sporită are o importanţă critică pentru atragerea
investitorilor şi pentru sprijinirea îmbunătăţirilor la nivelul rezultatelor de
dezvoltare de la nivel urban. Sporirea numărului de oraşe mai sustenabile
şi mai prospere este vitală pentru creşterea sustenabilă a României, iar
autorităţile publice trebuie să joace un rol-cheie pentru a ajuta aceste zone să
prospere.
- O Strategie Metropolitană Integrată (SMI) pe termen mediu și lung
este una din căile de asigurarea a echilibrului de dezvoltare teritorială.
Bibliografi e 1. Andersen, H. T., Van Kempen, R. (2003), New trends in urban policies in
Europe: evidence from the Netherlands and Denmark. Cities, 20(2), 77-86.
2. Begg, I. (1999), Cities and Competitiveness, in Urban Studies, Vol. 36, Nos 5-6,
pp. 795-810
3. Davoudi S. (2003), “Polycentricity in European Spatial Planning: From an Analytical Tool to a Normative Agenda”, European Planning Studies, Vol. 11, No.
8, 979-999
4. Feiock, R. C. (2009), Metropolitan governance and institutional collective action. Urban Affairs Review, 44(3), 356-377.
5. Healey P. (1997), Collaborative Planning: Shaping Places in Fragmented Societies. London, Basingstoke: Macmillan
6. Krätke S. (2007), “Metropolisation of the European economic territory as a consequence of increasing specialisation of urban agglomerations in the knowledge economy.” European Planning Studies 15.1 (2007): 1-27
7. National Institute of Statistics, 2017, Tempo Online
Romanian Statistical Review - Supplement nr. 9 / 201782
8. Otgaar A. Et al. (2008), Empowering Metropolitan Regions through New Forms of Cooperation. Hampshire: Ashgate Pub.Lim.
9. Parkinson, M. (1997), The rise of the European entrepreneurial city. In: Financing of cities and regions: subsidiarity and fi nance potentials, East-West Conference,
Munich, October 1996. (Conference proceedings, pp.125-136).
10. Parkinson, M. et al. (2003), Competitive European Cities: Where Do The Core
Cities Stand?.
11. Salet W. Et al. (2003), Metropolitan governance and spatial planning. London:
Spon Press.
12. Tache A. et al., 2010, Sisteme geospaţiale pentru dezvoltarea durabilă a României, Ed. Ars Docendi, ISBN 978-973-558-492-4, Bucureşti
13. Commission of the European Communities, 2008, Green Paper on Territorial
Cohesion Turning territorial diversity into strength, Brussels, 6.10.2008
14. Commission of the European Communities (1999), European Spatial
Development Perspective: Towards Balanced and Sustainable Development of
the Territory of the E.U., Luxembourg: Offi ce for Offi cial Publications of the
European Communities, accessed in
15. http://ec.europa.eu/regional_policy/sources/docoffi c/offi cial/reports/pdf/sum_
en.pdf
16. Commission of the European Communities (2011), Territorial Agenda 2020 -
Towards an Inclusive,
17. Smart and Sustainable Europe of Diverse Regions, the Informal Ministerial
Meeting of Ministers
18. responsible for Spatial Planning, 2011, Gödöllő, Hungary
19. Commission of the European Commission (2010), EUROPE 2020. A European
strategy for smart, sustainable and inclusive growth, Brussels.
20. ESPON ATTREG (2010): Attractiveness of European Regions and Cities for
Residents and Visitors (2010-2012), Draft Interim Report
21. ESPON Coordination Unit (2010), First ESPON 2013 Synthesis Report. New
Evidence on Smart, Sustainable and Inclusive Territories, Luxembourg.
22. Guvernul României, 2008, HG nr. 998/2008 pentru desemnarea polilor
naționali de creștere în care se realizează cu prioritate investiții din programele
cu fi nanțare comunitară și națională
23. Parlamentul României (2011), Legea nr. 264/2011 pentru modifi carea art. 1 alin.
(2) din Legea administraţiei publice locale nr. 215/2001 şi pentru modifi carea
art. 7 alin. (1) din Legea nr. 351/2001 privind aprobarea Planului de amenajare
a teritoriului naţional - Secţiunea a IV-a - Reţeaua de localităţi

Revista Română de Statistică - Supliment nr. 9 / 2017 83
GIS MATHEMATIC MODEL ANALYZING THE ATTRACTIVENESS OF THE ROMANIAN
SETTLEMENTS NETWORK, ASSESSING THE COMPETITIVENESS FACTORS AT
NATIONAL LEVEL Main researcher 3 Antonio TACHE ([email protected])
”URBAN-INCERC” National Institute for Research and Development in Constructions, Town
Planning and Sustainable Territorial Development
Main researcher 3 Oana-Cătălina Popescu ([email protected])
”URBAN-INCERC” National Institute for Research and Development in Constructions, Town
Planning and Sustainable Territorial Development
Main researcher Monica Tache ([email protected])
”URBAN-INCERC” National Institute for Research and Development in Constructions, Town
Planning and Sustainable Territorial Development
Abstract
The planning activity is essential for territorial development. Cities have a catalytic effect on economic development and on the establishment of functional local networks. The article aims to present the assessment of the economic potential of Romanian localities – for development, stability or decline – by identifying the factors causing such trends. The method used is an innovative one. Thus, for each analysed indicator at locality level, a grouping of values was achieved on 10 intervals, in accordance with the standard scheme for classifi cation on natural breaks (Jencks),
obtaining thus 10 groups and for which scores from 1 to 10 have been assessed, in
ascending order of values. For each studied domain and each locality, an index
was calculated as the average of all scores, weighted by importance coeffi cients.
Similarly, a fi nal attractiveness index at locality level was obtained, as an average
of corresponding indexes for all studied domains weighted by their coeffi cients of
importance. Specifi c indexes calculated for each domain and the fi nal attractiveness
index for all localities were translated into thematic GIS maps, by using ARCGIS
10.2.2. and its statistical support. The article was developed based on studies of the
project PN 16.10.07.01 - Phase-III: “Analysing the attractiveness of urban and rural
localities network as competitive, dynamic and innovative entities, in order to connect
to the European network of development poles and corridors” and project 63PED /
2017 - “Innovative model for the territorial planning of a polycentric and balanced
settlements network in the context of smart specialization of Romania’s cities.”
Keywords: attractiveness; index; mathematical model; domain;
maps; LAU2.
JEL: C22, R11, R12, R23, R42, R58

Romanian Statistical Review - Supplement nr. 9 / 201784
Introduction Identifying the factors determining regional competitiveness is a
current approach of the European Union when dealing with the spatial planning
fi eld. European policies addressing territorial development issues emphasize
the connection between concepts like “polycentric development” and “regional
competitiveness”, “cohesion” and “competitiveness”, in order to support
the territorial development. Challenges related to competitive metropolitan
development have become the subject of extensive academic discussions
related to governance (Parkinson, 1997 and 2003; Begg, 1999; Ottgaar et al.,
2008; Salet et al., 2003; Healy, 1997). At the same time, the challenges of
an intra-urban development already awarded attention in the political debate
within the URBAN initiative in the fi rst and second programming period at
European level. Based on the Lisbon Agenda 2000, the political debate was
focused for several years mainly on competitiveness. Since 2008, the Green
Paper on Territorial Cohesion highlighted three aspects of territorial cohesion:
- Concentration and specialization of urban and rural areas - peripheral
regions are strengthening regional functional relations;
- Connection by different infrastructures: equipment, ICT (information
and communications technology), networks in the knowledge-based economy
and research;
- Cooperation at different levels, by a multi-level horizontal and
vertical governance.
For several years, the political discussion was moved towards issues
related to social and territorial cohesion in order to face the problematic
and divergent processes, at least at inter-regional level. Referring to the EU
cohesion policy, the Green Paper on Territorial Cohesion is focusing on smart,
sustainable and inclusive growth. This initiative is based on the following
premises:
- Metropolis have a decisive importance for Europe’s competitiveness.
- The connectivity - between highly developed localities, the
specialized ones and the metropolitan areas having a good accessibility - is
crucial.
- The networks at different geographic scales are linking global
markets.
- A good governance and territorial cooperation are vital for the
implementation of economic and social cohesion (ESPON 2010).
In terms of territorial development, inclusive growth should be based
on urban and regional competitiveness but at the same time, it is considered
“... not only economic and social cohesion but also territorial cohesion.”
(ESPON, 2010). Cities are the engines of regional economy and can be

Revista Română de Statistică - Supliment nr. 9 / 2017 85
considered to be a catalyst for creativity and innovation today. Nevertheless,
a number of acute problems – such as unemployment and poverty – it occurs
here. The various economic/social/cultural/environmental aspects of urban
life are closely interlinked and a successful policy in the fi eld of sustainable
urban development requires an integrated approach. This approach is of great
importance nowadays, given the seriousness of the problems facing our cities
(demographic change, the consequences of economic stagnation, the impact of
climate change). However, the actual territorial development of the European
Union in economic terms can be characterized as a process of metropolisation
of the potential zones of economic development that have innovation capacity
(Krátke, 2007). The new urban policy will be differently organized through
more active involvement of the population, changing the governance of
metropolitan areas (Andersen, 2003). Thus, local governance in metropolitan
areas will be strongly infl uenced and shaped by the relationship with the
civil society (Feiock, 2004). Metropolisation is a process of attracting new
specifi c activities, jobs and people, relying predominantly on competitiveness.
This means that attracting specifi c metropolitan functions and activities is
based on certain assets of cities, usually the strongest, and on their potential,
offering specifi c benefi ts depending on the area. In this context, metropolitan
governance is crucial in terms of territorial development by strengthening
competitiveness and attracting new functional specializations. The specifi c
literature treats the big cities metropolitanisation process in accordance with
polycentricism studies. Policentricity is currently considered to be a useful tool
for spatial planning in order to increase economic competitiveness of cities,
social cohesion and environmental sustainability (Davoudi, 2003). A new
concept for maximizing the development of metropolitan areas is the “smart
specialization” which is an important tool in achieving alternative sustainable
development strategies based on research, development and innovation.
In order to achieve the economic development of metropolitan areas,
the presence of sustainable development visions and strategies is a must.
Initiated by the Government Decision no. 998/2008, the policy focusing on
the Romanian growth poles aimed a rapid economic growth by creating jobs
and boosting productivity capable to accelerate the development in small
and medium towns, as well as in rural areas adjacent to growth poles. To
contribute to the economy of the entire region of infl uence, several categories
of urban centres have been defi ned: 7 growth poles (one for each development
region, excepting the Bucharest-Ilfov region) and 13 centres of urban
development having regional importance. According to Law. no. 264/2011,
for a balanced territorial development around the main urban agglomerations
– the capital, the municipalities of the fi rst rank or the county residences – the
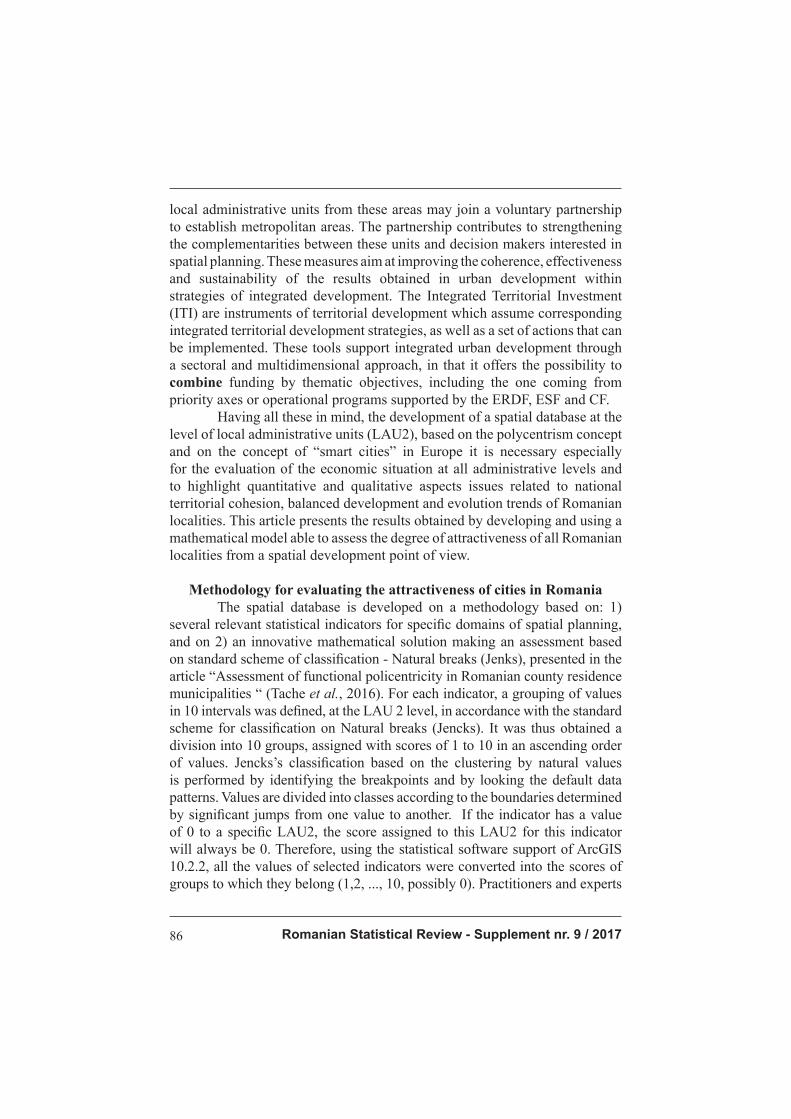
Romanian Statistical Review - Supplement nr. 9 / 201786
local administrative units from these areas may join a voluntary partnership
to establish metropolitan areas. The partnership contributes to strengthening
the complementarities between these units and decision makers interested in
spatial planning. These measures aim at improving the coherence, effectiveness
and sustainability of the results obtained in urban development within
strategies of integrated development. The Integrated Territorial Investment
(ITI) are instruments of territorial development which assume corresponding
integrated territorial development strategies, as well as a set of actions that can
be implemented. These tools support integrated urban development through
a sectoral and multidimensional approach, in that it offers the possibility to
combine funding by thematic objectives, including the one coming from
priority axes or operational programs supported by the ERDF, ESF and CF.
Having all these in mind, the development of a spatial database at the
level of local administrative units (LAU2), based on the polycentrism concept
and on the concept of “smart cities” in Europe it is necessary especially
for the evaluation of the economic situation at all administrative levels and
to highlight quantitative and qualitative aspects issues related to national
territorial cohesion, balanced development and evolution trends of Romanian
localities. This article presents the results obtained by developing and using a
mathematical model able to assess the degree of attractiveness of all Romanian
localities from a spatial development point of view.
Methodology for evaluating the attractiveness of cities in Romania The spatial database is developed on a methodology based on: 1)
several relevant statistical indicators for specifi c domains of spatial planning,
and on 2) an innovative mathematical solution making an assessment based
on standard scheme of classifi cation - Natural breaks (Jenks), presented in the
article “Assessment of functional policentricity in Romanian county residence
municipalities “ (Tache et al., 2016). For each indicator, a grouping of values
in 10 intervals was defi ned, at the LAU 2 level, in accordance with the standard
scheme for classifi cation on Natural breaks (Jencks). It was thus obtained a
division into 10 groups, assigned with scores of 1 to 10 in an ascending order
of values. Jencks’s classifi cation based on the clustering by natural values
is performed by identifying the breakpoints and by looking the default data
patterns. Values are divided into classes according to the boundaries determined
by signifi cant jumps from one value to another. If the indicator has a value
of 0 to a specifi c LAU2, the score assigned to this LAU2 for this indicator
will always be 0. Therefore, using the statistical software support of ArcGIS
10.2.2, all the values of selected indicators were converted into the scores of
groups to which they belong (1,2, ..., 10, possibly 0). Practitioners and experts

Revista Română de Statistică - Supliment nr. 9 / 2017 87
in local spatial development have determined the coeffi cients of importance
(weights) for all indicators. For each domain and each administrative unit, a
corresponding index was calculated, as the average of scores weighted by the
coeffi cients of importance. Similarly, coeffi cients of importance (weights) have
been given for each domain relevant for the spatial planning activity, and the
attractiveness index was calculated at LAU 2 level, as the average of indexes
corresponding to these domains, weighted by coeffi cients of importance.
Thus, for the analysis (at LAU 2 level), the following statistical
indicators were analysed, in the following chapters:
Chapter: POPULATION - Number of population (2015);
- Natural growth (2015);
- Migration growth rate (2015);
- Population evolution 2015/2011;
- Population evolution 2011/2008.
The sociologists from URBAN-INCERC identifi ed 5 signifi cant
indicators in order to evaluate the Population chapter. The values of several
indicators were computed and transformed in fi gures from 1 to 10, according
to the Jenks Natural breaks classifi cation standard. In order to calculate a fi nal
index for the Population chapter, the experts working in the fi eld of spatial
planning established weights for each indicator. A fi nal index resulted for
each local administrative unit: the lowest value (1,1) belongs to the Intregalde
commune (Aba county) and the higher value (7,4) to the Iasi municipality.
Chapter: TRANSPORT
- Accessibility to National/European Roads/Highways;
- Accessibility to railway stations;
- Accessibility to airports;
- Accessibility to ports.
In a similar manner, the institute’s experts and spatial planners working
in the fi eld of Transport have identifi ed 4 indicators and then calculated a fi nal
index for each local administrative unit. According to this ranking, the lowest
value of the index is 0 for a number of 991 localities and the highest value is
8.6 for the Constanta municipality.
Chapter: ECONOMY - Number of employees (2015);
- The evolution of the number of employees 2015/2011;
- Ratio of the number of employees and the population (2015);
- The number of tourist overnight stays in each LAU2 (2015).
For the Economy chapter, few indicators were used, due to the
lack of this kind of data for each local administrative unit. According to the

Romanian Statistical Review - Supplement nr. 9 / 201788
methodology, the experts of the institute assigned weights for each indicator
and calculated a fi nal index for the economy chapter. Thus, the lowest resulted
value was 0.8 for a number of 64 localities and the higher value was of 8.2 for
Bucharest municipality.
Chapter: TECHNICAL INFRASTRUCTURE - Length of modernized streets relative to total length of streets (2015);
- Water distributed for domestic use (2015);
- Gas distributed for domestic use (2015);
- Length of the sewage system (2015);
- Number of new dwellings reported to the total number of dwellings
(2015).
The experts working with technical infrastructures have identifi ed 5
relevant indicators and calculated a fi nal index according to the methodology.
A number of 368 localities obtained the value 0, which represents a major
problem for Romania. The highest calculated value was 9,5 for the town
Popesti-Leordeni.
Chapter: NATURAL CONDITIONS - LAU 2 area - 2015;
- Forest area (2015);
- The presence of national and natural parks (2015);
- The presence of Biosphere Natural Reserve in the LAU 2 (2015);
- The presence of Ramsar sites in the LAU 2 (2015);
- The presence of SCI or SPA at LAU 2 (2015).
A number of 6 indicators were selected by the experts of the institute,
in order to evaluate the chapter referring to natural conditions. According to
the methodology and to the selected weights, a fi nal index was calculated for
each local administrative unit. The lowest values was 0,5 (for 167 units) and
the highest was 5,38 (in Pades commune and in Borsa town).
Chapter: SOCIAL - Number of Kindergartens (2015);
- Number of schools (2015);
- Number of secondary schools (2015);
- Number of universities (2015);
- Number of students (2015);
- Number of students reported to the size of population (2015);
- Number of hospital beds (2015);
- Number of hospital beds relative to the size of the population (2015);
- Number of local clinics (2015);
- Number of hospitals (2015);
- Number of doctors (2015);

Revista Română de Statistică - Supliment nr. 9 / 2017 89
- Number of doctors reported to the size of population (2015);
- Number of medical staff (2015);
- Number of medical staff reported to the size of the population
(2015).
At this chapter, very conclusive results were obtained, due to the high
number of indicators that were identifi ed. Using the methodology and the
weights, the fi nal index for the Social chapter was obtained by the specialists
of the institute. The values ranked from 0 (in 5 localities) to 7.85 (in Bucharest
municipality and in Cluj-Napoca city).
Chapter: CULTURE - Number of spectators (2015);
- Number of spectators in 2015 relative to the number of spectators in
2008;
- Number of spectators reported to the size of the population in 2015;
- Number of museum visitors (2015);
- Number of museum visitors in 2015 reported the number of museum
visitors in 2008;
- Number of museum visitors reported the size of the population in
2015.
For this chapter, according to the data delivered by the Romanian
National Statistical Institute, a number of 2786 localities obtained the value 0
for the fi nal index, Bucharest municipality and Sibiu city obtaining the highest
value (8).
Results and analysis 3.1. Chapter POPULATION. Analysis
In order to make analyses at the Chapter Population, the sociologists
chose the following weights for the corresponding indicators: Number
of population (2015) - 40%, Natural growth of population (2015) - 15%,
Migratory growth (2015 – 2011) – 15%, Evolution of population (2015 –
2011) - 20%, Evolution of population (2011 – 2008) - 10%. By using the
ARCGIS 10.2.2. Software capabilities and the Jencks’s classifi cation based
on a natural grouping of the indicators’ values, the following cartogram was
obtained (Fig. 1):
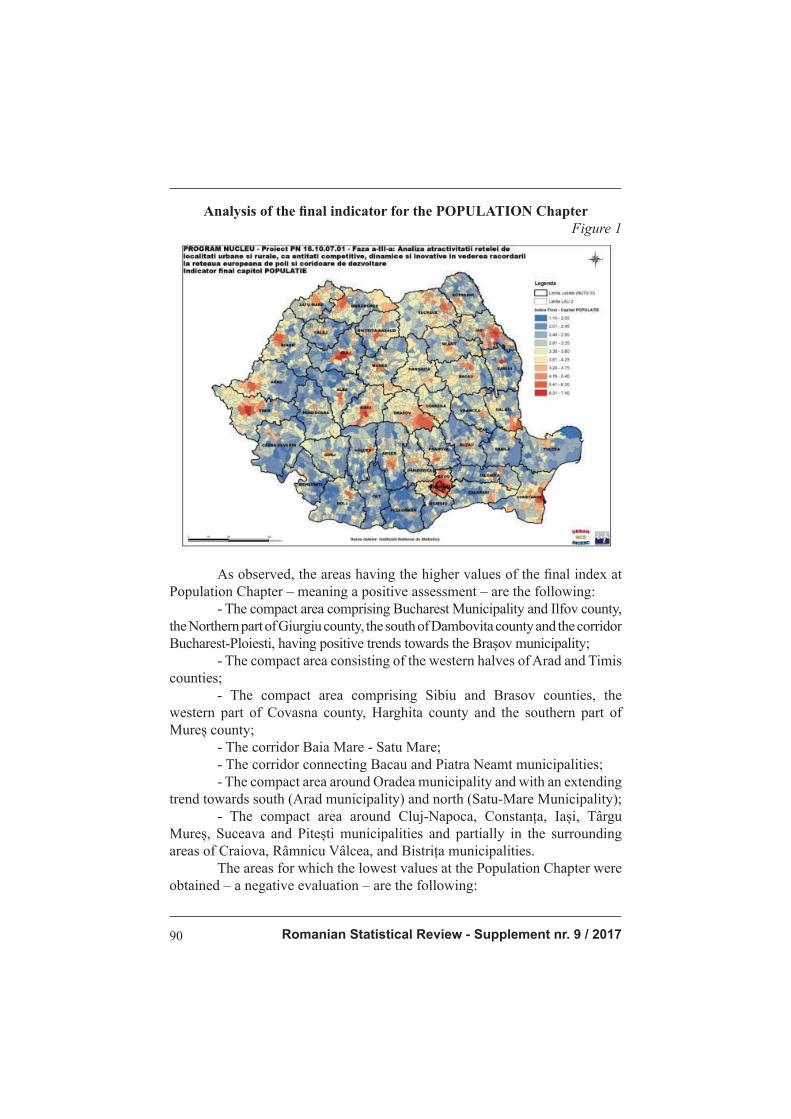
Romanian Statistical Review - Supplement nr. 9 / 201790
Analysis of the fi nal indicator for the POPULATION ChapterFigure 1
As observed, the areas having the higher values of the fi nal index at
Population Chapter – meaning a positive assessment – are the following:
- The compact area comprising Bucharest Municipality and Ilfov county,
the Northern part of Giurgiu county, the south of Dambovita county and the corridor
Bucharest-Ploiesti, having positive trends towards the Brașov municipality;
- The compact area consisting of the western halves of Arad and Timis
counties;
- The compact area comprising Sibiu and Brasov counties, the
western part of Covasna county, Harghita county and the southern part of
Mureș county;
- The corridor Baia Mare - Satu Mare;
- The corridor connecting Bacau and Piatra Neamt municipalities;
- The compact area around Oradea municipality and with an extending
trend towards south (Arad municipality) and north (Satu-Mare Municipality);
- The compact area around Cluj-Napoca, Constanța, Iași, Târgu Mureș, Suceava and Pitești municipalities and partially in the surrounding areas of Craiova, Râmnicu Vâlcea, and Bistrița municipalities. The areas for which the lowest values at the Population Chapter were obtained – a negative evaluation – are the following:
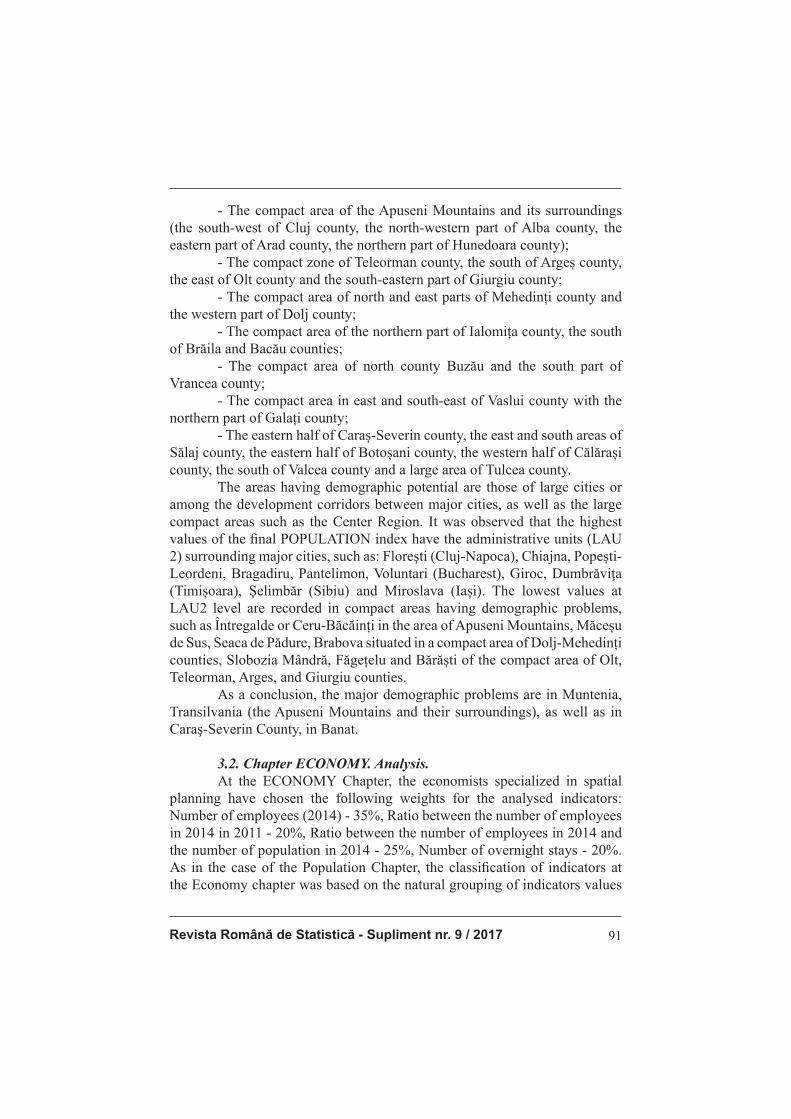
Revista Română de Statistică - Supliment nr. 9 / 2017 91
- The compact area of the Apuseni Mountains and its surroundings
(the south-west of Cluj county, the north-western part of Alba county, the
eastern part of Arad county, the northern part of Hunedoara county);
- The compact zone of Teleorman county, the south of Argeș county, the east of Olt county and the south-eastern part of Giurgiu county; - The compact area of north and east parts of Mehedinți county and the western part of Dolj county; - The compact area of the northern part of Ialomița county, the south of Brăila and Bacău counties;
- The compact area of north county Buzău and the south part of
Vrancea county;
- The compact area in east and south-east of Vaslui county with the
northern part of Galați county; - The eastern half of Caraș-Severin county, the east and south areas of Sălaj county, the eastern half of Botoșani county, the western half of Călărași county, the south of Valcea county and a large area of Tulcea county. The areas having demographic potential are those of large cities or among the development corridors between major cities, as well as the large compact areas such as the Center Region. It was observed that the highest values of the fi nal POPULATION index have the administrative units (LAU
2) surrounding major cities, such as: Floreşti (Cluj-Napoca), Chiajna, Popești-Leordeni, Bragadiru, Pantelimon, Voluntari (Bucharest), Giroc, Dumbrăviţa (Timișoara), Şelimbăr (Sibiu) and Miroslava (Iași). The lowest values at LAU2 level are recorded in compact areas having demographic problems, such as Întregalde or Ceru-Băcăinți in the area of Apuseni Mountains, Măceșu de Sus, Seaca de Pădure, Brabova situated in a compact area of Dolj-Mehedinți counties, Slobozia Mândră, Făgețelu and Bărăști of the compact area of Olt, Teleorman, Arges, and Giurgiu counties. As a conclusion, the major demographic problems are in Muntenia, Transilvania (the Apuseni Mountains and their surroundings), as well as in Caraş-Severin County, in Banat.
3.2. Chapter ECONOMY. Analysis.
At the ECONOMY Chapter, the economists specialized in spatial planning have chosen the following weights for the analysed indicators: Number of employees (2014) - 35%, Ratio between the number of employees in 2014 in 2011 - 20%, Ratio between the number of employees in 2014 and the number of population in 2014 - 25%, Number of overnight stays - 20%. As in the case of the Population Chapter, the classifi cation of indicators at
the Economy chapter was based on the natural grouping of indicators values
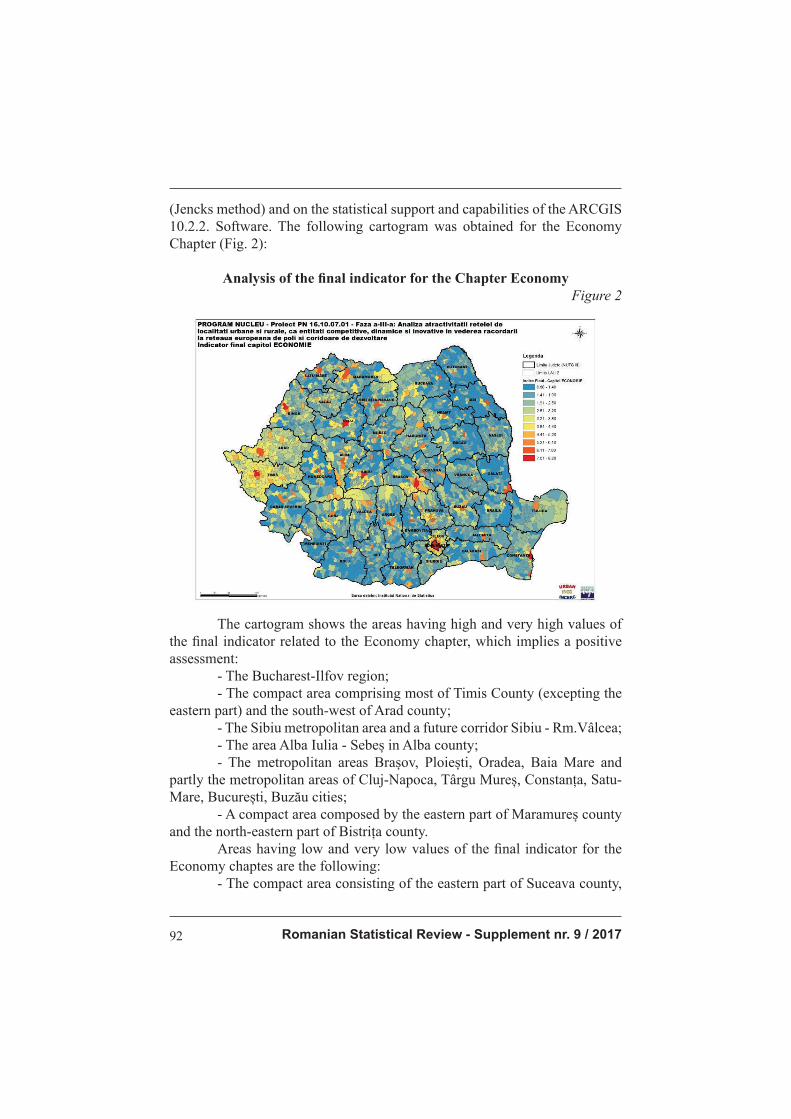
Romanian Statistical Review - Supplement nr. 9 / 201792
(Jencks method) and on the statistical support and capabilities of the ARCGIS
10.2.2. Software. The following cartogram was obtained for the Economy
Chapter (Fig. 2):
Analysis of the fi nal indicator for the Chapter Economy Figure 2
The cartogram shows the areas having high and very high values of
the fi nal indicator related to the Economy chapter, which implies a positive
assessment:
- The Bucharest-Ilfov region;
- The compact area comprising most of Timis County (excepting the
eastern part) and the south-west of Arad county;
- The Sibiu metropolitan area and a future corridor Sibiu - Rm.Vâlcea;
- The area Alba Iulia - Sebeș in Alba county;
- The metropolitan areas Brașov, Ploiești, Oradea, Baia Mare and
partly the metropolitan areas of Cluj-Napoca, Târgu Mureș, Constanța, Satu-Mare, București, Buzău cities; - A compact area composed by the eastern part of Maramureș county and the north-eastern part of Bistrița county. Areas having low and very low values of the fi nal indicator for the
Economy chaptes are the following:
- The compact area consisting of the eastern part of Suceava county,

Revista Română de Statistică - Supliment nr. 9 / 2017 93
Botoșani county, Iași county, the eastern part of Bacău and Neamț counties,
Vaslui county and most of Galaţi county (excepting the southern part);
- The compact area consisting of Mehedinți, Dolj and Olt counties,
the southern part of Vâlcea, Gorj and Argeș counties, most of the Dambovița
county;
- The compact area comprising Ialomița, Călărași, Brăila and Tulcea
counties and a part of the Constanța county;
- The northern part of Buzău county and the southern party of Vrancea
county;
- A Compact area from the northern part of Cluj county, the eastern
part of Bistrița-Năsăud county, the southern part of Maramureș county;
- Compact areas from Caraș Severin, Hunedoara, Cluj, Sălaj, Satu
Mare, Sibiu, Mureș, Covasna and Harghita counties.
As a conclusion, there are two compact areas having high values of
the fi nal indicator at the Economy chapter: the Bucharest-Ilfov region and
the compact area of Timis and Arad counties. Otherwise there are several
metropolitan areas with a high level of fi nal Economy index, around large
cities, especially in Transylvania. It is observed a trend for the development
of several corridors such as Bucharest – Ploiești - Brașov, Alba Iulia – Sibiu
- Pitești, Oradea – Arad - Timișoara, Baia Mare - Satu Mare, Bacău - Piatra
Neamț.
Following the situation refl ected by the fi nal index obtained for the
Population Chapter, the localities (LAU 2 level) surrounding important big
cities have also high values of the fi nal index for the Economy Chapter (such
as Otopeni, Ghimbav, Mioveni, Bascov, Cristian, Voluntari, Eforie, Sebeş or
Giroc localities).
3.3. Chapter Transport. Analysis
In order to make analyses for the Transport Chapter, the experts in
mobility issues proposed the following weights for the above-mentioned
indicators: localities having access to an airport - 35%, having a port access
- 15%, localities with access to national/European roads or highways - 25%,
access to railway stations - 25%.
It was thus obtained the following cartogram (Fig. 3):

Romanian Statistical Review - Supplement nr. 9 / 201794
Analysis of the fi nal indicator for Chapter TransportFigure 3
Areas with high and very high accessibility are those having access to
big airports, in which many passengers are transiting, as in the case of localities
situated northern Bucharest, those located in the proximity of Timișoara, Arad city, Cluj-Napoca, Constanța, Târgu Mureș, Iași, Bacău, Craiova, Baia Mare, Satu Mare and Suceava cities. A relatively high accessibility have the corridor Bucharest - Constanța. An average accessibility presents those localities located on the rail European corridor no. 4: Arad – Deva – Sibiu – Brașov – Bucharest - Constanța and Timișoara – Lugoj – Caransebeș - Drobeta Turnu Severin – Craiova – Bucharest - Constanța) and on the rail and road European corridor no. 9: Bucharest – Buzău – Ploiești – Focșani – Roman - Iași and Bucharest – Buzău – Focșani - Huşi). An average accessibility have the corridors Sebeș - Alba Iulia - Cluj Napoca - Oradea, Bucharest – Urziceni – Brăila - Galați and Brasov - Sfântu Gheorghe – Miercurea - Topliţa. The map shows that a poor accessibility have the hilly and mountainous areas and those along the European Danube Corridor no. 7, particularly in the south of Romania.
3.4. Chapter Technical Infrastructure. Analysis
To make analyses at the Chapter Technical Infrastructure, the experts gave the following weights for the relevant indicators: Ratio between the

Revista Română de Statistică - Supliment nr. 9 / 2017 95
length of modernized streets and the length of total streets - 20%, the amount
of water distributed for domestic use - 30%, the gas distributed for domestic
use - 10%, the length of the sewerage network - 20% and the ratio of new
housing in 2015 in total housing - 20%.
This indicator is particularly relevant for Romanian cities, identifying the areas
with large defi ciencies in terms of endowments. The following cartogram was
obtained (Fig. 4):
Analysis of the fi nal indicator for the Technical Infrastructure ChapterFigure 4
The areas having high values for fi nal indicator at the Technical
Infrastructure Chapter are found in the Bucharest-Ilfov region and in most
administrative units belonging to Cluj, Timis, Bihor, Arad, Maramures, Sibiu,
Brasov, Harghita, and Prahova counties. Among the localities with the highest
value of the fi nal index at this Chapter can be mentioned: Cisnădie (Sibiu), Popeşti-Leordeni (Ilfov), Ştefăneşti (Argeş), Râşnov (Braşov), Tălmaciu
(Sibiu) or Ghimbav (Braşov).
Conversely, the fi nal indicator at this chapter is low and very low
in many localities belonging to Mehedinți, Dolj, Olt, Teleorman, Giurgiu,
Botoșani, Suceava, Iași and Vaslui counties.
In Romania there are still 368 local administrative units (LAU 2)
having no a value of fi nal index zero, indicating that they have not even
drinking water supply, most of them beilng located in Teleorman, Dolj, Vaslui
and Mehedinți counties.

Romanian Statistical Review - Supplement nr. 9 / 201796
3.5. Chapter Natural Conditions. Analysis
For the Chapter Natural Conditions, geographers specialized in
physical geography have established the following percentages for the studied
indicators: The area of the administrative unit (2015) - 30%; The forest area
(2015) - 20%; The presence of national/or natural parks (2015) in the locality
- 15%; The presence of a biosphere (2015) - 15%; The presence of a Ramsar
area (2015) - 12%; The presence of SCI or SPA (2015) - 8%. The resulted
cartogram is presented below (Fig. 5):
Analysis of the fi nal indicator for the Natural Conditions ChapterFigure 5
The fi nal indicator for Natural Conditions refl ects the presence of
protected natural areas especially in the Carpathian Mountains and in the
Danube Delta, in those counties located in the centre of the country.
The counties characterized by a low value of the fi nal indicator can be
found in the Southern part of the country – such as Olt and Teleorman counties
– and in several eastern counties - especially Botoșani County. To maximize
the tourism potential of the Danube represents a consequence of this situation,
especially under the European Strategy for the Danube.

Revista Română de Statistică - Supliment nr. 9 / 2017 97
3.6. Chapter SOCIAL. Analysis
For the Social Chapter, experts in sociology and economic geography
explored a signifi cant number of statistical indicators which have been granted
the following shares: The number of kindergartens (2015) - 4%, The number of
schools (2015) - 4%, The number of secondary schools (2015) - 5%; The number
of universities (2015) - 8%; The number of students (2015) - 8%; The number
of students reported to the size of the population (2015) - 10%, The number of
hospital beds (2015) - 8%, The number of hospital beds relative to the size of the
population (2015) - 11%, The number of local clinics (2015) - 4%, The number of
hospitals (2015) - 5%; The number of doctors (2015) - 8%; The number of doctors
relative to the size of population (2015) - 10%, The number of medical staff (2015)
- 6%, The number of medical staff reported to the size of the population (2015) -
8%. Based on these weights, obtain the following cartogram (Fig. 6):
Analysis of the fi nal indicator for the Social ChapterFigure 6
As expected, the values of the fi nal index for the Social Chapter are
high and very high in cities. Among counties with major problems in the
social endowment, can be mentioned Tulcea county, followed by the counties
of Bacău, Botoșani, Covasna, Mehedinți and Brăila. Additionally, there are fi ve communes having the fi nal index 0 at this chapter: Ciocârlia in Ialomița county, Bunila and Bătrâna in Hunedoara
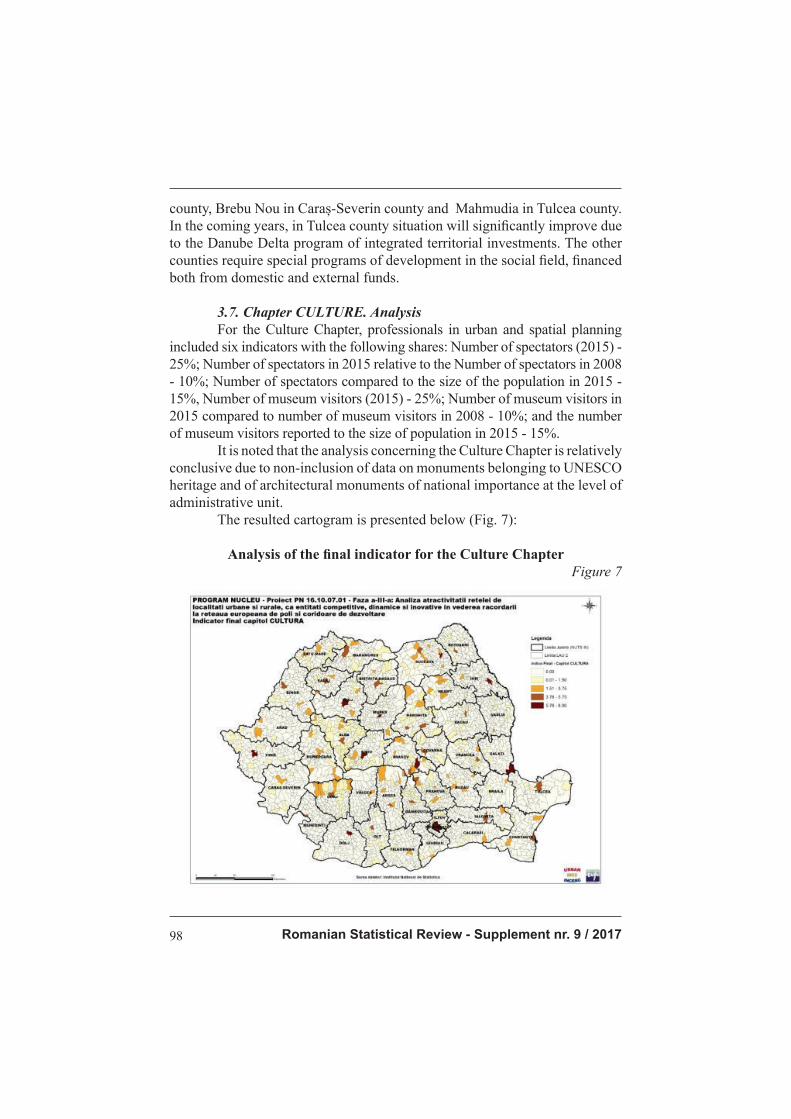
Romanian Statistical Review - Supplement nr. 9 / 201798
county, Brebu Nou in Caraș-Severin county and Mahmudia in Tulcea county. In the coming years, in Tulcea county situation will signifi cantly improve due to the Danube Delta program of integrated territorial investments. The other counties require special programs of development in the social fi eld, fi nanced both from domestic and external funds.
3.7. Chapter CULTURE. Analysis
For the Culture Chapter, professionals in urban and spatial planning included six indicators with the following shares: Number of spectators (2015) - 25%; Number of spectators in 2015 relative to the Number of spectators in 2008 - 10%; Number of spectators compared to the size of the population in 2015 - 15%, Number of museum visitors (2015) - 25%; Number of museum visitors in 2015 compared to number of museum visitors in 2008 - 10%; and the number of museum visitors reported to the size of population in 2015 - 15%. It is noted that the analysis concerning the Culture Chapter is relatively conclusive due to non-inclusion of data on monuments belonging to UNESCO heritage and of architectural monuments of national importance at the level of administrative unit. The resulted cartogram is presented below (Fig. 7):
Analysis of the fi nal indicator for the Culture ChapterFigure 7

Revista Română de Statistică - Supliment nr. 9 / 2017 99
The map shows that cultural phenomenon is generated in particular
by big cities, but also by medium and small towns having ancient cultural
traditions. High scores have also the communes that are managing within
their territory museums or historical monuments of national importance, such
as Bran (Brașov county), Sucevița (Suceava county), Dâmbovicioara (Argeș county) and Sarmizegetusa (Hunedoara county).
3.8. The fi nal index at LAU 2 level
The fi nal index at LAU2 level was calculated by weighting the values of all indicators previous calculated for all domains. The spatial planning experts have established the following weights: the index for the Population Chapter - 17%, the index for the Transport Chapter - 17%, the index for the Economy Chapter - 28%, the index for the Natural Conditions - 10%, the index for the Utilities Chapter - 10%, the index for the Social Chapter - 10%, the index for the Culture Chapter - 8%. On the basis of the weighted indices, the map of the fi nal index of development in Romania resulted, at LAU 2 level. The fi nal value of development index was grouped into 10 intervals, according to the Jencks standard classifi cation scheme on Natural breaks. For all the 10 resulted groups, scores from 1 to 10 have been assigned and the following fi nal map (the attractiveness map) was obtained using the ARCGIS 10.2.2. Software (Fig. 8).
Final attractiveness Index at LAU2 level in RomaniaFigure 8

Romanian Statistical Review - Supplement nr. 9 / 2017100
This map, showing the attractiveness of Romania’s localities, identifi es
the most important development areas as being mostly in Transylvania and in
Bucharest-Ilfov region.
- The Bucharest-Ilfov region has positive infl uences on adjacent
localities, and in the next years is possible to determine the creation of a
development axis Bucharest-Ploiești.
- The metropolitan areas of Timisoara and Arad municipalities can be
seen as an urban development system, positively infl uencing the western half
of the Timiș county and the western part of the Arad county.
- There is also a big potential of development in the Oradea metropolitan
area that may determine a relatively attractive area on the Oradea-Arad axe.
- Metropolitan areas around Baia Mare and Satu Mare municipalities are
relatively attractive areas with potential for a future corridor Satu Mare - Baia Mare.
- There is already an attractive corridor Alba Iulia - Sebeș - Sibiu
with high development potential. The Sibiu metropolitan area was pretty good
outlined, having a trend for development in the south of the county.
- Brasov metropolitan area was also highlighted as an attractive
area, as a corridor of development especially on the axis Brașov – Ploiești -
Bucharest.
- The Cluj-Napoca metropolitan area is a relatively attractive area,
even if it has a high potential of development.
- The Constanța metropolitan area is also a relatively attractive area
but with high potential of development on the axis Constanța - Bucharest.
Relatively attractive metropolitan areas, but with high development
potential are found around the municipalities of Târgu Mureș, Pitești, Bacău,
Craiova, Iași.
Axis with development potential, but still unexploited are those
located between the municipalities of Galați and Brăila and between the
municipalities of Bacău and Piatra Neamț.
Relatively attractive areas can be considered those located in the
northern of Vâlcea and Gorj counties or those located in the northern part of
Bistrița Năsăud county and the eastern part of Maramureș county. Less attractiveness areas are found in several counties from the southern or eastern part of Romania, namely Mehedinți, Dolj, Olt, Teleorman, Giurgiu, Călărași, Ialomița, Brăila, Botoșani. Vaslui counties, but also in localities from Iași, Vrancea, Buzău, Caraș-Severin, Hunedoara, Bistrița-Năsăud, Bacău, and Neamț counties and in the southern part of Vâlcea, Gorj and Argeș counties. As a conclusion, a big number of localities that were considerate “attractive” have high or relatively high indices calculated for each domain, while the areas with low attractiveness have low or relatively low values of computed indices.

Revista Română de Statistică - Supliment nr. 9 / 2017 101
Conclusions The study was intended to assess the potential of Romanian localities
for economic development, stability or decline, as well as to identify the factors
determining such trends, on the basis of statistical indicators in evolution and
of a GIS system as statistical support.
By comparing the analyses achieved in this research (establishing the
fi nal indexes on specifi c domains involved in territorial planning, as well as the
fi nal attractiveness index for Romanian localities) with the analyses achieved 10
years ago within the study “Geo-spatial systems for sustainable development in
Romania” (in which territorial analyses at NUTS V level have been made using
the ELECTRE method of evaluation), the following conclusions were drawn:
- In terms of the demographic potential, the analysis shows the same
strengths and weaknesses as 10 years ago;
- In terms of economic development, it is observing the increasing
of disparities between the areas with development potential and the
underdeveloped areas. In this context there is a pronounced development
around big cities having development potential (Bucharest, Timișoara, Arad,
Cluj, Oradea, Sibiu, Brașov cities) and, partly, in areas around the cities of
Constanța, Târgu Mureș, Alba Iulia, Iași, Baia Mare, Satu Mare, Craiova. This
gap which has widened over the last 10 years is due to foreign investments
which were mainly concentrated in Transylvania and Bucharest, as well as to
the absorption of EU funds in particular in these areas.
- The absorption of European funds especially in the developed areas
is also relevant for the utilities Chapter, for which the difference between
these analyses and those achieved 10 years ago demonstrate a consistent
rehabilitation in the areas with development potential, while in poor areas the
infrastructure was rehabilitated in a slow rhythm.
- The identifi cation of strengths according to intelligent strategies
and the state involvement in the reindustrialization of poor regions is the
only solution to achieve one of the goals of the European Union, namely the
territorial cohesion.
- A better spatial planning help increasing the number of investors and
supporting improvements in the fi eld of urban development.
- A long- or medium- term Integrated Metropolitan Strategy can
ensure a balanced territorial development.
References 1. Andersen, H. T., Van Kempen, R. (2003), New trends in urban policies in
Europe: evidence from the Netherlands and Denmark. Cities, 20(2), 77-86.
2. Begg, I. (1999), Cities and Competitiveness, in Urban Studies, Vol. 36, Nos 5-6,
pp. 795-810

Romanian Statistical Review - Supplement nr. 9 / 2017102
3. Davoudi S. (2003), “Polycentricity in European Spatial Planning: From an Analytical Tool to a Normative Agenda”, European Planning Studies, Vol. 11, No.
8, 979-999
4. Feiock, R. C. (2009), Metropolitan governance and institutional collective action. Urban Affairs Review, 44(3), 356-377.
5. Healey P. (1997), Collaborative Planning: Shaping Places in Fragmented Societies. London, Basingstoke: Macmillan
6. Krätke S. (2007), “Metropolisation of the European economic territory as a consequence of increasing specialisation of urban agglomerations in the knowledge economy.” European Planning Studies 15.1 (2007): 1-27
7. National Institute of Statistics, 2017, Tempo Online 8. Otgaar A. Et al. (2008), Empowering Metropolitan Regions through New Forms
of Cooperation. Hampshire: Ashgate Pub.Lim. 9. Parkinson, M. (1997), The rise of the European entrepreneurial city. In: Financing
of cities and regions: subsidiarity and fi nance potentials, East-West Conference,
Munich, October 1996. (Conference proceedings, pp.125-136).
10. Parkinson, M. et al. (2003), Competitive European Cities: Where Do The Core
Cities Stand?.
11. Salet W. Et al. (2003), Metropolitan governance and spatial planning. London:
Spon Press.
12. Tache A. et al., 2010, Sisteme geospaţiale pentru dezvoltarea durabilă a României, Ed. Ars Docendi, ISBN 978-973-558-492-4, Bucureşti
13. Commission of the European Communities, 2008, Green Paper on Territorial
Cohesion Turning territorial diversity into strength, Brussels, 6.10.2008
14. Commission of the European Communities (1999), European Spatial
Development Perspective: Towards Balanced and Sustainable Development of
the Territory of the E.U., Luxembourg: Offi ce for Offi cial Publications of the
European Communities, accessed in
15. http://ec.europa.eu/regional_policy/sources/docoffi c/offi cial/reports/pdf/sum_
en.pdf
16. Commission of the European Communities (2011), Territorial Agenda 2020 -
Towards an Inclusive,
17. Smart and Sustainable Europe of Diverse Regions, the Informal Ministerial
Meeting of Ministers
18. responsible for Spatial Planning, 2011, Gödöllő, Hungary
19. Commission of the European Commission (2010), EUROPE 2020. A European
strategy for smart, sustainable and inclusive growth, Brussels.
20. ESPON ATTREG (2010): Attractiveness of European Regions and Cities for
Residents and Visitors (2010-2012), Draft Interim Report
21. ESPON Coordination Unit (2010), First ESPON 2013 Synthesis Report. New
Evidence on Smart, Sustainable and Inclusive Territories, Luxembourg.
22. Guvernul României, 2008, HG nr. 998/2008 pentru desemnarea polilor
naționali de creștere în care se realizează cu prioritate investiții din programele
cu fi nanțare comunitară și națională
23. Parlamentul României (2011), Legea nr. 264/2011 pentru modifi carea art. 1 alin.
(2) din Legea administraţiei publice locale nr. 215/2001 şi pentru modifi carea
art. 7 alin. (1) din Legea nr. 351/2001 privind aprobarea Planului de amenajare
a teritoriului naţional - Secţiunea a IV-a - Reţeaua de localităţi
Revista Română de Statistică - Supliment nr. 9 / 2017 103
Analiza strategiei României de aliniere la directivele Uniunii Europene în domeniul
mediului
Prof. univ. dr. Constantin ANGHELACHE ([email protected])
Academia de Studii Economice din București / Universitatea „Artifex” din București
Conf. univ. dr. Mădălina-Gabriela ANGHEL ([email protected])
Universitatea „Artifex” din București
Lector univ. dr. Ana CARP ([email protected])
Universitatea „Artifex” din București
Abstract
În acest articol, autorii analizează măsurile din directivele Uniunii Europene în legătură cu domeniul energiei și al mediului precum și strategia de aliniere a României la directivele Uniunii Europene privind controlul mediului. Totodată, autorii analizează și strategia de aliniere a României la directivele europene privind controlul calității apelor ca și în legătură cu managementul general al deșeurilor. În partea fi nală, autorii evidențiază faptul că, activitățile industriale și celelalte provoacă concomitent și poluarea industrială. Autorii acordă spațiu sufi cient controlului și managementului riscului în acest domeniu. În studiul efectuat se pleacă de la directivele Uniunii Europene privind aspectele mai sus-menționate, evidențiind atât măsurile pe care le-au luat Uniunea Europeană, nivelul la care acestea se afl ă precum și pașii pe care trebuie să îi întreprindă România în acest domeniu. Desigur, în anul 2007 când s-a realizat accesul României în Uniunea Europeană măsurile Uniunii Europene au fost considerate și în consecință s-a stabilit un grafi c, sau, de fapt, mai multe grafi ce, în care România pas cu pas trebuia să rezolve anumite aspecte astfel încât, treptat, să se alinieze la standardele europene. Sunt prezentate în mod succint măsurile întreprinse, majoritatea dintre ele rezolvate, se menționează unele rămâneri în urmă, și prin referire directă la directivele Uniunii Europene se precizează ce mai are România de făcut pentru a elimina toate rămânerile în urmă astfel încât să se alinieze la standardele europene în ceea ce privește protejarea mediului, evitarea poluării și respectarea în viitor a strategiilor europene în baza cărora România trebuie să își stabilească propria strategie. În articol sunt prezentate și date relevante care atestă pașii pe care România i-a întreprins și pe care trebuie să îi mai întreprindă, pentru a ajunge la standardul solicitat sau impus de calitatea de stat membru al Uniunii Europene. Cuvinte cheie: mediu, calitatea apelor, management, deșeu, poluare
Clasifi carea JEL: Q53, Q56

Romanian Statistical Review - Supplement nr. 9 / 2017104
Introducere Studiul efectuat de autori are la bază o tratare echilibrată a unor aspecte de importanță deosebită în domeniul mediului … În studiul efectuat de autori aceștia se axează pe analiza alinierii României la directivele Uniunii Europene în domeniul energiei și mediului; strategia de aliniere la directivele Uniunii Europene privind controlul calității apelor; aspecte privind managementul general al deșeurilor; combaterea poluării industriale (controlul și managementul riscului). Structurată în patru părți, lucrarea face un studiu gradat al situației economiei românești, evidențiind stadiul și nivelul la care se afl ă țara noastră în ceea ce privește alinierea la standardele europene în domeniile despre care am amintit. În fi ecare din punctele cuprinse în Methodology and data research sunt prezentate elemente concrete ale economiei românești cu privire la mediul și poluarea industrială, concomitent cu referiri la situația pe care trebuie să o înregistrăm ca urmare a eliminării neajunsurilor cu care se confruntă economia României. Din acest punct de vedere sunt prezentate măsuri gradate pe care România le-a întreprins și urmează să le mai întreprindă, pentru ca în urma acestor activități să se asigure eliminarea aspectelor negative date de poluare care afectează mediul înconjurător, date de managementul necorespunzător al deșeurilor și multe alte aspecte care grevează calitatea vieții, determinată de calitatea mediului înconjurător. Autorii prezintă măsurile deja întreprinse și sugerează care mai sunt pașii de urmat pentru ca economia româniei să ajungă într-un stadiu corespunzător, corelat cu cel existent în Uniunea Europeană, cel precizat în directivele Uniunii Europene privind acest domeniu.
Literature review Anghelache (1999-2016) realizează o analiză temeică a evoluției situației și a rezultatelor economico-fi nanciare și sociale înregistrate de România. Anghelache (2010) abordează aspecte referitoare la managementul mediului și al riscului de mediu. Pires, Martinho and Chang (2011) analizează metodele de gestionare a deșeurilor în țările europene, aducând argumente pro și contra instrumentelor de gestionare a deșeurilor utilizate în fi ecare stat membru al Uniunii Europene. Mazzantia and Zobolib (2008) realizează un studiu privind generarea deșeurilor, a incinerării, a reciclării și a dinamicii depozitelor de deșeuri pe baza datelor din panoul UE 25, în scopul evaluării efectelor pentru diverși factori de conducere, făcând referiri la eterogenitatea între țările din vestul și estul UE. Loos, R. și colab. realizează o recunoaștere paneuropeană a apariției poluanților polari organici persistenți în apele freatice din Europa. Lefebvre and Moletta (2006) prezintă necesitatea combinării tratamentului fi zico-chimic / biologic al efl uenților salini industriali, în ceea
Revista Română de Statistică - Supliment nr. 9 / 2017 105
ce privește lanțul global de tratament, în vederea respectării reglementărilor
legislative în vigoare. Beelen, R. și colab. (2009) evaluează diverse metode
pentru a elabora hărți precise și de înaltă rezoluție a poluării aerului în Uniunea Europeană. Anghelache and Anghel (2014) reprezintă o lucrare de referință în domeniul modelării deciziilor economico-fi nanciare. Cavea and
Blomquist (2008) au scopul de a determina dacă Uniunea Europeană și-a mărit importurile de bunuri „murdare” din țările mai sărace, mai puțin democratice, într-o perioadă de standarde de mediu mai stricte. Koutalakis, Buzogany and Börzel (2010) arată că aplicarea unei reglementări „moi”, fără caracter obligatoriu din punct de vedere juridic, poate conduce la nerespectarea și „înlăturarea” sistemelor de autorizații de mediu pentru industrie, pe termen mediu, astfel de evoluții putând submina autoritatea normativă a UE. Monte și colab. (2009) arată necesitatea continuării cercetării privind diferitele aplicații ale deșeurilor, luând în considerare factorii ecologici și economici ai tratamentelor pentru deșeuri. Vehlow et al. (2007) susține că reciclarea și incinerarea reprezintă părți esențiale ale sistemelor integrate de gestionare a deșeurilor, acestea nefi ind în concurență.
Metodologia cercetării, date, rezultate şi discuţii
Alinierea la Directivele Uniunii Europene în domeniul energiei şi
mediului
Prin Directiva 68/414/CEE a Consiliului din 20 decembrie 1968 privind obligaţia statelor membre ale CEE de a menţine stocuri minime de ţiţei şi/sau produse petroliere, modifi cată prin Directiva 98/93/CE a Consiliului din
14.12.1998, se reglementează politica ce trebuie promovată de toate statele
membre ale Uniunii Europene, inclusiv cea a României după aderarea la
1 ianuarie 2007. Cu toate acestea, şi după aderare, ţinând seama de poziţia concretă a României în domeniul energetic, fără a se accepta abateri deosebite de la directive, sunt prevăzute unele derogări pe perioada tranziţiei pentru România. Astfel, prin derogare de la dispoziţiile Directivei 68/414/CEE, nivelul minim al stocurilor de produse petroliere nu s-au aplicat României până la 31 decembrie 2011. În domeniul mediului înconjurător, directivele Uniunii Europene sunt foarte complexe şi obligă ţările membre la eforturi susţinute în vederea alinierii la standardele europene. Accentul este pus pe problema mediului înconjurător din punct de vedere al calităţii aerului, al politicii în domeniul deşeurilor, al calităţii apei, al poluării industriale şi al managementului riscului. Aspectele privind calitatea aerului sunt reglementate prin Directiva 94/63/CE a Parlamentului European şi a Consiliului din 20 decembrie

Romanian Statistical Review - Supplement nr. 9 / 2017106
1994 privind controlul emisiilor de compuşi organici volatili rezultaţi din
depozitarea carburanţilor şi din distribuţia acestora de la terminale la staţiile
de distribuţie a carburanţilor, modifi cată prin Regulamentul nr. 1882/2003 al Parlamentului European şi al Consiliului din 29.09.2003. În perioada de tranziţie, pentru România s-au avizat mai multe derogări. Astfel, prin derogare de la dispoziţiile articolului 3 şi ale Anexei I la Directiva 94/63/CE, cerinţele privind instalaţiile de depozitare existente în cadrul terminalelor nu s-au aplicat pe teritoriul României, respectiv: până la 31 decembrie 2007, unui număr de 115 instalaţii de depozitare din cadrul a 12 terminale şi până la 31 decembrie 2008 unui număr de patru instalaţii de depozitare din cadrul unui singur terminal, care tranzitează o cantitate situată între 25.000 şi 50.000 tone/an; până la 31 decembrie 2007, unui număr de 138 instalaţii de depozitare din cadrul a 13 terminale şi până la 31 decembrie 2009 unui număr de 57 instalaţii de depozitare din cadrul a zece terminale şi până la 31 decembrie 2009 unui număr de 526 instalaţii de depozitare din cadrul a 63 de terminale, care tranzitează o cantitate de cel mult 25.000 tone/an; De asemenea, prin derogare de la dispoziţiile articolului 4 şi ale Anexei II la Directiva 94/63/CE, cerinţele privind încărcarea şi descărcarea cisternelor existente în cadrul terminalelor nu s-au aplicat pe teritoriul României. Astfel, au continuat până la 31 decembrie 2007, unui număr de 36 instalaţii de încărcare-descărcare din cadrul a 12 terminale, care tranzitează o cantitate situată între 25.000 şi 150.000 tone/an, iar până la 31 decembrie 2007, unui număr de 82 instalaţii de încărcare-descărcare din cadrul a 18 terminale, până la 31 decembrie 2008 unui număr de 14 instalaţii de încărcare- din cadrul a 11 terminale şi până la 31 decembrie 2009 unui număr de 114 instalaţii de încărcare-descărcare din cadrul a 58 de terminale, care tranzitează o cantitate de cel mult 25.000 tone/an. Prin derogare de la dispoziţiile articolului 5 din Directiva 94/63/CE, cerinţele privind cisternele existente în cadrul terminalelor nu s-au aplicat pe teritoriul României, respectiv până la 31 decembrie 2007, unui număr de 31 autocisterne; până la 31 decembrie 2008, unui număr suplimentar de 101 autocisterne; până la 31 decembrie 2009, unui număr suplimentar de 432 autocisterne. Prin derogare de la dispoziţiile articolului 6 şi ale Anexei III la Directiva 94/63/CE, cerinţele privind încărcarea rezervoarelor existente în cadrul staţiilor de distribuţie a carburanţilor nu s-au aplicat pe teritoriul României. Astfel, până la 31 decembrie 2007, un număr de 116 staţii de distribuţie a carburanţilor, până la 31 decembrie 2008, un număr suplimentar de 19 staţii şi până la 31 decembrie 2009, un număr suplimentar de 106 staţii,
Revista Română de Statistică - Supliment nr. 9 / 2017 107
care tranzitează o cantitate mai mare de 1.000 m3/an au continuat. Până la 31 decembrie 2007, unui număr de 49 staţii de distribuţie
a carburanţilor, până la 31 decembrie 2008, unui număr suplimentar de 11
staţii şi până la 31 decembrie 2009, unui număr suplimentar de 85 staţii, care
tranzitează o cantitate situată între 500 şi 1.000 m3/an nu li s-au impus restricții,
precum și până la 31 decembrie 2007, unui număr de 23 staţii de distribuţie
a carburanţilor, până la 31 decembrie 2008, unui număr suplimentar de 14
staţii şi până la 31 decembrie 2009, unui număr suplimentar de 188 staţii, care
tranzitează o cantitate situată de cel mult 500 m3/an.
Strategia de aliniere la Directivele Uniunii Europene privind controlul calităţii apelor
Calitatea apei, în general, şi a celei potabile, în special, este tratată
cu multă atenţie de Uniunea Europeană. Când este studiată starea mediului
înconjurător, calitatea aerului şi a apei sunt situate pe un loc determinant.
Din studiul directivelor ce reglementează, la nivel european, calitatea
apei (Directiva 83/13, privind valorile limită şi obiectivele de calitate pentru
evacuările de cadmiu, modifi cată prin Directiva 91/692/1991, precum şi
Directiva 84/156/1984, privind valorile-limită şi obiectivele de calitate pentru
evacuările de hexaclorciclohexan, modifi cată prin Directiva 91/692/1991),
rezultă că România trebuie să facă paşi uriaşi pentru a se alinia acestor cerinţe.
Uniunea Europeană a aprobat pentru România o serie de derogări,
respectiv: valorile limită pentru evacuările de cadmiu şi mercur în ape nu s-au
aplicat pe teritoriul României până la 31 decembrie 2009.
Prin derogare de la Directiva 84/491/CEE a Consiliului din 9 octombrie
1984 privind valorile limită şi obiectivele de calitate pentru evacuările de
lindan în apele prevăzute prin Directiva 76/464/CEE a Consiliului din 4 mai
1976, privind poluarea cauzată de anumite substanţe periculoase evacuate în
mediul acvatic al Comunităţii, nu s-au aplicat pe teritoriul României până la
31 decembrie 2009.
De asemenea, prin derogare, prevederile Directivei 86/280/CEE a
Consiliului din 12 iunie 1986 privind valorile limită şi obiectivele de calitate
pentru evacuările anumitor substanţe periculoase, modifi cată prin Directiva
91/692/CEE a Consiliului din 23.12.1991, nu s-au aplicat pe teritoriul
României până la 31 decembrie 2009.
O altă derogare de la dispoziţiile Directivei 91/271/CEE a Consiliului
din 21 mai 1991 privind tratarea apelor urbane reziduale, modifi cată prin
Regulamentul (CE) nr. 1882/2003 al Parlamentului European şi al Consiliului
din 29.09.2003, cerinţele privind sistemele de colectare şi tratare a apelor
urbane reziduale nu se aplică în întregime pe teritoriul României până la 31

Romanian Statistical Review - Supplement nr. 9 / 2017108
decembrie 2018, prevăzându-se două etape: la 31 decembrie 2013, conformarea cu dispoziţiile articolului 3 din directivă trebuie realizată în aglomerările urbane cu un echivalent-locuitor mai mare de 10.000; la 31 decembrie 2015, conformarea cu dispoziţiile articolului 5 alineatul (2) din directivă trebuie realizată în aglomerările urbane cu un echivalent-locuitor mai mare de 10.000. România a fost obligată să asigure extinderea treptată a sistemelor de colectare în conformitate cu următoarele niveluri minime generale de echivalent locuitori: 61% la 31 decembrie 2010; 69% la 31 decembrie 2013;
80% la 31 decembrie 2015.
România trebuie să realizeze extinderea treptată a tratării apelor reziduale în conformitate cu următoarele niveluri minime generale de echivalent locuitori: 51% la 31 decembrie 2010; 61% la 31 decembrie 2013;
77% la 31 decembrie 2015.
Directiva 98/83/CE a Consiliului din 3 noiembrie 1998, privind
calitatea apei destinate consumului uman, modifi cată prin Regulamentul (CE) parlamentului European şi al Consiliului nr. 1882/2003, prevede măsuri concrete pentru care s-au făcut derogări ţinând seama de difi cultăţile României
de a se alinia rapid la cerinţele directivelor.
Astfel, valorile stabilite pentru următorii parametri nu s-au aplicat (nu
se aplică) în întregime pe teritoriul României, după cum urmează:
• până la 31 decembrie 2010, pentru oxidabilitate în aglomerările
urbane cu mai puţin de 10.000 de locuitori;
• până la 31 decembrie 2010, pentru oxidabilitate şi turbiditate în aglomerările urbane cuprinzând între 10.000 şi 100.000 de locuitori;
• până la 31 decembrie 2010, pentru oxidabilitate, amoniu, pesticide, fi er şi mangan în aglomerările urbane cu peste 100.000 de locuitori;
• până la 31 decembrie 2015, pentru amoniu, nitraţi, turbiditate, aluminiu, fi er, plumb, cadmiu şi pesticide în aglomerările urbane cu mai puţin de 10.000 de locuitori;
• până la 31 decembrie 2015, pentru amoniu, nitraţi, aluminiu, fi er, plumb, cadmiu, pesticide şi mangan în aglomerările urbane cuprinzând între 10.000 şi 100.000 de locuitori.
România s-a conformat cu cerinţele directivei, cu respectarea obiectivelor intermediare privind atingerea unor concentraţii în două etape, respectiv:
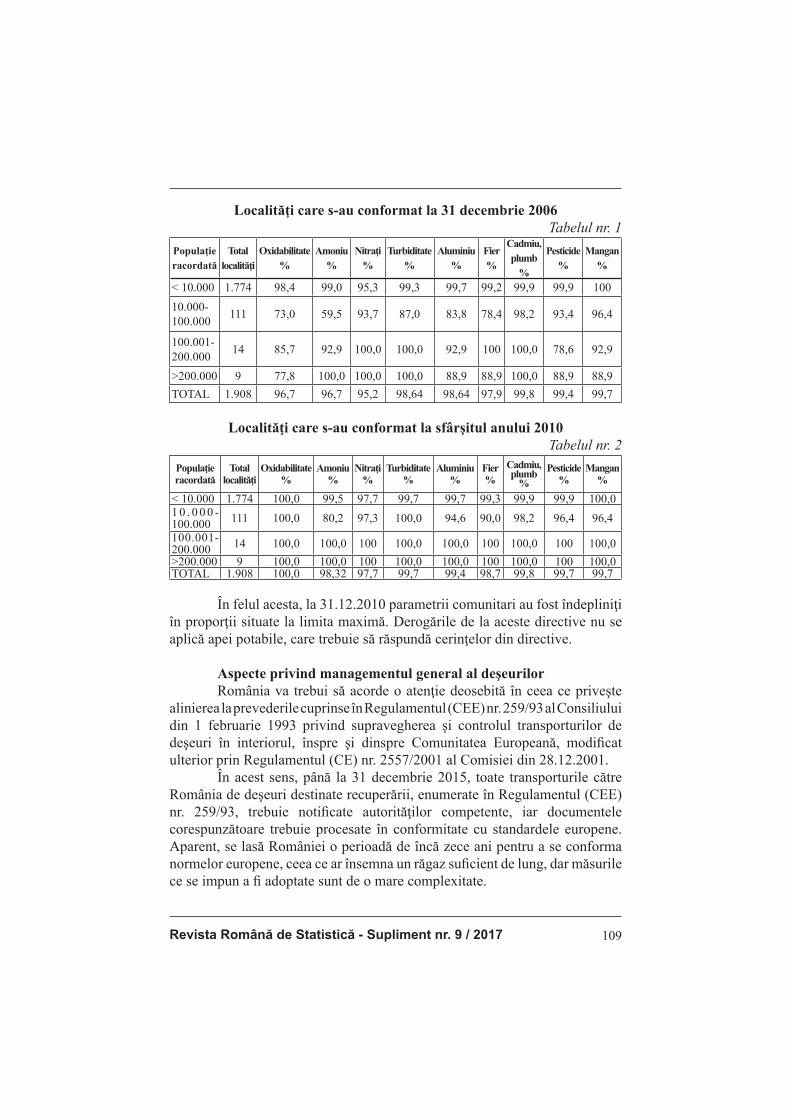
Revista Română de Statistică - Supliment nr. 9 / 2017 109
Localităţi care s-au conformat la 31 decembrie 2006
Tabelul nr. 1
Populaţie
racordată
Total
localităţi
Oxidabilitate
%
Amoniu
%
Nitraţi
%
Turbiditate
%
Aluminiu
%
Fier
%
Cadmiu,
plumb
%
Pesticide
%
Mangan
%
< 10.000 1.774 98,4 99,0 95,3 99,3 99,7 99,2 99,9 99,9 100
10.000-
100.000111 73,0 59,5 93,7 87,0 83,8 78,4 98,2 93,4 96,4
100.001-
200.00014 85,7 92,9 100,0 100,0 92,9 100 100,0 78,6 92,9
>200.000 9 77,8 100,0 100,0 100,0 88,9 88,9 100,0 88,9 88,9
TOTAL 1.908 96,7 96,7 95,2 98,64 98,64 97,9 99,8 99,4 99,7
Localităţi care s-au conformat la sfârşitul anului 2010
Tabelul nr. 2
Populaţie racordată
Total localităţi
Oxidabilitate%
Amoniu%
Nitraţi%
Turbiditate%
Aluminiu%
Fier%
Cadmiu, plumb
%
Pesticide%
Mangan%
< 10.000 1.774 100,0 99,5 97,7 99,7 99,7 99,3 99,9 99,9 100,01 0 . 0 0 0 -100.000
111 100,0 80,2 97,3 100,0 94,6 90,0 98,2 96,4 96,4
100.001-200.000
14 100,0 100,0 100 100,0 100,0 100 100,0 100 100,0
>200.000 9 100,0 100,0 100 100,0 100,0 100 100,0 100 100,0TOTAL 1.908 100,0 98,32 97,7 99,7 99,4 98,7 99,8 99,7 99,7
În felul acesta, la 31.12.2010 parametrii comunitari au fost îndepliniţi în proporţii situate la limita maximă. Derogările de la aceste directive nu se aplică apei potabile, care trebuie să răspundă cerinţelor din directive.
Aspecte privind managementul general al deşeurilor
România va trebui să acorde o atenţie deosebită în ceea ce priveşte alinierea la prevederile cuprinse în Regulamentul (CEE) nr. 259/93 al Consiliului din 1 februarie 1993 privind supravegherea şi controlul transporturilor de deşeuri în interiorul, înspre şi dinspre Comunitatea Europeană, modifi cat ulterior prin Regulamentul (CE) nr. 2557/2001 al Comisiei din 28.12.2001. În acest sens, până la 31 decembrie 2015, toate transporturile către România de deşeuri destinate recuperării, enumerate în Regulamentul (CEE) nr. 259/93, trebuie notifi cate autorităţilor competente, iar documentele corespunzătoare trebuie procesate în conformitate cu standardele europene. Aparent, se lasă României o perioadă de încă zece ani pentru a se conforma normelor europene, ceea ce ar însemna un răgaz sufi cient de lung, dar măsurile ce se impun a fi adoptate sunt de o mare complexitate.
Romanian Statistical Review - Supplement nr. 9 / 2017110
Prin derogare de la regulament, până la 31 decembrie 2011 autorităţile
române competente puteau formula obiecţii cu privire la transporturile către
România a unor deşeuri destinate recuperării, respectiv:
Deşeuri metalice: AA 060 – Cenuşi şi reziduuri de vanadiu; AA 080 –
Deşeuri şi reziduuri de taliu; AA 090 – Deşeuri şi reziduuri de arsenic; AA 100
– Deşeuri şi reziduuri de mercur; AA 130 – Lichide rezultate din decaparea
metalelor.
Deşeuri conţinând compuşi anorganici care pot conţine metale şi
materii organice.
Deşeuri conţinând compuşi organici, care pot conţine metale şi
materiale anorganice.
Deşeuri care pot conţine fi e compuşi organici, fi e anorganici. Cianuri anorganice, cu excepţia reziduurilor solide purtătoare de metale preţioase şi care conţin urme de cianuri anorganice. Termenul poate fi prelungit până la 31 decembrie 2015 cel târziu, în conformitate cu procedura prevăzută în Directiva 75/442/CEE a Consiliului din 15 iulie 1975 privind deşeurile, modifi cată ulterior prin Directiva 91/156/CEE a Consiliului. Autorităţile române competente au formulat obiecţii cu privire la transporturile de deşeuri destinate recuperării, enumerate în anexele la regulament şi cu privire la transporturile de deşeuri destinate recuperării care nu sunt enumerate în anexele respective şi au ca destinaţie o instalaţie exceptată temporar de la aplicarea anumitor dispoziţii ale Directivei 96/61/CE a Consiliului din 24 septembrie 1996, privind prevenirea şi controlul integral al poluării, ale Directivei 2000/76/CE a Parlamentului European şi a Consiliului din 4 decembrie 2000, privind incinerarea deşeurilor sau ale Directivei 2001/8/CE a Parlamentului European şi a Consiliului din 23 octombrie 2001 privind limitarea emisiilor în atmosferă de anumiţi poluanţi generaţi de instalaţiile de ardere de mare capacitate, pe durata exceptării temporare aplicate instalaţiei de destinaţie. România trebuie să facă eforturi pentru transpunerea în practică şi respectarea prevederilor Directivei 94/62/CE a Parlamentului European şi a Consiliului din 20 decembrie 1994, privind ambalajele şi deşeurile de ambalaje, modifi cată ulterior prin Directiva 2004/12/CE a Parlamentului European şi a Consiliului din 11.02.2004. România a fost obligată să atingă obiectivul global de recuperare sau incinerare în instalaţiile de incinerare a deşeurilor cu recuperare de energie până la 31 decembrie 2011. România a îndeplinit obiectivul global de recuperare sau incinerare în instalaţiile de incinerare a deşeurilor cu recuperare de energie la 31 decembrie

Revista Română de Statistică - Supliment nr. 9 / 2017 111
2013, în conformitate cu următoarele obiective intermediare: 53% din masă, în anul 2011 şi 57% din masă, în anul 2012. Ţara noastră a trebuit să atingă obiectivul de reciclare a plasticului la 31 decembrie 2011, conform următoarelor obiective intermediare: 8% din masă, la 31 decembrie 2006; 10% din masă, în anul 2007; 11% din masă, în anul 2008; 12% din masă, în anul 2009 şi 14% din masă, în anul 2010, precum şi obiectivul global de reciclare la 31 decembrie 2013 în conformitate cu următoarele obiective intermediare: 26% din masă, în anul 2006; 28% din masă, în anul 2007; 33% din masă, în anul 2008; 38% din masă, în anul 2009; 42% din masă, în anul 2010; 46% din masă, în anul 2011 şi 50% din masă, în anul 2012. România a ajuns la nivelul obiectivului global de reciclare a sticlei la 31 decembrie 2013, în conformitate cu următoarele obiective intermediare: 21% din masă, la 31 decembrie 2006; 22% din masă, în anul 2007; 32% din masă, în anul 2008; 38% din masă, în anul 2009; 44% din masă, în anul 2010; 48% din masă, în anul 2011 şi 54% din masă, în anul 2012. România a îndeplinit obiectivul global de reciclare a plasticului, luând în considerare exclusiv materialul reciclat sub formă de plastic, la 31 decembrie 2013, astfel: 16% din masă, în anul 2011 şi 18% în anul 2012. România a fost obligată să atingă obiectivul global de reciclare a lemnului la 31 decembrie 2011, conform următorului grafi c: 4% din masă, la 31 decembrie 2006; 5% din masă, în anul 2007; 7% din masă, în anul 2008; 9% din masă, în anul 2009; şi 12% din masă, în anul 2010. Măsurile de implementare în domeniul depozitării deşeurilor sunt cele cuprinse în Directiva 1999/31/CE a Consiliului din 26 aprilie 1999, modifi cată prin Regulamentul (CE) al Parlamentului European şi al Consiliului nr. 1882/2003, din 29.09.2003. România a transpus în practică prevederile Directivei 2002/96/CE a Parlamentului European şi a Consiliului din 27 ianuarie 2003, privind deşeurile de echipamente electrice şi electronice, modifi cată prin Directiva 2003/108/CE a Parlamentului European şi a Consiliului din 08.12.2003, cu o singură derogare, prelungirea până la 31 decembrie 2008 a termenului până la care nivelul mediu de colectare separată este de cel puţin patru kilograme pe cap de locuitor pe an, de deşeuri provenind din gospodăriile populaţiei.
Combaterea poluării industriale. Controlul şi managementul
riscului
Prin Directiva 96/61/CE a Consiliului din 24 septembrie 1996 privind prevenirea şi controlul integrat al poluării, modifi cată prin Regulamentul (CE) al Parlamentului European şi al Consiliului nr. 1882/2003, sunt reglementate

Romanian Statistical Review - Supplement nr. 9 / 2017112
măsurile pe care statele membre ale Uniunii Europene trebuie să le pună în practică pentru a limita, controla şi elimina popularea industrială. Toate aceste documente (Directiva 96/61/CE şi Regulamentul nr. 1882/2003) reglementează managementul riscului pe care statele membre trebuie să-l practice pentru prevenirea poluării industriale. România este considerată o ţară cu „un risc ridicat în domeniul poluării industriale deoarece a fost marcată, şi încă mai păstrează efectele negative ale unei industrializări intense (forţate), neînsoţită de măsuri pentru reducerea poluării şi controlul acesteia”. În acest sens, pentru a oferi posibilitatea alinierii la standardele europene, România benefi ciază de o serie de derogări de la prevederile directivei Uniunii Europene. Aceste măsuri derogatorii sunt prevăzute în cadrul unui grafi c, ţinând seama de gradul de poluare pe care îl prezintă societăţile industriale din România, precum şi de costurile pe care le reclamă reducerea poluării şi implementarea managementului riscului. În această direcţie, ţara noastră a negociat şi acceptat, următorul calendar, în condiţiile în care, prin derogare de la dispoziţiile articolului 5 alineatul (1) din Directiva 96/61/CE, condiţiile de autorizare a instalaţiilor existente nu se aplică pe teritoriul României următoarelor instalaţii până la data indicată pentru fi ecare instalaţie, cu condiţia respectării obligaţiei de a opera aceste instalaţii în conformitate cu valorile-limită de emisii, parametrii echivalenţi sau măsurile tehnice disponibile, în conformitate cu dispoziţiile articolului 9 alineatele (3) şi (4) din acest document. Uniunea Europeană acordă o mare atenţie condiţiilor în care sunt incinerate deşeurile şi modul în care sunt controlate emisiile de agenţi poluanţi în atmosferă. Se apreciază că România are mari difi cultăţi în ceea ce priveşte respectarea programului cuprins în Directivele 2000/76/CE şi 2001/80/CE ale Parlamentului European şi Consiliului. În aceste condiţii, s-au acceptat o serie de măsuri derogatorii care să permită României alinierea, într-un termen rezonabil, la cerinţele Uniunii Europene în materie. Directiva 2001/80/CE a Parlamentului European şi Consiliului din 23 octombrie 2001 privind limitarea emisiilor în atmosferă de anumiţi poluanţi generaţi de instalaţii de ardere de mare capacitate, modifi cată prin Actul privind condiţiile aderării şi modifi carea tratatelor – aderarea Republicii Cehe, a Republicii Estonia, a Republicii Cipru, a Republicii Letonia, a Republicii Lituania, a Republicii Ungare, a Republicii Malta, a Republicii Polone, a Republicii Slovenia şi a Republicii Slovace – care prevede, prin derogare de la dispoziţiile directivei, că valorile-limită ale emisiilor de dioxid de sulf nu s-au aplicat pe teritoriul României pe perioada de tranziţie derogatorie până la 31 decembrie 2013. România a transmis Comisiei, la

Revista Română de Statistică - Supliment nr. 9 / 2017 113
1 ianuarie 2011, un plan actualizat, care să includă un plan de investiţii, privind alinierea treptată a instalaţiilor rămase neconforme, cuprinzând etape clar defi nite pentru aplicarea acquis-ului. Aceste planuri trebuie să asigure reducerea în continuare a emisiilor până la un nivel semnifi cativ inferior
obiectivelor intermediare prevăzute, în special în ceea ce priveşte emisiile
începând cu anul 2012.
În cazul în care Comisia, ţinând seama îndeosebi de efectele asupra mediului şi de necesitatea de a reduce denaturarea concurenţei pe piaţa internă, cauzată de măsurile tranzitorii, apreciază că aceste planuri nu sunt sufi ciente pentru atingerea obiectivelor, informează România în acest sens. În următoarele trei luni de la data acestei informări, România comunică măsurile luate pentru a atinge aceste obiective. Ulterior, în cazul în care şi de
această dată Comisia, consultându-se cu statele membre, consideră că aceste măsuri nu sunt sufi ciente pentru atingerea obiectivelor, declanşează procedura de sancţionare a nerespectării obligaţiilor care decurg din calitatea de stat membru, în conformitate cu articolul III-360 din Constituţia Europeană.
Concluzii Din studiul efectuat de autori asupra acestor aspecte din economia națională se desprind concluzii teoretice și practice. În mod teoretic, România are de parcurs un program bine stabilit, bine determinat, care să îi asigure posibilitatea de a îmbunătății calitatea vieții economice, eliminara poluării, protejarea mediului și multe alte aspecte. În al doilea rând, se desprinde concluzia că România de la aderarea la Uniunea Europeană și până în prezent, a reușit să parcurgă rapid un program de măsuri prin care, respectând etapele convenite în 2007 la aderare, a reușit să elimine riscurile majore ale afectării mediului. În mod practic, constatăm că România este într-un proces activ de îndeplinire a măsurilor, pașilor prevăzuți în directivele europene și programul de măsuri privind alinierea la standardele europene convenit cu prilejul aderării României la Uniunea Europeană. De asemenea în ceea ce privește alinierea la directivele Uniunii Europene în ceea ce privește controlul calității apelor, se poate concluziona că România acordă prioritate sporită acestui domeniu, înregistrând progrese semnifi cative în ceea ce privește protejarea și menținerea calității apei, factor important al vieții în general și al activității economice normale în mod special. În legătură cu managementul general al deșeurilor putem trage concluzia că prevederile din directivele și regulamentele Uniunii Europene care se referă la acest domeniu, au fost transpuse în planul de aliniere al României la standardele europene și îndeplinite în procent ridicat până în momentul de față. Concluzia care se desprinde cu privire la combaterea
Romanian Statistical Review - Supplement nr. 9 / 2017114
poluării industriale este importantă în sensul că, țara noastră a pășit rapid pe acest drum, avea o stare oarecum pozitivă și măsurile derogatorii care au fost acceptate României în acest domeniu au fost mai reduse față de alte țări care au fost nevoite ulterior să modifi ce prevederi ale tratatelor de aderare și mai ales, să modifi ce unele măsuri pe care le-au reprogramat așa încât să se ajungă la standardele impuse. Concluzia fi nală este aceea că România a făcut pași siguri pe linia alinierii la standardele europene, dar și aceea că mai are încă unele măsuri de întreprins pentru a se alinia standardelor europene și mai ales de a continua întreprinderea unor astfel de măsuri într-un ritm constant care să determine apropierea României de standardele europene.
Bibliografi e 1. Anghelache, C. and Anghel, M.G. (2014). Modelare economică. Concepte, teorie
şi studii de caz, Editura Economică, Bucureşti 2. Anghelache, C. (2010). Management of the Environment and Environmental Risk,
Metalurgia International, 5, 206-212 3. Anghelache, C. (1999-2016). Colecția de volume România. Starea economică,
Editura Economică, București 4. Beelen, R. et al. (2009). Mapping of background air pollution at a fi ne spatial scale
across the European Union. Science of The Total Environment, 407 (6), 1852-1867 5. Cavea, L. and Blomquist, G. (2008). Environmental policy in the European Union:
Fostering the development of pollution havens?. Ecological Economics, 65 (2), 253-261
6. Koutalakis, C, Buzogany, A. and Börzel, T.A. (2010). When soft regulation is not enough: The integrated pollution prevention and control directive of the European Union. Regulation & Governance, 4 (3), 329–344
7. Loos, R. și colab. (2010). Pan-European survey on the occurrence of selected polar organic persistent pollutants in ground water. Water Research, 44 (14), 4115-4126
8. Mazzantia, M. and Zobolib, R. (2008). Waste generation, waste disposal and policy effectiveness: Evidence on decoupling from the European Union. Resources, Conservation and Recycling, 52 (10), 1221-1234
9. Monte, M.C., Fuente, E., Blanco, A. and Negro, C. (2009). Waste management from pulp and paper production in the European Union. Waste Management, 29 (1), 293-308
10. Lefebvre, O. and Moletta, R. (2006). Treatment of organic pollution in industrial saline wastewater: A literature review. Water Research, 40 (20), 3671-3682
11. Pires, A., Martinho, G. and Chang, N. B. (2011). Solid waste management in European countries: A review of systems analysis techniques. Journal of Environmental Management, 92 (4), 1033-1050
12. Vehlow, J, Bergfeldt, B., Visser, R. and Wilén, C. (2007). European Union waste management strategy and the importance of biogenic waste. Journal of Material Cycles and Waste Management, 9 (2), 130–139
13. *** Directiva 91/271/CEE a Consiliului din 21 mai 1991, modifi cată prin Regulamentul (CE) nr. 1882/2003 al Parlamentului European şi al Consiliului din 29.09.2003
14. *** Directiva 94/63/CE a Parlamentului European şi a Consiliului din 20 decembrie 1994

Revista Română de Statistică - Supliment nr. 9 / 2017 115
15. *** Directiva 96/61/CE 16. *** Directiva 1999/31/CE a Consiliului din 26 aprilie 1999, modifi cată prin
Regulamentul (CE) al Parlamentului European şi al Consiliului nr. 1882/2003,
din 29.09.2003
17. *** Directiva 2001/80/CE a Parlamentului European şi Consiliului din 23
octombrie 2001
18. *** Directiva 2002/96/CE a Parlamentului European şi a Consiliului din 27
ianuarie 2003, modifi cată prin Directiva 2003/108/CE a Parlamentului European
şi a Consiliului din 08.12.2003
19. ** Regulamentul nr. 1882/2003 al Parlamentului European şi al Consiliului din
29.09.2003
20. *** Regulamentul (CEE) nr. 259/93 al Consiliului din 1 februarie 1993, modifi cat
prin Regulamentul (CE) nr. 2557/2001 al Comisiei din 28.12.2001

Romanian Statistical Review - Supplement nr. 9 / 2017116
ANALYSIS OF ROMANIA’S STRATEGY OF ALIGNMENT WITH THE EU
ENVIRONMENTAL DIRECTIVES
Prof. Constantin ANGHELACHE PhD ([email protected])
Bucharest University of Economic Studies / „Artifex” University of Bucharest
Assoc. prof. Mădălina-Gabriela ANGHEL PhD ([email protected])
„Artifex” University of Bucharest
Lecturer Ana CARP PhD ([email protected])
„Artifex” University of Bucharest
Abstract
In this article, the authors analyze the measures of the EU directives regarding the energy and environment domain and the strategy of aligning Romania with the EU directives on environmental control. At the same time, the authors analyze Romania’s strategy of alignment with European directives on water quality control as well as general waste management. In the fi nal part,
the authors point out that industrial and other activities also cause industrial
pollution. The authors grant enough room for control and risk management in
this area. The study is based on the European Union directives on the above-
mentioned issues, highlighting both the measures taken by the European
Union, the level at which they are located and the steps that Romania should
undertake in this fi eld. Of course, in 2007 when Romania’s access to the
European Union was achieved, the European Union measures were considered
and consequently a chart was established or, in fact, several charts, in which
Romania step by step had to solve certain aspects so that, gradually align with
European standards. There are briefl y presented the measures taken, most of
them resolved, there are some lagging behind, and by direct reference to the
EU directives it is specifi ed what Romania has to do to eliminate all the lagging
behind in order to comply with the standards European policies in terms of
environmental protection, avoidance of pollution and future compliance with
European strategies on the basis of which Romania must set its own strategy.
The article also presents relevant data attesting to the steps that Romania has
taken and which it must undertake in order to reach the standard required or
imposed by the EU member state.
Keywords: environment, water quality, management, waste, pollution
JEL Classifi cation: Q53, Q56
Revista Română de Statistică - Supliment nr. 9 / 2017 117
Introduction The study conducted by the authors is based on a balanced treatment of aspects of particular importance in the fi eld of environment ... In the
study carried out by the authors they focus on the analysis of Romania’s
alignment with the EU directives in the fi eld of energy and the environment;
the strategy of alignment with EU directives on water quality control;
aspects of general waste management; combating industrial pollution (risk
control and management). Structured in four parts, the paper makes a gradual
study of the situation of the Romanian economy, highlighting the state and
level of our country in terms of alignment with the European standards in
the areas I have mentioned. At each of the points included in Methodology
and data research there are presented concrete elements of the Romanian
economy regarding environment and industrial pollution, at the same time
referring to the situation that we must register as a result of the elimination
of the shortcomings facing the Romanian economy. From this point of view
there are presented stepwise measures that Romania has undertaken and will
undertake, so that these activities will ensure the elimination of the negative
environmental issues caused by the improper waste management and many
other aspects that strike the quality of life, determined by the quality of the
environment. The authors present the measures already taken and suggests the
next steps for the Romanian economy to reach an appropriate stage, correlated
with the one existing in the European Union, as specifi ed in the EU directives
on this fi eld.
Literature review Anghelache (1999-2016) performs a mundane analysis of the evolution
of the situation and of the economic, fi nancial and social results recorded
by Romania. Anghelache (2010) addresses issues related to environmental
management and environmental risk. Pires, Martinho and Chang (2011) analyze
waste management methods in European countries, bringing arguments for and
against the waste management tools used in each EU Member State. Mazzantia
and Zobolib (2008) carry out a study on waste generation, incineration,
recycling and waste dumps dynamics based on EU 25 data to assess effects
for various management factors, referring to the heterogeneity among Western
countries and eastern EU. Loos, R. et al. achieves a pan-European recognition
of persistent organic polar pollutants in Europe’s groundwater. Lefebvre and
Moletta (2006) show the need to combine the physicochemical / biological
treatment of industrial saline effl uents with regard to the global treatment chain
in order to comply with current legislation. Beelen, R. et al. (2009) assesses
various methods to develop accurate and high-resolution air pollution maps
Romanian Statistical Review - Supplement nr. 9 / 2017118
in the European Union. Anghelache and Anghel (2014) is a reference work in the fi eld of modeling economic and fi nancial decisions. Cavea and Blomquist
(2008) are aimed at determining whether the European Union has increased its
imports of „dirty” goods from poorer, less democratic countries into a period
of tougher environmental standards. Koutalakis, Buzogany and Börzel (2010)
show that the application of soft law, which is not legally binding, may lead to
non-compliance and „removal” of environmental permit schemes for industry
in the medium term, such developments being undermines the EU’s regulatory
authority. Monte et al. (2009) shows the need to continue research into the
different applications of waste, taking into account the environmental and
economic factors of waste treatment. Vehlow et al. (2007) argues that recycling
and incineration are essential parts of integrated waste management systems,
and they are not in competition.
Research methodology, data, results and discussions Alignment with EU Energy and Environmental Directives Council Directive 68/414 / EEC of 20 December 1968 imposing an
obligation on Member States of the EEC to maintain minimum stocks of crude
oil and / or petroleum products, as amended by Council Directive 98/93 / EC
of 14.12.1998, governs the policy which must be promoted by all EU Member
States, including Romania, after accession on 1 January 2007. However, even
after accession, taking into account Romania’s concrete position in the energy
fi eld, without taking special derogations from the Directive , some derogations
are provided during the transition period for Romania. Thus, by way of derogation
from the provisions of Directive 68/414 / EEC, the minimum level of stocks of
petroleum products did not apply to Romania until 31 December 2011.
In the fi eld of the environment, EU directives are very complex and
compel member countries to make sustained efforts to align with European
standards.
The emphasis is on environmental issues in terms of air quality, waste
policy, water quality, industrial pollution and risk management.
Air quality aspects are regulated by Directive 94/63 / EC of the
European Parliament and of the Council of 20 December 1994 on the control
of volatile organic compound emissions resulting from the storage of fuel and
its distribution from terminals to service stations, as amended by Regulation no.
Regulation (EC) No 1882/2003 of the European Parliament and of the Council
of 29.09.2003.
During the transition period, several derogations were approved for
Romania. Thus, by way of derogation from the provisions of Article 3 and of
Annex I to Directive 94/63 / EC, the requirements for existing storage facilities
Revista Română de Statistică - Supliment nr. 9 / 2017 119
at terminals have not been applied in the territory of Romania, namely: by 31 December 2007, a number 115 storage facilities from 12 terminals and until 31 December 2008 to four storage facilities at a single terminal, transiting a quantity of between 25,000 and 50,000 tons / year; until 31 December 2007, to 138 storage facilities from 13 terminals and until 31 December 2009 to 57 storage facilities from ten terminals and until 31 December 2009 to 526 storage facilities in the framework of 63 terminals, which transits a maximum of 25,000 tons / year; Also, by way of derogation from the provisions of Article 4 and Annex II of Directive 94/63 / EC, the requirements for loading and unloading existing tanks at terminals have not been applied in the territory of Romania. Thus, until 31 December 2007, a number of 36 loading / unloading installations at 12 terminals, which transited between 25 000 and 150 000 tonnes / year and until 31 December 2007, to 82 installations loading and unloading from 18 terminals until 31 December 2008 to 14 loading installations - from 11 terminals to 31 December 2009 to 114 loading and unloading facilities from 58 terminals, which transits a quantity of up to 25,000 tonnes / year. By way of derogation from the provisions of Article 5 of Directive 94/63 / EC, the requirements for existing tanks at terminals have not been applied in the territory of Romania until 31 December 2007 to 31 tanks; until 31 December 2008, to an additional 101 tankers; until 31 December 2009, to an additional 432 tanks. By way of derogation from the provisions of Article 6 and Annex III of Directive 94/63 / EC, requirements for the loading of existing tanks at fuel stations have not been applied in the territory of Romania. Thus, until December 31, 2007, a number of 116 fuel distribution stations, until 31 December 2008, an additional number of 19 stations and until 31 December 2009, an additional number of 106 stations, which transit through a larger quantity of 1,000 m3 / year continued. Until 31 December 2007, an additional number of 49 fueling stations until 31 December 2008 to an additional 11 stations and until 31 December 2009 to an additional 85 stations which transit a quantity between 500 and 1,000 m3 / year were not restricted until 31 December 2007 to 23 fi lling stations by 31 December
2008 to an additional 14 stations and by 31 December 2009 to a an additional
number of 188 stations, which transits a quantity of up to 500 m3 / year.
Strategy for alignment with the European Union Directives on water quality control
The quality of water in general and of drinking, in particular, is treated
with great care by the European Union. When the condition of the environment
is studied, the air and water quality are located at a critical location.
Romanian Statistical Review - Supplement nr. 9 / 2017120
From the study of directives regulating the quality of water at European level (Directive 83/13 on limit values and quality objectives for cadmium discharges, as amended by Directive 91/692/1991 and Directive 84/156/1984 on the values and the quality objectives for hexachlorocyclohexane discharges, as amended by Directive 91/692/1991), it is clear that Romania must take enormous steps to bring these requirements into line. The European Union has approved a number of derogations for Romania, namely: the limit values for discharges of cadmium and mercury into waters have not been applied in Romania until 31 December 2009. By way of derogation from Council Directive 84/491 / EEC of 9 October 1984 on limit values and quality objectives for the discharge of lindane into the waters referred to in Council Directive 76/464 / EEC of 4 May 1976 on pollution caused by certain substances dangerous substances discharged into the aquatic environment of the Community have not been applied on the territory of Romania until 31 December 2009. By way of derogation, the provisions of Council Directive 86/280 / EEC of 12 June 1986 on limit values and quality objectives for discharges of certain dangerous substances, as amended by Council Directive 91/692 / EEC of 23.12.1991, have been applied in Romania until 31 December 2009. Other derogation from the provisions of Council Directive 91/271 / EEC of 21 May 1991 concerning urban waste water treatment, as amended by Regulation (EC) No. No 1882/2003 of the European Parliament and of the Council of 29 September 2003, the requirements for urban waste water collection and treatment systems shall not apply in full to Romania until 31 December 2018, with two phases: on 31 December 2013, compliance with Article 3 of the Directive must be achieved in urban agglomerations with a population equivalent of more than 10,000; on 31 December 2015, compliance with Article 5 (2) of the Directive should be achieved in urban agglomerations with a population equivalent of more than 10,000. Romania was obliged to ensure the gradual expansion of collection systems according to the following minimum general population equivalents: 61% at 31 December 2010; 69% at 31 December 2013; 80% on 31 December 2015. Romania needs to achieve the gradual expansion of waste water treatment in accordance with the following general minimum population equivalents: 51% at 31 December 2010; 61% on 31 December 2013; 77% at 31 December 2015. Council Directive 98/83 / EC of 3 November 1998 on the quality of water intended for human consumption, as amended by European Parliament and Council Regulation (EC) No. No 1882/2003 provides for specifi c measures
for which derogations have been made taking into account Romania’s diffi culties
in complying rapidly with the requirements of the directives.

Revista Română de Statistică - Supliment nr. 9 / 2017 121
Thus, the values set for the following parameters were not applied (not applicable) entirely on the territory of Romania, as follows: • until December 31, 2010, for oxidisability in urban agglomerations
with less than 10,000 inhabitants; • until 31 December 2010, for oxidisability and turbidity in urban
agglomerations of between 10,000 and 100,000 inhabitants; • until 31 December 2010, for oxidisability, ammonium, pesticides,
iron and manganese in urban agglomerations with over 100,000 inhabitants;
• until 31 December 2015, for ammonium, nitrates, turbidity, aluminum, iron, lead, cadmium and pesticides in urban agglomerations of less than 10,000 inhabitants;
• until 31 December 2015, for ammonium, nitrates, aluminum, iron, lead, cadmium, pesticides and manganese in urban agglomerations of between 10,000 and 100,000 inhabitants.
Romania has complied with the requirements of the Directive, respecting the interim targets for achieving two-stage concentrations, namely:
Places that conformed on December 31, 2006Table no. 1
Population connected
Total locations
Oxidation %
Ammonium %
Nitrate %
Turbidity %
Aluminum %
Iron %
Cadmium, lead %
Pesticide %
Manganese %
< 10.000 1.774 98,4 99,0 95,3 99,3 99,7 99,2 99,9 99,9 10010.000-100.000
111 73,0 59,5 93,7 87,0 83,8 78,4 98,2 93,4 96,4
100.001-200.000
14 85,7 92,9 100,0 100,0 92,9 100 100,0 78,6 92,9
>200.000 9 77,8 100,0 100,0 100,0 88,9 88,9 100,0 88,9 88,9TOTAL 1.908 96,7 96,7 95,2 98,64 98,64 97,9 99,8 99,4 99,7
Localities that conformed at the end of 2010Table no. 2
Population connected
Total locations
Oxidation %
Ammonium %
Nitrate %
Turbidity %
Aluminum %
Iron %
Cadmium, lead %
Pesticide %
Manganese %
< 10.000 1.774 100,0 99,5 97,7 99,7 99,7 99,3 99,9 99,9 100,01 0 . 0 0 0 -100.000 111 100,0 80,2 97,3 100,0 94,6 90,0 98,2 96,4 96,4
100.001-200.000 14 100,0 100,0 100 100,0 100,0 100 100,0 100 100,0
>200.000 9 100,0 100,0 100 100,0 100,0 100 100,0 100 100,0TOTAL 1.908 100,0 98,32 97,7 99,7 99,4 98,7 99,8 99,7 99,7

Romanian Statistical Review - Supplement nr. 9 / 2017122
Thus, on 31.12.2010, the Community parameters were met in proportion to the maximum limit. Derogations from these Directives do not apply to drinking water, which must meet the requirements of the Directives.
General Waste Management Issues Romania will have to pay particular attention to the alignment with the provisions of Regulation (EEC) No. Council Regulation (EEC) No 259/93 of 1 February 1993 on the supervision and control of shipments of waste within, into and out of the European Community, as subsequently amended by Regulation (EC) Commission Regulation (EC) No 2557/2001 of 28.12.2001. To this end, until 31 December 2015, all shipments to Romania of waste destined for recovery, listed in Regulation (EEC) 259/93 must be notifi ed to
the competent authorities and the corresponding documents must be processed
in accordance with European standards. Apparently, it leaves Romania for a
further ten years to comply with European norms, which would mean a long
enough respite, but the measures that need to be adopted are of great complexity.
By way of derogation from the Regulation, until 31 December 2011,
the competent Romanian authorities could object to shipments to Romania of
waste destined for recovery, namely:
Metallic waste: AA 060 - Vanadium ash and residues; AA 080 - Waste
and waste of thallium; AA 090 - Wastes and residues of arsenic; AA 100 - Mercury
waste and residues; AA 130 - Liquids resulting from the pickling of metals.
Wastes containing inorganic compounds which may contain metals
and organic matter.
Wastes containing organic compounds, which may contain metals and
inorganic materials.
Wastes that may contain either organic or inorganic compounds.
Inorganic cyanides, excluding solid residues bearing precious metals
and containing traces of inorganic cyanides.
The time limit may be extended until 31 December 2015 at the latest
in accordance with the procedure laid down in Council Directive 75/442 /
EEC of 15 July 1975 on waste, as subsequently amended by Council Directive
91/156 / EEC.
The competent Romanian authorities have objected to shipments
of waste destined for recovery listed in the Annexes to the Regulation and
on shipments of waste destined for recovery not listed in those Annexes and
are destined for an installation temporarily exempted from the application of
certain provisions of Council Directive 96/61 / EC of 24 September 1996
concerning the prevention and control of pollution, Directive 2000/76 / EC
of the European Parliament and of the Council of 4 December 2000 on the
incineration of waste or Directive 2001/8 / EC of the European Parliament and
Revista Română de Statistică - Supliment nr. 9 / 2017 123
of the Council of 23 October 2001 on the limitation of emissions of certain pollutants into the air from large combustion plants during the temporary derogation to the facility of destination. Romania must endeavor to implement and comply with the provisions of Directive 94/62 / EC of the European Parliament and of the Council of 20 December 1994 on packaging and packaging waste, as subsequently amended by Directive 2004/12 / EC of the European Parliament and of the Council Council of 11.02.2004. Romania was obliged to achieve the overall recovery or incineration target in waste incineration plants with energy recovery by 31 December 2011. Romania has achieved its overall recovery or incineration target in waste incineration plants with energy recovery on 31 December 2013 according to the following intermediate targets: 53% of the mass in 2011 and 57% of the mass in 2012. Our country had to achieve the plastic recycling target on 31 December 2011, according to the following intermediate targets: 8% of the mass on 31 December 2006; 10% of the mass in 2007; 11% of the mass in 2008; 12% of the mass in 2009 and 14% of the mass in 2010 and the overall recycling target on 31 December 2013 according to the following intermediate targets: 26% of the mass in 2006; 28% of the mass in 2007; 33% of the mass in 2008; 38% of the mass in 2009; 42% of the mass in 2010; 46% of the mass in 2011 and 50% of the mass in 2012. Romania reached the global glass recycling target at 31 December 2013, according to the following intermediate targets: 21% of the mass on 31 December 2006; 22% of the mass in 2007; 32% of the mass in 2008; 38% of the mass in 2009; 44% of the mass in 2010; 48% of the mass in 2011 and 54% of the mass in 2012. Romania achieved its overall plastic recycling target, taking exclusively plastic recycled material as of December 31, 2013, as follows: 16% of the mass in 2011 and 18% in 2012.
Combating industrial pollution. Risk control and management By Council Directive 96/61 / EC of 24 September 1996 concerning integrated pollution prevention and control, as amended by Regulation (EC) No ... of the European Parliament and of the Council No 1882/2003 regulates the measures that Member States of the European Union have to put into practice in order to limit, control and eliminate industrial population. All these documents (Directive 96/61 / EC and Regulation No 1882/2003) regulate the risk management that Member States must take to prevent industrial pollution.

Romanian Statistical Review - Supplement nr. 9 / 2017124
Romania is considered a country with a „high risk of industrial pollution because it has been marked, and still preserves the negative effects of intense (forced) industrialization, unaccompanied by measures to reduce pollution and control it.” To this end, in order to offer the possibility of alignment with European standards, Romania benefi ts from a number of derogations from the provisions of
the EU Directive. These derogatory measures are set out in a graph, taking into
account the pollution degree of industrial companies in Romania, as well as the
costs they require to reduce pollution and to implement risk management.
In this respect, our country has negotiated and accepted the
following timetable, provided that, by way of derogation from the provisions
of Article 5 (1) of Directive 96/61 / EC, the conditions for the authorization
of existing installations do not apply in the territory of Romania of the
following installations until the date indicated for each installation, subject
to compliance with the obligation to operate these installations in accordance
with the emission limit values, equivalent parameters or technical measures
available, in accordance with Article 9 (3) and (4) of this document. The
European Union pays great attention to the conditions under which waste is
incinerated and how emissions of pollutants are controlled in the atmosphere.
It is appreciated that Romania has great diffi culties in complying
with the program of Directives 2000/76 / EC and 2001/80 / EC of the European
Parliament and of the Council.
Under these circumstances, a number of derogatory measures
were agreed allowing Romania to align within a reasonable time with the
European Union’s requirements in this fi eld. Directive 2001/80 / EC of the
European Parliament and of the Council of 23 October 2001 on the limitation
of emissions of certain pollutants into the air from large combustion plants
modifi ed by the Act concerning the conditions of accession and the amendment
of the Treaties - Accession of the Czech Republic, the Republic of Estonia,
the Republic of Cyprus, the Republic of Latvia, the Republic of Lithuania,
the Republic of Hungary, the Republic of Malta, the Republic of Poland, the
Republic of Slovenia and the Slovak Republic - which provides, by way of
derogation from the Directive, that the emission limit values for dioxide of
sulfur have not been applied in Romania during the derogation period until 31
December 2013. Romania submitted to the Commission on 1 January 2011 an
updated plan including an investment plan for the gradual alignment of non-
compliant installations , comprising clearly defi ned steps for the application of
the acquis. These plans should ensure that emissions continue to be reduced to
a level signifi cantly below the foreseen interim targets, particularly as regards
emissions from 2012 onwards.

Revista Română de Statistică - Supliment nr. 9 / 2017 125
Where the Commission, taking into account in particular the environmental effects and the need to reduce distortions of competition in the internal market caused by the transitional measures, considers that these plans are not suffi cient to achieve the objectives, it informs Romania. Within
the next three months from the date of this information, Romania shall
communicate the measures taken to achieve these objectives. Subsequently,
if the Commission, in consultation with the Member States, considers that
these measures are not suffi cient to achieve the objectives, it shall initiate the
procedure for penalizing non-compliance with the obligations arising from the
status of Member State in accordance with Article III -360 of the European
Constitution.
Conclusion From the author’s study of these aspects of the national economy,
theoretical and practical conclusions are drawn. Theoretically, Romania has
a well-established, well-established program to ensure the possibility of
improving the quality of economic life, eliminating pollution, protecting the
environment and many other aspects. Secondly, it comes to the conclusion that
Romania has been able to go through a program of measures rapidly since its
accession to the European Union, through which it managed to eliminate the
major risks of environmental damage, respecting the stages agreed in 2007.
In practical terms, we fi nd that Romania is in an active process of
implementing the measures, the steps stipulated in the European directives
and the program of measures regarding the alignment with the European
standards agreed on the accession of Romania to the European Union. Also,
regarding the alignment with the European Union directives on water quality
control, it can be concluded that Romania gives increased priority to this
area, making signifi cant progress in protecting and maintaining the quality
of water, an important factor in life in general, and of the normal economic
activity in particular. Regarding the general management of waste, we can
conclude that the provisions of the EU directives and regulations referring
to this area have been transposed into Romania’s alignment plan with the
European standards and have been fulfi lled in a high percentage up to now.
The concluding conclusion regarding the fi ght against industrial pollution is
important in the sense that our country has gone fast on this road, it has a
somewhat positive state, and the derogatory measures that have been accepted
by Romania in this fi eld have been lower compared to other countries they
were subsequently forced to modify the provisions of the accession treaties
and, in particular, to modify some measures they had reprogrammed so as to
reach the required standards. The fi nal conclusion is that Romania has taken

Romanian Statistical Review - Supplement nr. 9 / 2017126
certain steps towards aligning itself to the European standards, but also that it still has some measures to be taken to align with European standards and especially to continue to take such measures at a steady pace which would bring Romania closer to European standards.
Bibliografi e 1. Anghelache, C. and Anghel, M.G. (2014). Modelare economică. Concepte, teorie
şi studii de caz, Editura Economică, Bucureşti 2. Anghelache, C. (2010). Management of the Environment and Environmental Risk,
Metalurgia International, 5, 206-212 3. Anghelache, C. (1999-2016). Colecția de volume România. Starea economică,
Editura Economică, București
4. Beelen, R. et al. (2009). Mapping of background air pollution at a fi ne spatial scale
across the European Union. Science of The Total Environment, 407 (6), 1852-1867
5. Cavea, L. and Blomquist, G. (2008). Environmental policy in the European Union:
Fostering the development of pollution havens?. Ecological Economics, 65 (2),
253-261
6. Koutalakis, C, Buzogany, A. and Börzel, T.A. (2010). When soft regulation is not
enough: The integrated pollution prevention and control directive of the European
Union. Regulation & Governance, 4 (3), 329–344
7. Loos, R. și colab. (2010). Pan-European survey on the occurrence of selected polar
organic persistent pollutants in ground water. Water Research, 44 (14), 4115-4126
8. Mazzantia, M. and Zobolib, R. (2008). Waste generation, waste disposal and policy
effectiveness: Evidence on decoupling from the European Union. Resources, Conservation and Recycling, 52 (10), 1221-1234
9. Monte, M.C., Fuente, E., Blanco, A. and Negro, C. (2009). Waste management from
pulp and paper production in the European Union. Waste Management, 29 (1), 293-308
10. Lefebvre, O. and Moletta, R. (2006). Treatment of organic pollution in industrial
saline wastewater: A literature review. Water Research, 40 (20), 3671-3682
11. Pires, A., Martinho, G. and Chang, N. B. (2011). Solid waste management
in European countries: A review of systems analysis techniques. Journal of Environmental Management, 92 (4), 1033-1050
12. Vehlow, J, Bergfeldt, B., Visser, R. and Wilén, C. (2007). European Union waste
management strategy and the importance of biogenic waste. Journal of Material Cycles and Waste Management, 9 (2), 130–139
13. *** Directiva 91/271/CEE a Consiliului din 21 mai 1991, modifi cată prin
Regulamentul (CE) nr. 1882/2003 al Parlamentului European şi al Consiliului
din 29.09.2003
14. *** Directiva 94/63/CE a Parlamentului European şi a Consiliului din 20
decembrie 1994
15. *** Directiva 96/61/CE

Revista Română de Statistică - Supliment nr. 9 / 2017 127
16. *** Directiva 1999/31/CE a Consiliului din 26 aprilie 1999, modifi cată prin
Regulamentul (CE) al Parlamentului European şi al Consiliului nr. 1882/2003,
din 29.09.2003
17. *** Directiva 2001/80/CE a Parlamentului European şi Consiliului din 23
octombrie 2001
18. *** Directiva 2002/96/CE a Parlamentului European şi a Consiliului din 27
ianuarie 2003, modifi cată prin Directiva 2003/108/CE a Parlamentului European
şi a Consiliului din 08.12.2003
19. ** Regulamentul nr. 1882/2003 al Parlamentului European şi al Consiliului din
29.09.2003
20. *** Regulamentul (CEE) nr. 259/93 al Consiliului din 1 februarie 1993, modifi cat
prin Regulamentul (CE) nr. 2557/2001 al Comisiei din 28.12.2001
Romanian Statistical Review - Supplement nr. 9 / 2017128
Calitatea mediului înconjurător – factor al creşterii sustenabile
Conf. univ. dr. Mădălina-Gabriela ANGHEL ([email protected])
Universitatea „Artifex” din București
Conf. univ. dr. Florin Paul Costel LILEA (fl [email protected])
Universitatea „Artifex” din București
Ec. Ștefan Gabriel DUMBRAVĂ ([email protected])
Abstract În acest articol, autorii întreprind un studiu al mediului înconjurător din țările membre ale Uniunii Europene în complexitatea sa, precum și din fi ecare stat membru în mod particular. Se acordă atenție modului în care utilizarea mediului și a pământului de pe suprafața globului sunt raportate la nevoia de protecție a acestora. Autorii evidențiază o serie de aspecte în legătură cu terenul utilizat de cele 27 de țări membre ale Uniunii Europene (nu se face referire și la cea de-a 28 țară care teoretic este în Brexit). Apoi ținând seama că terenul poate fi utilizat pentru agricultură, servicii, recreație și spațiu rezidențial, este ocupat de păduri, este exploatat minier sau utilizat pentru transport sau oricare alte posibilități de utilizare. În acest context se face un studiu asupra modului în care este utilizat terenul și asupra consecințelor pe care utilizarea nerațională o are asupra acestuia. Emisia de gaze în activitatea industrială și a gospodăriilor țărănești este un alt element căruia autorii îi acordă atenție, în ideea de a evidenția nivelul poluant ridicat pe care îl presupune atât activitatea industrială cât și activitatea de gospodărire țărănești. Pornind de la faptul că în activitatea economică, în procesele economice și industriale emisia de bioxid de carbon este un element evident poluant și dăunător vieții populației, se studiază situația existentă și măsurile care trebuiesc întreprinse în vederea raționalizării efectelor pe care le au aceste activități economice, foarte utile și benefi ce economiei, dar într-un fel deosebit e poluante. Se face un studiu comparativ pe statele membre evidențiind țările cu progrese deosebite în diminuarea efectelor emisiei de bioxid de carbon, precum și a altora cu sublinierile necesare în ceea ce privește întreprinderea de măsuri în vederea evitării emisiunii de bioxid de carbon. Studiul este bine prezentat însoțit de grafi ce și serii de date care atestă în mod cert concluziile pe care le putem desprinde în baza datelor certe publicate. Cuvinte cheie: mediu înconjurător, teren, emisie de gaze, resurse naturale, resurse productive Clasifi carea JEL: O13, Q24

Revista Română de Statistică - Supliment nr. 9 / 2017 129
Introducere În sistemul Uniunii Europene, mediul înconjurător reprezintă un element important care asigură evoluția economică a unei țări, condițiile de creștere, dar în același timp trebuie să constatăm că între mediul înconjurător și economie există o interdependență destul de serioasă. Această corelație dintre mediu și economie include impactul pe care îl are economia asupra conservării mediului, dar în același timp, reprezintă și infl uența pe care o are mediul asupra economiei. În consecință, analiza rolului mediului înconjurător trebuie să se realizeze prin a considera modul în care economia este organizată așa încât să asigure protecția mediului. Mediul economic poate fi analizat și
corelat astfel încât să se elimine activitățile poluante, să se asigure utilizarea resurselor naturale, să se creeze condițiile pentru ca guvernul și gospodăriile să desfășoare o activitate protectivă în ceea ce privește mediul înconjurător. De asemenea, un alt element este acela care se referă la costurile pe care le presupune protejarea mediului înconjurător și de aici, cât de efi cientă este
evoluția economică în condițiile în care un element important trebuie să îl constituie protejarea mediului.
Literature review Anghelache and Anghel (2017) au realizat o analiză referitoare mărimea și evoluția populației, pe total Uniunea Europeană, precum și pe fi ecare stat membru în parte și, mai ales, măsura în care evoluția reprezintă o garanție a resurselor de muncă. Anghelache, Anghel et al. (2017) au studiat strategia Uniunii europene în domeniul industriei, construcțiilor și serviciilor, care are la bază principiul sprijinirii unui mediu favorabil dezvoltării afacerilor. Leea și Brahmasreneb (2013) examinează relația de echilibru pe termen lung între turism, emisiile de CO2, creșterea economică și investițiile străine directe (ISD). Strand (2017) efectuează o analiză coerentă din punct de vedere analitic a factorilor care afectează valoarea pierderilor marginale ale pădurilor, concentrându-se asupra pădurilor tropicale. Angelsen (2010) face referire la politicile de reducere efi cientă a defrișărilor, precizând că o repartizare spațială a pădurilor rămase și a zonelor de producție intensive ar trebui să contribuie la reconcilierea obiectivelor de conservare și producție în viitor. Helsley and Strange (2007) consideră că numeroasele schimbări în circumstanțele economice și sociale au un impact asupra orașelor și a clusterelor din industrie, în măsura în care aglomerarea reprezintă un substitut pentru integrarea verticală. Kahn and Mansur (2013) analizează sectoarele industriale de producție care diferă în funcție de intensitatea lor energetică, raportul dintre forța de muncă și intensitatea poluării. Quamrul and Michalopoulos (2015) examinează originea climatică a difuzării agriculturii neolitice între țări și situri arheologice. Steen-

Romanian Statistical Review - Supplement nr. 9 / 2017130
Olsen (2012) utilizează un model multiregional de input-output pentru a evalua trei tipuri de amprente de mediu pentru statele membre ale Uniunii Europene. Seppala et al. (2011) au creat un model care poate fi utilizat pentru a analiza relația dintre fl uxurile de materiale, impactul asupra mediului și economia. Wilting and Vringer (2009) prezintă o imagine globală, comparând rezultatele pentru emisiile de CO2 sau de gaze cu efect de seră și utilizarea terenurilor pentru 12 zone ale lumii, cuprinzând 87de țări și regiuni. Bringezu et al. (2009) cuantifi că suprafața globală a terenului necesară pentru a satisface consumul german de produse agricole pentru alimentație și pentru consumul nealimentar și estimează emisiile de gaze cu efect de seră aferente, în special cele induse de schimbările de utilizare a terenurilor în țările tropicale.
Metodologia cercetării, date, rezultate şi discuţii
1. Utilizarea mediului, a pământului existent pe suprafața globului
sau în suprafața Uniunii Europene
Terenul, pământul este elementul de bază bilogic și uman cel mai important de pe planetă. Populația locuiește pe teren iar terenul oferă condiții supraviețuirii omenirii. Agricultura, pădurile, industria, transporturile, construcțiile, locuințele și orice alt serviciu nu se poate desfășura fără a se folosi terenul și resursele economice. Terenul de asemenea este parte integrantă a ecosistemului și este greu de separat în contextul biodiversității și emanțiilor de substanțe nocive. Când vorbim despre pământ putem să avem în vedere două concepte. Un prim concept este acela că pământul se referă la acoperirea biofi zică a planetei. Al doilea concept este acela care se referă la faptul că pământul indică condițiile socio-economice de utilizare a acestuia pentru agricultură, păduri, recreere, rezidență ș.a.m.d. Pădurile și zonele ocupate cu vegetație reprezintă cam 37,1% din totalul suprafețelor de teren, aceasta referindu-ne la totalul din Uniunea Europeană. Suprafețele acoperite cu păduri sunt mult mai bine reprezentate în partea de nord a continentului și întâlnim țări cu peste 60% suprafețe acoperite cu păduri cum sunt Finlanda, Suedia sau Slovenia. Danemarca, Ungaria și alte țări din zonă sunt state care au cam 50% din total suprafață acoperită cu păduri. Vegetația naturală și agricultura domină în multe state, cum ar fi Irlanda peste 63%, Marea Britanie peste 43%, iar Malta și Belarus au aproximativ 32,6% suprafețe acoperite. Cea mai mare suprafață din teritoriu Uniunii Europene este folosită pentru agricultură. Aceasta reprezenta cam 43,5% din totalul suprafeței. Suprafețele acoperite de păduri cuprind aproximativ 32%, în timp ce pentru servicii, construcții rezidențiale sau activități de recreere, se utilizează 5,7%. În fi gura 1 sunt reprezentate grafi c în mod procentual, felul în care sunt divizate categoriile de folosire a terenului pe suprafața totală a țărilor membre ale Uniunii Europene.
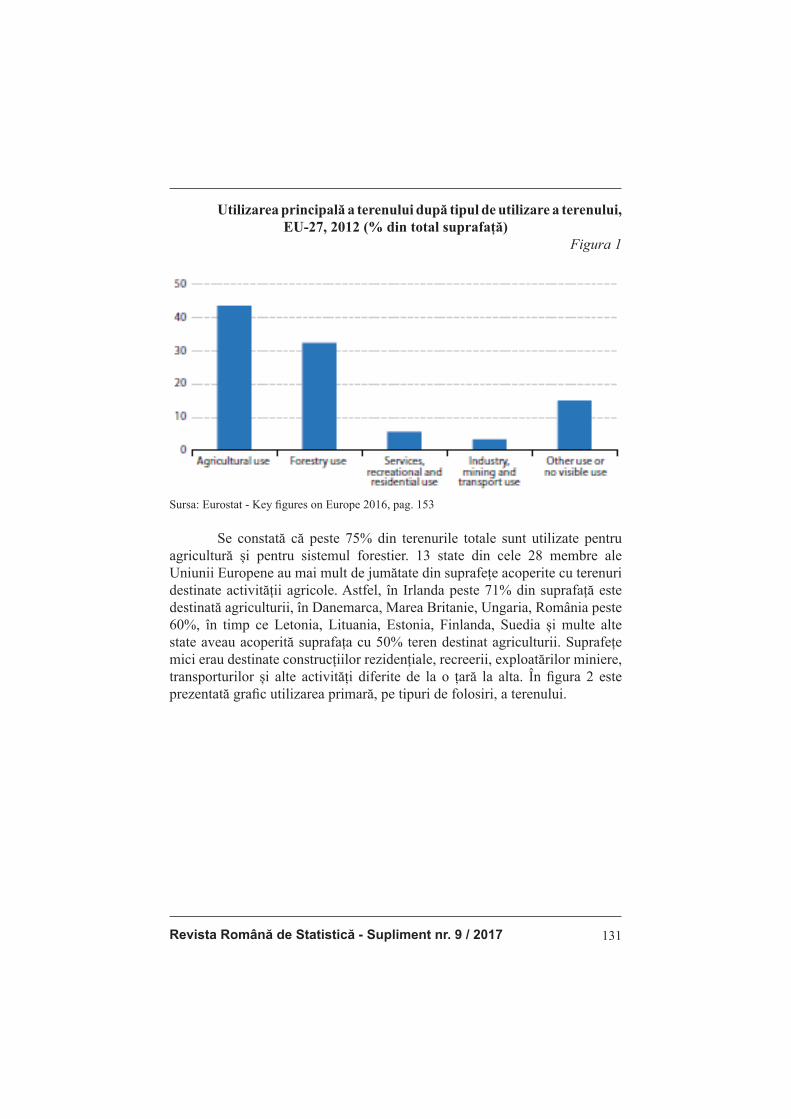
Revista Română de Statistică - Supliment nr. 9 / 2017 131
Utilizarea principală a terenului după tipul de utilizare a terenului,
EU-27, 2012 (% din total suprafață)
Figura 1
Sursa: Eurostat - Key fi gures on Europe 2016, pag. 153
Se constată că peste 75% din terenurile totale sunt utilizate pentru agricultură și pentru sistemul forestier. 13 state din cele 28 membre ale
Uniunii Europene au mai mult de jumătate din suprafețe acoperite cu terenuri
destinate activității agricole. Astfel, în Irlanda peste 71% din suprafață este destinată agriculturii, în Danemarca, Marea Britanie, Ungaria, România peste 60%, în timp ce Letonia, Lituania, Estonia, Finlanda, Suedia și multe alte state aveau acoperită suprafața cu 50% teren destinat agriculturii. Suprafețe mici erau destinate construcțiilor rezidențiale, recreerii, exploatărilor miniere, transporturilor și alte activități diferite de la o țară la alta. În fi gura 2 este prezentată grafi c utilizarea primară, pe tipuri de folosiri, a terenului.
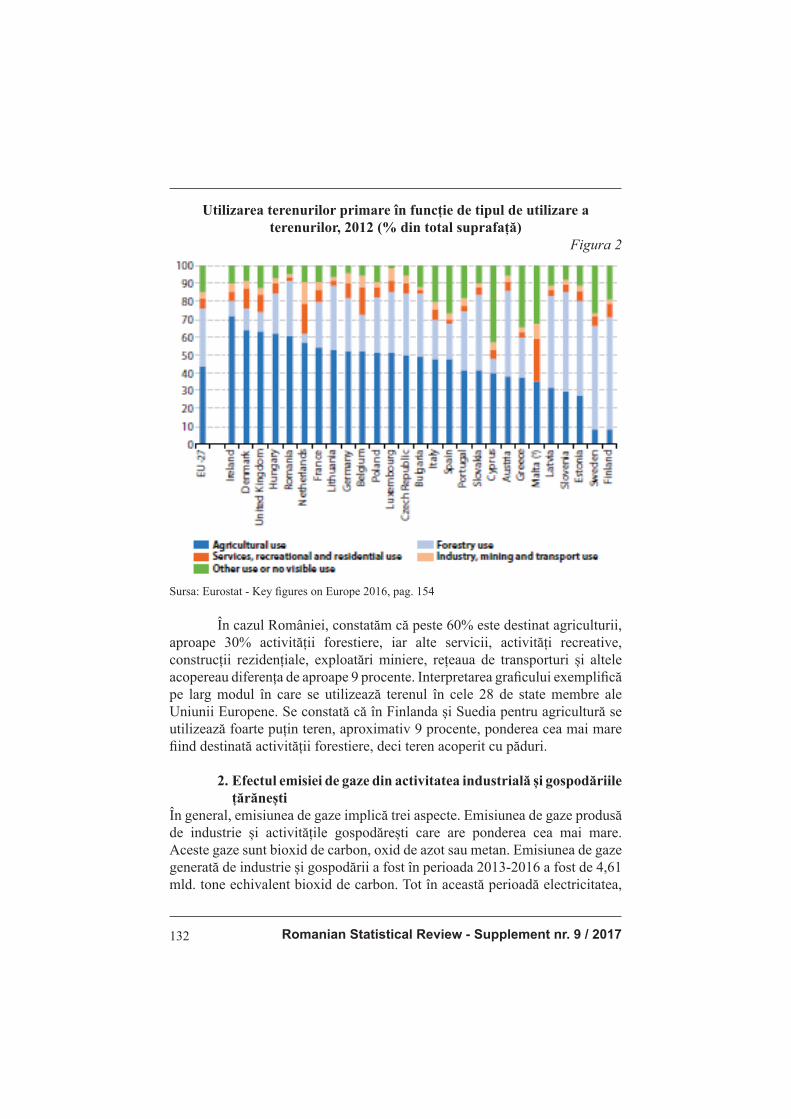
Romanian Statistical Review - Supplement nr. 9 / 2017132
Utilizarea terenurilor primare în funcție de tipul de utilizare a
terenurilor, 2012 (% din total suprafață)
Figura 2
Sursa: Eurostat - Key fi gures on Europe 2016, pag. 154
În cazul României, constatăm că peste 60% este destinat agriculturii, aproape 30% activității forestiere, iar alte servicii, activități recreative, construcții rezidențiale, exploatări miniere, rețeaua de transporturi și altele acopereau diferența de aproape 9 procente. Interpretarea grafi cului exemplifi că pe larg modul în care se utilizează terenul în cele 28 de state membre ale Uniunii Europene. Se constată că în Finlanda și Suedia pentru agricultură se utilizează foarte puțin teren, aproximativ 9 procente, ponderea cea mai mare fi ind destinată activității forestiere, deci teren acoperit cu păduri.
2. Efectul emisiei de gaze din activitatea industrială și gospodăriile
țărănești
În general, emisiunea de gaze implică trei aspecte. Emisiunea de gaze produsă de industrie și activitățile gospodărești care are ponderea cea mai mare. Aceste gaze sunt bioxid de carbon, oxid de azot sau metan. Emisiunea de gaze generată de industrie și gospodării a fost în perioada 2013-2016 a fost de 4,61 mld. tone echivalent bioxid de carbon. Tot în această perioadă electricitatea,

Revista Română de Statistică - Supliment nr. 9 / 2017 133
exploatarea gazelor, a condiționării unor alte activități, a avut o sferă foarte largă de emisie de gaze, care au fost de peste 26% din totalul gazelor emise. Sunt grupe de activitți care sunt însoțite de emisiunea de gaze cu efect deosebit de poluant și care trebuiesc controlate, trebuiesc limitate și reduse pentru
a putea asigura o protecșie cât mai bună a mediului înconjurător. Desigur, activitățile de transport sunt și ele poluante, mai ales cele care utilizează combustibili fosili, producând o sumedenie de efecte negative asupra calității mediului. De asemenea, problema se pune de a întreprinde măsuri de captare, de neutralizare, anulare a acestor emisiuni poluante. În fi gura 3 sunt prezentate grafi c pentru 2 ani, 2008 și 2013, emisiunea de gaze determinată de activitățile economice, evidențiindu-se procentual, ponderea emanației de gaze poluante de către activitățile desfășurate. Se constată că cea mai poluantă este producția de electricitate, gaze naturale, vapori și producția de aer condiționat care a fost de 28,6% în 2008 și 26,6% în 2013. Pe locul 2 se situează producția manufacturieră în 2008 (20,7%) și activitatea gospodăriilor în 2013 (19,6%).

Romanian Statistical Review - Supplement nr. 9 / 2017134
Emisiile de gaze de seră în funcție de activitățile economice
(% din total emisii, în echivalent CO2)
Figura 3
Sursa: Eurostat - Key fi gures on Europe 2016, pag. 156
Sunt prezentate în diagramă și celelalte activități și gradul de poluare, dar aceasta este procentual din totalul emisiunii de gaze. Important este ca

Revista Română de Statistică - Supliment nr. 9 / 2017 135
prin măsurile de protecție a mediului să se realizeze o reducere a emisiunii totale de gaze. În acest sens se utilizează și certifi catele verzi, cele care creează resurse pentru a se putea asigura o reducere a emanației de gaze, o protecție care să conserve mediul înconjurător, prezervând pe această cale condițiile de viață și de sănătate ale populației. În fi gura 4 este prezentată ponderea pe care o au emisiunile de gaze din activitățile economice poluante.
Emisiile de gaze de seră după activitatea economică și după agent
poluant, EU-28, 2013 (în mii tone echivalent CO2)
Figura 4
Sursa: Eurostat - Key fi gures on Europe 2016, pag. 157
Și din această reprezentare grafi că se constată că ponderea cea mai mare o are bioxidul de carbon emanat în special din activitățile privind producția de electricitate, a gazului, vaporilor și aerului condiționat, apoi de gospodăriile individuale, de activitatea manufacturieră, precum și de rețeaua de transporturi. În agricultură, emanația de gaze pe cele trei categorii, bioxid de carbon, metan și oxid de azot, se constată că metanul este cel mai des întâlnit, urmat de oxidul de azot și în fi nal de bioxidul de carbon care este atenuat prin procesul de fotosinteză al plantelor.
3. Analiza efectului emisiunii de bioxid de carbon din activitatea
de producție
Bioxidul de carbon este gazul cel mai des întâlnit ca emanație, fi ind cel care trebuie să fi e controlat și întreprinse măsuri care să asigure reducerea pe cât posibil a acestor emanații. În orice activitate economică este exclus să întâlnim emanații reduse, deoarece procesele chimice, naturale sau din producție au ca efect producerea de bioxid de carbon. În activitățile de

Romanian Statistical Review - Supplement nr. 9 / 2017136
investiții, indiferent că este vorba de construcții civile sau construcția de uzine și fabrici, utilizarea de instalații, vehicule și altele, bixidul de carbon este omniprezent și de aceea, în programul Uniunii Europene se prevăd o serie de
măsuri tehnologice, care să poată asigura o reducere a acestor emanații și mai ales neutralizarea acestora. Emisiunile de bioxid de carbon pot fi analizate și din punct de vedere al evoluției economiei, în sensul că, oricâte măsuri s-ar întreprinde, acestea toate au în cele din urmă, ca efect, emisiunea de gaze poluante. Desigur, sunt o serie de precizări și o serie de date care pot analiza care este producție de bioxid de carbon pe o persoană, datele fi ind corect evidențiate în fi gura 5, în care constatăm cantitățile de gaze pe o persoană exprimate în tone pe persoană.
Emisii de CO2 – din perspectiva producției și a consumului, EU-28, 2012
Figura 5
Sursa: Eurostat - Key fi gures on Europe 2016, pag. 158
Astfel, în activitatea de producție din Uniunea Europeană, emisiunea de dixid de carbon este de 4,94 tone/persoană. Emisiunile directe realizate de gospodăriile individuale, 1,67 tone/persoană, iar exporturile, certifi catele verzi, 1,91 tone/persoană. Pe de altă parte, emisiunea de gaze este prezentată și din punct de vedere al importului care se realizează în cadrul consumului, adică consumul este din importuri, din emisiunile din gospodării sau activități domestice, interne, care se realizează în fi ecare țară, în totalul Uniunii Europene. În tabelul 1 este sintetizată situația producției și importurilor de gaze emise de producători pe diverse activități economice. Astfel, sunt prezentate gazele poluante în consumul fi nal, cel intern sau importat, formarea

Revista Română de Statistică - Supliment nr. 9 / 2017 137
capitalului brut intern sau importat și emisiunea globală pe total economie, atât în cifre absolute exprimate în kg CO2/persoană, cât și în procente ca total structură a tutror activităților semnifi cative, selecționate și analizate.
Emisiile de CO2 interne și importate induse de utilizarea fi nală a produselor, UE-28, 2012
Tabelul 1
Sursa: Eurostat - Key fi gures on Europe 2016, pag. 159
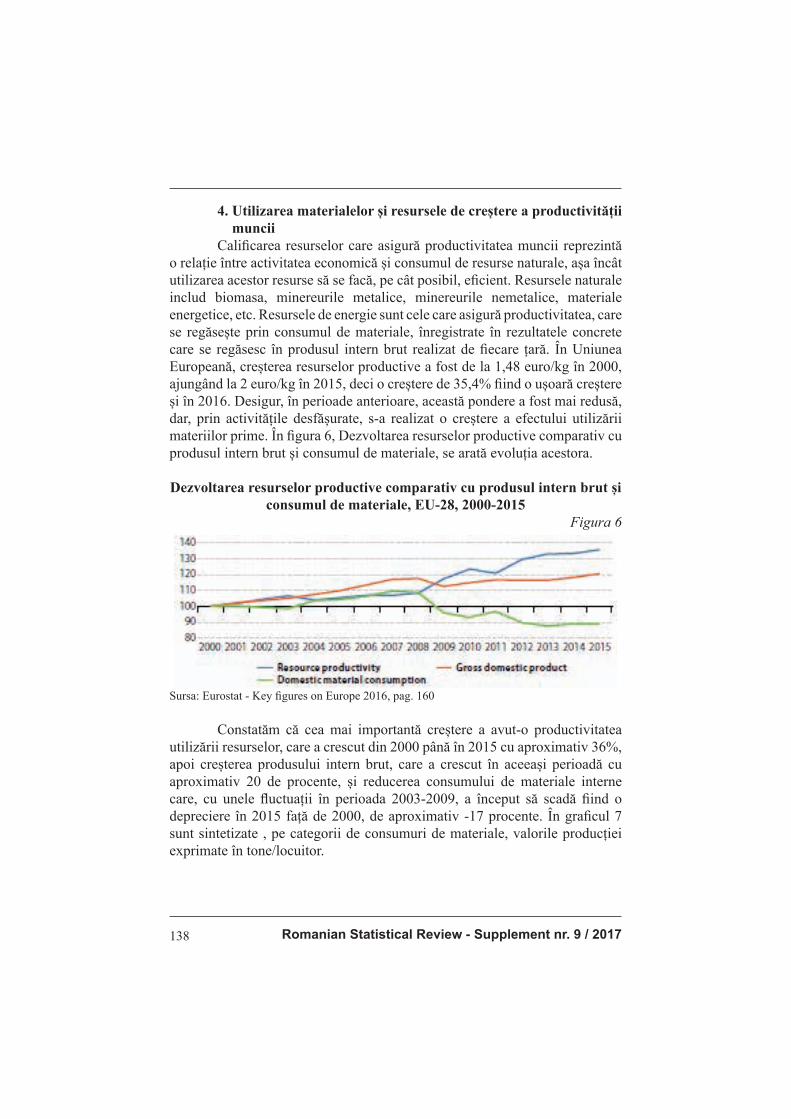
Romanian Statistical Review - Supplement nr. 9 / 2017138
4. Utilizarea materialelor și resursele de creștere a productivității
muncii
Califi carea resurselor care asigură productivitatea muncii reprezintă
o relație între activitatea economică și consumul de resurse naturale, așa încât utilizarea acestor resurse să se facă, pe cât posibil, efi cient. Resursele naturale includ biomasa, minereurile metalice, minereurile nemetalice, materiale energetice, etc. Resursele de energie sunt cele care asigură productivitatea, care se regăsește prin consumul de materiale, înregistrate în rezultatele concrete care se regăsesc în produsul intern brut realizat de fi ecare țară. În Uniunea Europeană, creșterea resurselor productive a fost de la 1,48 euro/kg în 2000, ajungând la 2 euro/kg în 2015, deci o creștere de 35,4% fi ind o ușoară creștere și în 2016. Desigur, în perioade anterioare, această pondere a fost mai redusă, dar, prin activitățile desfășurate, s-a realizat o creștere a efectului utilizării materiilor prime. În fi gura 6, Dezvoltarea resurselor productive comparativ cu produsul intern brut și consumul de materiale, se arată evoluția acestora.
Dezvoltarea resurselor productive comparativ cu produsul intern brut și
consumul de materiale, EU-28, 2000-2015
Figura 6
Sursa: Eurostat - Key fi gures on Europe 2016, pag. 160
Constatăm că cea mai importantă creștere a avut-o productivitatea utilizării resurselor, care a crescut din 2000 până în 2015 cu aproximativ 36%, apoi creșterea produsului intern brut, care a crescut în aceeași perioadă cu aproximativ 20 de procente, și reducerea consumului de materiale interne care, cu unele fl uctuații în perioada 2003-2009, a început să scadă fi ind o depreciere în 2015 față de 2000, de aproximativ -17 procente. În grafi cul 7 sunt sintetizate , pe categorii de consumuri de materiale, valorile producției exprimate în tone/locuitor.

Revista Română de Statistică - Supliment nr. 9 / 2017 139
Consumul intern de materiale pe principalele categorii de materiale, 2015 (tonnes per capita)
Figura 7
Sursa: Eurostat - Key fi gures on Europe 2016, pag. 161
În Finlanda ponderea este cea mai mare, aproape 30%, urmează Estonia, Luxemburg, ș.a.m.d. România având un consum de minerale nemetalifere de
aproximativ 18%, apoi de biomasă de aproximativ 5%, și minereuri de metal
sau materiale energetice fosile în cantități destul de rezonabile. Interpretarea se poate face și pentru celelalte state, pe care le avem reprezentate în acest grafi c.
Concluzii Corelația dintre mediu și economie se poate reduce și la relația cât de importantă și mare este producția și consumul de resurse naturale și energie, astfel încât să se realizeze protecția mediului înconjurător. Programe privind protecția mediului înconjurător la nivelul Uniunii europene au fost stabilite încă din 1970. Programele de protejare a mediului înconjurător se referă la măsurile cuprinse în Decizia 1386 din 2013 a Parlamentului European și Consiliului în care se stabilesc condițiile în care, conform titlului programului, putem supraviețui bine în limitele de protejare a planetei. Programele privind protejarea mediului înconjurător se întind până în 2020 și acestea cuprind liniile directoare existente în inițiativele strategice de până acum, respectiv efi ciența utilizării mediului, strategia biodiversității și nevoia de a reduce emisiunile de carbon.
Romanian Statistical Review - Supplement nr. 9 / 2017140
Bibliografi e 1. Angelsen, A. (2010). Policies for reduced deforestation and their impact on
agricultural production. Proceedings of the National Academy of Sciences, 107(46), 19639-19644
2. Anghelache, C. and Anghel, M.G. (2017). Analysis of population development - labour resources of member states of the European Union. Management&Gouvernance, 17, January-June 2017, 95-110
3. Anghelache, C., Anghel, M.G. et al. (2017). European Union Strategy For Industry, Trade And Services Development. Romanian Statistical Review, Supplement, 8, 145-158
4. Bringezu, S. et al. (2009). Global implications of biomass and biofuel use in Germany – Recent trends and future scenarios for domestic and foreign agricultural land use and resulting GHG emissions. Journal of Cleaner Production, 17, Supplement 1, S57-S68
5. Helsley, R.W. and Strange, W. C. (2007). Agglomeration, Opportunism, and the Organization of Production. Journal of Urban Economics, 62 (1), 55-75
6. Kahn, M. E., and Mansur, E. T. (2013). Do Local Energy Prices and Regulation Affect the Geographic Concentration of Employment?. Journal of Public Economics, 101, 105-114
7. Leea, J. W. and Brahmasreneb, T. (2013). Investigating the infl uence of tourism
on economic growth and carbon emissions: Evidence from panel analysis of the European Union. Tourism Management, 38, 69-76
8. Quamrul, A. and Michalopoulos, S. (2015). Climatic Fluctuations and the Diffusion of Agriculture, The Review of Economics and Statistics, MIT Press, 97 (3), 589-609
9. Seppala, J. et al. (2011). An assessment of greenhouse gas emissions and material fl ows caused by the Finnish economy using the ENVIMAT model. Journal of Cleaner Production, 19 (16), 1833-1841
10. Strand, J. (2017). Modeling the marginal value of rainforest losses: A dynamic value function approach. Ecological Economics, 131(C), 322–329
11. Steen-Olsen, K. et al. (2012). Carbon, Land, and Water Footprint Accounts for the European Union: Consumption, Production, and Displacements through International Trade. Environmental Science & Technology, 46 (20), 10883 -10891
12. Wilting, H. and Vringer, K. (2009). Carbon and land use accounting from a producer’s and a consumer’s perspective – an empirical examination covering the world. Economic Systems Research, 21 (3), 291-310
13. *** Eurostat - Key fi gures on Europe 2016
Revista Română de Statistică - Supliment nr. 9 / 2017 141
QUALITY OF THE ENVIRONMENT - A FACTOR OF SUSTAINABLE GROWTH
Assoc. prof. Mădălina-Gabriela ANGHEL PhD ([email protected])
„Artifex” University of Bucharest
Assoc. prof. Florin Paul Costel LILEA PhD (fl [email protected])
„Artifex” University of Bucharest
Ec. Ștefan Gabriel DUMBRAVĂ ([email protected])
Abstract In this article, the authors undertake a study of the environment in the Member States of the European Union in its complexity, as well as in each individual Member State. Attention is paid to the way in which the use of the environment and earth on the surface of the globe is related to the need to protect them. The authors highlight a number of issues related to the land used by the 27 member countries of the European Union (not mentioned in the 28th country that is theoretically in Brexit). Then, taking into account that the land can be used for agriculture, services, recreation and residential space, it is occupied by forests, is mined or used for transport or any other use. In this context, a study is made on how the land is used and the consequences that the unreasonable use has on it. Of course, the emission of gas in industrial activity and peasant households is another element to which the authors pay attention, in order to highlight the high polluting level of both industrial activity and peasant farming activity. Starting from the fact that in the economic activity, in the economic and industrial processes carbon dioxide emission is an obviously polluting and harmful element of the life of the population, the existing situation and the measures to be taken to rationalize the effects of these economic activities, very useful and benefi cial to the economy, but in a special way it is polluting. A comparative study is being carried out on Member States highlighting countries with particular advances in reducing the effects of carbon dioxide emissions and others with the necessary emphasis on undertaking measures to avoid carbon dioxide emissions. The study is well presented, accompanied by graphs and series of data that clearly certify the conclusions that we can draw from the published data. Keywords: environment, land, gas emissions, natural resources, productive resources JEL Classifi cation: O13, Q24

Romanian Statistical Review - Supplement nr. 9 / 2017142
Introduction In the European Union system, the environment is an important element that ensures the economic development of a country, the conditions of growth, but at the same time we have to fi nd that there is a fairly serious
interdependence between the environment and the economy. This correlation
between the environment and the economy includes the impact the economy
has on environmental conservation, but at the same time it also represents
the environmental impact on the economy. Consequently, the analysis of the
role of the environment must be achieved by considering how the economy
is organized in such a way as to ensure the protection of the environment.
The economic environment can be analyzed and correlated so as to eliminate
polluting activities, ensure the use of natural resources, create the conditions
for the government and households to carry out environmental protection
activities. It is also another element that relates to the costs involved in
protecting the environment and hence how effective economic progress is,
given that an important element must be protecting the environment. In other
news, the correlation between the environment and the economy can also be
reduced to how important and important the production and consumption of
natural resources and energy is, so that environmental protection is achieved.
Literature review Anghelache and Anghel (2017) carried out an analysis of the size
and evolution of the population, total of the European Union as well as of
each individual Member State, and especially the extent to which evolution
represents a guarantee of labor resources. Anghelache, Anghel et al. (2017)
studied the European Union’s strategy for industry, construction and services,
based on the principle of supporting a business-friendly environment. Leea
and Brahmasreneb (2013) examines the long-term equilibrium relationship
between tourism, CO2 emissions, growth and foreign direct investment (FDI).
Strand (2017) performs an analytically coherent analysis of factors that affect
the value of marginal forest losses, focusing on tropical forests. Angelsen
(2010) refers to policies to effectively reduce deforestation, stating that a spatial
distribution of the remaining forests and intensive production areas should
contribute to the reconciliation of conservation and production objectives in
the future. Helsley and Strange (2007) consider that many changes in economic
and social circumstances have an impact on cities and clusters in industry, as
cluster is a substitute for vertical integration. Kahn and Mansur (2013) analyze
the industrial production sectors that differ according to their energy intensity,
the labor-to-pollution ratio. Quamrul and Michalopoulos (2015) examine the
climatic origin of the dissemination of Neolithic agriculture between countries

Revista Română de Statistică - Supliment nr. 9 / 2017 143
and archaeological sites. Steen-Olsen (2012) uses a multi-region input-output model to assess three types of environmental footprint for EU Member States. Seppala et al. (2011) have created a model that can be used to analyze the relationship between material fl ows, environmental impact and the economy.
Wilting and Vringer (2009) present a global picture, comparing the results
for CO2 or greenhouse gas emissions and land use for 12 areas of the world,
including 87 countries and regions. Bringezu et al. (2009) quantify the total
area of land needed to meet the German consumption of agricultural products
for food and non-food consumption and estimates the associated greenhouse
gas emissions, especially those caused by changes in land use in tropical
countries.
Research methodology, data, results and discussions 1. The use of the environment, of the earth existing on the surface
of the globe or in the European Union The land, the earth is the most important biological and human
element of the planet. The population lives on the land and the land provides
the conditions for the survival of humanity. Agriculture, forests, industry,
transport, construction, housing and any other service can not be carried out
without the use of land and economic resources. The land is also an integral
part of the ecosystem and is diffi cult to separate in the context of biodiversity
and harmful emissions. When talking about the earth, we can consider two
concepts. A fi rst concept is that the Earth refers to the biophysical coverage of
the planet. The second concept is that the land indicates the socio-economic
conditions for its use for agriculture, forests, recreation, residence, and so on.
Forests and areas occupied with vegetation account for about 37.1% of the
total land area, referring to the total in the European Union. Areas covered
with forests are much better represented in the northern part of the continent
and we meet countries with more than 60% forest-covered areas such as
Finland, Sweden or Slovenia. Denmark, Hungary and other countries in the
area are states that account for about 50% of the total forest area. Natural
vegetation and agriculture dominate in many countries, such as Ireland over
63%, the UK over 43%, and Malta and Belarus have approximately 32.6%
covered areas. The largest area in the European Union is used for agriculture.
This represented about 43.5% of the total area. Areas covered by forests cover
about 32%, while for services, residential buildings or leisure activities, 5.7%
are used. Figure 1 graphically represents, in percentage terms, the way in
which the land use categories are divided on the total area of the European
Union member countries.

Romanian Statistical Review - Supplement nr. 9 / 2017144
Main land use by land use type, EU-27, 2012 % of total area)Figure 1
Source: Eurostat - Key fi gures on Europe 2016, p. 153
It is found that over 75% of the total land is used for agriculture and
for the forestry system. 13 states in the 28 EU Member States have more than
half of the land covered by agricultural land. In Ireland over 71% of the area is
for agriculture in Denmark, Great Britain, Hungary, Romania over 60%, while
Latvia, Lithuania, Estonia, Finland, Sweden and many other states covered
the area with 50% agriculture. Small areas were for residential, recreation,
mining, transportation and other activities across countries. Figure 2 shows
graphically the primary use of land by types of use.

Revista Română de Statistică - Supliment nr. 9 / 2017 145
Primary land use by land use type, 2012 % of total area)Figure 2
Source: Eurostat - Key fi gures on Europe 2016, p. 154
In the case of Romania, we fi nd that over 60% is destined for agriculture,
almost 30% of the forestry activity, and other services, recreational activities,
residential construction, mining, transport network and others covered the
difference of almost 9%. The Interpretation of the Graph illustrates the way
land is used in the 28 Member States of the European Union. It is noted that in
Finland and Sweden for agriculture, very little land is used, about 9 percent,
the largest share being for forestry activity, hence land covered with forests.
2. Effect of gas emissions from industrial activity and peasant farms
In general, the issue of gas involves three aspects. The gas emissions from
industry and households with the highest share. These gases are carbon dioxide,
nitrogen oxide or methane. The gas emission generated by industry and
households over the period 2013-2016 was 4.61 billion tons of carbon dioxide
equivalent. At the same time, electricity, gas exploitation, conditioning of other
activities had a very wide sphere of gas emissions, which was over 26% of the
total gas emissions. There are groups of activities that are accompanied by the
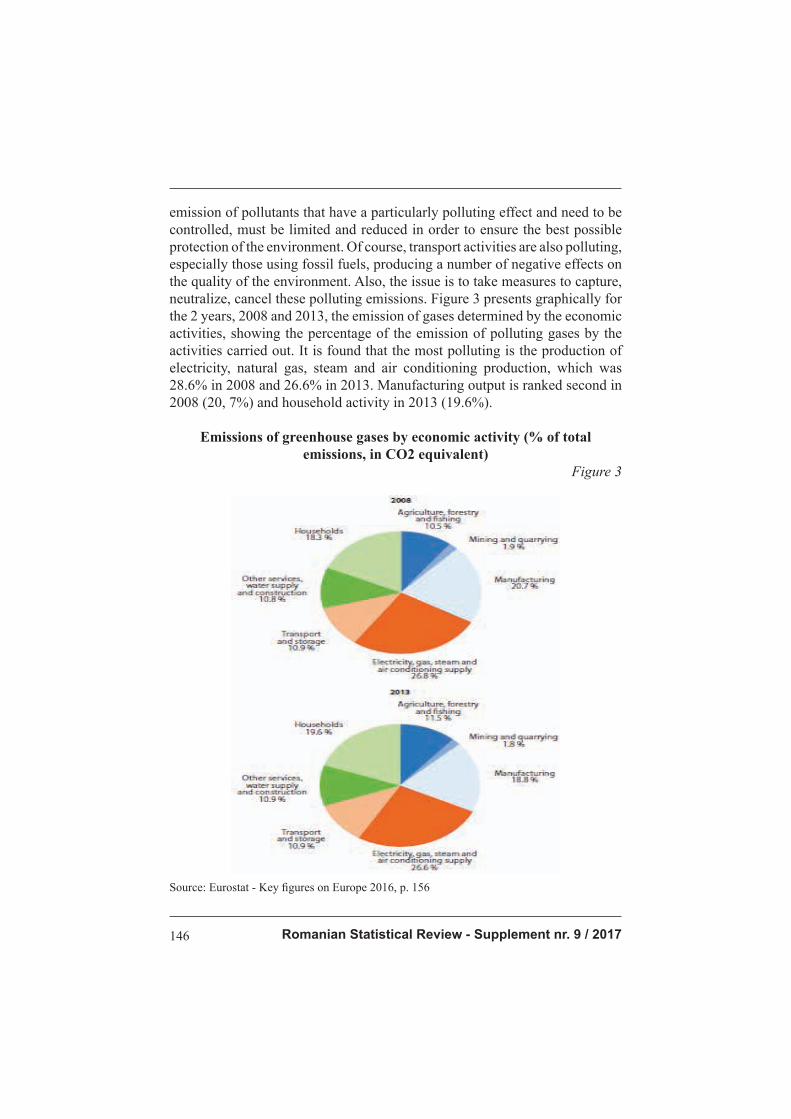
Romanian Statistical Review - Supplement nr. 9 / 2017146
emission of pollutants that have a particularly polluting effect and need to be controlled, must be limited and reduced in order to ensure the best possible protection of the environment. Of course, transport activities are also polluting, especially those using fossil fuels, producing a number of negative effects on the quality of the environment. Also, the issue is to take measures to capture, neutralize, cancel these polluting emissions. Figure 3 presents graphically for the 2 years, 2008 and 2013, the emission of gases determined by the economic activities, showing the percentage of the emission of polluting gases by the activities carried out. It is found that the most polluting is the production of electricity, natural gas, steam and air conditioning production, which was 28.6% in 2008 and 26.6% in 2013. Manufacturing output is ranked second in 2008 (20, 7%) and household activity in 2013 (19.6%).
Emissions of greenhouse gases by economic activity (% of total emissions, in CO2 equivalent)
Figure 3
Source: Eurostat - Key fi gures on Europe 2016, p. 156

Revista Română de Statistică - Supliment nr. 9 / 2017 147
Other activities and pollution are shown in the chart, but this is a percentage of total gas emissions. It is important that the environmental protection measures achieve a reduction in total gas emissions. Green certifi cates, which create resources to ensure a reduction in greenhouse gas
emissions, protect the environment, thereby preserving the living and health
conditions of the population, are also used in this respect. Figure 4 shows the
share of gas emissions from polluting economic activities.
Emissions of greenhouse gases by economic activity and after pollutant, EU-28, 2013 (in thousands of tonnes of CO2 equivalent)
Figure 4
Source: Eurostat - Key fi gures on Europe 2016, p. 157
It is also from this graphical representation that carbon dioxide emitted
mainly from activities related to electricity, gas, vapor and air conditioning,
then to individual households, to the manufacturing activity, as well as
to the transport network . In agriculture, the emission of gases in the three
categories, carbon dioxide, methane and nitrogen oxide, methane is found to
be the most common, followed by nitrogen oxide and fi nally carbon dioxide
that is attenuated by the photosynthesis process of plants.
3. Analysis of the effect of carbon dioxide emissions on production activity
Carbon dioxide is the most common gas as emanation, being the
one to be controlled and steps taken to ensure that these emanations are
reduced as much as possible. In any economic activity it is excluded to meet

Romanian Statistical Review - Supplement nr. 9 / 2017148
low emissions, because chemical, natural or production processes have the effect of producing carbon dioxide. In the investment activities, whether it is civil engineering or the construction of factories and factories, the use of installations, vehicles and others, carbon dioxide is omnipresent, and therefore the EU program foresees a series of technological measures can provide a reduction of these emanations and especially their neutralization. Carbon dioxide emissions can also be analyzed from the point of view of the evolution of the economy, meaning that no matter how many measures are taken, they ultimately have the effect of emitting polluting gases. Of course, there are a number of specifi cations and a series of data that can analyze what is carbon
dioxide production per person, the data being correctly highlighted in Figure
5, where we fi nd the gas quantities per person expressed in tons per person.
CO2 emissions - from production and consumption perspective, EU-28, 2012
Figure 5
Source: Eurostat - Key fi gures on Europe 2016, p. 158
Thus, in the production activity in the European Union, the carbon
dioxide emission is 4.94 tons / person. Direct emissions from individual
households, 1.67 tons / person, and exports, green certifi cates, 1.91 tons /
person. On the other hand, the issue of gas is also presented in terms of the
import that is made in consumption, ie the consumption is from imports, from
domestic households or domestic activities, which are made in each country
in the total of the Union European. Table 1 summarizes the production and

Revista Română de Statistică - Supliment nr. 9 / 2017 149
imports of gas produced by producers on various economic activities. Thus, the pollutant gases in fi nal consumption, internal or imported consumption, the
gross domestic or imported capital formation and the total economy in total
economy, both in absolute fi gures expressed in kg CO2 per person and as a
percentage of total structure of all signifi cant activities , selected and analyzed.
Domestic and imported CO2 emissions induced by fi nal use of products, EU-28, 2012
Table 1
Source: Eurostat - Key fi gures on Europe 2016, p. 159

Romanian Statistical Review - Supplement nr. 9 / 2017150
4. Use of materials and resources to increase labor productivity Qualifying resources that ensure labor productivity is a relationship between economic activity and consumption of natural resources so that the use of these resources is made as effi cient as possible. Natural resources
include biomass, metal ores, non-metallic ores, energy materials, etc. Energy
resources are those that ensure productivity, which is found through the
consumption of materials, recorded in the concrete results of each country’s
gross domestic product. In the European Union, the increase in productive
resources was from 1.48 euro / kg in 2000, reaching 2 euro / kg in 2015,
so a 35.4 per cent increase is also a slight increase in 2016. Of course, in
earlier periods , this share was lower but, through the activities carried out, an
increase of the raw material use effect was achieved. In Figure 6, Developing
Productive Resources Compared to Gross Domestic Product and Consumption
of Materials, shows their evolution.
Figure 6. Development of productive resources compared to gross domestic product and consumption of materials, EU-28, 2000-2015
Source: Eurostat - Key fi gures on Europe 2016, p. 160
We fi nd that the most signifi cant increase was recorded in the resource
utilization productivity, which grew by about 36% from 2000 to 2015, then the
increase in gross domestic product, which increased over the same period by
about 20 percent, and the reduction in material consumption which, with some
fl uctuations in the period 2003-2009, started to decline, being a depreciation
in 2015 compared to 2000, of about -17 percent. Graph 7 summarizes the
production values expressed in tonnes per capita by material consumption
categories..
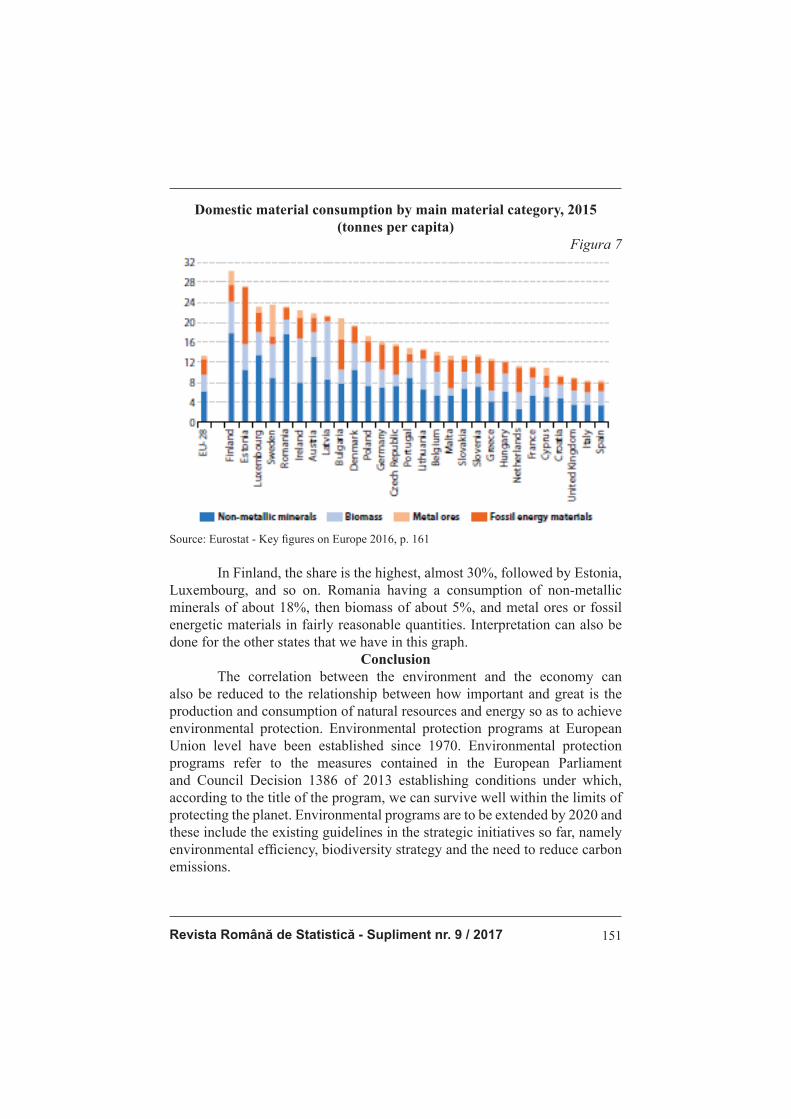
Revista Română de Statistică - Supliment nr. 9 / 2017 151
Domestic material consumption by main material category, 2015 (tonnes per capita)
Figura 7
Source: Eurostat - Key fi gures on Europe 2016, p. 161
In Finland, the share is the highest, almost 30%, followed by Estonia,
Luxembourg, and so on. Romania having a consumption of non-metallic
minerals of about 18%, then biomass of about 5%, and metal ores or fossil
energetic materials in fairly reasonable quantities. Interpretation can also be
done for the other states that we have in this graph.
Conclusion The correlation between the environment and the economy can
also be reduced to the relationship between how important and great is the
production and consumption of natural resources and energy so as to achieve
environmental protection. Environmental protection programs at European
Union level have been established since 1970. Environmental protection
programs refer to the measures contained in the European Parliament
and Council Decision 1386 of 2013 establishing conditions under which,
according to the title of the program, we can survive well within the limits of
protecting the planet. Environmental programs are to be extended by 2020 and
these include the existing guidelines in the strategic initiatives so far, namely
environmental effi ciency, biodiversity strategy and the need to reduce carbon
emissions.

Romanian Statistical Review - Supplement nr. 9 / 2017152
References 1. Angelsen, A. (2010). Policies for reduced deforestation and their impact on
agricultural production. Proceedings of the National Academy of Sciences, 107(46), 19639-19644
2. Anghelache, C. and Anghel, M.G. (2017). Analysis of population development - labour resources of member states of the European Union. Management&Gouvernance, 17, January-June 2017, 95-110
3. Anghelache, C., Anghel, M.G. et al. (2017). European Union Strategy For Industry, Trade And Services Development. Romanian Statistical Review, Supplement, 8, 145-158
4. Bringezu, S. et al. (2009). Global implications of biomass and biofuel use in Germany – Recent trends and future scenarios for domestic and foreign agricultural land use and resulting GHG emissions. Journal of Cleaner Production, 17, Supplement 1, S57-S68
5. Helsley, R.W. and Strange, W. C. (2007). Agglomeration, Opportunism, and the Organization of Production. Journal of Urban Economics, 62 (1), 55-75
6. Kahn, M. E., and Mansur, E. T. (2013). Do Local Energy Prices and Regulation Affect the Geographic Concentration of Employment?. Journal of Public Economics, 101, 105-114
7. Leea, J. W. and Brahmasreneb, T. (2013). Investigating the infl uence of tourism
on economic growth and carbon emissions: Evidence from panel analysis of the European Union. Tourism Management, 38, 69-76
8. Quamrul, A. and Michalopoulos, S. (2015). Climatic Fluctuations and the Diffusion of Agriculture, The Review of Economics and Statistics, MIT Press, 97 (3), 589-609
9. Seppala, J. et al. (2011). An assessment of greenhouse gas emissions and material fl ows caused by the Finnish economy using the ENVIMAT model. Journal of Cleaner Production, 19 (16), 1833-1841
10. Strand, J. (2017). Modeling the marginal value of rainforest losses: A dynamic value function approach. Ecological Economics, 131(C), 322–329
11. Steen-Olsen, K. et al. (2012). Carbon, Land, and Water Footprint Accounts for the European Union: Consumption, Production, and Displacements through International Trade. Environmental Science & Technology, 46 (20), 10883 -10891
12. Wilting, H. and Vringer, K. (2009). Carbon and land use accounting from a producer’s and a consumer’s perspective – an empirical examination covering the world. Economic Systems Research, 21 (3), 291-310
13. *** Eurostat - Key fi gures on Europe 2016

Revista Română de Statistică - Supliment nr. 9 / 2017 153
Conservarea calităţii apei şi protecţiei mediului în contextul creşterii economice
Prof. univ. dr. Constantin ANGHELACHE ([email protected])
Academia de Studii Economice din București / Universitatea „Artifex” din București
Drd. Doina AVRAM ([email protected])
Academia de Studii Economice din BucureștiDrd. Doina BUREA ([email protected])
Academia de Studii Economice din București
Abstract În acest articol se pleacă de la faptul că bogățiile naturale ale unor țări membre ale Uniunii Europene sunt exploatate în mod benefi c, dar de multe ori se efectuează o valorifi care care are ca efect, secundar dar foarte periculos, poluarea mediului, afectarea calității mediului înconjurător. Într-un mod cu totul deosebit, calitatea apei, ale cărei resurse sunt într-o continuă scădere în ultima perioadă de timp este pe larg analizată și se face o apreciere în legătură cu perspectiva ca aceste resurse de apă să se diminueze impunând măsuri de protejare a exploatării resurselor de apă de care dispun țările membre ale Uniunii Europene. În mod cert, și alte aspecte în legătură cu cursul pe care îl presupune utilizarea apei și a altor măsuri de protejare a mediului trebuie privite în comparație cu efectul pozitiv asupra condițiilor de viață care trebuie protejate de efectele negative ale dezvoltării economice. Autorii fac un studiu uneori amănunțit utilizând datele publicate de Eurostat pentru a evidenția standardul pe care îl dobândește fi ecare stat și mai ales nevoia individuală a fi ecăruia de a întreprinde măsuri noi, măsuri suplimentare pentru a atinge standardele impuse de Uniunea Europeană prin directivele sale, care reglemetează această activitate. Cuvinte cheie: resurse de apă, economia mediului, protecția mediului, taxe de mediu, cheltuieli pentru protecția mediului Clasifi carea JEL: H23, Q25
Introducere Mediul înconjurător trebuie protejat fi ind un factor care contribuie la asigurarea unei creșteri sustenabile a economiilor, concomitent cu protejarea
acestora de efectele dăunătoare ale exploatării neraționale. Sunt unele țări,
printre care și România, care mai au încă de întreprins măsuri importante în vederea asigurării unor standarde convenabile, rezonabile, asupra calității
mediului. Materialele valorifi cate în procesul industrial nu pot să nu aibă

Romanian Statistical Review - Supplement nr. 9 / 2017154
efecte negative asupra situației mediului înconjurător. Apa, izvor rațional al vieții, este tratat cu mare atenție deoarece pe de o parte asigură condițiile de viață, iar pe de altă parte tot apa, asigură o regularizare a ciclului climatic.
Literature review Anghelache și Anghel (2017) analizează strategia Uniunii Europene pentru îmbunătățirea condițiilor de trai, atât pe total UE, cât și în fi ecare stat membru, bazată pe respectarea drepturilor fundamentale ale omului și analizează indicatori care care evidențiază pericolul de sărăcie. Anghelache, Anghel and Panait (2017) studiază principalele rezultate economico-fi nanciare și sociale ale statelor membre din Uniunea Europeană, precum și perspective ale evoluției acestora. Seria de cărți realizate de Anghelache (1999-2016) descriu în detaliu statutul economic al României, incluzând o analiză aprofundată și complexă a standardului de viață al populației. Hayes and Skubala (2009) analizează riscurile pentru sănătatea umană cauzate de prezența plumbului în apa potabilă. De Stefano (2010) prezintă o evaluare a calității participării părților interesate la începutul punerii în aplicare a Directivei Cadru a Apei în douăzeci de țări aparținând UE sau fi ind cu relații instituționale apropiate cu UE. Bozbas (2008) studiază caracteristicile combustibililor din biomotorină și producția sa în Uniunea Europeană. Tol (2009) studiază impactul economic al schimbărilor climatice. Schreurs și Tiberghien (2007) caracteristicile explicării conducerii Uniunii Europene în contextul atenuării schimbărilor climatice. Wang și colab. (2017) investighează efectele transfrontaliere legate de apa-electricitate (WEN) asupra vulnerabilității apelor dulci în America continentală. Deschênes and Greenstone (2012) măsoară impactul economic al schimbărilor climatice asupra terenurilor agricole din SUA prin estimarea efectului variației aleatorii de la an la an la temperaturi și precipitații asupra profi turilor agricole. Saiz (2010) arată că geografi a este un factor cheie în dezvoltarea urbană contemporană, realizând un studiu, bazat pe datele referitoare la suprafețele de teren și a prezenței corpurilor de apă, în scopul estimării cu exactitate a cantității de teren dezvoltabil în zonele metropolitane. Hansen și colab. (2013) ilustrează o înregistrare globală consistentă și locală a schimbării pădurilor, arătând că pierderea pădurilor boreale cauzată, în mare măsură, focului și silviculturii, a fost a doua în raport cu cea din tropice, atât în termeni absoluți cât și proporționali.
Metodologia cercetării, date, rezultate şi discuţii
1. Apa
Apa este izvorul natural al vieții. Este resursă indispensabilă a economiei și este elementul natural care asigură regularizarea ciclului climatic. Organizarea și protecția exploatării resurselor de apă, a apei dulci sau a apelor

Revista Română de Statistică - Supliment nr. 9 / 2017 155
salinizate, a apei pentru consumul individual, a apei utilizate în activitățile economice, și multe altele, reprezintă sursa de bază a activității. Apa circulă în natură dar resursele de apă sunt limitate și studii ale organismelor internaționale arată că pe măsura încălzirii globale se ajunge la limitarea acestor resurse care trebuiesc protejate. În țările membre ale Uniunii Europene există o strategie comună care trebuie urmată și în baza căreia resursele de apă dulce trebuie asigurate pe termen îndelungat. Categoriile de apă care circulă în natură pot fi reprezentate prin cantitatea de precipitații căzute, volumul evaporării, circuitul intern, circuitul extern, totalitatea resurselor de apă dulce și resursele care se anticipează. În tabelul 1, pe fi ecare stat și pe total resursă individuală sau cumulată, se arată care este pe termen lung, media pe care o anticipăm.
Resurse de apă dulce – media anuală pe termen lung, (bilioane m3)
Tabelul 1
Sursa: Eurostat - Key fi gures on Europe 2016, pag. 165
În cazul României, din precipitații se înregistrează anual 154 mld. m3, din evaporare 114,6 mld. m3, din circuitul intern 39,4 mld. m3, circuitul extern

Romanian Statistical Review - Supplement nr. 9 / 2017156
2,9 mld. m3, apoi însumate aceste resurse ajung la 42,3 mld. m3, cu o rezervă de 7,9 mld. m3. Constatăm că în funcție de situația geografi că, de regimul hidrografi c și celelalte țări acordă atenție conservării resurselor de apă, caută să economisească resursele de apă și mai ales caută să evite poluarea resurselor de apă. Există sisteme naționale care asigură protejarea acestor resurse de apă. Există o sumedenie de alte analize care arată cantitatea de resurse de apă exploatate, cantitatea de resurse conservate și mai ales cantitatea totală de resurse de apă furnizată în m3/locuitor. Desigur, aceste date sunt prezentate anual. În fi gura 1 se prezintă o astfel de structură, care în cazul României aceasta este de aproximativ 49 m3 pe un cetățean.
Captarea totală a apei dulci prin alimentarea cu apă, 2013 (m³ pe locuitor)
Figura 1
Sursa: Eurostat - Key fi gures on Europe 2016, pag. 166
Țări ca Italia, Irlanda, Croația, Islanda, Norvegia și altele care au condiții naturale și rețea hidrografi că internă și apropiată mult mai bine pusă la punct au cantități mult mai mari de resurse exploatate și resurse conservate de apă. În literatura de specialitate se vorbește foarte adesea despre pericolul crizei resurselor de apă care pot afecta zone geografi ce sau chiar se pot extinde asupra întregii populații.
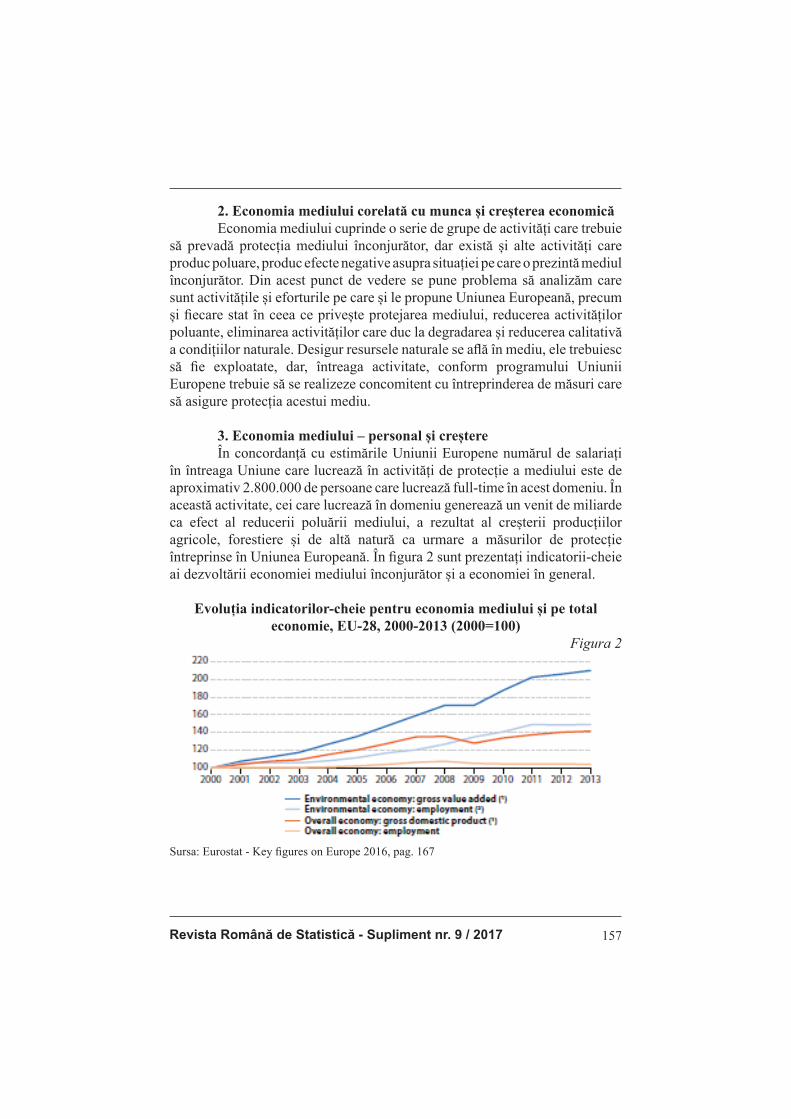
Revista Română de Statistică - Supliment nr. 9 / 2017 157
2. Economia mediului corelată cu munca și creșterea economică
Economia mediului cuprinde o serie de grupe de activități care trebuie să prevadă protecția mediului înconjurător, dar există și alte activități care produc poluare, produc efecte negative asupra situației pe care o prezintă mediul înconjurător. Din acest punct de vedere se pune problema să analizăm care sunt activitățile și eforturile pe care și le propune Uniunea Europeană, precum și fi ecare stat în ceea ce privește protejarea mediului, reducerea activităților poluante, eliminarea activităților care duc la degradarea și reducerea calitativă a condițiilor naturale. Desigur resursele naturale se afl ă în mediu, ele trebuiesc să fi e exploatate, dar, întreaga activitate, conform programului Uniunii Europene trebuie să se realizeze concomitent cu întreprinderea de măsuri care să asigure protecția acestui mediu.
3. Economia mediului – personal și creștere
În concordanță cu estimările Uniunii Europene numărul de salariați în întreaga Uniune care lucrează în activități de protecție a mediului este de aproximativ 2.800.000 de persoane care lucrează full-time în acest domeniu. În această activitate, cei care lucrează în domeniu generează un venit de miliarde ca efect al reducerii poluării mediului, a rezultat al creșterii producțiilor agricole, forestiere și de altă natură ca urmare a măsurilor de protecție întreprinse în Uniunea Europeană. În fi gura 2 sunt prezentați indicatorii-cheie ai dezvoltării economiei mediului înconjurător și a economiei în general.
Evoluția indicatorilor-cheie pentru economia mediului și pe total
economie, EU-28, 2000-2013 (2000=100)
Figura 2
Sursa: Eurostat - Key fi gures on Europe 2016, pag. 167
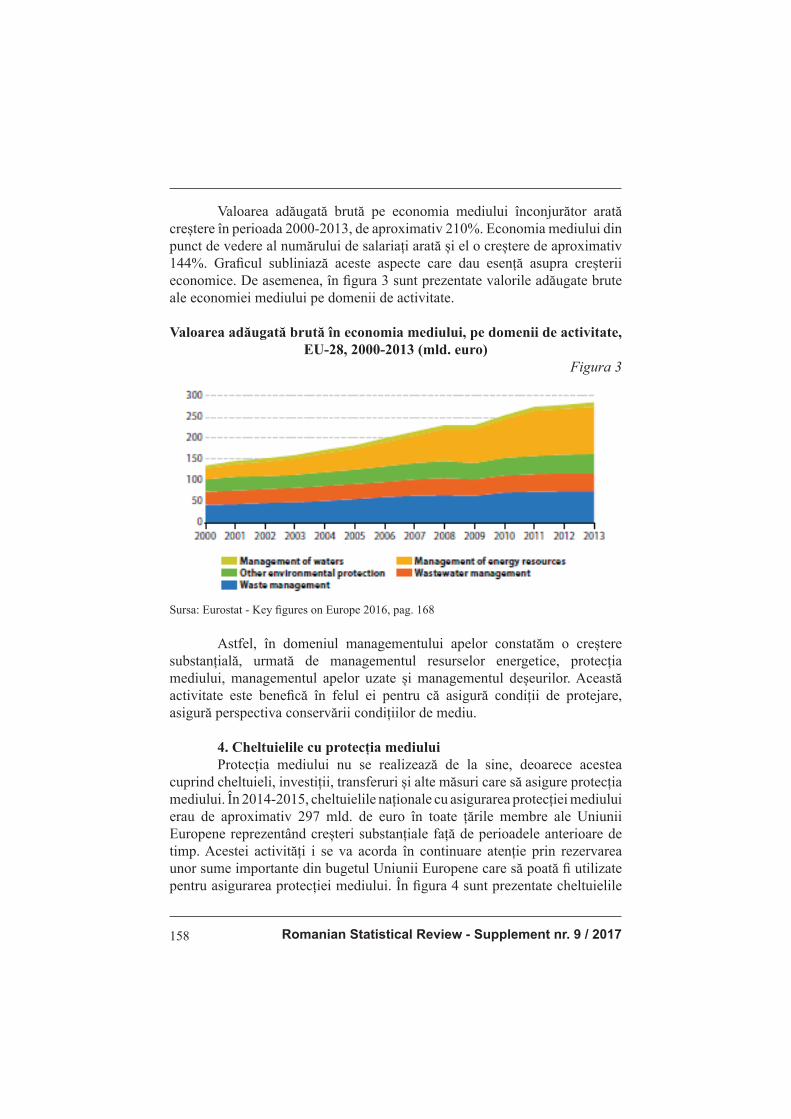
Romanian Statistical Review - Supplement nr. 9 / 2017158
Valoarea adăugată brută pe economia mediului înconjurător arată creștere în perioada 2000-2013, de aproximativ 210%. Economia mediului din
punct de vedere al numărului de salariați arată și el o creștere de aproximativ
144%. Grafi cul subliniază aceste aspecte care dau esență asupra creșterii economice. De asemenea, în fi gura 3 sunt prezentate valorile adăugate brute ale economiei mediului pe domenii de activitate.
Valoarea adăugată brută în economia mediului, pe domenii de activitate,
EU-28, 2000-2013 (mld. euro)
Figura 3
Sursa: Eurostat - Key fi gures on Europe 2016, pag. 168
Astfel, în domeniul managementului apelor constatăm o creștere substanțială, urmată de managementul resurselor energetice, protecția mediului, managementul apelor uzate și managementul deșeurilor. Această activitate este benefi că în felul ei pentru că asigură condiții de protejare, asigură perspectiva conservării condițiilor de mediu.
4. Cheltuielile cu protecția mediului
Protecția mediului nu se realizează de la sine, deoarece acestea cuprind cheltuieli, investiții, transferuri și alte măsuri care să asigure protecția mediului. În 2014-2015, cheltuielile naționale cu asigurarea protecției mediului erau de aproximativ 297 mld. de euro în toate țările membre ale Uniunii Europene reprezentând creșteri substanțiale față de perioadele anterioare de timp. Acestei activități i se va acorda în continuare atenție prin rezervarea unor sume importante din bugetul Uniunii Europene care să poată fi utilizate pentru asigurarea protecției mediului. În fi gura 4 sunt prezentate cheltuielile

Revista Română de Statistică - Supliment nr. 9 / 2017 159
pentru protecția mediului în toate cele 28 de state în perioada 2006-2014, datele fi ind exprimate ca procent din totalul produsului intern brut al tuturor țărilor membre ale Uniunii Europene.
Cheltuieli privind protecția mediului, EU-28, 2006-2014 ( mil. euro și %
din PIB)
Figura 4
Sursa: Eurostat - Key fi gures on Europe 2016, pag. 169
Astfel constatăm că în cifră globală, cheltuielile pentru protecția mediului reprezentau în anul 2006 aproximativ 249 mld. de euro, adică aproape 2,5% din produsul intern brut al tuturor țărilor comunitare, crescând în anul 2014 la 297 mld. euro, adică aproape 3% din produsul intern brut al tuturor țărilor membre ale Uniunii Europene. În funcție de benzile prin care se reprezintă cheltuielile este trasată și o curbă care arată care a fost creșterea cheltuielilor cu protecția mediului înconjurător comparativ cu creșterea produsului intern brut. În fi gura 5 sunt prezentate investițiile în protecția mediului realizate de toate statele membre ale Uniunii Europene în perioada 2006-2014 exprimate în mil. euro și în total investiții efectuate în Uniunea Europeană.

Romanian Statistical Review - Supplement nr. 9 / 2017160
Investiții privind protecția mediului, EU-28, 2006-2014 ( mil. euro și %
din investițiile totale)
Figura 5
Sursa: Eurostat - Key fi gures on Europe 2016, pag. 170
Se constată că în perioada 2006-2014 cheltuielile guvernamentale au urmat un trend aproximativ constant fi ind de 35 mld. euro în 2006, 37-38 de
mld. în 2007, 39 mld. în 2008, scăzând apoi în perioada crizei, 2009-2011, când resursele au fost oarecum limitative, după care a crescu în 2012 la 37 mld., iar în 2014 și 2015 s-a menținut la același ritm. Din punct de vedere al
procentului de utilizare al resurselor guvernamentale din totalul investițiilor
realizate de guverne, în 2006 era de aproximativ 6,8%, iar în 2015 de 7,3%.
Cheltuielile efectuate de corporațiile private au urmat un curs mai redus
fi ind de 25 mld. euro în 2006, și ajungând la 23-24 mld. euro în 2012-2013
aliniându-se din nou la aproximativ 25 mld. de euro în perioada următoare. Iată deci o accesare constantă a fondurilor pentru investiții în domeniul protecției mediului înconjurător. Desigur, procentual se constată o alocare sufi cient de importantă în această direcție.
5. Taxele pe mediu
Taxele percepute pentru protecția mediului au fost de 343 mld. euro reprezentând 2,5% din produsul intern brut și circa 6,3% din sumele alocate la nivel socio-economic. În grafi cul 6 sunt prezentate taxele percepute pe mediu, având în vedere principalele taxe utilizate în perioada 2002-2014, constatându-se o creștere pe total de la 270 mld. euro în 2002 la 348 mld. în 2014 și aproape 350 mld. în 2015.

Revista Română de Statistică - Supliment nr. 9 / 2017 161
Venituri totale din taxe de mediu pe tipuri de taxe, EU-28, 2002-2014 (mld. euro)
Figura 6
Sursa: Eurostat - Key fi gures on Europe 2016, pag. 171
Cea mai mare taxă este cea pe energie care reprezintă peste 75-80% din totalul taxelor, taxele pentru poluare datorită transportului și apoi taxele pentru poluarea datorată exploatării resurselor. Grafi cul de mai sus prezintă
toate aceste date, iar în fi gura 7 se prezintă pentru fi ecare țară, procentul taxelor percepute petru cele trei activități poluatoare, energie, transport și exploatarea resurselor.
Taxe de mediu pe activități economice, 2014 (% din total taxe de mediu)Figura 7
Sursa: Eurostat - Key fi gures on Europe 2016, pag. 172
Romanian Statistical Review - Supplement nr. 9 / 2017162
Se constată că, cele mai multe state printre care și România, percep
cel mai mare procent de aproximativ 88% pentru poluarea datorată producerii de energie urmată de transporturi cu 11% iar pentru alte activități poluante restul de 1%. Cam în toate țările Uniunii Europene întâlnim aceeași situație, a perceperii taxelor de poluare pentru această activitate economică.
Concluzii Din analiza acestui articol rezultă că autorii pe baza studiului efectuat au ajuns la unele concluzii dintre care cele mai importante sunt următoarele: prima ar fi aceea că pentru păstrarea calității trebuie întreprinse orice măsuri, efectuate cheltuieli efi ciente care să conducă la protejarea mediului și reducerea efectelor poluării. În al doilea rând se arată că măsurile întreprinse până în prezent au avut ca efect armonizarea standardelor calității mediului în țările membre europene. Se dau date concrete în legătură cu situația din fi ecare stat cu accent pe precipitațiile care cad, măsurile întreprinse și multe altele, sugerându-se astfel că țările au nevoie în mod diferit și individualizat de măsuri care să le garanteze protecția față de elementele negative cum sunt emisiile de gaze, efectul deșeurilor și multe altele care, dacă nu sunt controlate, pot să determine erodarea puternică a mediului înconjurător și pe această cale a mediului de afaceri. Analiza întreprinsă de autori poate fi extinsă prin utilizarea unor modele econometrice cu ajutorul cărora să se determine parametrii care testați să scoată în evidență nivelul pe care îl are calitatea mediului economic și mai ales al condițiilor de viață.
Bibliografi e
1. Anghelache, C. and Anghel, M. G. (2017). The European Union’s strategy for increasing the living conditions of the population in the member states. Theoretical and Applied Economics, XXIV (3), (612), Autumn, 5-18
2. Anghelache, C., Anghel, M. G. and Panait, M. (2017). The Main Developments and Perspectives of the European Union, Romanian Statistical Review, 2, 57-79
3. Anghelache, C. (1999-2016). Colecția de volume România. Starea economică, Editura Economică, București
4. Bozbas, K. (2008). Biodiesel as an alternative motor fuel: Production and policies in the European Union. Renewable and Sustainable Energy Reviews, 12 (2), 542-552
5. De Stefano, L. (2010). Facing the water framework directive challenges: A baseline of stakeholder participation in the European Union. Journal of Environmental Management, Volume 91 (6), 1332-1340
6. Deschênes, O. and Greenstone, M. (2012). The Economic Impacts of Climate Change: Evidence from Agricultural Output and Random Fluctuations in Weather: Reply. American Economic Review, 102, 3761-3773
7. Hansen, M. C., Potapov, P. V., Moore, R., et al. (2013). High-resolution global maps of 21st-century forest cover change. Science, 342 (6160), 850–853
Revista Română de Statistică - Supliment nr. 9 / 2017 163
8. Hayes, C. R. and Skubala, N. D. (2009). Is there still a problem with lead in drinking water in the European Union?. Journal of Water and Health, 7 (4), 569-580
9. Saiz, A. (2010). The Geographic Determinants of Housing Supply. Quarterly Journal of Economics, 125, 1253-1296
10. Schreurs M. and Tiberghien, Y. (2007). Multi-Level Reinforcement: Explaining European Union Leadership in Climate Change Mitigation. Global Environmental Politics, 7 (4), 19-46
11. Tol, R. S. J. (2009). The Economic Effects of Climate Change. Journal of Economic Perspectives, 23 (2), 29–51
12. Wang, R. et al. (2017). Freshwater Vulnerability beyond Local Water Stress: Heterogeneous Effects of Water-Electricity Nexus Across the Continental United States. Environmental Science & Technology, 51 (17), 9899–9910
13. *** Eurostat - Key fi gures on Europe 2016

Romanian Statistical Review - Supplement nr. 9 / 2017164
CONSERVATION OF WATER QUALITY AND ENVIRONMENTAL PROTECTION IN THE
CONTEXT OF ECONOMIC GROWTH
Prof. Constantin ANGHELACHE PhD ([email protected])
Bucharest University of Economic Studies / „Artifex” University of Bucharest
Doina AVRAM Ph.D Student ([email protected])
Bucharest University of Economic Studies
Doina BUREA PhD Stdent ([email protected])
Bucharest University of Economic Studies
Abstract
This article is based on the fact that the natural wealth of some EU Member States is being exploited in a benefi cial way, but it is often
the exploitation that has the secondary, but very dangerous, effect on the
environmental pollution and on the environmental quality. In a very special
way, the quality of water, whose resources are continually decreasing in the
last period of time, is widely analyzed and an appreciation is made regarding
the prospect that these water resources will diminish by imposing protective
measures of the exploitation of the water resources available to the European
Union member countries. Certainly, other issues related to the course of water
use and other environmental measures must be seen in comparison with the
positive effect on living conditions that must be protected from the negative
effects of economic development. The authors sometimes make a thorough
study using the data published by Eurostat to highlight the standard that each
state acquires, and especially the individual need for each individual to take
new measures, additional measures to meet the standards imposed by the
European Union through its directives, which regulate this activity.
Key words: water resources, environmental economy, environmental
protection, environmental taxes, environmental protection costs
JEL Classifi cation: H23, Q25
Introduction The environment must be protected as a factor contributing to the sustainable growth of economies, while protecting them from the harmful effects of irrational exploitation. There are some countries, among them Romania, which still have important steps to ensure reasonable, reasonable standards on the quality of the environment. The materials used in the industrial process can not have negative effects on the environment. The water, the rational source of life, is treated with great care because, on the
Revista Română de Statistică - Supliment nr. 9 / 2017 165
one hand, it ensures the living conditions, and on the other hand all the water, ensures a regularization of the climate cycle.
Literature review Anghelache and Anghel (2017) analyze the European Union’s strategy for improving living conditions, both on a total EU basis and in each Member State, based on respect for fundamental human rights and analyzing indicators that highlight the threat of poverty. Anghelache, Anghel and Panait (2017) study the main economic, fi nancial and social outcomes of the Member
States in the European Union, as well as the prospects for their evolution. The
series of books authored by Anghelache (1999-2016) describe in detail the
economic status of Romania, including a thorough, comprehensive analysis
of the population living standard. Hayes and Skubala (2009) analyze the risks
to human health caused by the presence of lead in drinking water. De Stefano
(2010) presents an evaluation of the stakeholder stakeholder quality at the
beginning of the implementation of the Water Framework Directive in twenty
EU countries or having close institutional relations with the EU. Bozbas
(2008) explores the characteristics of biodiesel fuels and its production in the
European Union. Tol (2009) studies the economic impact of climate change.
Schreurs and Tiberghien (2007) develop on the characteristics of explaining
European leadership in the context of climate change mitigation. Wang et al.
(2017) investigates the water-electricity cross-border effects (WEN) on the
vulnerability of freshwater in continental America. Deschênes and Greenstone
(2012) measure the economic impact of climate change on US agricultural
land by estimating the effect of year-to-year variation in temperatures and
rainfall on agricultural profi ts. Saiz (2010) shows that geography is a key
factor in contemporary urban development by carrying out a study based on
data on land areas and water bodies in order to accurately estimate the amount
of land developed in metropolitan areas. Hansen et al. (2013) illustrate a
consistent and local global change record of forests, showing that the loss of
boreal forests, largely caused by fi re and forestry, was second in relation to the
tropics in both absolute and proportionate terms.
Research methodology, data, results and discussions 1. Water Water is the natural source of life. It is the indispensable resource of
the economy and is the natural element that ensures the regularization of the
climate cycle. Organizing and protecting the exploitation of water resources,
fresh water or salinized water, water for individual consumption, water used
in economic activities, and many others, are the main source of activity. Water

Romanian Statistical Review - Supplement nr. 9 / 2017166
circulates in nature but water resources are limited, and studies by international bodies show that as global warming comes to limit these resources that need to be protected. In the EU Member States there is a common strategy to be followed and on the basis of which fresh water resources must be ensured for the long term. The water categories circulating in nature can be represented by the amount of fallen rainfall, the volume of evaporation, the internal circuit, the external circuit, the total freshwater resources and the resources that are anticipated. In Table 1, on each state and total individual or cumulative resource, it is shown which is the long-term average we anticipate.
Freshwater resources - the long-term annual average (billions of m3)Table 1
Source: Eurostat - Key fi gures on Europe 2016, p. 165
In the case of Romania, the annual rainfall is 154 billion m3, from
evaporation 114.6 billion m3, from the internal circuit 39.4 billion m3, the
external circuit 2.9 billion m3, then these resources reach 42, 3 billion m3,
with a reserve of 7.9 billion m3. We fi nd that, depending on the geographical

Revista Română de Statistică - Supliment nr. 9 / 2017 167
situation, the hydrographic regime and other countries pay attention to the conservation of water resources, seek to save water resources and especially seek to avoid pollution of water resources. There are national systems that ensure the protection of these water resources. There are a number of other analyzes that show the amount of water resources exploited, the amount of resources conserved and, in particular, the total amount of water resources supplied in m3 / inhabitant. Of course, these data are presented annually. Figure 1 shows such a structure, which for Romania is about 49 m3 per citizen.
Total freshwater abstraction by public water supply, 2013 (m³ per inhabitant)
Figura 1
Source: Eurostat - Key fi gures on Europe 2016, p. 166
Countries such as Italy, Ireland, Croatia, Iceland, Norway and others
with a natural and well-established natural environment and a much better-
developed hydrographic network have much larger amounts of exploited
resources and water-conserved resources. Specialist literature often talks
about the danger of water resource crises that may affect geographical areas
or even extend to the entire population.

Romanian Statistical Review - Supplement nr. 9 / 2017168
2. Economics of the environment related to labor and economic growth
Environmental economics includes a series of activities that must provide for environmental protection, but there are other activities that produce pollution, which have negative effects on the environment. From this point of view, it is a question of analyzing the activities and the efforts that the European Union proposes, as well as every state in terms of protecting the environment, reducing the polluting activities, eliminating the activities that lead to the degradation and the qualitative reduction of the natural conditions . Of course, natural resources are in the environment, they have to be exploited, but the whole activity, according to the European Union program, must be carried out simultaneously with the undertaking of measures to ensure the protection of this environment.
3. Environmental Economics - Personal and Growth In line with the European Union’s estimates, the number of employees throughout the Union working in environmental protection activities is about 2 800 000 people working full-time in this fi eld. In this activity, those working
in the fi eld generate billions of revenue as a result of reducing environmental
pollution, resulting from the increase in agricultural, forestry and other crops
as a result of the protection measures taken in the European Union. Figure 2
shows the key indicators of the development of the economy of the economy
and the economy in general.
Evolution of Key Indicators for the Economy and the Economy as a whole, EU-28, 2000-2013 (2000 = 100)
Figure 2
Source: Eurostat - Key fi gures on Europe 2016, p. 167
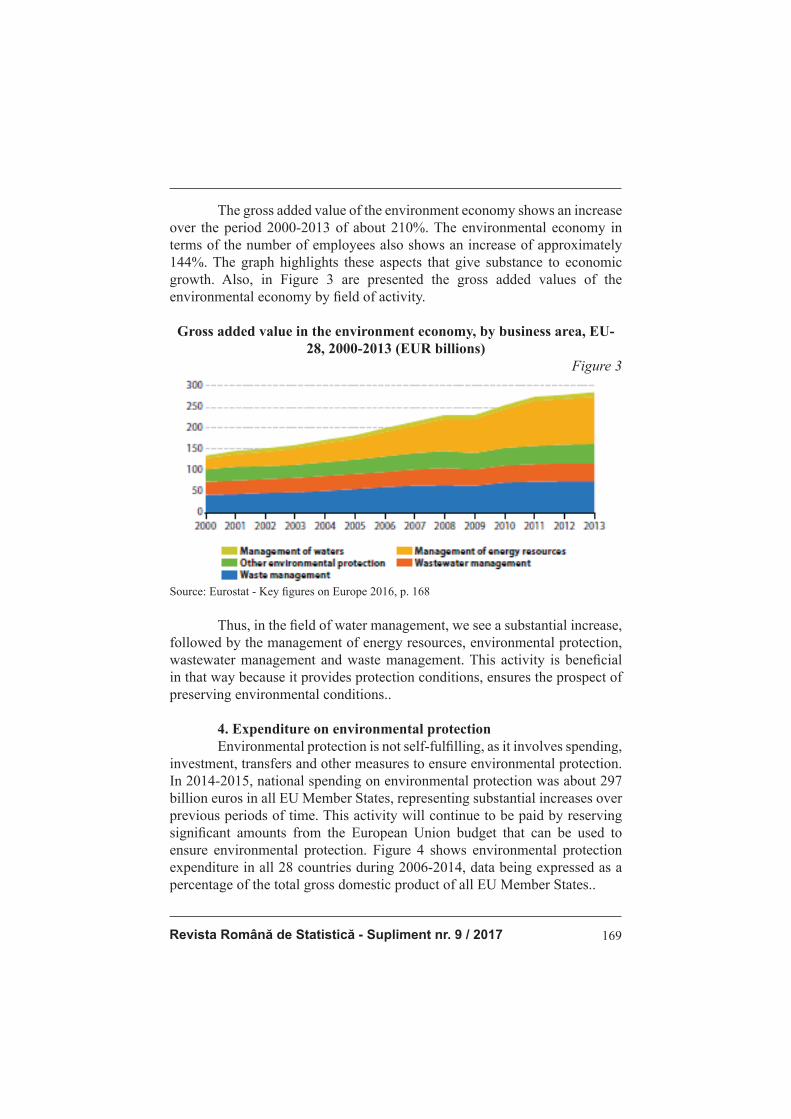
Revista Română de Statistică - Supliment nr. 9 / 2017 169
The gross added value of the environment economy shows an increase over the period 2000-2013 of about 210%. The environmental economy in terms of the number of employees also shows an increase of approximately 144%. The graph highlights these aspects that give substance to economic growth. Also, in Figure 3 are presented the gross added values of the environmental economy by fi eld of activity.
Gross added value in the environment economy, by business area, EU-28, 2000-2013 (EUR billions)
Figure 3
Source: Eurostat - Key fi gures on Europe 2016, p. 168
Thus, in the fi eld of water management, we see a substantial increase,
followed by the management of energy resources, environmental protection,
wastewater management and waste management. This activity is benefi cial
in that way because it provides protection conditions, ensures the prospect of
preserving environmental conditions..
4. Expenditure on environmental protection Environmental protection is not self-fulfi lling, as it involves spending,
investment, transfers and other measures to ensure environmental protection.
In 2014-2015, national spending on environmental protection was about 297
billion euros in all EU Member States, representing substantial increases over
previous periods of time. This activity will continue to be paid by reserving
signifi cant amounts from the European Union budget that can be used to
ensure environmental protection. Figure 4 shows environmental protection
expenditure in all 28 countries during 2006-2014, data being expressed as a
percentage of the total gross domestic product of all EU Member States..

Romanian Statistical Review - Supplement nr. 9 / 2017170
Environmental protection expenditures, EU-28, 2006-2014 (EUR million and% of GDP)
Figure 4
Source: Eurostat - Key fi gures on Europe 2016, p. 169
Thus, we fi nd that in the global fi gure, environmental protection
expenditures amounted to about 249 billion euros in 2006, or almost 2.5%
of the gross domestic product of all Community countries, rising to EUR 297
billion in 2014, ie almost 3 % of gross domestic product of all EU countries.
Depending on the bands by which the expenses are represented, a curve
is shown showing the increase in environmental protection expenditures
compared to the growth of the gross domestic product. Figure 5 shows the
environmental investments made by all EU Member States between 2006 and
2014, expressed in millions of euros, and the total investments made in the
European Union..
Environmental protection investments, EU-28, 2006-2014 (EUR million and% of total investments)
Figure 5
Source: Eurostat - Key fi gures on Europe 2016, p. 170

Revista Română de Statistică - Supliment nr. 9 / 2017 171
It is noted that during the period 2006-2014 the government expenditures followed an approximately constant trend of 35 billion euros in 2006, 37-38 billion in 2007, 39 billion in 2008, then decreasing in the crisis period, 2009-2011, when resources were somewhat limiting, then rose to 37 billion in 2012, and in 2014 and 2015 it remained at the same pace. From the point of view of the utilization rate of government resources in total government investments, it was around 6.8% in 2006 and 7.3% in 2015. Expenditures by private corporations followed a lower rate of 25 billion euros in 2006, reaching 23-24 billion euros in 2012-2013, re-aligning to about 25 billion euros in the next period. Here is a constant access to investment funds in the fi eld of environmental protection. Of course, a percentage is found to be
suffi ciently important in this direction.
5. Environmental taxes Environmental taxes were € 343 billion, representing 2.5% of gross
domestic product, and about 6.3% of the amounts allocated at socio-economic
level. Graph 6 shows environmental taxes, taking into account the main taxes
used during the period 2002-2014, with a total increase from 270 billion euro
in 2002 to 348 billion in 2014 and nearly 350 billion in 2015.
Total revenues from environmental taxes by types of taxes, EU-28, 2002-2014 (EUR billions)
Figure 6
Source: Eurostat - Key fi gures on Europe 2016, pag. 171
The highest charge is that of energy representing over 75-80% of total
taxes, pollution taxes due to transport and then pollution taxes due to resource

Romanian Statistical Review - Supplement nr. 9 / 2017172
exploitation. The graph above shows all these data, and Figure 7 shows for each country the percentage of fees charged for the three polluting activities, energy, transport and resource exploitation..
Environmental taxes by economic activity, 2014 (% of total Figure 7
environmental taxes)
Source: Eurostat - Key fi gures on Europe 2016, p. 172
It is noted that most countries, including Romania, account for the
highest percentage of about 88% for the pollution caused by energy production
followed by transports by 11% and for the other polluting activities the
remaining 1%. Just like in all the countries of the European Union, we have
the same situation of levying pollution charges for this economic activity.
Conclusion The analysis of this article shows that the authors, on the basis of
the study carried out, have reached some conclusions, the most important of
which are the following: the fi rst is that for the preservation of quality, any
measures should be taken, effective expenditures leading to the protection of
the environment and the reduction of the effects of pollution . Secondly, the
measures taken so far have resulted in the harmonization of environmental
quality standards in European countries. Concrete data is given on the situation
in each state, focusing on the falling rainfall, the measures taken and much
more, suggesting that countries need different and individualized measures to
ensure their protection against the negative elements such as gas emissions, the
effect of waste and many others that, if unchecked, can lead to a strong erosion

Revista Română de Statistică - Supliment nr. 9 / 2017 173
of the environment and thus the business environment. The authors’ analysis can be extended by using econometric models to determine the parameters that are testing to highlight the quality of the economic environment and especially the living conditions.
References 1. Anghelache, C. and Anghel, M. G. (2017). The European Union’s strategy for
increasing the living conditions of the population in the member states. Theoretical and Applied Economics, XXIV (3), (612), Autumn, 5-18
2. Anghelache, C., Anghel, M. G. and Panait, M. (2017). The Main Developments and Perspectives of the European Union, Romanian Statistical Review, 2, 57-79
3. Anghelache, C. (1999-2016). Colecția de volume România. Starea economică, Editura Economică, București
4. Bozbas, K. (2008). Biodiesel as an alternative motor fuel: Production and policies in the European Union. Renewable and Sustainable Energy Reviews, 12 (2), 542-552
5. De Stefano, L. (2010). Facing the water framework directive challenges: A baseline of stakeholder participation in the European Union. Journal of Environmental Management, Volume 91 (6), 1332-1340
6. Deschênes, O. and Greenstone, M. (2012). The Economic Impacts of Climate Change: Evidence from Agricultural Output and Random Fluctuations in Weather: Reply. American Economic Review, 102, 3761-3773
7. Hansen, M. C., Potapov, P. V., Moore, R., et al. (2013). High-resolution global maps of 21st-century forest cover change. Science, 342 (6160), 850–853
8. Hayes, C. R. and Skubala, N. D. (2009). Is there still a problem with lead in drinking water in the European Union?. Journal of Water and Health, 7 (4), 569-580
9. Saiz, A. (2010). The Geographic Determinants of Housing Supply. Quarterly Journal of Economics, 125, 1253-1296
10. Schreurs M. and Tiberghien, Y. (2007). Multi-Level Reinforcement: Explaining European Union Leadership in Climate Change Mitigation. Global Environmental Politics, 7 (4), 19-46
11. Tol, R. S. J. (2009). The Economic Effects of Climate Change. Journal of Economic Perspectives, 23 (2), 29–51
12. Wang, R. et al. (2017). Freshwater Vulnerability beyond Local Water Stress: Heterogeneous Effects of Water-Electricity Nexus Across the Continental United States. Environmental Science & Technology, 51 (17), 9899–9910
13. *** Eurostat - Key fi gures on Europe 2016