CHEMIA - studia.ubbcluj.ro · editorial board of studia universitatis babeŞ-bolyai chemia onorary...
171
3/2018 CHEMIA
Transcript of CHEMIA - studia.ubbcluj.ro · editorial board of studia universitatis babeŞ-bolyai chemia onorary...
3/2018
CHEMIA
STUDIA UNIVERSITATIS BABEŞ-BOLYAI
CHEMIA
3/2018
EDITORIAL BOARD OF STUDIA UNIVERSITATIS BABEŞ-BOLYAI CHEMIA
ONORARY EDITOR:
IONEL HAIDUC - Member of the Romanian Academy
EDITOR-IN-CHIEF:
LUMINIŢA SILAGHI-DUMITRESCU
EXECUTIVE EDITOR:
CASTELIA CRISTEA
EDITORIAL BOARD:
PAUL ŞERBAN AGACHI, Babeş-Bolyai University, Cluj-Napoca, Romania
LIVAIN BREAU, UQAM University of Quebec, Montreal, Canada
HANS JOACHIM BREUNIG, Institute of Inorganic and Physical Chemistry,
University of Bremen, Bremen, Germany
MIRCEA DIUDEA, Babeş-Bolyai University, Cluj-Napoca, Romania
JEAN ESCUDIE, HFA, Paul Sabatier University, Toulouse, France
ION GROSU, Babeş-Bolyai University, Cluj-Napoca, Romania
EVAMARIE HEY-HAWKINS, University of Leipzig, Leipzig, Germany
FLORIN DAN IRIMIE, Babeş-Bolyai University, Cluj-Napoca, Romania
FERENC KILAR, University of Pecs, Pecs, Hungary
BRUCE KING, University of Georgia, Athens, Georgia, USA
ANTONIO LAGUNA, Department of Inorganic Chemistry, ICMA, University of
Zaragoza, Zaragoza, Spain
JURGEN LIEBSCHER, Humboldt University, Berlin, Germany
KIERAN MOLLOY, University of Bath, Bath, UK
IONEL CĂTĂLIN POPESCU, Babeş-Bolyai University, Cluj-Napoca, Romania
CRISTIAN SILVESTRU, Babeş-Bolyai University, Cluj-Napoca, Romania
http://chem.ubbcluj.ro/~studiachemia/; [email protected]
http://www.studia.ubbcluj.ro/serii/chemia/index_en.html
YEAR MONTH ISSUE
Volume 63 (LXIII) 2018SEPTEMBER
3
S T U D I A UNIVERSITATIS BABEŞ–BOLYAI
CHEMIA
3 ISSUE DOI:10.24193/subbchem.2018.3
STUDIA UBB EDITORIAL OFFICE: B.P. Hasdeu no. 51, 400371 Cluj-Napoca, Romania, Phone + 40 264 405352
CUPRINS – CONTENT – SOMMAIRE – INHALT
PETRE FLORINEL NENU, LUISA IZABEL DUNGAN, ADRIAN EUGEN CIOABLĂ, GERLINDE RUSU, GEZA NICOLAE BANDUR, ALINA GABRIELA DUMITREL, VASILE PODE, Biomass Analysis for Combustion Applications – Case Study Scenarios ............................. 7
KATARZYNA PSTROWSKA, JAN KACZMARCZYK, HANNA CZAPOR-IRZABEK, MAREK KUŁAŻYŃSKI, Characterization of Activated Beech Wood Char – Methane Storage Application ........... 21
ADRIAN PATRUT, ROXANA T. PATRUT,LASZLO RAKOSY, ILEANA-ANDREEA RAŢIU, DANIEL A. LOWY, JENŐ BODIS, KARL F. VON REDEN, Radiocarbon Dating of the Old Ash of Aiton, Romania .. 41
IOAN PETEAN, GERTRUD ALEXANDRA PALTINEAN, AURORA MOCANU, DANA FLORINA MUNTEAN, LIANA MURESAN, GEORGE ARGHIR, MARIA TOMOAIA-COTISEL, Micro and Nano Organization of Atmospheric Particulate Matter in Grigorescu District of Cluj-Napoca .......................................................................... 49

SIMION DRĂGAN, Macrokinetic Investigations of Dry Flue-Gas Desulfurization Process Using TGA Technique ................................ 59
SORIN RAPUNTEAN, REKA BALINT, GERTRUD ALEXANDRA PALTINEAN, GHEORGHE TOMOAIA, AURORA MOCANU, CSABA-PAL RACZ, OSSI HOROVITZ, MARIA TOMOAIA-COTISEL, Antibacterial Activity of Silver Nanoparticles Obtained by Co-Reduction with Sodium Citrate and Tannic Acid .................... 73
ILDIKO LUNG, MARIA-LOREDANA SORAN, OCSANA OPRIŞ, MANUELA STAN, CONSTANTIN BELE, Microwave Irradiation Effect on Polyphenol Content and Antioxidant Activity of Basil ........ 87
AHMED. A. M. ELNOUR, MOHAMED E. S. MIRGHANI, N. A. KABBASHI, MD Z. ALAM, KHALID HAMID MUSA, Gum Arabic: An Optimization of Ultrasonic- Assisted Extraction of Antioxidant Activity .................. 95
DAN-ALEXANDRU TĂTARU, DAN-MIRCEA OLINIC, ANDRADA URDĂ, MARIA OLINIC, REMUS ORĂSAN, Oxidative Stress Markers in Acute Myocardial Infarction Treated by Primary Percutaneous Coronary Intervention ..................................................................... 117
CRISTIAN T. MATEA, TEODORA MOCAN, FLAVIU TABARAN, TEODORA POP, OFELIA MOSTEANU, LUCIAN MOCAN, CLAUDIU ZDREHUS, Synthesis and Characterization of MUC-1 Functionalized Gold Nanoparticles ................................................. 129
RÉKA BARABÁS, MELINDA RIGÓ, MARGIT ENISZNÉ-BÓDOGH, CORINA MOISA, OANA CADAR, Preparation and Characterization of Hydroxyapatite Based Nano-Composite Biomorphic Implants ........ 137
SILVIA BURCĂ, CERASELLA INDOLEAN, Ionic Exchange Studies for Correcting Water Quality Indicators ................................................ 155

Studia Universitatis Babes-Bolyai Chemia has been selected for coverage in Thomson Reuters products and custom information services. Beginning with V. 53 (1) 2008, this publication is indexed and abstracted in the following: • Science Citation Index Expanded (also known as SciSearch®) • Chemistry Citation Index® • Journal Citation Reports/Science Edition

STUDIA UBB CHEMIA, LXIII, 3, 2018 (p. 7-20) (RECOMMENDED CITATION) DOI:10.24193/subbchem.2018.3.01
BIOMASS ANALYSIS FOR COMBUSTION APPLICATIONS – CASE STUDY SCENARIOS
PETRE FLORINEL NENUa, LUISA IZABEL DUNGAN*a, ADRIAN EUGEN CIOABLĂa, GERLINDE RUSUb,
GEZA NICOLAE BANDURb, ALINA GABRIELA DUMITRELb, VASILE PODEb
ABSTRACT. Nowadays the need for renewable resources becomes more and more stringent. Biomass remains one of the most important sources of energy, being used directly or by chemical conversion processes in order to produce clean energy. Relative to this aspect, the present paper proposes the direct approach, by analyzing to biomass type materials (topinambur and Romanian hemp) in order to determine their physical and chemical characteristics and their potential use in combustion processes.
Keywords: biomass, combustion, thermal and chemical analysis
INTRODUCTION The worldwide socio-economical context imposes an economical
growth in the sense of obtaining heat, electricity and biofuels, but the main objective for safe energy distribution has to be overlapped with the one of sustainable development of society, which represents an essential component of the 2009/28/EC Directive regarding Renewable Energy. Energetic durability is recognized as a decisive factor in reaching a global scale sustainable development of any country [1-3].
The EU has established ambitious objectives regarding climate and energy until 2020, such as a reduction of 20% for the GHG gases (greenhouse effect) and a quota of 20% from the energetic consumption in the UE should be produced by renewable energy sources. At global level there exists an urgent demand for bioenergy and the renewable energy sources are sufficient a Politehnica University Timisoara, Faculty of Mechanical Engineering, 1 Mihai Viteazu Blv,
Timisoara, RO-30022, Timisoara, Romania b Politehnica University of Timisoara, Faculty of Industrial Chemistry and Environmental
Engineering, 6 V. Parvan blvd., RO-300223, Timisoara, Romania * Corresponding author: [email protected]

P. F.L NENU, L. I. DUNGAN, A. E. CIOABLĂ, G. RUSU, G. N. BANDUR, A. G. DUMITREL, V. PODE
8
for offering potential to all energetic needs worldwide necessary in the next century [4-5]. The residual materials obtained from forestry, agriculture and organic waste (for example municipal solid waste) would be enough to ensure between 50 and 150 EJ/year and the difference can be obtained from energetic crops, excessive forest growing and optimized agricultural productivity [6]. Short rotation coppice (SRC) can be a factor in reduction of energetic dependence of a country and GHG and can contribute as a lever to regional durable development, especially in rural areas, where there is need for new working places and to create a durable economy in order to attract young population [7].
Aside solar and wind energy, bioenergy represents one of the most used renewable energy technologies [8], and at global level the main concern is to obtain independence from fossil fuels while identifying potential sources and increased usage on a large scale of “fuel mix”.
The concept “bioenergy” (energy from biomass), included in the term “green energy” (renewable energy), describes an alternative solution, ecological, apart from the classical form of using carbon based sources. If biomass is directly used for heat and / or energy generation, by being just a fuel (or an energy source), the energy generated from it is called bioenergy [9,10].
“The ratio between the mass of organic substance versus a certain surface and time unit” [11], as biomass can be defined, including all the organic matter produced through metabolic processes of living organisms in chemical form, constitutes in fact the resource with the highest potential usage for man. Biomass is in essence the ensemble for non-fossil organic matter, which includes: wood, animal residues, oils and vegetable residues from forestry, agriculture and industry but also cereals and fruits from which ethanol can be produced. Biomass reserves are especially wood residues, agricultural residues, municipal waste and energetic crops [12, 13].
Biomass can also be used for the production of biochemicals or biomaterials [14-16].
It is one of the most promising sources of renewable energy because of its attractive properties like low production cost, low emissions, storage capacity and availability throughout the year from different sources [17-20].
It is the only renewable energy source which can be transformed in solid, liquid or gaseous fuels [21, 22].
The main forms of capitalizing biomass are: - Direct combustion for thermal energy production; - Pirolysis firing with syngas production (CO + H2); - Fermentation with biogas production (CH4) or bioethanol (CH3-CH2-OH); - Chemical conversion of vegetal oils by alcoholic treatment and obtaining
esters (eg. biodiesel and glycerol); - Enzymatic decay with ethanol or biodiesel production [12].
BIOMASS ANALYSIS FOR COMBUSTION APPLICATIONS – CASE STUDY SCENARIOS
9
So it can be considered that biomass has an important role to play in the energy production [13], especially it the developing countries [24].
Presently the use of biomass produces about 5% from the total energy consumption at European level and in countries like Finland, Sweden and Austria it assures over 15-20%. In Romania, the electric energy production in 2016 was accomplished at a level of around 42.38% from renewable energy sources and the rest through fossil fuels according to existing data given by the National Authority for Energetic Regulation (ANRE) from monitoring the electric energy market.
According to the presented document, from all the renewable energy sources, the hydroelectric part assured 28.86% from the total produced electric energy, followed by wind installations (10.13%), solar (2.60%) and biomass (0.75%) [24].
Until 2020, the ENERO study recommends local heating and cogeneration through using wood biomass, straw and biogas obtained from anaerobic digestion of organic residues as being the main effective technologies for Romania and biomass (including biofuels used for transportation) will be the main contributor at RES quota (Renewable Energy Sources) with more than 65% from the total amount [25].
Both presently and also as estimation for 2020, the main biomass contribution in our country is represented by wood and agricultural residues, used for heating the traditional rural stoves, which is about 40% from the living population [25].
Using biomass in firing processes still presents technical issues because of the difficulty to model the combustion behavior due to the large number of biomass types with different chemical compositions, which can vary significantly.
Biomass has certain disadvantages as solid fuel: high water and Oxygen content, hydrophilic nature, low calorific value, high bulk density and energetic density, and also posing problems regarding transportation, storage and usage. Transportation costs are generally high, which can affect the process economical viability [26].
In order to partially overcome those problems, biomass can be pretreated and transformed ib products like pellets and briquettes. Through this type of processing it can be obtained a homogenous and solid product with high density, thus having an improvement in terms of biomass quality and reduction of the supply chain [27, 28].
Knowing the physical and chemical characteristics for the used products is very important in order to better understand the burned fuel behavior in order to better consolidate the biomass supply chain viability. The process of obtaining pellets / briquettes is improved in order to be used for capitalization of agro-industrial residues [29].

P. F.L NENU, L. I. DUNGAN, A. E. CIOABLĂ, G. RUSU, G. N. BANDUR, A. G. DUMITREL, V. PODE
10
It is a known fact that the primary matter has a great influence over the qualities of pellets and briquettes. For forestry biomass, the leafs have a superior heating value than the wood fractions [30,31], but they also present a high ash content which implies more industrial problems like abrasive wear in firing boilers / ovens.
RESULTS AND DISCUSSION There were conducted both physical and chemical analysis and
thermal analysis in order to better determine the potential applications for the studied materials in combustion processes.
Next tables will underline the obtained results for the laboratory determinations.
For comparison reasons there will be added two other different materials previously used for analysis purposes in order to observe a basic comparison relative to chemical properties [32] but having in mind the fact that the main focus is made on the first two materials used for laboratory determinations (positions 1 and 2 in the next tables).
Table 1. Experimental results (part 1)
No. MATERIAL
Moisture content [%]
Ash content (db) [%]
Gross calorific value (db)
[J/g]
Net calorific value (db)
[J/g] 1 Hemp RO 15,5 2,87 19334 17940
2 Topinambur 11,3 5,94 18277 16903
3 Wheat bran 9,7 5,54 19034 17520
4 Two row barley 10,7 2,22 18354 16763
Table 2. Experimental results (part 2)
No. MATERIAL Carbon content
(db) [%]
Hydrogen content
(db) [%]
Nitrogen content
(db) [%]
Volatile matter content (db)
[%]
1 Hemp RO 48,3 5,4 0,45 79,1 2 Topinambur 45,6 5,59 1,46 74,3 3 Wheat bran 41,3 6,2 2,06 78,4 4 Two row barley 40,1 6,5 1,38 82,4
BIOMASS ANALYSIS FOR COMBUSTION APPLICATIONS – CASE STUDY SCENARIOS
11
It can be observed from table 2 that the ash content of the two studied materials is relatively low, which represents a good indicator of combustion use due to the fact that there are low quantities of residual materials after the process. By comparison with other materials it can be observed that there can be lower values (two row barley in our case) that are better suited for further use in firing processes. Also the calorific values are relatively high, which implies high energetic levels for all materials.
Table 3. Experimental results (part 3) No.
MATERIAL Sulphur content
(db) [%]
Chlorine content (db) [%]
Oxygen Content
(db) [%]
1 Hemp RO 0.008 0.001 43.0
2 Topinambur 0.117 0.258 41.0 3 Wheat bran 0.014 0.004 42.0 4 Two row barley 0.014 0.009 43.0
From tables 2 and 3 an overall idea is that there are low levels of
sulphur and chlorine, which for combustion processes indicate low potential of degrading the furnace which uses as fuel one of the studied materials.
Table 4. Experimental results (part 4) No.
MATERIAL Shrinking
temperature [° C]
Deformation temperature
[° C]
Hemisphere temperature
[° C]
Flow temperature
[° C] 1 Hemp RO 960 1240 1300 1320
2 Topinambur 610 1280 1490 >1540
3 Wheat bran 640 670 730 740
4 Two row barley 830 1120 1300 1350
From table 4 one can determine that topinambur has a higher flow temperature than hemp, making the first material much more suitable in terms of behavior during the combustion process. By comparison with the other two materials, it can be observed that its flow temperature is in the same range as two row barley.
P. F.L NENU, L. I. DUNGAN, A. E. CIOABLĂ, G. RUSU, G. N. BANDUR, A. G. DUMITREL, V. PODE
12
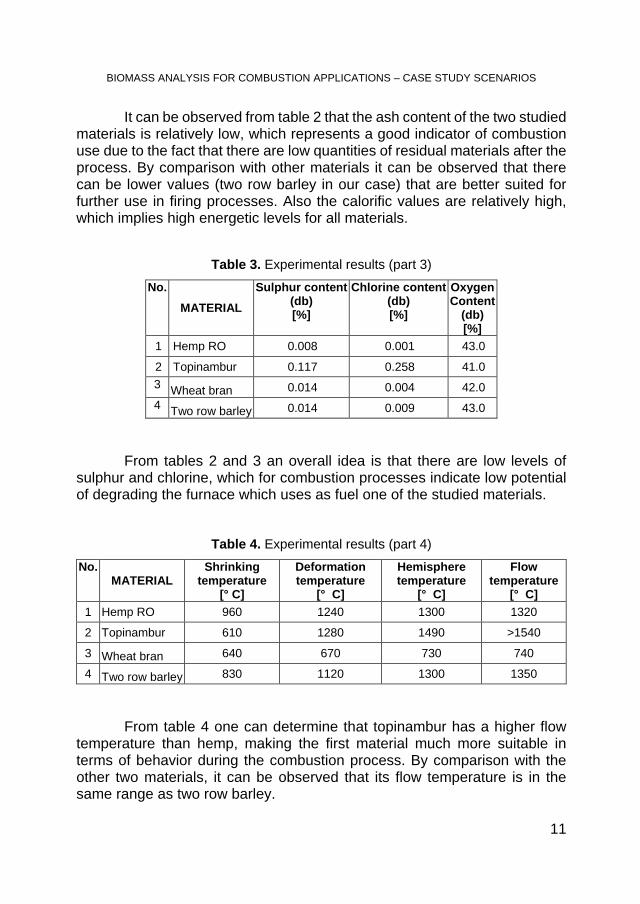
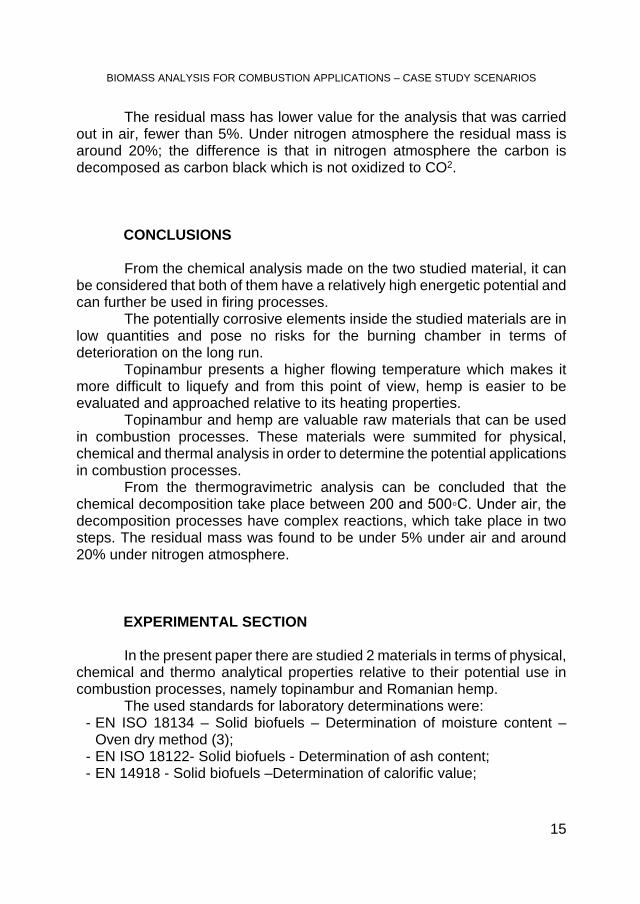
Figure 1. TG curves for topinambur under air and nitrogen The TG curves present two degradation steps, the first from 25 to 200°C,
associated with water loss, and the second from 200 to 500 °C associated to thermal decomposition of the samples.
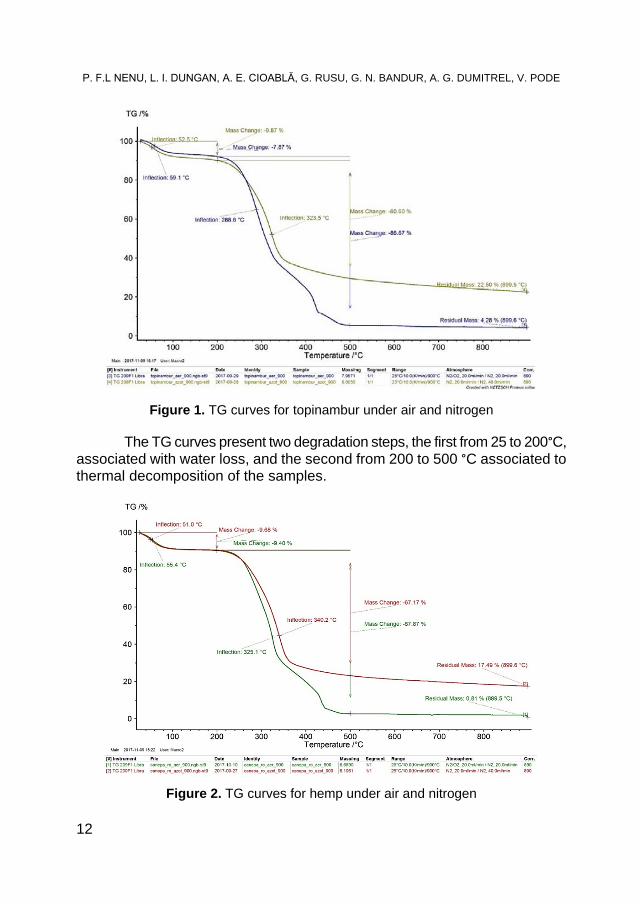
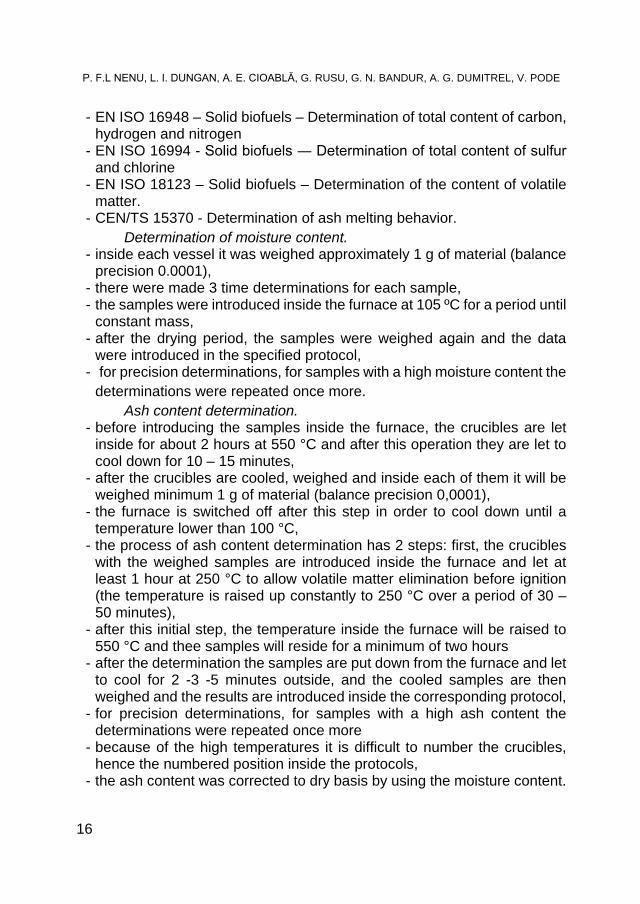
Figure 2. TG curves for hemp under air and nitrogen
BIOMASS ANALYSIS FOR COMBUSTION APPLICATIONS – CASE STUDY SCENARIOS
13
The mass loss for the first degradation step is under 10% (air or nitrogen) and for the second degradation step is under 90% for the samples under air and around 60% for the samples under nitrogen. The residual mass is under 5% for the sample in air and around 20% for the samples under nitrogen.
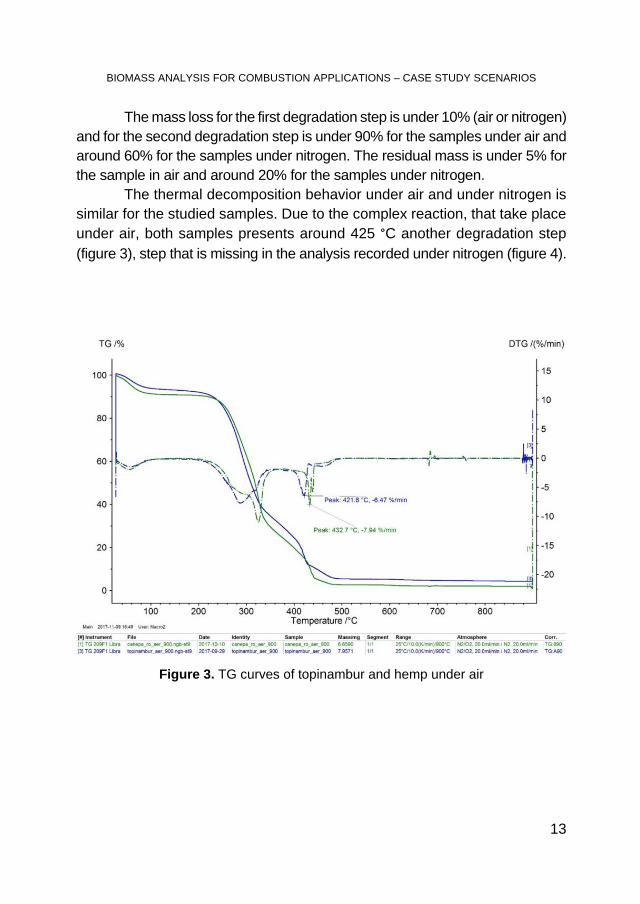
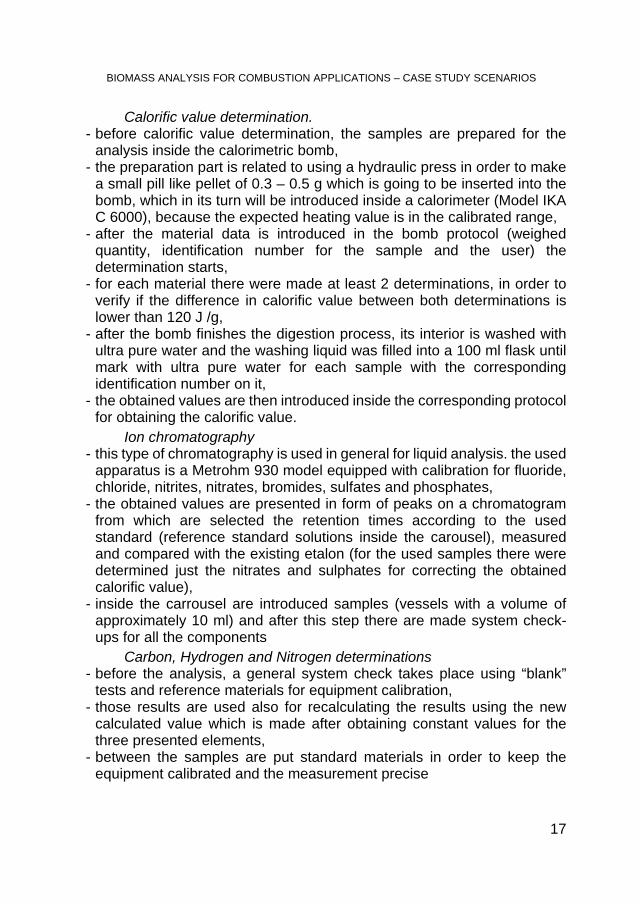
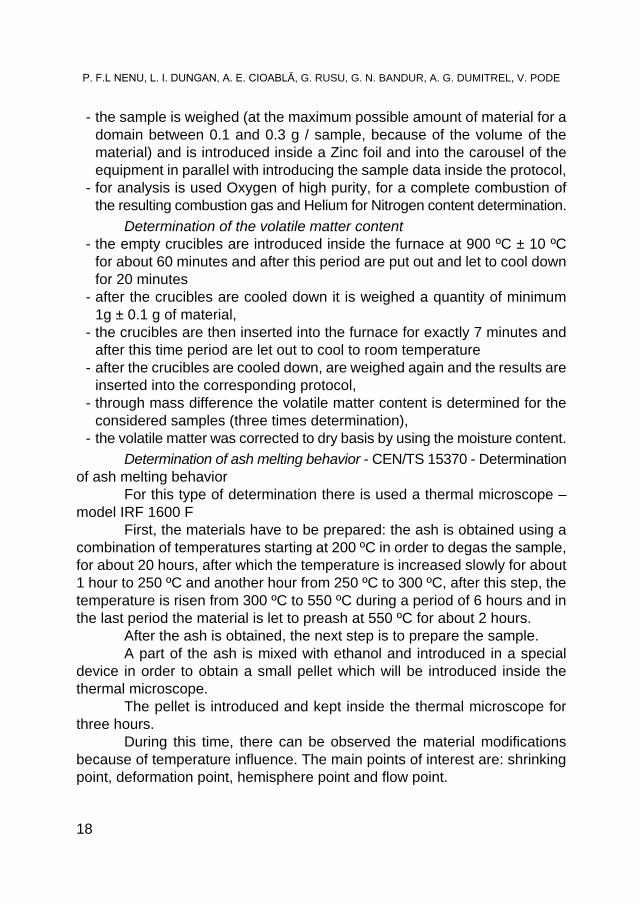
The thermal decomposition behavior under air and under nitrogen is similar for the studied samples. Due to the complex reaction, that take place under air, both samples presents around 425 °C another degradation step (figure 3), step that is missing in the analysis recorded under nitrogen (figure 4).
Figure 3. TG curves of topinambur and hemp under air
P. F.L NENU, L. I. DUNGAN, A. E. CIOABLĂ, G. RUSU, G. N. BANDUR, A. G. DUMITREL, V. PODE
14
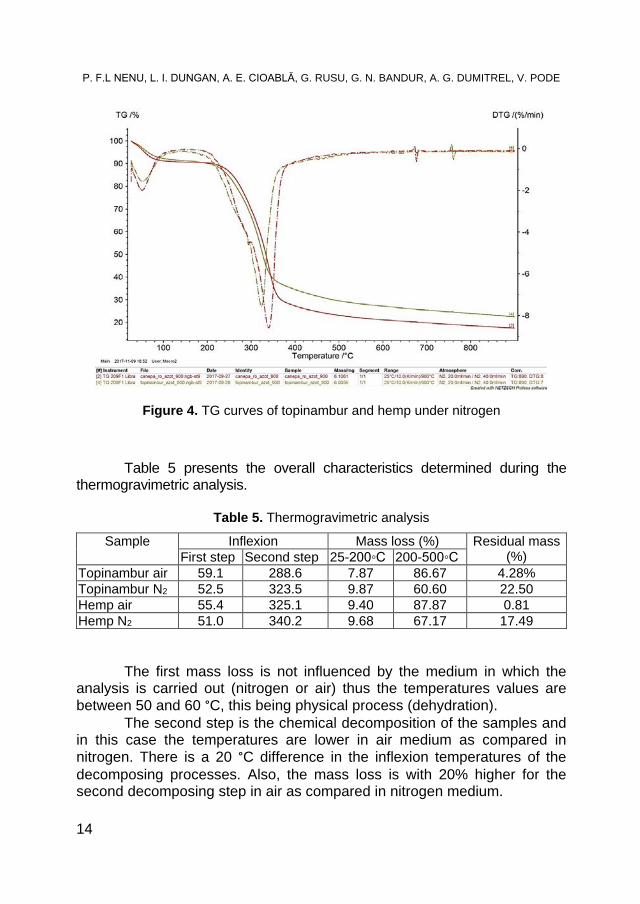
Figure 4. TG curves of topinambur and hemp under nitrogen Table 5 presents the overall characteristics determined during the
thermogravimetric analysis.
Table 5. Thermogravimetric analysis Sample Inflexion Mass loss (%) Residual mass
(%) First step Second step 25-200◦C 200-500◦C Topinambur air 59.1 288.6 7.87 86.67 4.28% Topinambur N2 52.5 323.5 9.87 60.60 22.50 Hemp air 55.4 325.1 9.40 87.87 0.81 Hemp N2 51.0 340.2 9.68 67.17 17.49
The first mass loss is not influenced by the medium in which the
analysis is carried out (nitrogen or air) thus the temperatures values are between 50 and 60 °C, this being physical process (dehydration).
The second step is the chemical decomposition of the samples and in this case the temperatures are lower in air medium as compared in nitrogen. There is a 20 °C difference in the inflexion temperatures of the decomposing processes. Also, the mass loss is with 20% higher for the second decomposing step in air as compared in nitrogen medium.
BIOMASS ANALYSIS FOR COMBUSTION APPLICATIONS – CASE STUDY SCENARIOS
15
The residual mass has lower value for the analysis that was carried out in air, fewer than 5%. Under nitrogen atmosphere the residual mass is around 20%; the difference is that in nitrogen atmosphere the carbon is decomposed as carbon black which is not oxidized to CO2. CONCLUSIONS
From the chemical analysis made on the two studied material, it can
be considered that both of them have a relatively high energetic potential and can further be used in firing processes.
The potentially corrosive elements inside the studied materials are in low quantities and pose no risks for the burning chamber in terms of deterioration on the long run.
Topinambur presents a higher flowing temperature which makes it more difficult to liquefy and from this point of view, hemp is easier to be evaluated and approached relative to its heating properties.
Topinambur and hemp are valuable raw materials that can be used in combustion processes. These materials were summited for physical, chemical and thermal analysis in order to determine the potential applications in combustion processes.
From the thermogravimetric analysis can be concluded that the chemical decomposition take place between 200 and 500◦C. Under air, the decomposition processes have complex reactions, which take place in two steps. The residual mass was found to be under 5% under air and around 20% under nitrogen atmosphere.
EXPERIMENTAL SECTION In the present paper there are studied 2 materials in terms of physical,
chemical and thermo analytical properties relative to their potential use in combustion processes, namely topinambur and Romanian hemp.
The used standards for laboratory determinations were: - EN ISO 18134 – Solid biofuels – Determination of moisture content –
Oven dry method (3); - EN ISO 18122- Solid biofuels - Determination of ash content; - EN 14918 - Solid biofuels –Determination of calorific value;
P. F.L NENU, L. I. DUNGAN, A. E. CIOABLĂ, G. RUSU, G. N. BANDUR, A. G. DUMITREL, V. PODE
16
- EN ISO 16948 – Solid biofuels – Determination of total content of carbon, hydrogen and nitrogen
- EN ISO 16994 - Solid biofuels ― Determination of total content of sulfur and chlorine
- EN ISO 18123 – Solid biofuels – Determination of the content of volatile matter.
- CEN/TS 15370 - Determination of ash melting behavior. Determination of moisture content.
- inside each vessel it was weighed approximately 1 g of material (balance precision 0.0001),
- there were made 3 time determinations for each sample, - the samples were introduced inside the furnace at 105 ºC for a period until
constant mass, - after the drying period, the samples were weighed again and the data
were introduced in the specified protocol, - for precision determinations, for samples with a high moisture content the
determinations were repeated once more. Ash content determination.
- before introducing the samples inside the furnace, the crucibles are let inside for about 2 hours at 550 °C and after this operation they are let to cool down for 10 – 15 minutes,
- after the crucibles are cooled, weighed and inside each of them it will be weighed minimum 1 g of material (balance precision 0,0001),
- the furnace is switched off after this step in order to cool down until a temperature lower than 100 °C,
- the process of ash content determination has 2 steps: first, the crucibles with the weighed samples are introduced inside the furnace and let at least 1 hour at 250 °C to allow volatile matter elimination before ignition (the temperature is raised up constantly to 250 °C over a period of 30 – 50 minutes),
- after this initial step, the temperature inside the furnace will be raised to 550 °C and thee samples will reside for a minimum of two hours
- after the determination the samples are put down from the furnace and let to cool for 2 -3 -5 minutes outside, and the cooled samples are then weighed and the results are introduced inside the corresponding protocol,
- for precision determinations, for samples with a high ash content the determinations were repeated once more
- because of the high temperatures it is difficult to number the crucibles, hence the numbered position inside the protocols,
- the ash content was corrected to dry basis by using the moisture content.
BIOMASS ANALYSIS FOR COMBUSTION APPLICATIONS – CASE STUDY SCENARIOS
17
Calorific value determination. - before calorific value determination, the samples are prepared for the
analysis inside the calorimetric bomb, - the preparation part is related to using a hydraulic press in order to make
a small pill like pellet of 0.3 – 0.5 g which is going to be inserted into the bomb, which in its turn will be introduced inside a calorimeter (Model IKA C 6000), because the expected heating value is in the calibrated range,
- after the material data is introduced in the bomb protocol (weighed quantity, identification number for the sample and the user) the determination starts,
- for each material there were made at least 2 determinations, in order to verify if the difference in calorific value between both determinations is lower than 120 J /g,
- after the bomb finishes the digestion process, its interior is washed with ultra pure water and the washing liquid was filled into a 100 ml flask until mark with ultra pure water for each sample with the corresponding identification number on it,
- the obtained values are then introduced inside the corresponding protocol for obtaining the calorific value.
Ion chromatography - this type of chromatography is used in general for liquid analysis. the used
apparatus is a Metrohm 930 model equipped with calibration for fluoride, chloride, nitrites, nitrates, bromides, sulfates and phosphates,
- the obtained values are presented in form of peaks on a chromatogram from which are selected the retention times according to the used standard (reference standard solutions inside the carousel), measured and compared with the existing etalon (for the used samples there were determined just the nitrates and sulphates for correcting the obtained calorific value),
- inside the carrousel are introduced samples (vessels with a volume of approximately 10 ml) and after this step there are made system check-ups for all the components
Carbon, Hydrogen and Nitrogen determinations - before the analysis, a general system check takes place using “blank”
tests and reference materials for equipment calibration, - those results are used also for recalculating the results using the new
calculated value which is made after obtaining constant values for the three presented elements,
- between the samples are put standard materials in order to keep the equipment calibrated and the measurement precise
P. F.L NENU, L. I. DUNGAN, A. E. CIOABLĂ, G. RUSU, G. N. BANDUR, A. G. DUMITREL, V. PODE
18
- the sample is weighed (at the maximum possible amount of material for a domain between 0.1 and 0.3 g / sample, because of the volume of the material) and is introduced inside a Zinc foil and into the carousel of the equipment in parallel with introducing the sample data inside the protocol,
- for analysis is used Oxygen of high purity, for a complete combustion of the resulting combustion gas and Helium for Nitrogen content determination.
Determination of the volatile matter content - the empty crucibles are introduced inside the furnace at 900 ºC ± 10 ºC
for about 60 minutes and after this period are put out and let to cool down for 20 minutes
- after the crucibles are cooled down it is weighed a quantity of minimum 1g ± 0.1 g of material,
- the crucibles are then inserted into the furnace for exactly 7 minutes and after this time period are let out to cool to room temperature
- after the crucibles are cooled down, are weighed again and the results are inserted into the corresponding protocol,
- through mass difference the volatile matter content is determined for the considered samples (three times determination),
- the volatile matter was corrected to dry basis by using the moisture content.
Determination of ash melting behavior - CEN/TS 15370 - Determination of ash melting behavior
For this type of determination there is used a thermal microscope – model IRF 1600 F
First, the materials have to be prepared: the ash is obtained using a combination of temperatures starting at 200 ºC in order to degas the sample, for about 20 hours, after which the temperature is increased slowly for about 1 hour to 250 ºC and another hour from 250 ºC to 300 ºC, after this step, the temperature is risen from 300 ºC to 550 ºC during a period of 6 hours and in the last period the material is let to preash at 550 ºC for about 2 hours.
After the ash is obtained, the next step is to prepare the sample. A part of the ash is mixed with ethanol and introduced in a special
device in order to obtain a small pellet which will be introduced inside the thermal microscope.
The pellet is introduced and kept inside the thermal microscope for three hours.
During this time, there can be observed the material modifications because of temperature influence. The main points of interest are: shrinking point, deformation point, hemisphere point and flow point.

BIOMASS ANALYSIS FOR COMBUSTION APPLICATIONS – CASE STUDY SCENARIOS
19
At the end of the process, the materials are put out of the thermal equipment and readings are made with the help of specific software in order to determine the correct temperature values.
Thermogravimetric analysis (TGA) were performed on TG 209 F1 Libra equipment (Netzsch) under nitrogen and air atmosphere and under dynamic conditions 10 K/min from 20 to 900 °C.
ACKNOWLEDGMENTS The authors acknowledge the contribution of BEA Institut fur
Bioenergie, Viena for their contribution relative to the physical and chemical analysis and the determination of the ash melting behavior.
R E F E R E N C E S
1. M.A. Rosen, Sustainability, 2009, 1, 55. 2. E. Toklu, M.S. Güney, M. Işık, O. Comaklı, K. Kaygusuz, Renewable &
Sustainable Energy Reviews, 2010, 14, 1172. 3. K. Hakeem, M. Jawaid, U. Rashid, “Biomass and bioenergy: applications”,
Springer-Verlag, New York, 2014. 4. K. Bilen, O. Ozyurt, K. Bakırcı, S. Karslı, S. Erdogan, M. Yılmaz, et al.,
Renewable & Sustainable Energy Reviews, 2008,12, 1529. 5. O. Edenhofer, R. Pichs Madruga, Y. Sokona, Climate Policy, 2012, 6, 1088. 6. J. Popp, Z. Lakner, M. Harangi-Rakos, M. Fari, Renewable & Sustainable
Energy Reviews, 2014, 32, 559. 7. S. Pereira, M. Costa, M.G. Carvalho, A. Rodrigues, Energy Conversion and
Management, 2016, 125, 242. 8. W.H. Chen, W.Y. Cheng, K.M. Lu, Y.P. Wuang, Applied Energy, 2011, 88,
3636. 9. U.S. Energy Information Administration. Biomass. Glossary, 2016, available at:
https://www.eia.gov/tools/glossary/index.cfm? Id=B, (accessed 03 January 2018).
10. DOE. Biomass Feedstocks, 2016, available at: http://www.energy.gov/eere/bioenergy/biomass-feedstocks, (accessed 03
January 2018). 11. Dicționar explicativ al limbii române, available at: https://dexonline.ro/definitie/biomas%C4%83/4403, (accessed 03 January 2018). 12. A. Balázsi, „Biomasa ca sursă de energie regenerabilă, analiza tehnologilor de
obţinere a energiei din aceasta”, 2013, available at: http://www.urbanaodorhei.ro/dokumentumok/Informaciok /Biomasa.pdf, (accessed 03 January 2018).
P. F.L NENU, L. I. DUNGAN, A. E. CIOABLĂ, G. RUSU, G. N. BANDUR, A. G. DUMITREL, V. PODE
20
13. Renewables 2014 Global Status Report. Renewable Energy Policy Network for the 21 St Century, REN21 Secretariat, Paris, 2014, EN21.
14. D. Pleissner, W.C. Lam, W. Han, K.Y. Lau, L.C. Cheung, M.W. Lee, BioMed Research International, 2014, 8, available at: http://dx.doi.org/10.1155/2014/819474.
15. W. Han, W.C. Lam, M. Melikoglu, M.T. Wong, H.T. Leung, C.L. Ng, ACS Sustainable Chemistry & Engineering, 2015, 3, 2043.
16. M. Melikoglu, C.S.K. Lin, C. Webb, Food and Bioproducts Processing, 2015, 95, 63.
17. C.S. Chou, S.H. Lin, C.C. Peng, W.C. Lu, Fuel Processing Technology, 2009, 90, 1041.
18. M. Main-Knorn, W.B. Cohen, R.E. Kennedy, W. Grodzki, D. Pflugmacher, P. Griffiths, Remote Sensing of Environment, 2013, 139, 277.
19. A. Nansaior, A. Patanothai, A.T. Rambo, S. Simaraks, Biomass Bioenergy, 2013, 52,113.
20. A. Aslan, Renewable & Sustainable Energy Reviews, 2016, 57, 362. 21. F. Rosillo-Calle, P. de Groot, S.L. Hemstock, J. Woods, “The Biomass Assessment
Handbook: Bioenergy for a Sustainable Environment”, Earthscan, London, 2007. 22. E. Ntona, G. Arabatzis, G.L. Kyriakopoulos, Renewable & Sustainable Energy
Reviews, 2015, 46, 1. 23. M.F. Demirbas, M. Balat, H. Balat, Energy Conversion and Management, 2009,
50, 1746. 24. C. Zaharia, Mix-ul perfect în energie, available at: http://www.green-
report.ro/mix-ul-perfect-in-energie-42-din-productia-de-energie-electrica-a-romaniei-asigurata-din-surse-regenerabile/, (accessed 03 January 2018).
25. Ministerul Economiei, Comertului si Mediului de Afaceri – Romania, NL Agency – Olanda, ENERO – Romania, „Master Plan Biomasă pentru România”, Bucureşti, 2010, available at: http://www.minind.ro/biomasa/Plan_de_Actiune_pentru_Biomasa.pdf, (accessed 03 January 2018).
26. M. Campoy, A. Gómez-Barea, P. Ollero, S. Nilsson, Fuel Processing Technology, 2014, 121, 63.
27. A. Demirbas, Chapter 2: “Fuels from Biomass”, In: Demirbas, A. (Ed.), “Biorefineries: for biomass upgrading facilities”. Springer, London, 2010, 33.
28. N. Kaliyan, R.V. Morey, Biomass and Bioenergy, 2009, 33, 337. 29. F.F. Felfli, P.J.M. Mesa, J.D. Rocha, D. Filippetto, C.A. Luengo, W.A. Pippo,
Biomass and Bioenergy, 2011, 35, 236. 30. L. Cuiping, W. Chuangzhi, Yanyongjie, H. Huang, Biomass and Bioenergy,
2004, 27, 119. 31. S. Pérez, C.J. Renedo, A. Ortiz, M. Mañana, Biomass and Bioenergy, 2011, 35,
4657. 32. A.E.Cioablă, N. Pop, G. Trif-Tordai, D.G. Călinoiu, Journal of Thermal Analysis
and Calorimetry, 2017, 127, 515.
STUDIA UBB CHEMIA, LXIII, 3, 2018 (p. 21-39) (RECOMMENDED CITATION) DOI:10.24193/subbchem.2018.3.02
CHARACTERIZATION OF ACTIVATED BEECH WOOD CHAR – METHANE STORAGE APPLICATION
KATARZYNA PSTROWSKAa,*, JAN KACZMARCZYKa, HANNA CZAPOR-IRZABEKb, MAREK KUŁAŻYŃSKIa
ABSTRACT. Commercial beech wood char characterized by low volatile matter (5.3%) and high carbon content (94.5 %) was initially used as a potential feedstock to obtain the activated carbon for methane sorption. Micro- and mesopores volumes were determined to be at the level of 0.21 cm3∙g-1, while the specific surface area of the material was determined to be at the level of 416 m2∙g-1. Carbonization carried out at the temperature range of 750-900 oC resulted in slight increase of the pore volume (up to the value of 0.23 cm3∙g-1) and the specific surface area (up to the value of 480 m2∙g-1). Upon the steam activation (up to the 50 % loss of the organic mass) the specific surface area increased substantially and was within the range of 887 - 943 m2∙g-1 together with mico- and mesopores volumes that was within the range of 0.54 - 0.58 cm3∙g-1. The maximum methane adsorption was determined for the sample activated at a temperature of 800 oC – 17.7 g∙kg-1 with a process reversibility of 84.2%. Considering the beech wood char price, its availability and well-known methods of its surface structure improvement, the obtained active carbons are interesting for their testing on a larger scale.
Keywords: adsorption; biomass; active carbon; steam activation; carbonization
INTRODUCTION Natural gas, whose main component is methane, is more
environmentally friendly and cheaper than traditionally used crude oil-origin fuels [1]. Among all hydrocarbons, methane has the highest hydrogen-to-carbon ratio and consequently a higher research octane number (RON = 107).
a Wroclaw University of Science and Technology, Faculty of Chemistry, Division of Fuels
Chemistry and Technology, Gdańska 7/9, 50-344 Wrocław, Poland b Wroclaw Medical University, Faculty of Pharmacy, Laboratory of Elemental Analysis and
Structural Research, Borowska 211A, 50-556 Wrocław, Poland * Corresponding author: [email protected]
K. PSTROWSKA, J. KACZMARCZYK, H. CZAPOR-IRZABEK, M. KUŁAŻYŃSKI
22
Among all hydrocarbon fuels, combustion of methane produces the smallest amount of CO2 for each unit of heat that is released [2].
Four different methods were proposed for the storage of natural gas, i.e., liquefied natural gas (LNG), compressed natural gas (CNG), adsorbed natural gas (ANG) and natural gas hydrate (NGH). Among these, ANG technology enables the greatest efficiency in the storage of natural gas [3]. In a conventional high-pressure storage tank, gas is forced into the tank under pressure. Greater pressures enable larger volumes of gas to be stored in the tank. The maximum pressure, and therefore the volume of gas held in the tank, is limited by the physical properties of the tank and its valve. Microporous materials – methane adsorbents, which are used as a filling of a gas tank – may perform two functions: reducing the pressure of gas storage (reasons of the tank user safety) and increasing the volume of the gas storage in the tank (economic reasons - a less frequent exchange/tank filling). Development of efficient and cost-effective adsorbent materials is the key to a successful adsorbed natural gas technology. The most important attributes of commercial ANG sorbent is to have a high surface area per unit mass with regular porous structure, high adsorption capacity, mechanical resistance to pressure variations, and high reversibility of the CH4 adsorption.
The search for suitable porous material in terms of improving ANG storage volumetric energy density and lowering the adsorbent cost to the end user is currently an active area of research. Among different porous materials, metal organic frameworks (MOFs), covalent organic frameworks (COFs), zeolites, and active carbons (ACs) have been intensively examined. MOF chemistry offers potential challenging issues typical to CH4 storage due to their unique modularity, unprecedented tunability, and high degree of porosity combined with diverse framework functionalities. However, the commercial applications of MOFs are still restricted due to their limited mechanical robustness, low density, low volumetric adsorption in a synthesized powder form [4-5]. A comprehensive understanding on stability and performance is required against the typical operating conditions to realize these materials for commercial applications. Also, from the commercial point of view, high production costs strongly limit the possibility of their use. Comparing to all types of other potential sorbents, MOFs are also characterized by other factors such as open metal sites, porosity, topologies and framework densities, which can strongly improve methane adsorption capacity [5-9]. Covalent organic frameworks (COFs) are another class of crystalline materials built from organic linkers, which are made up of light elements (C, O, B, and Si) and held together by strong covalent bonds (–O, C–C, B–C, C–N and C–Si) [10-11]. Compared to MOFs, COF materials are more favorable when accounting for gravimetric uptake of natural gas compounds. Both MOFs and COFs are characterized as
CHARACTERIZATION OF ACTIVATED BEECH WOOD CHAR – METHANE STORAGE APPLICATION
23
crystalline, porous types of materials. Nevertheless, the absence of metal elements in the COF structure strongly reduces the synthesis costs of the material. One of the major advantages compared to MOFs is the possibility of obtaining COFs of similar porous structure characterized with a much lower density [5, 10, 12]. Still, a comprehensive understanding on material stability and large-size methods of production is required before the commercial application of COFs can be possible. The other disadvantage of these materials as methane sorbents is the small number of published experimental studies available (calculated vs. experimental results). To a large extent, the methane sorption capacity and the possibility of achieving extensive surface of the COFs is analyzed by computational methods [13-15]. Practical application of these materials therefore requires a considerable intensification of laboratory tests.
Several materials created by nature have a regular structure that can be modified by simple, well-known physico-chemical methods and lead to materials having a well-developed porous structure. Among them, zeolites and carbonaceous materials (as selected biomass materials) play the most important role. As potential methane sorbents, molecular sieves have strong advantages, such as being naturally regular, stable, and controllable channel structures and having similar surface chemical structures [16]. Methane adsorption on natural zeolite adsorbents has been widely investigated, as in case of the use of calculation methods as well as experimental studies, e.g. [17-19]. It was proven that zeolites have relatively high packing densities (compared to ACs) but have lower micropore volumes. In addition, zeolites are extremely hydrophilic and can lose their adsorption capacity for methane with time due to preferential moisture adsorption. On the other hand, it has been shown that ACs are very good adsorbents, presenting the highest ANG energy densities and thus the highest storage capacities. ACs can be essentially microporous materials with low mesoporosity and absence of macroporosity if they are properly prepared. This leads to a high packing density and an important volumetric capacity for methane storage. ACs obtained from biomass are characterized primarily by low price and high availability. Regardless of the above, the primary criterion for the selection of biomass raw material as active carbon is a high carbon content and low volatile matter, which provides stable structure and high production capacity in the process of thermal treatment. Among the many methods used, the most common are chemical activation (mainly with the use of KOH as activating agent [1,20-22]) and physical activation, where steam and/or CO2 is used ad activation agent, e.g. [23-26]. Textural properties (i.e., adsorption capacity [surface area and micropore volume] or the micropore size distribution) are the main factors responsible for gas uptake. The pores’ shape, size, surface area, and mechanical resistance to pressure changes of the material is affected not only by the activation
K. PSTROWSKA, J. KACZMARCZYK, H. CZAPOR-IRZABEK, M. KUŁAŻYŃSKI
24
method but the reactivity of the material. So far, several biomass materials have been used as AC precursors for methane storage. Coconut shells were used by Azevedo et al. [27] for the preparation of ACs with chemical activation (ZnCl2 as the activation agent) followed by physical activation. Depending on the amount of the activating agent, the authors obtained materials characteristic of 1090-2270 m2/g BET surface and 80-92% microporosity. A maximum adsorption of the methane at 25 °C and 40 bar was demonstrated at the level of ca. 122 mg/g with almost 94 % reversibility. KOH-activated sugarcane molasses was used by Sreńscek-Nazzal et al. [22]. The highest methane adsorption was measured at the level of ca. 197 mg/g at 20 °C and 50 bar. BET surface area of the materials obtained at the temperature range of 400-800 °C was determined at the level of 413-1202 m2/g. To the authors’ knowledge, ACs were both prepared chemically, as physical activation is mainly used for water purification and removal of specific organic compounds from water or gaseous mixtures. The abovementioned examples of the coconut shells [27] and sugarcane molasses [22] indicate the possibility of obtaining a good sorbent with high sorption methane capacity at a low cost of material production.
This study sought to verify the possibility for using low-cost biomass material as a methane sorbent precursor. High carbon content and low volatile matter were decisive for the use of beech wood char as a commercially available and low-cost material. According to the above comments, the present paper focuses on (1) analysis and discussion of the potential use of beech wood char as an active carbon precursor, (2) analysis of the influence of carbonization and activation parameters on the porous structure of beech wood char and the possibility of using the obtained materials as methane sorbents, including adsorption capacity and reversibility of the process.
RESULTS AND DISCUSSION Beech wood char characterization
The commercial beech wood char material (KB) is characterized by ca. 17 % content of the ballast (the total amount of moisture and ash) and a small amount of volatile matter (5.3% daf, Table 1). A low content of volatile matter shows that the industrial producer of the char used a higher carbonization temperature than the temperature commonly used in case of commercial carbonization (usually used in the range of 500 - 600 °C [28]). A higher beech wood carbonization temperature was also confirmed by elemental composition of the material. Such high content of carbon in case of the beech wood char
CHARACTERIZATION OF ACTIVATED BEECH WOOD CHAR – METHANE STORAGE APPLICATION
25
was previously observed by Zeng et al. [29] (94.4 wt. % at the pyrolysis final temperature of 1600 oC), and Guizani et al. [30] (ca. 91 wt. % calculated on dry basis, pyrolysis temperature at the level of 900 oC). KB material containing a small amount of volatile matter and built mainly of carbon meets two basic criteria regarding the proper raw material for the activated carbon production process.
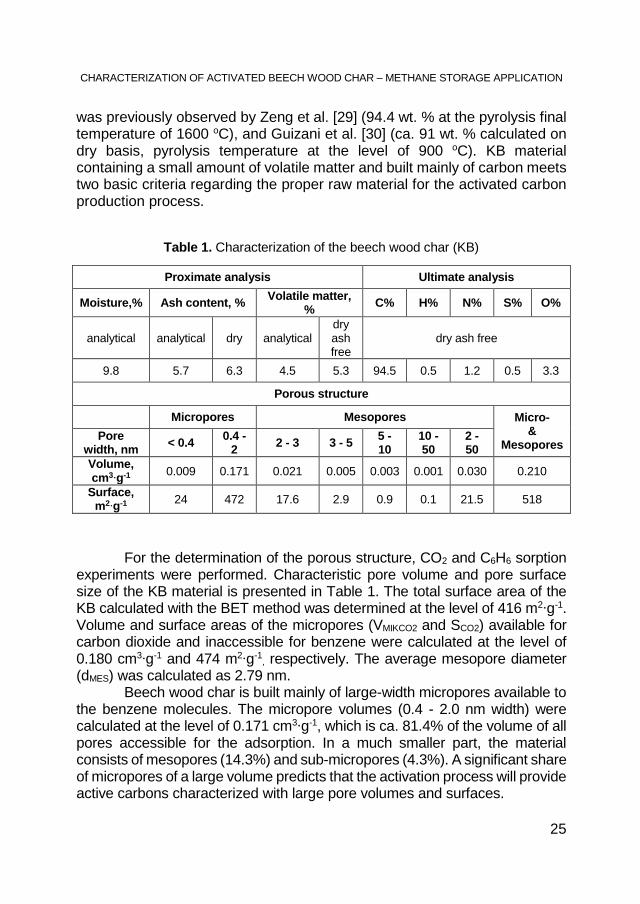
Table 1. Characterization of the beech wood char (KB)
Proximate analysis Ultimate analysis
Moisture,% Ash content, % Volatile matter, % C% H% N% S% O%
analytical analytical dry analytical dry ash free
dry ash free
9.8 5.7 6.3 4.5 5.3 94.5 0.5 1.2 0.5 3.3
Porous structure
Micropores Mesopores Micro- &
Mesopores Pore
width, nm < 0.4 0.4 - 2 2 - 3 3 - 5 5 -
10 10 - 50
2 - 50
Volume, cm3∙g-1 0.009 0.171 0.021 0.005 0.003 0.001 0.030 0.210
Surface, m2∙g-1 24 472 17.6 2.9 0.9 0.1 21.5 518
For the determination of the porous structure, CO2 and C6H6 sorption experiments were performed. Characteristic pore volume and pore surface size of the KB material is presented in Table 1. The total surface area of the KB calculated with the BET method was determined at the level of 416 m2∙g-1. Volume and surface areas of the micropores (VMIKCO2 and SCO2) available for carbon dioxide and inaccessible for benzene were calculated at the level of 0.180 cm3∙g-1 and 474 m2∙g-1
, respectively. The average mesopore diameter (dMES) was calculated as 2.79 nm. Beech wood char is built mainly of large-width micropores available to the benzene molecules. The micropore volumes (0.4 - 2.0 nm width) were calculated at the level of 0.171 cm3∙g-1, which is ca. 81.4% of the volume of all pores accessible for the adsorption. In a much smaller part, the material consists of mesopores (14.3%) and sub-micropores (4.3%). A significant share of micropores of a large volume predicts that the activation process will provide active carbons characterized with large pore volumes and surfaces.
K. PSTROWSKA, J. KACZMARCZYK, H. CZAPOR-IRZABEK, M. KUŁAŻYŃSKI
26
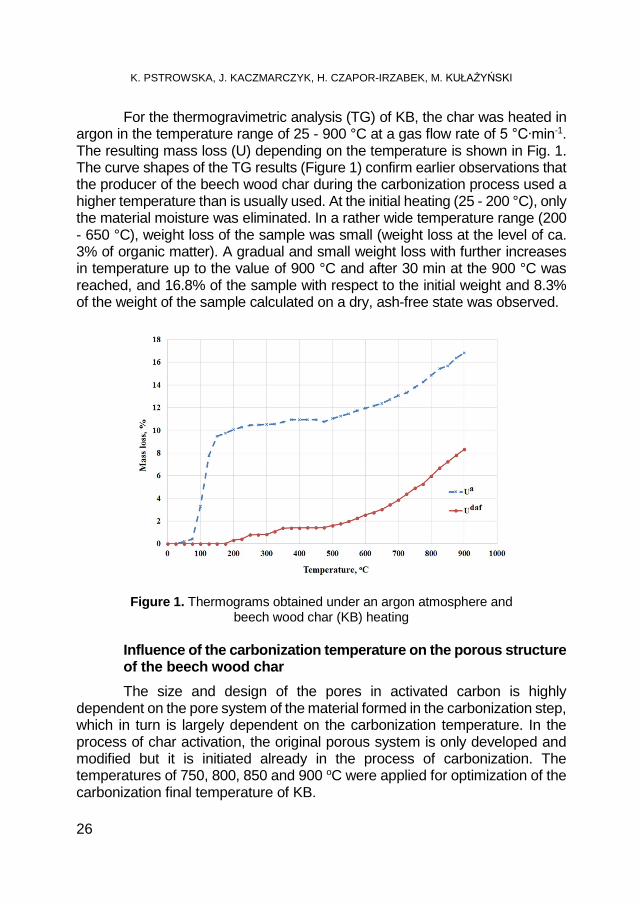
For the thermogravimetric analysis (TG) of KB, the char was heated in argon in the temperature range of 25 - 900 °C at a gas flow rate of 5 °C∙min-1. The resulting mass loss (U) depending on the temperature is shown in Fig. 1. The curve shapes of the TG results (Figure 1) confirm earlier observations that the producer of the beech wood char during the carbonization process used a higher temperature than is usually used. At the initial heating (25 - 200 °C), only the material moisture was eliminated. In a rather wide temperature range (200 - 650 °C), weight loss of the sample was small (weight loss at the level of ca. 3% of organic matter). A gradual and small weight loss with further increases in temperature up to the value of 900 °C and after 30 min at the 900 °C was reached, and 16.8% of the sample with respect to the initial weight and 8.3% of the weight of the sample calculated on a dry, ash-free state was observed.
Figure 1. Thermograms obtained under an argon atmosphere and beech wood char (KB) heating
Influence of the carbonization temperature on the porous structure of the beech wood char
The size and design of the pores in activated carbon is highly dependent on the pore system of the material formed in the carbonization step, which in turn is largely dependent on the carbonization temperature. In the process of char activation, the original porous system is only developed and modified but it is initiated already in the process of carbonization. The temperatures of 750, 800, 850 and 900 oC were applied for optimization of the carbonization final temperature of KB.
CHARACTERIZATION OF ACTIVATED BEECH WOOD CHAR – METHANE STORAGE APPLICATION
27
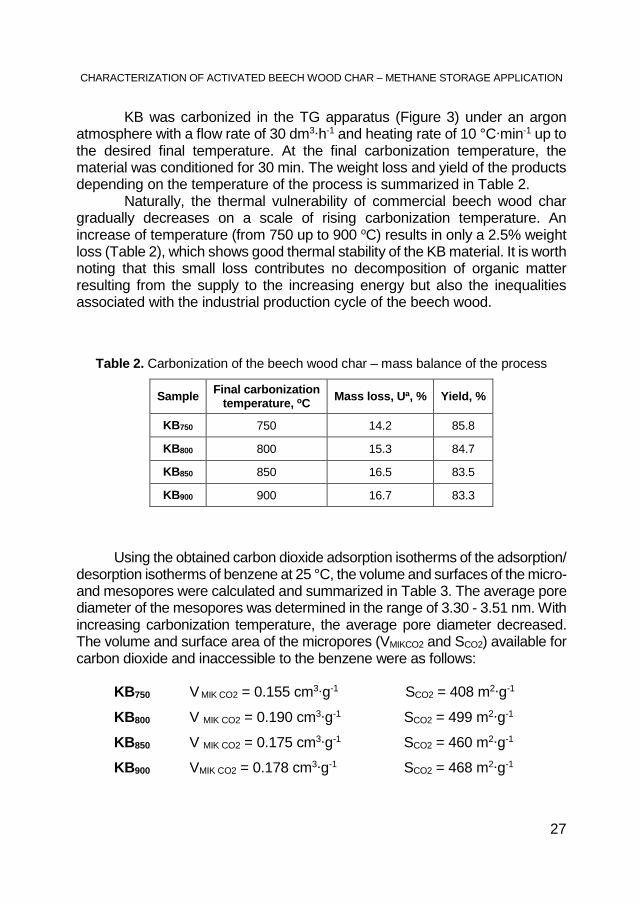
KB was carbonized in the TG apparatus (Figure 3) under an argon atmosphere with a flow rate of 30 dm3∙h-1 and heating rate of 10 °C∙min-1 up to the desired final temperature. At the final carbonization temperature, the material was conditioned for 30 min. The weight loss and yield of the products depending on the temperature of the process is summarized in Table 2.
Naturally, the thermal vulnerability of commercial beech wood char gradually decreases on a scale of rising carbonization temperature. An increase of temperature (from 750 up to 900 oC) results in only a 2.5% weight loss (Table 2), which shows good thermal stability of the KB material. It is worth noting that this small loss contributes no decomposition of organic matter resulting from the supply to the increasing energy but also the inequalities associated with the industrial production cycle of the beech wood.
Table 2. Carbonization of the beech wood char – mass balance of the process
Sample Final carbonization temperature, oC Mass loss, Ua, % Yield, %
KB750 750 14.2 85.8
KB800 800 15.3 84.7
KB850 850 16.5 83.5
KB900 900 16.7 83.3
Using the obtained carbon dioxide adsorption isotherms of the adsorption/ desorption isotherms of benzene at 25 °C, the volume and surfaces of the micro- and mesopores were calculated and summarized in Table 3. The average pore diameter of the mesopores was determined in the range of 3.30 - 3.51 nm. With increasing carbonization temperature, the average pore diameter decreased. The volume and surface area of the micropores (VMIKCO2 and SCO2) available for carbon dioxide and inaccessible to the benzene were as follows:
KB750 V MIK CO2 = 0.155 cm3∙g-1 SCO2 = 408 m2∙g-1
KB800 V MIK CO2 = 0.190 cm3∙g-1 SCO2 = 499 m2∙g-1
KB850 V MIK CO2 = 0.175 cm3∙g-1 SCO2 = 460 m2∙g-1
KB900 VMIK CO2 = 0.178 cm3∙g-1 SCO2 = 468 m2∙g-1
K. PSTROWSKA, J. KACZMARCZYK, H. CZAPOR-IRZABEK, M. KUŁAŻYŃSKI
28
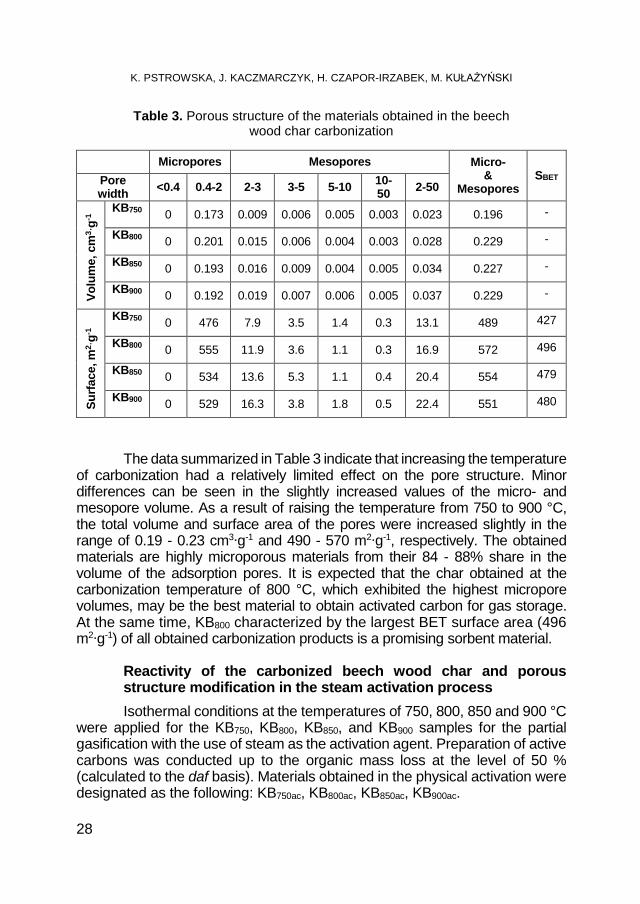
Table 3. Porous structure of the materials obtained in the beech wood char carbonization
Micropores Mesopores Micro-
& Mesopores
SBET Pore width <0.4 0.4-2 2-3 3-5 5-10 10-
50 2-50
Volu
me,
cm
3 ∙g-1
KB750 0 0.173 0.009 0.006 0.005 0.003 0.023 0.196 -
KB800 0 0.201 0.015 0.006 0.004 0.003 0.028 0.229 -
KB850 0 0.193 0.016 0.009 0.004 0.005 0.034 0.227 -
KB900 0 0.192 0.019 0.007 0.006 0.005 0.037 0.229 -
Surfa
ce, m
2 ∙g-1
KB750 0 476 7.9 3.5 1.4 0.3 13.1 489 427
KB800 0 555 11.9 3.6 1.1 0.3 16.9 572 496
KB850 0 534 13.6 5.3 1.1 0.4 20.4 554 479
KB900 0 529 16.3 3.8 1.8 0.5 22.4 551 480
The data summarized in Table 3 indicate that increasing the temperature of carbonization had a relatively limited effect on the pore structure. Minor differences can be seen in the slightly increased values of the micro- and mesopore volume. As a result of raising the temperature from 750 to 900 °C, the total volume and surface area of the pores were increased slightly in the range of 0.19 - 0.23 cm3∙g-1 and 490 - 570 m2∙g-1, respectively. The obtained materials are highly microporous materials from their 84 - 88% share in the volume of the adsorption pores. It is expected that the char obtained at the carbonization temperature of 800 °C, which exhibited the highest micropore volumes, may be the best material to obtain activated carbon for gas storage. At the same time, KB800 characterized by the largest BET surface area (496 m2∙g-1) of all obtained carbonization products is a promising sorbent material.
Reactivity of the carbonized beech wood char and porous structure modification in the steam activation process
Isothermal conditions at the temperatures of 750, 800, 850 and 900 °C were applied for the KB750, KB800, KB850, and KB900 samples for the partial gasification with the use of steam as the activation agent. Preparation of active carbons was conducted up to the organic mass loss at the level of 50 % (calculated to the daf basis). Materials obtained in the physical activation were designated as the following: KB750ac, KB800ac, KB850ac, KB900ac.
CHARACTERIZATION OF ACTIVATED BEECH WOOD CHAR – METHANE STORAGE APPLICATION
29
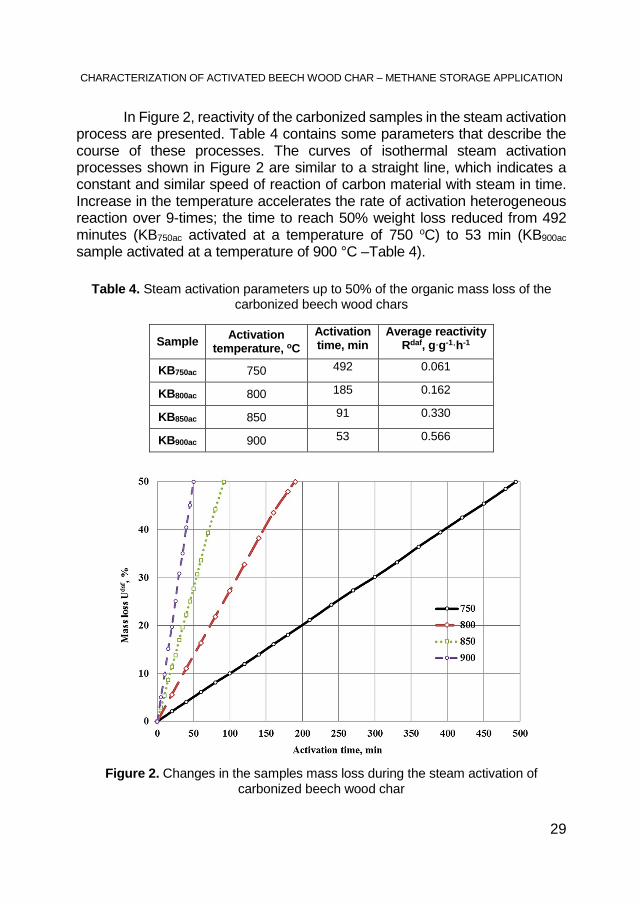
In Figure 2, reactivity of the carbonized samples in the steam activation process are presented. Table 4 contains some parameters that describe the course of these processes. The curves of isothermal steam activation processes shown in Figure 2 are similar to a straight line, which indicates a constant and similar speed of reaction of carbon material with steam in time. Increase in the temperature accelerates the rate of activation heterogeneous reaction over 9-times; the time to reach 50% weight loss reduced from 492 minutes (KB750ac activated at a temperature of 750 oC) to 53 min (KB900ac sample activated at a temperature of 900 °C –Table 4).
Table 4. Steam activation parameters up to 50% of the organic mass loss of the carbonized beech wood chars
Sample Activation temperature, oC
Activation time, min
Average reactivity Rdaf, g∙g-1∙h-1
KB750ac 750 492 0.061
KB800ac 800 185 0.162
KB850ac 850 91 0.330
KB900ac 900 53 0.566
Figure 2. Changes in the samples mass loss during the steam activation of carbonized beech wood char
K. PSTROWSKA, J. KACZMARCZYK, H. CZAPOR-IRZABEK, M. KUŁAŻYŃSKI
30
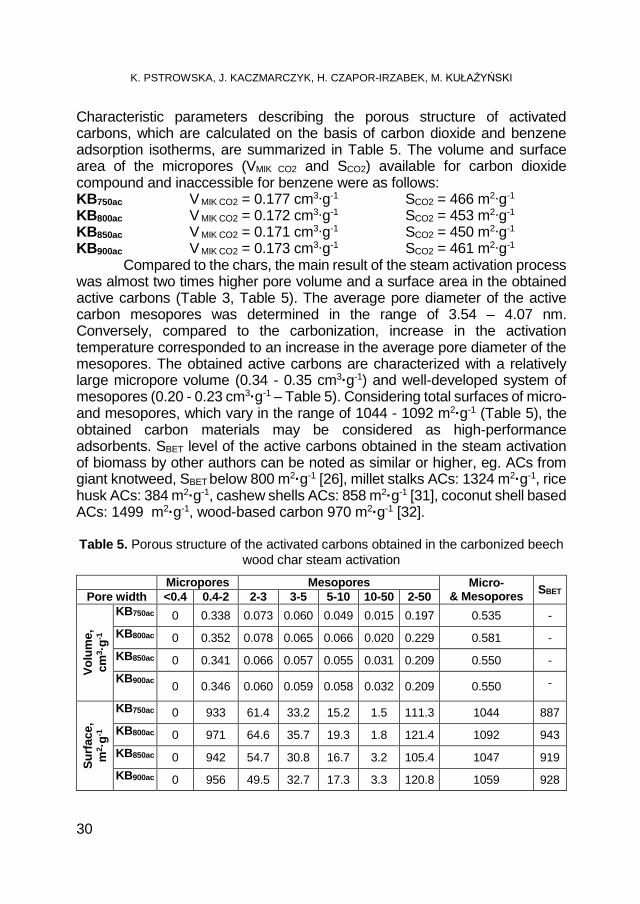
Characteristic parameters describing the porous structure of activated carbons, which are calculated on the basis of carbon dioxide and benzene adsorption isotherms, are summarized in Table 5. The volume and surface area of the micropores (VMIK CO2 and SCO2) available for carbon dioxide compound and inaccessible for benzene were as follows: KB750ac V MIK CO2 = 0.177 cm3∙g-1 SCO2 = 466 m2∙g-1 KB800ac V MIK CO2 = 0.172 cm3∙g-1 SCO2 = 453 m2∙g-1 KB850ac V MIK CO2 = 0.171 cm3∙g-1 SCO2 = 450 m2∙g-1 KB900ac V MIK CO2 = 0.173 cm3∙g-1 SCO2 = 461 m2∙g-1 Compared to the chars, the main result of the steam activation process was almost two times higher pore volume and a surface area in the obtained active carbons (Table 3, Table 5). The average pore diameter of the active carbon mesopores was determined in the range of 3.54 – 4.07 nm. Conversely, compared to the carbonization, increase in the activation temperature corresponded to an increase in the average pore diameter of the mesopores. The obtained active carbons are characterized with a relatively large micropore volume (0.34 - 0.35 cm3·g-1) and well-developed system of mesopores (0.20 - 0.23 cm3·g-1 – Table 5). Considering total surfaces of micro- and mesopores, which vary in the range of 1044 - 1092 m2·g-1 (Table 5), the obtained carbon materials may be considered as high-performance adsorbents. SBET level of the active carbons obtained in the steam activation of biomass by other authors can be noted as similar or higher, eg. ACs from giant knotweed, SBET below 800 m2·g-1 [26], millet stalks ACs: 1324 m2·g-1, rice husk ACs: 384 m2·g-1, cashew shells ACs: 858 m2·g-1 [31], coconut shell based ACs: 1499 m2·g-1, wood-based carbon 970 m2·g-1 [32]. Table 5. Porous structure of the activated carbons obtained in the carbonized beech
wood char steam activation
Micropores Mesopores Micro- & Mesopores SBET Pore width <0.4 0.4-2 2-3 3-5 5-10 10-50 2-50
Volu
me,
cm
3 ·g-1
KB750ac 0 0.338 0.073 0.060 0.049 0.015 0.197 0.535 - KB800ac 0 0.352 0.078 0.065 0.066 0.020 0.229 0.581 - KB850ac 0 0.341 0.066 0.057 0.055 0.031 0.209 0.550 - KB900ac 0 0.346 0.060 0.059 0.058 0.032 0.209 0.550 -
Surfa
ce,
m2 ·g
-1
KB750ac 0 933 61.4 33.2 15.2 1.5 111.3 1044 887 KB800ac 0 971 64.6 35.7 19.3 1.8 121.4 1092 943 KB850ac 0 942 54.7 30.8 16.7 3.2 105.4 1047 919 KB900ac 0 956 49.5 32.7 17.3 3.3 120.8 1059 928
CHARACTERIZATION OF ACTIVATED BEECH WOOD CHAR – METHANE STORAGE APPLICATION
31
Increase in the activation temperature by 150 °C resulted in a significant reduction of the activation time (Table 4). A shorter contact time between the activation agent and the carbonized char did not strongly influence the porous structure of the obtained active carbons. Taking into account the development of the material surface and the amount of specific pore volumes/width (Table 5), it can be noticed that in the range of 750-900 °C the carbonized beech wood char retains a similar structure. That is why, considering the activation time for the assumed 50% of organic mass loss, the most economically preferable would be the activation temperature of 900 °C (the shortest activation time). On the other hand, considering the methane storage, the KB800ac material of the most developed surface area (943 m2·g-1) and the most developed micro-mesoporous structure (1092 m2·g-1), obtained at the activation temperature of 800 °C, is the most preferable.
Beech wood char as methane sorbent
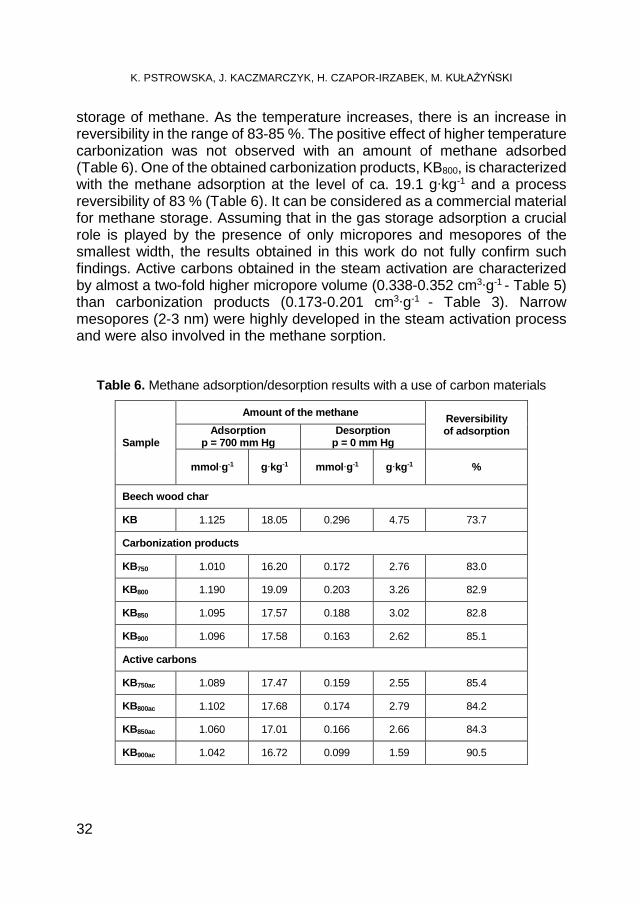
To evaluate the obtained carbons as methane storage materials, tests of methane adsorption in the sorption apparatus (Fig. 4) were conducted. The following parameters of the test were applied: the temperature of 25 °C and methane pressure in the range of 0-700 mm Hg. Based on the determined adsorption/desorption isotherms, the following parameters of the prepared carbons were calculated: the amount of methane adsorbed at the pressure of 700 mm Hg (aad,700, mmol∙g-1; g∙kg-1); the amount of methane remaining in the pores after desorption process at a pressure of 0 mm Hg (ades,0; mmol∙g-1; g∙kg-1); and the amount of methane desorbed at a pressure of 0 mm Hg (aad,700 – ades,0; mmol∙g-1; g∙kg-1). All the obtained results are summarized in Table 6. The calculation of the CH4 mmol∙g-1 per g∙kg-1 was prepared with the assumption of methane molar mass equal 16.043 g∙mol-1.
Large quantities of methane (about 18 g∙kg-1) were adsorbed on the KB surface at a pressure of 700 mmHg. Nevertheless, the reversibility of this process is not satisfactory. It can be assumed that the cause of approx. 26% loss of methane in the desorption process is the geometry of pores (closed or narrow). As expected, the carbonization caused the expansion of the preferred size pores and a greater share of the reversible adsorption. Carbonization at the temperature range of 750-900 °C resulted in a slight increase in the volume and surface micro- and mesopores (mesopores mainly of the smallest widths: 2 - 3 nm; Table 3). As is already known, these pores play the most significant role in the methane sorption process (micro- and small mesopores). A significant improvement in the properties of materials caused by carbonization process is evident in the case of reversible
K. PSTROWSKA, J. KACZMARCZYK, H. CZAPOR-IRZABEK, M. KUŁAŻYŃSKI
32
storage of methane. As the temperature increases, there is an increase in reversibility in the range of 83-85 %. The positive effect of higher temperature carbonization was not observed with an amount of methane adsorbed (Table 6). One of the obtained carbonization products, KB800, is characterized with the methane adsorption at the level of ca. 19.1 g∙kg-1 and a process reversibility of 83 % (Table 6). It can be considered as a commercial material for methane storage. Assuming that in the gas storage adsorption a crucial role is played by the presence of only micropores and mesopores of the smallest width, the results obtained in this work do not fully confirm such findings. Active carbons obtained in the steam activation are characterized by almost a two-fold higher micropore volume (0.338-0.352 cm3∙g-1 - Table 5) than carbonization products (0.173-0.201 cm3∙g-1 - Table 3). Narrow mesopores (2-3 nm) were highly developed in the steam activation process and were also involved in the methane sorption.
Table 6. Methane adsorption/desorption results with a use of carbon materials
Sample
Amount of the methane Reversibility of adsorption Adsorption
p = 700 mm Hg Desorption
p = 0 mm Hg
mmol∙g-1 g∙kg-1 mmol∙g-1 g∙kg-1 %
Beech wood char
KB 1.125 18.05 0.296 4.75 73.7
Carbonization products
KB750 1.010 16.20 0.172 2.76 83.0
KB800 1.190 19.09 0.203 3.26 82.9
KB850 1.095 17.57 0.188 3.02 82.8
KB900 1.096 17.58 0.163 2.62 85.1
Active carbons
KB750ac 1.089 17.47 0.159 2.55 85.4
KB800ac 1.102 17.68 0.174 2.79 84.2
KB850ac 1.060 17.01 0.166 2.66 84.3
KB900ac 1.042 16.72 0.099 1.59 90.5

CHARACTERIZATION OF ACTIVATED BEECH WOOD CHAR – METHANE STORAGE APPLICATION
33
Activated carbons are characterized with 3-4 times higher volume of 2-3 nm width mesopores (up to the value of 0.078 cm3∙g-1 in case of KB800ac sample – Table 5) than carbonized beech wood char samples. Nevertheless, the level of methane adsorbed is similar, as in the case of carbonized samples (16.2-19.1 g∙kg-1) and in the case of activated carbons (16.7-17.7 g∙kg-1 - Table 6). These results confirm the findings of other researchers that the storage of methane in the porous material is not only controlled by the micropore volume of the material but that their geometry also plays an important role [33, 34].
CONCLUSIONS
Commercial beech wood char was initially treated as a potential substrate for receiving the activated carbon for methane sorption. Commercial beech wood char is characterized by low volatile matter (5.3%) and high carbon content (94.5%). The original porous structure of the material is well developed. Micro- and mesoporous volumes were determined at the level of 0.21 cm3∙g-1, while SBET of the material was determined at the level of 416 m2∙g-1. This material meets all the basic conditions required for precursors of activated carbons. Carbonization conducted at the temperature range of 750-900 °C did not significantly affect the pore system. The improvement resulted in slightly increasing pore volumes in the range of 0.19-0.23 cm3∙g-1. The most favorable system for methane storage was developed in the carbonization step at a final process temperature of 800 °C. The methane adsorption level was determined as 19 g∙kg-1 with 83% reversibility of the process. Steam activation of chars were characterized with SBET within the range of 1044 - 1092 m2∙g-1 and micro- and mesoporous volumes within the range of 0.54 – 0.58 cm3∙g-1. The maximum methane adsorption was determined for the sample activated at a temperature of 800 oC – 17.7 g∙kg-1 with a process reversibility of 84.2%.
EXPERIMENTAL SECTION Beech wood char and active carbons characterization
As the raw material, a commercial beech wood char (KB) with different grain sizes was used. For the following studies, a 0.5-3.15 mm sieve fraction was isolated. The following analyses were utilized with the carbon material: elemental analysis (CHNS EA 1110 CE Instruments), proximate analysis
K. PSTROWSKA, J. KACZMARCZYK, H. CZAPOR-IRZABEK, M. KUŁAŻYŃSKI
34
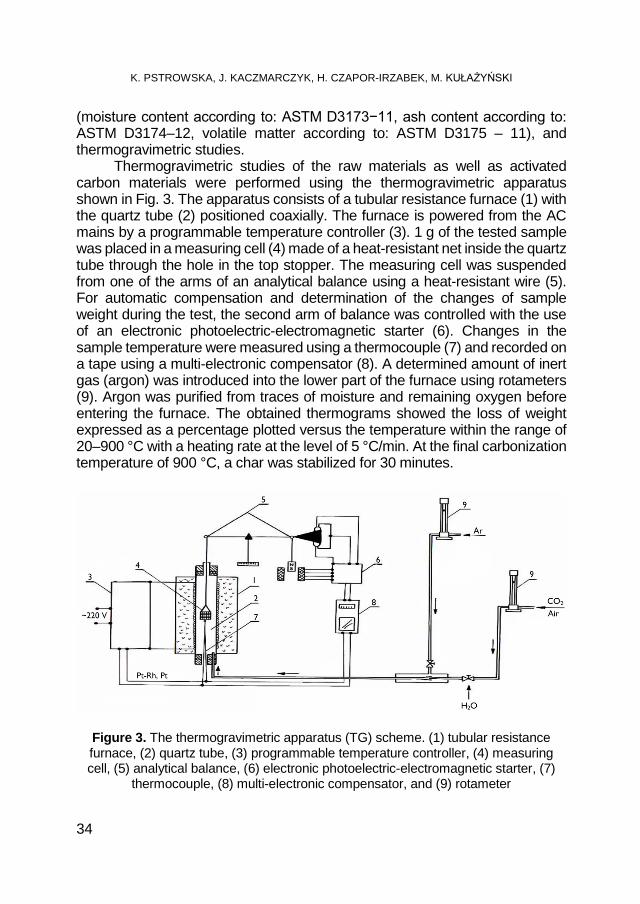
(moisture content according to: ASTM D3173−11, ash content according to: ASTM D3174–12, volatile matter according to: ASTM D3175 – 11), and thermogravimetric studies. Thermogravimetric studies of the raw materials as well as activated carbon materials were performed using the thermogravimetric apparatus shown in Fig. 3. The apparatus consists of a tubular resistance furnace (1) with the quartz tube (2) positioned coaxially. The furnace is powered from the AC mains by a programmable temperature controller (3). 1 g of the tested sample was placed in a measuring cell (4) made of a heat-resistant net inside the quartz tube through the hole in the top stopper. The measuring cell was suspended from one of the arms of an analytical balance using a heat-resistant wire (5). For automatic compensation and determination of the changes of sample weight during the test, the second arm of balance was controlled with the use of an electronic photoelectric-electromagnetic starter (6). Changes in the sample temperature were measured using a thermocouple (7) and recorded on a tape using a multi-electronic compensator (8). A determined amount of inert gas (argon) was introduced into the lower part of the furnace using rotameters (9). Argon was purified from traces of moisture and remaining oxygen before entering the furnace. The obtained thermograms showed the loss of weight expressed as a percentage plotted versus the temperature within the range of 20–900 °C with a heating rate at the level of 5 °C/min. At the final carbonization temperature of 900 °C, a char was stabilized for 30 minutes.
Figure 3. The thermogravimetric apparatus (TG) scheme. (1) tubular resistance furnace, (2) quartz tube, (3) programmable temperature controller, (4) measuring cell, (5) analytical balance, (6) electronic photoelectric-electromagnetic starter, (7)
thermocouple, (8) multi-electronic compensator, and (9) rotameter
CHARACTERIZATION OF ACTIVATED BEECH WOOD CHAR – METHANE STORAGE APPLICATION
35
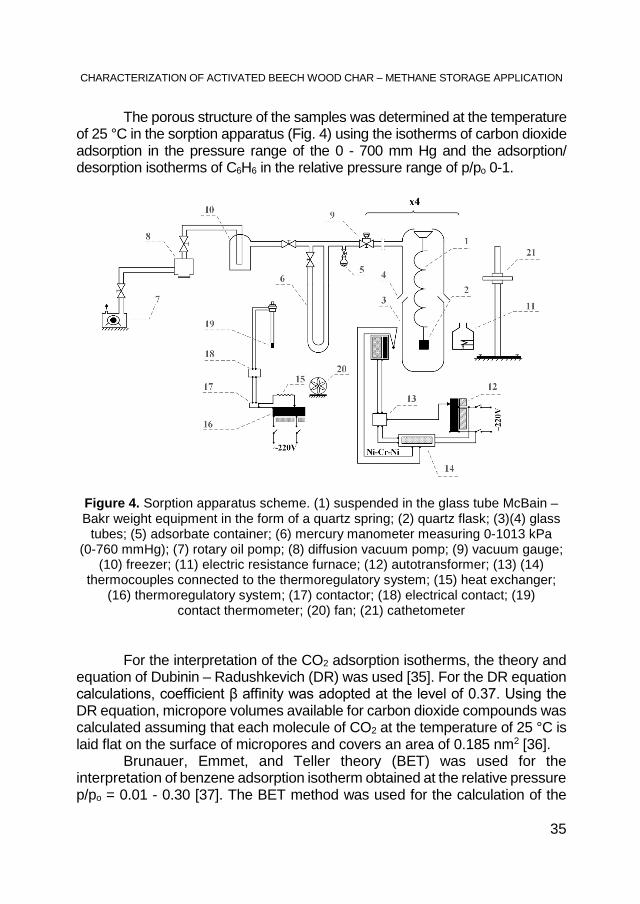
The porous structure of the samples was determined at the temperature of 25 °C in the sorption apparatus (Fig. 4) using the isotherms of carbon dioxide adsorption in the pressure range of the 0 - 700 mm Hg and the adsorption/ desorption isotherms of C6H6 in the relative pressure range of p/po 0-1.
Figure 4. Sorption apparatus scheme. (1) suspended in the glass tube McBain – Bakr weight equipment in the form of a quartz spring; (2) quartz flask; (3)(4) glass
tubes; (5) adsorbate container; (6) mercury manometer measuring 0-1013 kPa (0-760 mmHg); (7) rotary oil pomp; (8) diffusion vacuum pomp; (9) vacuum gauge;
(10) freezer; (11) electric resistance furnace; (12) autotransformer; (13) (14) thermocouples connected to the thermoregulatory system; (15) heat exchanger;
(16) thermoregulatory system; (17) contactor; (18) electrical contact; (19) contact thermometer; (20) fan; (21) cathetometer
For the interpretation of the CO2 adsorption isotherms, the theory and equation of Dubinin – Radushkevich (DR) was used [35]. For the DR equation calculations, coefficient β affinity was adopted at the level of 0.37. Using the DR equation, micropore volumes available for carbon dioxide compounds was calculated assuming that each molecule of CO2 at the temperature of 25 °C is laid flat on the surface of micropores and covers an area of 0.185 nm2 [36].
Brunauer, Emmet, and Teller theory (BET) was used for the interpretation of benzene adsorption isotherm obtained at the relative pressure p/po = 0.01 - 0.30 [37]. The BET method was used for the calculation of the
K. PSTROWSKA, J. KACZMARCZYK, H. CZAPOR-IRZABEK, M. KUŁAŻYŃSKI
36
material surface (SBET). For the calculations, it was assumed that the surface of the benzene molecule at 25 °C occupies 0.41 nm2 [38]. Based on the benzene desorption curve in the range of the relative pressure p/po = 0.96 - 0.175, the mesopores volume (VMES) and mesopores size distribution (SMES) as a function of width (2-3; 3-5; 5-10 and 10-50 nm) was calculated. The calculations were made according to the Pierce method [39] modified by Orr and Dallavalle [40], considering the amendments on the thickness of the adsorbed layer [41]. The calculations assumed that the pores have the shape of a slot. The average mesopores diameter (dMES) was calculated from the following equation: dMES = 2VMES : SMES.
Micropore volumes available for benzene vapors (VMIK) were calculated as the difference of volume of benzene adsorbed at p/po = 0.96 (Gurvich volume V0.96) [42] and a previously calculated volume of mesopores: VMIK = V0.96 - VMES [cm3∙g-1]. The micropore volumes of the widths below 0.4 nm (sub-micropores, VSUB) available to smaller molecules of carbon dioxide and inaccessible to larger molecules of benzene was calculated. Sub-micropore volumes were calculated as the difference of the micropore volume calculated from the CO2 adsorption curve (VMIK CO2) and the micropore volume calculated from the benzene adsorption curve (VMIK) at p/po= 0.96. VSUB= VMIK
CO2 - VMIK. Carbonization and physical activation Carbonization was operated in the apparatus described in Figure 3
under an argon atmosphere with a flow rate of 30 dm3∙h-1 and heating rate of 10 °C∙min-1 up to the final temperature of 750, 800, 850 and 900 °C. At the final carbonization temperature, the experiment was held at constant (final) temperature for 30 min till the carbonization was completed. The obtained materials were cooled in the argon flow up to room temperature. Carbonized materials were designated as the following: KB750, KB800, KB850, KB900.
Carbonized materials were used for the preparation of the active carbon. Physical activation with steam was conducted at temperatures of 750, 800, 850 and 900 °C up to the 50% organic mass loss of the material (calculated to daf – dry, ash free). After reaching the scheduled weight loss, the activating agent was replaced with argon, and the sample was cooled to room temperature. Active carbons were designated as KB750ac, KB800ac, KB850ac, and KB900ac. The average reactivity of the samples (Rdaf) was calculated by dividing the weight of the gasified char (∆mdaf) by the product of the mass of char applied for the process (mdaf) and the activation time expressed in hours (t):
𝑅𝑅𝑑𝑑𝑑𝑑𝑑𝑑 = ∆𝑚𝑚𝑑𝑑𝑑𝑑𝑑𝑑
𝑚𝑚𝑑𝑑𝑑𝑑𝑑𝑑𝑡𝑡, [ 𝑔𝑔 · 𝑔𝑔−1 · ℎ−1] .

CHARACTERIZATION OF ACTIVATED BEECH WOOD CHAR – METHANE STORAGE APPLICATION
37
Both carbonization and physical activation of the beech wood were conducted in the TG apparatus (Fig. 3).
Determination of methane sorption capacity To evaluate the obtained carbons as methane storage materials, tests
of methane adsorption and desorption were conducted in the sorption apparatus presented in Fig. 4. The following parameters of the test were applied: temperature of 25 °C and methane pressure range 0-700 mm Hg. Based on the determined adsorption and desorption isotherms of methane, the following parameters of the prepared carbons were calculated: o aad,700 - the amount of methane adsorbed at the pressure of 700 mm Hg
(mmol∙g-1; g∙kg-1); o ades,0 - the amount of methane remaining in the pores after desorption
process, at the pressure of 0 mm Hg (mmol∙g-1; g∙kg-1); o aad,700 - ades,0 - the amount of methane desorbed at a pressure of 0 mm Hg
(mmol∙g-1; g∙kg-1).
ACKNOWLEDGMENTS This project was supported by the Wroclaw Centre of Biotechnology
programme within The Leading National Research Centre (KNOW) and NCBiR Biostrateg project BIOSTRATEG2/298357/8/NCBR/2016.
R E F E R E N C E S
1. D. Lozano-Castello, J. Alcaniz-Monge, M.A.M de la Casa-Lillo, D. Cazorla-Amoros, A. Linares-Solano, Fuel, 2002, 81, 1777.
2. S.E. Manahan, ”Environmental Science and Technology: A Sustainable Approach to Green Science and Technology”, Second Edition, Taylor & Francis, Boca Raton/USA, 2006, chapter 18.
3. T. Düren, L. Sarkisov, O.M. Yaghi, R.Q. Snurr, Langmuir, 2004, 20, 2683. 4. D. Bazer-Bachi, L. Assie, V. Lecocq, B. Harbuzaru, V. Falk, V., Power
Technology, 2014, 255, 52. 5. M.I. Nandasiri, S.R. Jambovane, B.P. McGrail, H.T. Schaef, S.K. Nune,
Coordination Chemistry Reviews, 2016, 311, 38. 6. J.A. Mason, M. Veenstra, J.R. Long, Chemical Science, 2014, 5, 32. 7. Y. He, W. Zhou, G. Qian, B. Chen, Chemical Society Reviews, 2014, 43, 5657.

K. PSTROWSKA, J. KACZMARCZYK, H. CZAPOR-IRZABEK, M. KUŁAŻYŃSKI
38
8. J. Shen, J. Sulkowski, M. Beckner, A. Dailly, Microporous and Mesoporous Materials, 2015, 212, 80.
9. O.M. Yanghi, M. O’Keefe, N.W. Ockwig, H.K. Chae, M. Eddaoudi, J. Kim, Nature, 2003, 423, 705.
10. H. Furukawa, O.M. Yaghi, Journal of the American Chemical Society, 2009, 131, 8875.
11. J.H. Guo, H. Zhang, Y. Miyamoto, Physical Chemistry Chemical Physics, 2013, 15, 8199.
12. H.M. El-Kaderi, J.R. Hunt, J.L. Mendoza-Cortes, A.P. Cote, R.E. Taylor, M. O’Keeffe, O.M. Yanhi, Science, 2007, 316, 268.
13. J.H. Hu, J.F. Zhao, T.Y. Yan, Journal of the Physical Chemistry, 2015, 119 (4), 2010.
14. J.L. Mendoza-Cortes, T.A. Pascal, W.A. Goddard III, Journal of the Physical Chemistry A, 2011, 115, 13852.
15. J. Zhao, T. Yan, RSC Advances, 2014, 4, 15542. 16. X.H. Zhang, Z.Q. Song, X.L. Zhou, C.L. Li, L.Y Xu, Energy Sources, Part A:
Recovery, Utilization, and Environmental Effects, 2016, 38(2), 202. 17. T.J. Grey, K.P. Travis, J.D. Gale, D. Nicholson, Microporous and Mesoporous
Materials, 2001, 48, 203. 18. R. Hernandez-Huesca, L. Diaz, G. Aguilar-Armenta, Separation and Purification
Technology, 1999, 15, 163. 19. M. Sakizci, O.L. Tanriverdi, Turkish Journal of Chemistry, 2015, 39 (5), 970. 20. M.E. Casco, M. Martinez-Escandell, K. Kaneko, J. Silvestre-Albero, F. Rodriguez-
Reinoso, Carbon, 2015, 93, 11. 21. D. Lozano-Castello, D. Cazorla-Amoros, A. Linares-Solano, D.F. Quinn, Carbon,
2002, 40, 989. 22. J. Sreńscek-Nazzal, W. Kamińska, B. Michalkiewicz, Z.C. Koren, Industrial Crops
and Products, 2013, 47, 153. 23. J. Alcaniz-Monge, M.A. De la Casa-Lillo, D. Cazorla-Amoros, A. Linares-Solano,
Carbon, 1997, 35 (2), 291. 24. H.M.B.M. Herath, A.A.P. De Alwis, MERCon 2015 - Moratuwa Engineering
Research Conference, article number: 7112310, 2015, available online: http://ieeexplore.ieee.org/stamp/stamp.jsp?tp=&arnumber=7112310, Accessed 11 March 2018
25. J. Sun, M.J. Rood, M. Rostam-Abadi, A.A. Lizzio, Gas Separation & Purification, 1996, 10 (2), 91.
26. H. Fałtynowicz, J. Kaczmarczyk, M. Kułażyński, Open Chemistry, 2015, 13, 1150. 27. D.C.S. Azevedo, J.C.S. Araujo, M. Bastos-Neto, E.B. Torres, E.F. Jaguaribe, C.L.
Cavalcante, Microporous and Mesoporous Materials, 2007, 100, 361. 28. S. Meyer, B. Glaser, P. Quicker, Environmental Science & Technology, 2011, 45,
9473. 29. K. Zeng, D.P. Minh, D. Gauthier, E. Weiss-Hortala, A. Nzihou, D. Flamant,
Bioresource Technology, 2015, 182, 114. 30. C. Guizani, F.J. Escudero Sanz, M. Jeguirim, R. Gadiou, S. Salvador, Fuel
Processing Technology, 2015, 138, 687.

CHARACTERIZATION OF ACTIVATED BEECH WOOD CHAR – METHANE STORAGE APPLICATION
39
31. M.M. Dieme, A. Villot, C. Gerente, Y. Andres, S.N. Fiop, C.K. Diawara, Environmental Technology, 2017, 38 (3), 353.
32. E. Lorenc-Grabowska, Adsorption, 2016, 22, 599. 33. K. Sapag, A. Vallone, G.A. Blanco, C. Solar, “Adsorption of Methane in Porous
Materials as the Basis for the Storage of Natural Gas, Natural Gas”, InTech, Primoz Potocnik (Ed.), 2010, Available from: http://www.intechopen.com/books/natural-gas/adsorption-of-methane-in-porous-materials-as-the-basis-for-the-storage-of-natural-gas
34. K. Wu, Z. Chen, X. Li, X. Dong, Scientific Reports, 2016, 6, 33461. 35. M.M. Dubinin, Carbon, 1989, 27, 457. 36. Y. Toda, M. Hatami, Y. Toyoda, Y. Yoshida, H. Honda, Fuel, 1971, 50, 187. 37. S. Brunauer, P.H. Emmet, E. Teller, Journal of the American Chemical Society,
1938, 60, 309. 38. T. Siemieniewska, K. Tomków, J. Kaczmarczyk, A. Albiniak, E. Broniek, A.
Jankowska, Y. Grillet, M. François, Studies in surface science and catalysis, 1994, 87, 695.
39. C. Pierce, Journal of Physical Chemistry, 1953, 57, 149. 40. C. Orr, J.M. DallaValle, “Fine particle measurement: Size, Surface, and Pore
Volume”, The McMillan Company, New York, 1959, chapter 8. 41. S.J. Gregg, K.S. Sing, “Adsorption, Surface Area and Porosity”, Academic Press
London - New York, 1982, chapter 4. 42. A. Filozof-Nieścior, J. Kaczmarczyk, T. Siemieniewska, Conference on Catalysis
and Adsorption in Fuels Processing and Environmental Protection, Kudowa, pp. 69 – 74 (2002).

STUDIA UBB CHEMIA, LXIII, 3, 2018 (p. 41-48) (RECOMMENDED CITATION) DOI:10.24193/subbchem.2018.3.03
RADIOCARBON DATING OF THE OLD ASH OF AITON, ROMANIA
ADRIAN PATRUTa,*, ROXANA T. PATRUTa,b,LASZLO RAKOSYb, ILEANA-ANDREEA RAŢIUa, DANIEL A. LOWYc,
JENŐ BODISa, KARL F. VON REDENd
ABSTRACT. The article reports the AMS (accelerator mass spectrometry) radiocarbon investigation results of the old common ash of Aiton. Five wood samples were collected from the trunk of the tree. The deepest ends of the samples were analysed by AMS radiocarbon. We found radiocarbon dates between 165 ± 20 BP and 240 ± 18 BP, which correspond to calibrated ages of 230 – 360 years. These results, combined with a ring counting estimate, indicate an age of 330 ± 30 years for the ash of Aiton. By this value, the ash of Aiton becomes the oldest known common ash with accurate dating results. Keywords: AMS radiocarbon dating, Fraxinus excelsior, dendrochronology, age determination.
INTRODUCTION The common ash, European ash or simply ash (Fraxinus excelsior L.) is a deciduous flowering tree that belongs to the Oleaceae family. The ash is native throughout mainland Europe occurring in 64% of European territories; its natural range largely coincides with that of the pedunculate oak. It is typically 20-30 m tall, exceptionally reaching 40-50 m, and has a diameter up to 2 m [1-3].
a Babeş-Bolyai University, Faculty of Chemistry and Chemical Engineering, 11 Arany Janos,
RO-400028, Cluj-Napoca, Romania. b Babeş-Bolyai University, Faculty of Biology and Geology, 44 Republicii, RO-400015, Cluj-
Napoca, Romania. c Dept. of Science and Innovation, Valor Hungariae, 4 Nagysándor József, 1054 Budapest,
Hungary. d NOSAMS Facility, Dept. of Geology & Geophysics, Woods Hole Oceanographic Institution,
Woods Hole, MA 02543, U.S.A. * Corresponding author: [email protected]
A. PATRUT, R. T. PATRUT, L. RAKOSY, I.-A. RAŢIU, D. A. LOWY, J. BODIS, K. F. VON REDEN
42
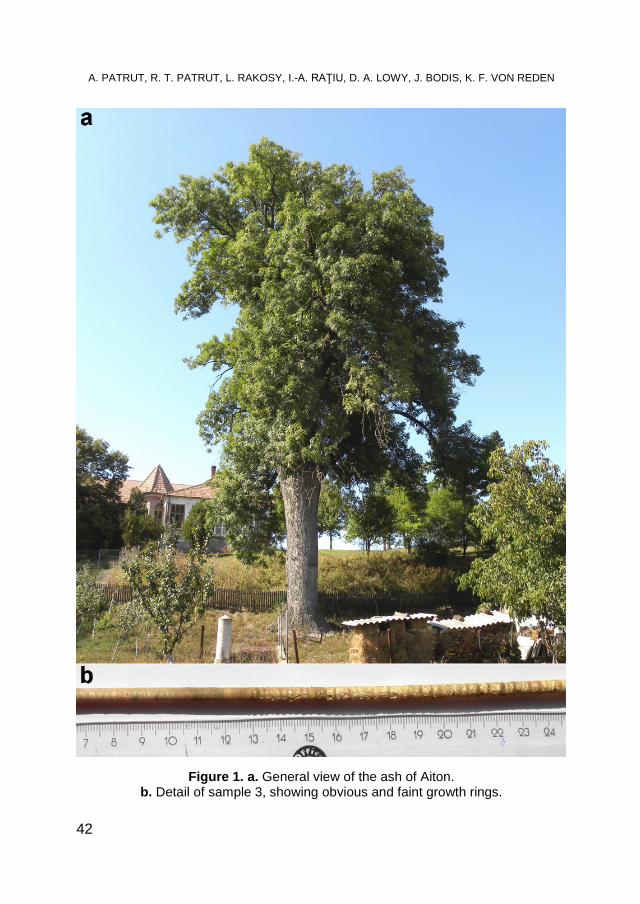
Figure 1. a. General view of the ash of Aiton. b. Detail of sample 3, showing obvious and faint growth rings.
RADIOCARBON DATING OF THE OLD ASH OF AITON, ROMANIA
43
In 2005, we started an in-depth research to elucidate several controversial or poorly understood aspects concerning the architecture, growth and age of the African baobab. The research is based on our new approach which enables to investigate and date standing live specimens, as well. This approach consists of AMS radiocarbon dating of tiny wood samples collected from different areas of such trees [4-9]. We extended our research by starting to date individuals which belong to other angiosperm species, including trees from Romania.
Romania hosts several monumental trees which have reached large dimensions and old ages. We investigated and dated by AMS radiocarbon some remains of the historic oak of Ţebea [10], the large pedunculate oak of Cajvana [11], as well as the old black poplar of Mocod and the big grey poplar of Rafaila [12]. In each case we found very old ages for these species.
Here we disclose the AMS radiocarbon dating results of another representative Romanian tree, namely the old ash of Aiton.
RESULTS AND DISCUSSION
The old ash of Aiton and its area. The old ash is located in the garden of a privately-owned house (No. 420) in the village and commune Aiton, Cluj county, at 18 km SE of Cluj-Napoca, in the northern part of Romania. Its GPS coordinates are 46º40.949' N, 023º44.056' E and the altitude is 636 m. The mean annual rainfall in the area is around 650 mm. The ash of Aiton has today a maximum height of 29.2 m, the circumference at breast height (cbh; at 1.30 m above mean ground level) is 6.27 m, while the circumference on slope at ground level is 11.65 m. The overall wood volume is 32 m3, out of which the trunk/stem has a volume of 26 m3 (Figure 1a).
The quasi-cylindrical trunk forks at a height of 9.6–10.0 m into four large primary branches, with diameters up to 0.8 m. Two other very large branches fell in 2005 and one in 2015 during storms, while other two branches burned down in 1994 in a big fire, after the tree was hit by lightning. The fire was only extinguished after 8 hours by firefighters; the fire damage reduced the canopy to the half and decreased the height of the ash. Now, the horizontal dimensions of the remaining canopy are 27.6 (NS) x 23.6 (WE) m.
Wood samples. A number of five wood samples were extracted from the outer part of the tree around the circumference. The five samples (labelled 1 to 5) have lengths between 0.61 and 0.75 m. The heights of the
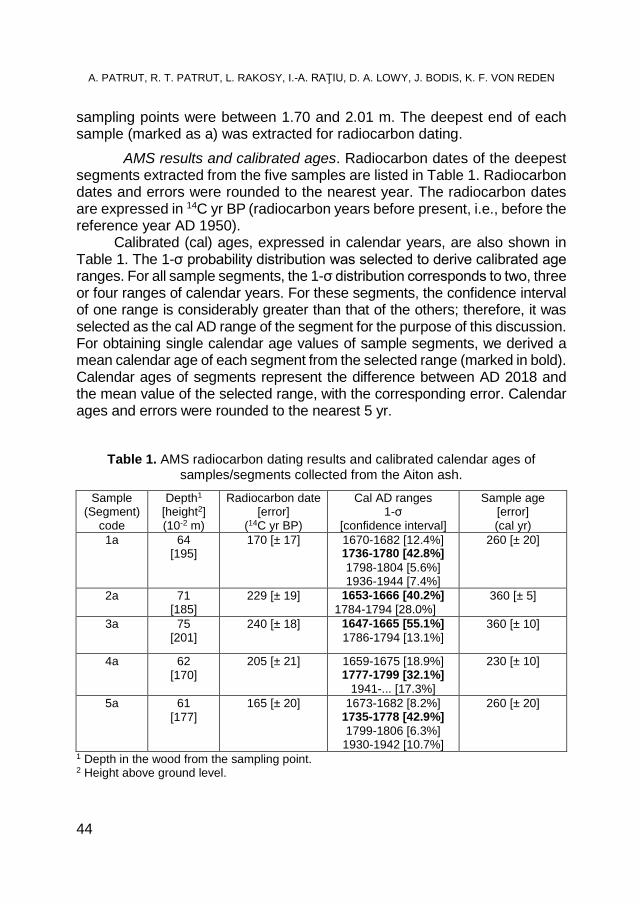
A. PATRUT, R. T. PATRUT, L. RAKOSY, I.-A. RAŢIU, D. A. LOWY, J. BODIS, K. F. VON REDEN
44
sampling points were between 1.70 and 2.01 m. The deepest end of each sample (marked as a) was extracted for radiocarbon dating.
AMS results and calibrated ages. Radiocarbon dates of the deepest segments extracted from the five samples are listed in Table 1. Radiocarbon dates and errors were rounded to the nearest year. The radiocarbon dates are expressed in 14C yr BP (radiocarbon years before present, i.e., before the reference year AD 1950). Calibrated (cal) ages, expressed in calendar years, are also shown in Table 1. The 1-σ probability distribution was selected to derive calibrated age ranges. For all sample segments, the 1-σ distribution corresponds to two, three or four ranges of calendar years. For these segments, the confidence interval of one range is considerably greater than that of the others; therefore, it was selected as the cal AD range of the segment for the purpose of this discussion. For obtaining single calendar age values of sample segments, we derived a mean calendar age of each segment from the selected range (marked in bold). Calendar ages of segments represent the difference between AD 2018 and the mean value of the selected range, with the corresponding error. Calendar ages and errors were rounded to the nearest 5 yr.
Table 1. AMS radiocarbon dating results and calibrated calendar ages of samples/segments collected from the Aiton ash.
Sample (Segment)
code
Depth1 [height2] (10-2 m)
Radiocarbon date [error]
(14C yr BP)
Cal AD ranges 1-σ
[confidence interval]
Sample age [error] (cal yr)
1a 64 [195]
170 [± 17] 1670-1682 [12.4%] 1736-1780 [42.8%] 1798-1804 [5.6%] 1936-1944 [7.4%]
260 [± 20]
2a 71 [185]
229 [± 19] 1653-1666 [40.2%] 1784-1794 [28.0%]
360 [± 5]
3a 75 [201]
240 [± 18] 1647-1665 [55.1%] 1786-1794 [13.1%]
360 [± 10]
4a 62 [170]
205 [± 21] 1659-1675 [18.9%] 1777-1799 [32.1%]
1941-... [17.3%]
230 [± 10]
5a 61 [177]
165 [± 20] 1673-1682 [8.2%] 1735-1778 [42.9%] 1799-1806 [6.3%]
1930-1942 [10.7%]
260 [± 20]
1 Depth in the wood from the sampling point. 2 Height above ground level.
RADIOCARBON DATING OF THE OLD ASH OF AITON, ROMANIA
45
Dating results of samples (segments). The deepest part/end of the collected samples have radiocarbon dates between 165 ± 20 BP and 240 ± 18 BP. These values correspond to calibrated ages between 230 ± 10 and 360 ± 10 yr.
One should mention that the calibration, i.e., the conversion of radiocarbon dates into calendar ages, can be discussed in particular cases. Thus, the calibration of wood samples which have calendar/dendro ages in the time frame AD 1640 – 1950 shows some uncertainties. In such cases, the calibration of one radiocarbon date may result in up to five or six calendar age ranges. This is due to the so-called “Suess effect”, which expresses the high variation of the atmospheric radiocarbon concentration produced by the combustion of fossil fuels [13,14].
Ring counting. On the collected wood samples, the growth/annual rings are obvious in certain areas, while in other areas they are very faint (Figure 1b). Therefore, an accurate ring counting is not possible. The longest sample 3 had a length of 0.75 m and was collected at a height of 2.01 m. At this height, the circumference of the trunk is 5.50 m. This value corresponds to a diametre of 1.72 m without bark. The distance from the sample end to the centre/theoretical pith is 0.11 m.
We estimate that sample 3 contains around 300 – 320 rings. By considering that the ash grows faster in the first 40 years [3], the number of missing rings from the sample end to the pith must be close to 20. Therefore, this estimate for the ash of Aiton suggests a number of 320 – 340 growth rings.
We investigated and measured the tree in 2009, 2010, 2013, 2015 and 2018. The mean growth rate over this period, namely the increase in radius, was of 1.9 x 10⁻³ m yr-1 (0.19 cm yr-1) at the height of 2 m.
Age of the ash of Aiton. The radiocarbon dating results and the ring counting estimate indicate an age of 300 – 360 yr, i.e., 330 ± 30 yr for the investigated ash. By this value, the ash of Aiton becomes the oldest known common ash with accurate dating results and certainly one of the oldest common ash in Europe.
CONCLUSIONS
Our research discloses the AMS radiocarbon dating results of the old
common ash of Aiton. The main aim of the research was to determine the age of tree. Five wood samples were collected from its trunk. The deepest

A. PATRUT, R. T. PATRUT, L. RAKOSY, I.-A. RAŢIU, D. A. LOWY, J. BODIS, K. F. VON REDEN
46
ends of each sample were processed and dated by AMS radiocarbon. The five segments have radiocarbon dates between 165 ± 20 BP and 240 ± 18 BP, which correspond to calibrated ages between 230 ± 10 and 360 ± 10 yr. These results, combined with a ring counting estimate, indicate an age of 330 ± 30 yr for the ash of Aiton which has started growing around the year 1690.
EXPERIMENTAL SECTION Metric measurements. The height of the tree was measured using a Bosch DLE 70 Professional laser rangefinder. The circumference at different heights was measured with graduated tapes. The volume was determined from laser measurements of the trunk and of large branches at different heights.
Sample collection. The five wood samples were collected with a Haglöf CH 800 increment borer (80 cm length, 0.54 cm inner diameter). A number of five tiny pieces/segments of the length of 0.1 cm were extracted from the deepest end of each wood sample. The segments were processed and investigated by AMS radiocarbon dating.
Sample preparation. The standard acid-base-acid pretreatment method
was used for removing soluble and mobile organic components. The pretreated samples were combusted to CO2 by using the closed tube combustion method. Next, CO2 was reduced to graphite on iron catalyst, under hydrogen atmosphere [15]. Finally, the resulting graphite samples were analysed by AMS.
AMS measurements. AMS radiocarbon measurements were performed
at the NOSAMS Facility of the Woods Hole Oceanographic Institution (Woods Hole, MA, U.S.A.) by using the Pelletron ® Tandem 500 kV AMS system. The obtained fraction modern values, corrected for isotope fractionation with the normalized δ13C value of -25 0/00, were ultimately converted to a radiocarbon date.
Calibration. Radiocarbon dates were calibrated and converted into
calendar ages with the OxCal v4.3 for Windows [16], by using the IntCal13 atmospheric data set [17].
RADIOCARBON DATING OF THE OLD ASH OF AITON, ROMANIA
47
ACKNOWLEDGMENTS
Authors thank Vasile and Mărioara Mureşan, the owners of the house
Aiton 420 for granting the investigation and sampling of the old ash, as well as Flaviu Gherman for offering information about the tree. The research was funded by the Romanian Ministry of Research and Innovation CNCS-UEFISCDI under grant PN-III-P4-ID-PCE-2016-0776, Nr. 90/2017.
R E F E R E N C E S
1. D. Dobrowolska, S. Hein, A. Oosterbaan, S. Wagner, J. Clark, J.P. Skovsgaard, Forestry, 2011, 84(2), 133.
2. P.A. Thomas, Journal of Ecology, 2016, 104, 1158. 3. K. Giagli, J. Baar, M. Fajstavr, V. Gryc, H. Vavrcik, BioResources, 2018, 13(1),
804. 4. A. Patrut, K.F. von Reden, D.A. Lowy, A.H. Alberts, J.W. Pohlman, R. Wittmann,
D. Gerlach, L. Xu, C. Mitchell, Tree Physiology, 2007, 27, 1569. 5. A. Patrut, K.F. von Reden, R. Van Pelt, D.H. Mayne, D.A. Lowy, D. Margineanu,
Annals of Forest Science, 2011, 68, 993. 6. A. Patrut, S. Woodborne, K.F. von Reden, G. Hall, M. Hofmeyr, D. Lowy, R.T.
Patrut, PLoS ONE, 2015, 10(1), e0117193, doi: 10.1371/journal.pone.0117193. 7. A. Patrut, L. Rakosy, R.T. Patrut, I.A. Ratiu, E. Forizs, D.A. Lowy, D. Margineanu,
K.F. von Reden, Studia UBB Chemia, 2016, LXI, 4, 7-20. 8. A. Patrut, S. Woodborne, K.F. von Reden, G. Hall, R.T. Patrut, L. Rakosy, P.
Danthu, J-M. Leong Pock-Tsy, D.A. Lowy, D. Margineanu, Radiocarbon, 2017, 59(2), 435.
9. A. Patrut, S. Woodborne, R.T. Patrut, L. Rakosy, D.A. Lowy, G. Hall, K.F. von Reden, Nature Plants, 2018, 4, 423.
10. A. Patrut, K.F. von Reden, D.A. Lowy, S. Pasca, L. Kekedy-Nagy, I. Sovago, Studia UBB Chemia, 2010, 55, 1, 113.
11. A. Patrut, K.F. von Reden, V. Savu, D.A. Lowy, R. Mitea, I. Barbul, Studia UBB Chemia, 2011, 56, 1, 145.
12. A. Patrut, K.F. von Reden, D.A. Lowy, R.T. Patrut, D.L. Vaida, D. Margineanu, Nuclear Instruments and Methods in Physics Research Section B, 2013, 294, 616.
13. P.P. Tans, A.F.M. de Jong, W.G. Mook, Nature, 1979, 280, 826.
A. PATRUT, R. T. PATRUT, L. RAKOSY, I.-A. RAŢIU, D. A. LOWY, J. BODIS, K. F. VON REDEN
48
14. M. Worbes, Dendrochronologia, 2002, 20 (1-2), 217-231. 15. A. Patrut, S. Woodborne, R.T. Patrut, L. Rakosy, G. Hall, I.A. Ratiu, K.F. von
Reden, Studia UBB Chemia, 2017, LXII, 2, 347. 16. C. Bronk Ramsey, Radiocarbon, 2009, 51, 337. 17. P.J. Reimer, E. Bard, A. Bayliss, J.W. Beck, P.G. Blackwell, C. Bronk Ramsey,
C.E. Buck, H. Cheng, R. Lawrence Edwards, M. Friedrich, P.M. Grootes, T.P. Guilderson, H. Haflidason, I. Hajdas, C. Hatte, T.J. Heaton, D.L. Hoffman, A.G. Hogg, K.A. Hughen, K.F. Kaiser, B. Kromer, S.W. Manning, M. Niu, R.W. Reimer, D.A. Richards, E.M. Scott, J.R. Southon, R.A. Staff, C.S.M. Turney, J. van der Plicht, Radiocarbon, 2013, 55(4), 1869.
STUDIA UBB CHEMIA, LXIII, 3, 2018 (p. 49-57) (RECOMMENDED CITATION) DOI:10.24193/subbchem.2018.3.04
MICRO AND NANO ORGANIZATION OF ATMOSPHERIC PARTICULATE MATTER IN GRIGORESCU DISTRICT OF CLUJ-NAPOCA
IOAN PETEANa, GERTRUD ALEXANDRA PALTINEANa*, AURORA MOCANUa, DANA FLORINA MUNTEANb, LIANA MURESANb,
GEORGE ARGHIRc, MARIA TOMOAIA-COTISELa,d
ABSTRACT. The paper is focused on the micro and nano organization of atmospheric particulate matter in Grigorescu district of Cluj-Napoca in April and May 2017. Floating particles (FP) collected from atmosphere have an increased amount of minerals such as: quartz, calcite, clays (e.g. kaolinite and muscovite), and traces of lepidocrocite. Their size varies from less than 1 to over 120 μm, established by Scherer method on an XRD pattern. PM10 contains mainly quartz and calcite followed by fractions of kaolinite and muscovite. PM2.5 contains clay in large amount and less quartz particles. Certain nanoparticles are found among PM2.5. The obtained values were in good agreement to TEM and AFM microscopy. The diameters are 42 nm for clay and 92 nm for quartz particles. Nanostructural features are organized around fine micro particles such as PM 2.5. PM10 is often found as particles around FP. Keywords: floating particles, PM10, PM2.5, micro and nano organization
INTRODUCTION The composition and distribution of particulate matter (PM) depend
on the particularities of soil, weather, and human activities. Neglected and eroded soils lead to an increased amount of mineral particles in PM [1-4]. a Babeş-Bolyai University, Faculty of Chemistry and Chemical Engineering, Arany Janos Str.,
No. 11, RO-400084 Cluj-Napoca, Romania. b Environmental Protection Agency Cluj, Dorobanţilor Str., No. 99, RO-400609, Cluj – Napoca,
Romania. c Technical University of Cluj - Napoca, Faculty of Materials and Environment Engineering,
Muncii Ave., No. 103 -105, RO-400641 Cluj – Napoca, Romania. d Academy of Romanian Scientists, 54 Splaiul Independentei, 050094, Bucharest, Romania *Corresponding author: [email protected]
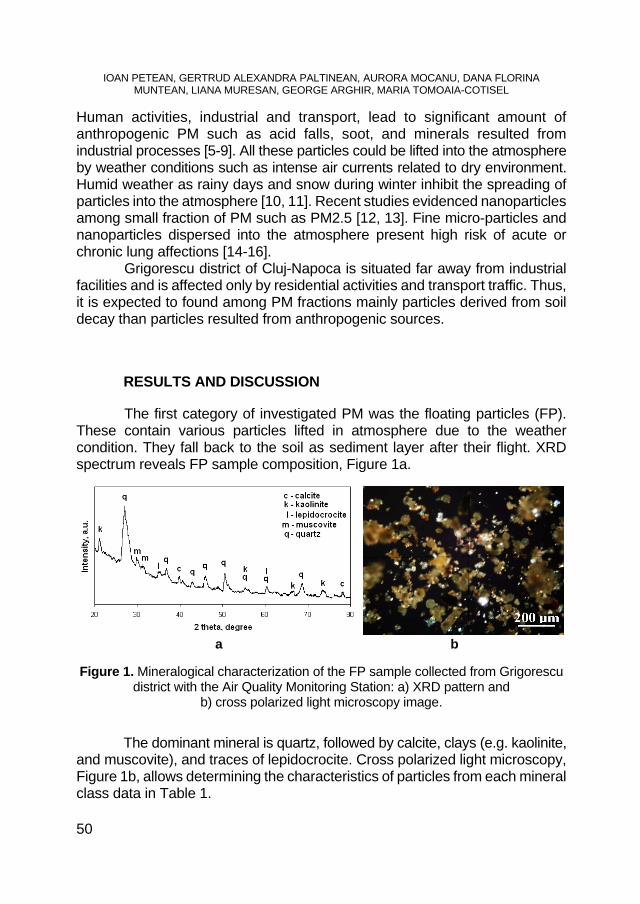
IOAN PETEAN, GERTRUD ALEXANDRA PALTINEAN, AURORA MOCANU, DANA FLORINA MUNTEAN, LIANA MURESAN, GEORGE ARGHIR, MARIA TOMOAIA-COTISEL
50
Human activities, industrial and transport, lead to significant amount of anthropogenic PM such as acid falls, soot, and minerals resulted from industrial processes [5-9]. All these particles could be lifted into the atmosphere by weather conditions such as intense air currents related to dry environment. Humid weather as rainy days and snow during winter inhibit the spreading of particles into the atmosphere [10, 11]. Recent studies evidenced nanoparticles among small fraction of PM such as PM2.5 [12, 13]. Fine micro-particles and nanoparticles dispersed into the atmosphere present high risk of acute or chronic lung affections [14-16].
Grigorescu district of Cluj-Napoca is situated far away from industrial facilities and is affected only by residential activities and transport traffic. Thus, it is expected to found among PM fractions mainly particles derived from soil decay than particles resulted from anthropogenic sources.
RESULTS AND DISCUSSION The first category of investigated PM was the floating particles (FP).
These contain various particles lifted in atmosphere due to the weather condition. They fall back to the soil as sediment layer after their flight. XRD spectrum reveals FP sample composition, Figure 1a.
a b
Figure 1. Mineralogical characterization of the FP sample collected from Grigorescu
district with the Air Quality Monitoring Station: a) XRD pattern and b) cross polarized light microscopy image.
The dominant mineral is quartz, followed by calcite, clays (e.g. kaolinite, and muscovite), and traces of lepidocrocite. Cross polarized light microscopy, Figure 1b, allows determining the characteristics of particles from each mineral class data in Table 1.

MICRO AND NANO ORGANIZATION OF ATMOSPHERIC PARTICULATE MATTER IN GRIGORESCU
51
Table 1. Components properties of FP sample
Component Quartz Kaolinite Muscovite Calcite Lepidocrocite
Formula SiO2 Al2Si2O5(OH)4 KAl2(AlSi3O10)(F,OH)2 CaCO3 γFeO(OH) Particle size,
μm 3 - 120 1 - 30 1 - 30 5 - 100 5 - 30
Color Green - gray
White- blue
Pink Yellow-brown
Reddish - brown
Shape round tabular tabular round elongated
Data in Table 1 shows significant particle size ranges which match the category of PM10 and PM2.5. These PM fractions were monitorized by Automatic Air Quality Monitoring Station and representative samples were subjected to SEM imaging and SEM-EDX elemental analysis, Figure 2 and Table 2.
a b
Figure 2. SEM images for particulate matters: a) PM10 and b) PM2.5. PM10 sample, Figure 2a, present a mixture of well individualized particles having diameters between 2.6-10 μm surrounding a particle conglomerate of 60 μm. The coalescence tendency is proven as observed in literature [12, 13, 17]. PM2.5 sample features a dense deposit of fine micro particle having diameters below 2.5 μm, Figure 2b.
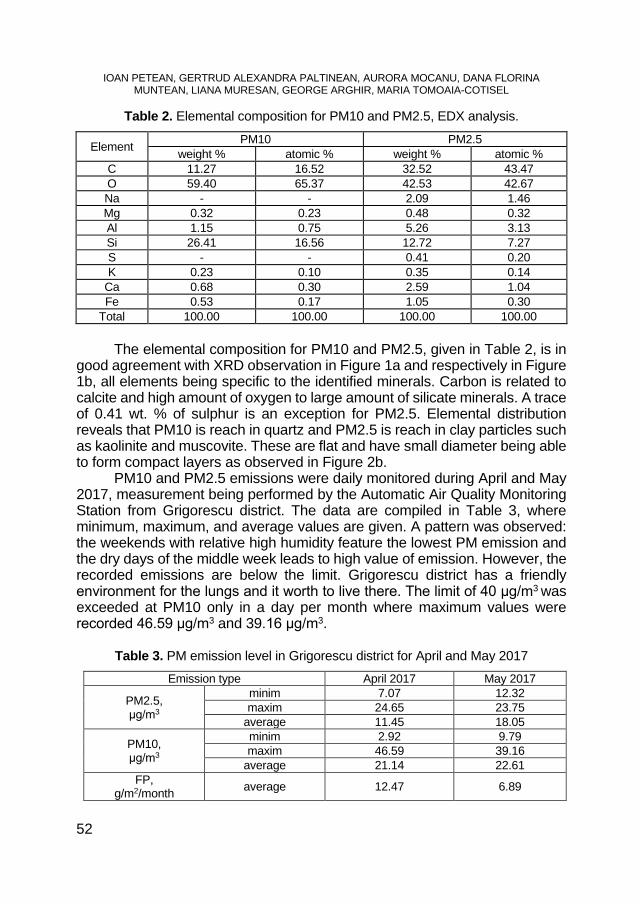
IOAN PETEAN, GERTRUD ALEXANDRA PALTINEAN, AURORA MOCANU, DANA FLORINA MUNTEAN, LIANA MURESAN, GEORGE ARGHIR, MARIA TOMOAIA-COTISEL
52
Table 2. Elemental composition for PM10 and PM2.5, EDX analysis.
Element PM10 PM2.5 weight % atomic % weight % atomic %
C 11.27 16.52 32.52 43.47 O 59.40 65.37 42.53 42.67 Na - - 2.09 1.46 Mg 0.32 0.23 0.48 0.32 Al 1.15 0.75 5.26 3.13 Si 26.41 16.56 12.72 7.27 S - - 0.41 0.20 K 0.23 0.10 0.35 0.14
Ca 0.68 0.30 2.59 1.04 Fe 0.53 0.17 1.05 0.30
Total 100.00 100.00 100.00 100.00 The elemental composition for PM10 and PM2.5, given in Table 2, is in good agreement with XRD observation in Figure 1a and respectively in Figure 1b, all elements being specific to the identified minerals. Carbon is related to calcite and high amount of oxygen to large amount of silicate minerals. A trace of 0.41 wt. % of sulphur is an exception for PM2.5. Elemental distribution reveals that PM10 is reach in quartz and PM2.5 is reach in clay particles such as kaolinite and muscovite. These are flat and have small diameter being able to form compact layers as observed in Figure 2b. PM10 and PM2.5 emissions were daily monitored during April and May 2017, measurement being performed by the Automatic Air Quality Monitoring Station from Grigorescu district. The data are compiled in Table 3, where minimum, maximum, and average values are given. A pattern was observed: the weekends with relative high humidity feature the lowest PM emission and the dry days of the middle week leads to high value of emission. However, the recorded emissions are below the limit. Grigorescu district has a friendly environment for the lungs and it worth to live there. The limit of 40 μg/m3 was exceeded at PM10 only in a day per month where maximum values were recorded 46.59 μg/m3 and 39.16 μg/m3.
Table 3. PM emission level in Grigorescu district for April and May 2017 Emission type April 2017 May 2017
PM2.5, μg/m3
minim 7.07 12.32 maxim 24.65 23.75
average 11.45 18.05
PM10, μg/m3
minim 2.92 9.79 maxim 46.59 39.16
average 21.14 22.61 FP,
g/m2/month average 12.47 6.89
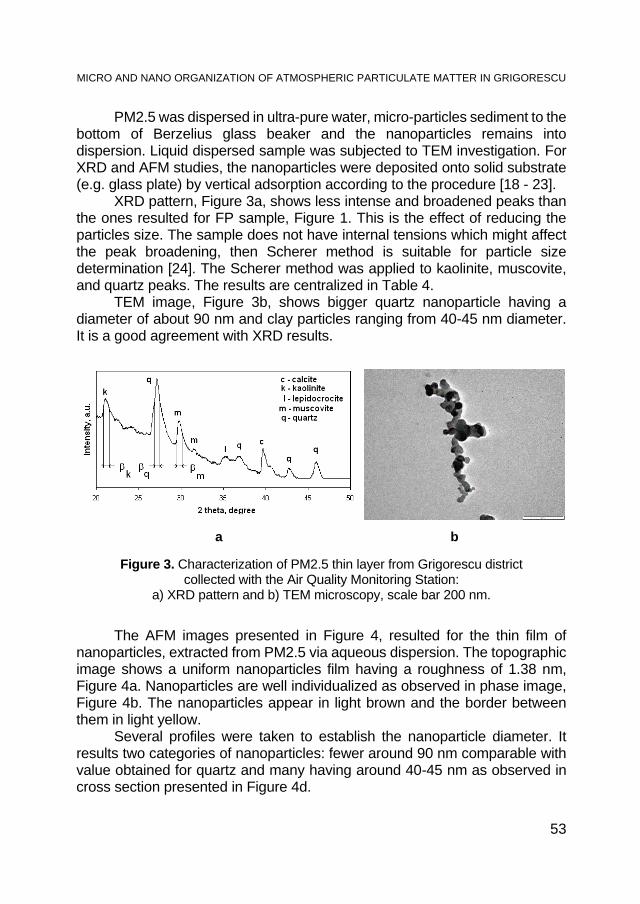
MICRO AND NANO ORGANIZATION OF ATMOSPHERIC PARTICULATE MATTER IN GRIGORESCU
53
PM2.5 was dispersed in ultra-pure water, micro-particles sediment to the bottom of Berzelius glass beaker and the nanoparticles remains into dispersion. Liquid dispersed sample was subjected to TEM investigation. For XRD and AFM studies, the nanoparticles were deposited onto solid substrate (e.g. glass plate) by vertical adsorption according to the procedure [18 - 23]. XRD pattern, Figure 3a, shows less intense and broadened peaks than the ones resulted for FP sample, Figure 1. This is the effect of reducing the particles size. The sample does not have internal tensions which might affect the peak broadening, then Scherer method is suitable for particle size determination [24]. The Scherer method was applied to kaolinite, muscovite, and quartz peaks. The results are centralized in Table 4. TEM image, Figure 3b, shows bigger quartz nanoparticle having a diameter of about 90 nm and clay particles ranging from 40-45 nm diameter. It is a good agreement with XRD results.
a b
Figure 3. Characterization of PM2.5 thin layer from Grigorescu district
collected with the Air Quality Monitoring Station: a) XRD pattern and b) TEM microscopy, scale bar 200 nm.
The AFM images presented in Figure 4, resulted for the thin film of nanoparticles, extracted from PM2.5 via aqueous dispersion. The topographic image shows a uniform nanoparticles film having a roughness of 1.38 nm, Figure 4a. Nanoparticles are well individualized as observed in phase image, Figure 4b. The nanoparticles appear in light brown and the border between them in light yellow. Several profiles were taken to establish the nanoparticle diameter. It results two categories of nanoparticles: fewer around 90 nm comparable with value obtained for quartz and many having around 40-45 nm as observed in cross section presented in Figure 4d.
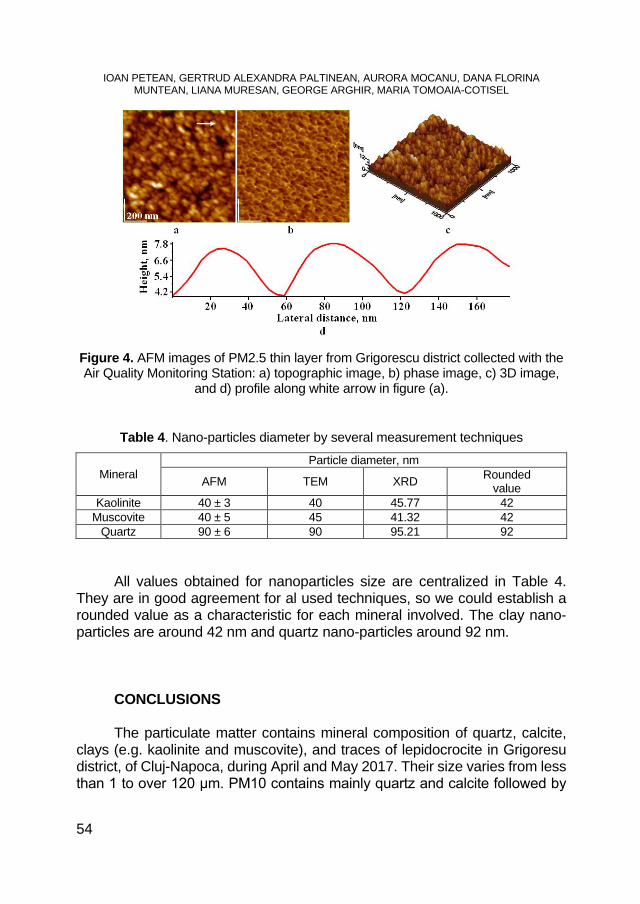
IOAN PETEAN, GERTRUD ALEXANDRA PALTINEAN, AURORA MOCANU, DANA FLORINA MUNTEAN, LIANA MURESAN, GEORGE ARGHIR, MARIA TOMOAIA-COTISEL
54
Figure 4. AFM images of PM2.5 thin layer from Grigorescu district collected with the Air Quality Monitoring Station: a) topographic image, b) phase image, c) 3D image,
and d) profile along white arrow in figure (a).
Table 4. Nano-particles diameter by several measurement techniques
Mineral Particle diameter, nm
AFM TEM XRD Rounded value
Kaolinite 40 ± 3 40 45.77 42 Muscovite 40 ± 5 45 41.32 42
Quartz 90 ± 6 90 95.21 92 All values obtained for nanoparticles size are centralized in Table 4. They are in good agreement for al used techniques, so we could establish a rounded value as a characteristic for each mineral involved. The clay nano-particles are around 42 nm and quartz nano-particles around 92 nm.
CONCLUSIONS
The particulate matter contains mineral composition of quartz, calcite, clays (e.g. kaolinite and muscovite), and traces of lepidocrocite in Grigoresu district, of Cluj-Napoca, during April and May 2017. Their size varies from less than 1 to over 120 μm. PM10 contains mainly quartz and calcite followed by
MICRO AND NANO ORGANIZATION OF ATMOSPHERIC PARTICULATE MATTER IN GRIGORESCU
55
fractions of kaolinite and muscovite. PM2.5 sample is abundant in clay particles and contains less quartz than PM10. Nanoparticles were found among PM2.5. XRD, TEM, and AFM allow establishing nanoparticles nature and size: kaolinite and muscovite 42 nm and quartz 92 nm. Air monitoring during April and May 2017 in Grigoresu District, Cluj – Napoca, shows that emission level is under the limit.
EXPERIMENTAL SECTION The experimental area is situated in Grigorescu district, of Cluj-
Napoca. PM samples: FP, PM10, and PM2.5 were collected using Automatic Air Quality Monitoring Station CJ-3 from Environmental Protection Agency of Cluj-Napoca, and their level of emission in the atmosphere was monitored during April and May 2017 and the results were centralized.
The X-ray diffraction analysis was performed on a DRON 3 diffractometer equipped with data acquisition module and MATMEC VI.0 soft. A monochrome Cokα radiation was used for all X-ray spectra. The mineral identification was effectuated using MATCH 1.0 X – ray standard data base from Crystal Impact Co.
Optical microscopy was performed on a Karl Zeiss Jena Laboval 2 microscope equipped with digital capture Kodak 10 Mpx camera. Quantitative analysis on the optical microphotographs was done using the Image J professional soft as freeware resource from National Institutes of Health, USA.
The AFM investigation was performed on a Jeol JSPM 4210 microscope in tapping mode [25-32] using NSC 15 cantilever. Samples for AFM investigation were prepared according to the appropriate data [33-38]. AFM images and cross profile were processed into the standard manner using Win SPM 2.0 soft. SEM images were achieved on a Jeol JSM 5600 LV microscope in secondary electrons imaging mode.
R E F E R E N C E S
1. G.A. Hosu-Prack, I. Petean, G. Arghir, L.D. Bobos, M. Tomoaia-Cotisel, Studia Univ. Babes-Bolyai, Chemia, 2010, 55 (3), 93.
2. I. Petean, A. Mocanu, G. A. Paltinean, R. Tarcan, D. F. Muntean, L. Muresan, G. Arghir, M. Tomoaia-Cotisel, Studia Univ. Babes-Bolyai, Chemia, 2017, 62 (4), Tom I, 33.
IOAN PETEAN, GERTRUD ALEXANDRA PALTINEAN, AURORA MOCANU, DANA FLORINA MUNTEAN, LIANA MURESAN, GEORGE ARGHIR, MARIA TOMOAIA-COTISEL
56
3. W. De Poel, S. Pintea, J. Drnec, F. Carla, R. Felici, P. Mulder, J. Elemans, W. Van Enckevort, A.E. Rowan, E. Vlieg, Surface Science, 2014, 619, 19.
4. M.S. Żbik, N.A. Raftery, R.S.C. Smart, R.L. Frost, Applied Clay Science, 2010, 50, 299.
5. G.A. Hosu-Prack, I. Petean, G. Arghir, L.D. Bobos, I. Iurcut, M. Tomoaia-Cotisel, Carpathian Journal of Earth and Environmental Sciences, 2013, 8 (4), 75.
6. J. Berger, B. Denby, Atmospheric Environment, 2011, 45, 3692. 7. M. Giugliano, G. Lonati, P. Butelli, L. Romele, R. Tardivo, M. Grosso, Atmospheric
Environment, 2005, 39, 2421. 8. G. Lazar, C. Capatina, C.M. Simionescu, Revista de Chimie (Bucharest), 2014,
65 (10), 1215. 9. G. Damian, F. Damian, D. Năsui, C. Pop, C. Pricop, Carpathian Journal of Earth
and Environmental Sciences, 2010, 5 (1),139. 10. D.F. Muntean, D. Ristoiu, G. Arghir, R.F. Campean, I. Petean, Carpathian Journal
of Earth and Environmental Sciences, 2012, 7 (3), 175. 11. D.F. Muntean, I. Ivan, L. Muresan, Studia Univ. Babes-Bolyai, Chemia, 2015, 60
(2), 207. 12. G.A. Paltinean, I. Petean, G. Arghir, D.F. Muntean, L.D. Bobos, M. Tomoaia-
Cotisel, Particulate Science and Technology, 2016, 34 (5), 580. 13. G.A. Paltinean, I. Petean, G. Arghir, D.F. Muntean, M. Tomoaia-Cotisel, Revista
de chimie (Bucharest), 2016, 67 (6), 1118. 14. W.C. Lo, R.H. Shie, C.C. Chan, H.H. Lin, Journal of the Formosan Medical
Association, 2017, 116, 32. 15. Q. Xu, S. Wang, Y. Guo, C. Wang, F. Huang, X. Li, Q. Gao, L. Wu, L. Tao, J.
Guo, W. Wang, X. Guo, Environmental Pollution, 2017, 220, 317. 16. M. Watanabe, H. Noma, J. Kurai, H. Sano, D. Hantan, M. Ueki, H. Kitano, E.
Shimizu, Allergology International, 2017, 66, 52. 17. G.A. Paltinean, I. Petean, G. Arghir, D.F. Muntean, L. Muresan, M. Tomoaia-
Cotisel, Annals of the Academy of Romanian Scientists Series on Physics and Chemistry Sciences, 2017, 2 (2), 43.
18. O. Horovitz, G. Tomoaia, A. Mocanu, T. Yupsanis, M. Tomoaia-Cotisel, Gold Bulletin, 2007, 40 (4), 295.
19. M. Tomoaia-Cotisel, A. Tomoaia-Cotisel, T. Yupsanis, G. Tomoaia, I. Balea, A. Mocanu, Cs. Racz, Revue Roumaine de Chimie, 2006, 51 (12),1181.
20. M.A. Naghiu, M. Gorea, E. Mutch, F. Kristaly, M. Tomoaia-Cotisel, Journal of Material Science and Technology, 2013, 29 (7), 628.
21. G. Tomoaia, O. Soritau, M. Tomoaia-Cotisel, L.-B. Pop, A. Pop, A. Mocanu, O. Horovitz, L.D. Bobos, Powder Technology, 2013, 238, 99.
22. G. Tomoaia, O. Horovitz, A. Mocanu, A. Nita, A. Avram, C.P. Racz, O. Soritau, M. Cenariu, M. Tomoaia-Cotisel, Colloids and Surfaces B: Biointerfaces, 2015, 135, 726.
23. P.T. Frangopol. D.A. Cadenhead, G. Tomoaia, A. Mocanu, M. Tomoaia-Cotisel, Revue Roumaine de Chimie, 2015, 60 (2-3), 265.
24. I. Petean, G. Arghir, M. Tomoaia-Cotisel, O. Horovitz, D.A. Pop, Journal of Optoelectronics and Advanced Materials, 2010, 12 (10), 2119.

MICRO AND NANO ORGANIZATION OF ATMOSPHERIC PARTICULATE MATTER IN GRIGORESCU
57
25. R.D. Pasca, G. Tomoaia, A. Mocanu, I. Petean, G.A. Paltinean, O. Soritau, M. Tomoaia-Cotisel, Studia Univ. Babes-Bolyai, Chemia, 2015, 60 (3), 257.
26. R.D. Pasca, A. Mocanu, S.C. Cobzac, I. Petean, O. Horovitz, M. Tomoaia-Cotisel, Particulate Science and Technology, 2014, 32 (2), 131.
27. G. Tomoaia, M. Tomoaia-Cotisel, L.B. Pop, A. Pop, O. Horovitz, A. Mocanu, N. Jumate, L.D. Bobos, Revue Roumaine de Chimie, 2011, 56, 1039.
28. M. Tomoaia-Cotisel, A. Mocanu, Revista de Chimie (Bucharest), 2008, 59 (11), 1230.
29. G. Furtos, M.A. Naghiu, H. Declercq, M. Gorea, C. Prejmerean, O. Pana, M. Tomoaia-Cotisel, Journal of Biomedical Materials Research Part B. Applied Biomaterials, 2015, 104 (7), 1290.
30. F. Goga, E. Forizs, A. Avram, A. Rotaru, A. Lucian, I. Petean, A. Mocanu, M. Tomoaia-Cotisel, Revista de Chimie (Bucharest), 2017, 68 (6), 1193.
31. I. Cojocaru, A. Tomoaia-Cotisel, A. Mocanu, T. Yupsanis, M. Tomoaia-Cotisel, Revista de Chimie (Bucharest), 2017, 68 (7), 1470.
32. O. Cadar, P.T. Frangopol, G. Tomoaia, D. Oltean, G.A. Paltinean, A. Mocanu, O. Horovitz, M. Tomoaia-Cotisel, Studia Univ. Babes-Bolyai, Chemia, 2017, 62 (4), Tom I, 67.
33. I. Petean, G. Tomoaia, O. Horovitz, A. Mocanu, M. Tomoaia-Cotisel, Journal of Optoelectronics and Advanced Materials, 2008, 10 (9), 2289.
34. G. Tomoaia, A. Mocanu, L.D. Bobos, L.B. Pop, O. Horovitz, M. Tomoaia-Cotisel, Studia Univ. Babes-Bolyai, Chemia, 2015, 60 (3), 265.
35. G. Tomoaia, M. Tomoaia-Cotisel, A. Mocanu, O. Horovitz, L.D. Bobos, M. Crisan, I. Petean, Journal of Optoelectronics and Advanced Materials, 2008, 10 (4), 961.
36. A. Mocanu, R.D. Pasca, G. Tomoaia, C. Garbo, P.T. Frangopol, O. Horovitz, M. Tomoaia-Cotisel, International Journal of Nanomedicine, 2013, 8, 3867.
37. G. Tomoaia, P.T. Frangopol, O. Horovitz, L.D. Bobos, A. Mocanu, M. Tomoaia-Cotisel, Journal of Nanoscience and Nanotechnology, 2011, 11 (9), 7762.
38. G. Tomoaia, L.B. Pop, I. Petean, M. Tomoaia-Cotisel, Materiale Plastice, 2012, 49 (1), 48.

STUDIA UBB CHEMIA, LXIII, 3, 2018 (p. 59-72) (RECOMMENDED CITATION) DOI:10.24193/subbchem.2018.3.05
MACROKINETIC INVESTIGATIONS OF DRY FLUE-GAS DESULFURIZATION PROCESS USING TGA TECHNIQUE
SIMION DRĂGANa
ABSTRACT. In this paper, a kinetic study about of dry flue-gas desulfurization process was investigated. Experimental thermogravimetric measurements, employing a CAHN TG- 121 system, have been performed on the reaction of sulfur dioxide and oxygen with calcined limestone. The conversions versus time of calcined limestone, ranging in particle size from 25 to 450 μm, were measured over the temperature range 973-1173 K and a gas rate of 0.046 m/s. The influence of kinetic parameters on the sulfation process has been tracked. A significant influence is the temperature at which the sulfation and the size of the adsorbent granules are achieved. Processing the experimental results in lnkI,II-T-1 coordinates allowed the determination of the activation energy and the establishment of the corresponding mechanisms. The results, Ea>42 KJ/mol for the both indicate that the sulfation process is carried out according to the macrokinetic mass transformation model, only for small granules of the solid with dp <25 μm and temperatures T> 973 K) are the limiting ones the process. At higher granulations of the solid particles, the activation energy values Ea<<42 kJ/mol, emphasizes that limitative of the global process are the inner/outer diffusion phenomena shown that the sulfation process follows the transfer macrokinetic model. Keywords: dry desulfurization process, sulfation process, transfer and mass transformation macrokinetic model.
INTRODUCTION Industrial development and the economic progress have been
accompanied by a growing energy demand. Majority of energy production is obtained by burning fossil fuels with variable sulfur content. International Energy Agency estimates that fossil fuels will still play a key role in total energy production for the years to come. Has estimated that fossil fuels will continue to supply almost 80% of world energy use until 2040, and according to the
a Universitatea Babeş-Bolyai, Facultatea de Chimie şi Inginerie Chimică, Str. Kogălniceanu,
Nr. 1, RO-400084 Cluj-Napoca, Romania, [email protected]

SIMION DRĂGAN
60
World Energy Council, this might be prolonged to 2050 [1]. The combustion of coal and oil supply a significant part of the world's present energy demand and caused emissions of gas pollutants which released into the atmosphere affects the quality of the environment. An important particular case, with a major environmental impact, is the emissions of SO2, which is considered as one of the gravest chemical threats to the global environment [1-4].
The industrial sectors that contribute to the SO2 emissions are the metallurgical ore refining and the power industry that use fossil fuels as raw material. Sulfur dioxide emissions are harmful both to the environment and to human health, therefore the problem of desulfurization gaseous emissions from burning fossil fuels is very important. These industrial sectors continue to come under pressure from both national and local regulatory groups to reduce sulfur dioxide emissions. With trend in the industry, retrofit technologies are likely to play an important role in any SO2 emission reduction strategy. Emissions of SO2 can be controlled in several ways: switch to a fuel that has lower sulfur content, or improve the efficiency of the industrial process so that less fuel is required. The sulfur in the fuel can in principle be removed before use; however, in practice, it is uneconomic to remove more than a small percentage of the sulfur. In many applications, the most efficient means of controlling SO2 emissions is to remove the SO2 from the flue gases before they are released to the atmosphere.
Several different flue gas desulfurization (FGD) technologies have been developed for this aim. This is the main reason why the issue of flue-gas desulfurization has become very topical and is the theme of numerous researches in this field [5-10].
In the last decade, technology of flue gas desulfurization has made considerable progress in terms of efficiency, reliability and those are classified into three main processes: dry, semi-dry and wet [5]. Independently of the classification, most of specialized literature [1-8] agrees on the fact that the wet limestone FGD system is the FGD process most widely used (87%) because of its high desulfurization performance and low operating cost [5]. In dry and/or semi-dry FGD systems, SO2-containing flue gas reacts with an alkaline sorbent typically Ca(OH)2 or CaO. Spray dry is the second most popular FGD system worldwide and mostly used for relatively small to medium capacity boilers using low to medium S (1.5 wt.%) coal. A comparative analysis of these shows that the process based on the solid-gas reaction using lime produced in situ by spraying fine grain limestone directly into the furnace (firing zone) is the process recommended for plants with a capacity less than 100 MWh in operation. It is simple to implement and exploited it does not require complex equipment. The main deficiency of the process consists in the low degree of use of lime, the large amount of waste that is difficult to recover, which poses problems of storage.
MACROKINETIC INVESTIGATIONS OF DRY FLUE-GAS DESULFURIZATION PROCESS ...
61
During the years, a number of investigations have been made on the kinetics of the reaction of SO2 with limestone in the dry desulfurization processes. Two major directions have been investigated: the effect of various process variables on the reaction rate and identification of the reaction mechanism with the help of a suitable model. The adsorption of SO2 by limestone involves two consecutive reaction steps: (a) dissociation of calcium carbonate and (b) reaction of CaO with SO2. The rate of this second step is the important factor in all the pollution-control processes. Depending on the reactor temperature, reaction mechanisms of direct (CaCO3) or indirect (CaO) sulfation of the limestone may occur [11]. It has been demonstrated that indirect sulfation reached the highest efficiency of desulfurization [12, 13].
Current research aims to establish the process mechanism and increase the use of lime and improve the SO2 retention efficiency. In this paper a kinetic study to show the influence of the main parameters (temperature and solids particle size) of the desulfurization process. Based on experimental measurements were calculated rate constants and activation energies. Numeric values of activation energy provide indications of the macro-kinetic mechanism of the global dry desulfurization process. Process chemistry: The chemisorption process in the CaO-SO2 system is complex by the many transformation and transfer processes involved. The mass transformation processes that take place can be described by the reactions:
𝑆𝑆𝑆𝑆2[ ]𝑔𝑔 ↔ 𝑆𝑆𝑆𝑆2 𝑎𝑎𝑎𝑎𝑎𝑎 (1)
𝑆𝑆𝑆𝑆2 𝑎𝑎𝑎𝑎𝑎𝑎 + 𝐶𝐶𝐶𝐶𝑆𝑆[ ]𝑎𝑎𝑡𝑡<600° 𝐶𝐶�⎯⎯⎯⎯⎯� 𝐶𝐶𝐶𝐶𝑆𝑆𝑆𝑆3 (2)
𝐶𝐶𝐶𝐶𝑆𝑆𝑆𝑆3𝑡𝑡:600−680°𝐶𝐶�⎯⎯⎯⎯⎯⎯⎯⎯�𝐶𝐶𝐶𝐶𝑆𝑆 + 𝑆𝑆𝑆𝑆2 (3)
4𝐶𝐶𝐶𝐶𝑆𝑆𝑆𝑆3𝑡𝑡>680°𝐶𝐶�⎯⎯⎯⎯� 3𝐶𝐶𝐶𝐶𝑆𝑆𝑆𝑆4 + 𝐶𝐶𝐶𝐶𝑆𝑆 (4)
3𝐶𝐶𝐶𝐶𝑆𝑆𝑆𝑆4 + 𝐶𝐶𝐶𝐶𝑆𝑆𝑡𝑡>900°𝐶𝐶�⎯⎯⎯⎯� 4𝐶𝐶𝐶𝐶𝑆𝑆 + 4𝑆𝑆𝑆𝑆2 (5)
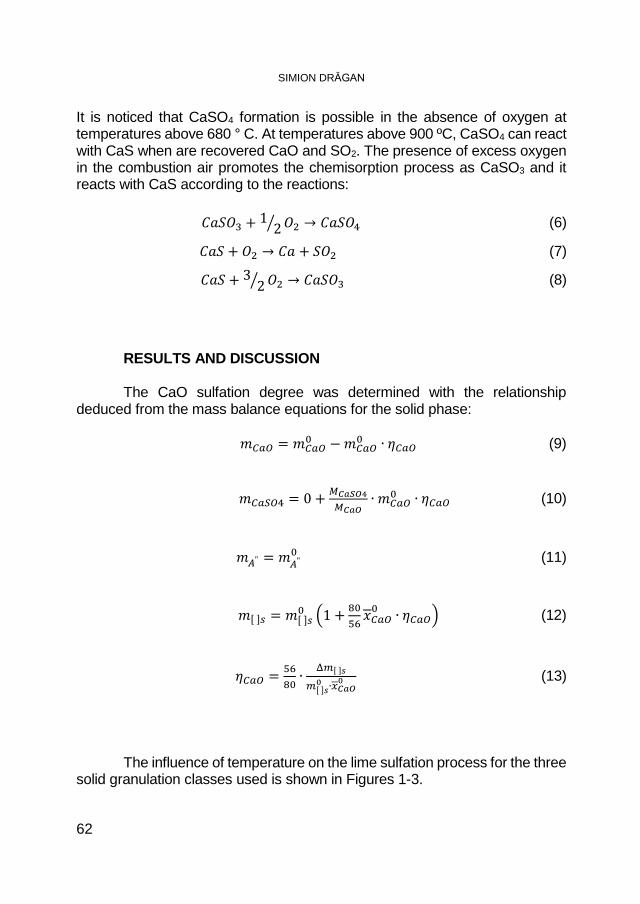
SIMION DRĂGAN
62
It is noticed that CaSO4 formation is possible in the absence of oxygen at temperatures above 680 ° C. At temperatures above 900 ºC, CaSO4 can react with CaS when are recovered CaO and SO2. The presence of excess oxygen in the combustion air promotes the chemisorption process as CaSO3 and it reacts with CaS according to the reactions:
𝐶𝐶𝐶𝐶𝑆𝑆𝑆𝑆3 + 12� 𝑆𝑆2 → 𝐶𝐶𝐶𝐶𝑆𝑆𝑆𝑆4 (6)
𝐶𝐶𝐶𝐶𝑆𝑆 + 𝑆𝑆2 → 𝐶𝐶𝐶𝐶 + 𝑆𝑆𝑆𝑆2 (7)
𝐶𝐶𝐶𝐶𝑆𝑆 + 32� 𝑆𝑆2 → 𝐶𝐶𝐶𝐶𝑆𝑆𝑆𝑆3 (8)
RESULTS AND DISCUSSION The CaO sulfation degree was determined with the relationship
deduced from the mass balance equations for the solid phase:
𝑚𝑚𝐶𝐶𝑎𝑎𝐶𝐶 = 𝑚𝑚𝐶𝐶𝑎𝑎𝐶𝐶0 −𝑚𝑚𝐶𝐶𝑎𝑎𝐶𝐶
0 ∙ 𝜂𝜂𝐶𝐶𝑎𝑎𝐶𝐶 (9)
𝑚𝑚𝐶𝐶𝑎𝑎𝐶𝐶𝐶𝐶4 = 0 + 𝑀𝑀𝐶𝐶𝐶𝐶𝐶𝐶𝐶𝐶4𝑀𝑀𝐶𝐶𝐶𝐶𝐶𝐶
∙ 𝑚𝑚𝐶𝐶𝑎𝑎𝐶𝐶0 ∙ 𝜂𝜂𝐶𝐶𝑎𝑎𝐶𝐶 (10)
𝑚𝑚𝐴𝐴" = 𝑚𝑚𝐴𝐴"0 (11)
𝑚𝑚[ ]𝑎𝑎 = 𝑚𝑚[ ]𝑎𝑎0 �1 + 80
56𝑥𝑥𝐶𝐶𝑎𝑎𝐶𝐶0 ∙ 𝜂𝜂𝐶𝐶𝑎𝑎𝐶𝐶� (12)
𝜂𝜂𝐶𝐶𝑎𝑎𝐶𝐶 = 5680∙ Δ𝑚𝑚[ ]𝑠𝑠
𝑚𝑚[ ]𝑠𝑠0 ∙𝑥𝑥𝐶𝐶𝐶𝐶𝐶𝐶
0 (13)
The influence of temperature on the lime sulfation process for the three solid granulation classes used is shown in Figures 1-3.
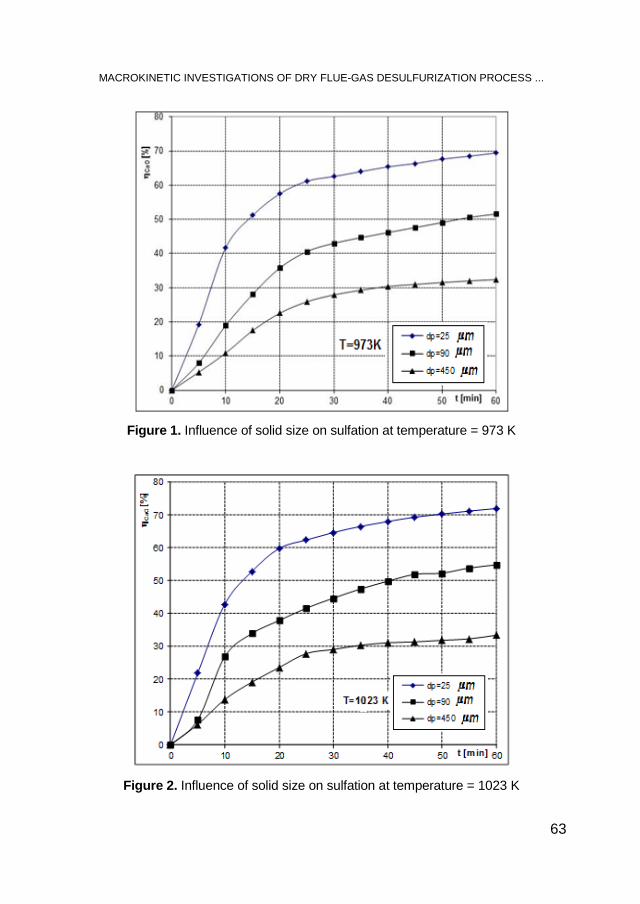
MACROKINETIC INVESTIGATIONS OF DRY FLUE-GAS DESULFURIZATION PROCESS ...
63
Figure 1. Influence of solid size on sulfation at temperature = 973 K
Figure 2. Influence of solid size on sulfation at temperature = 1023 K
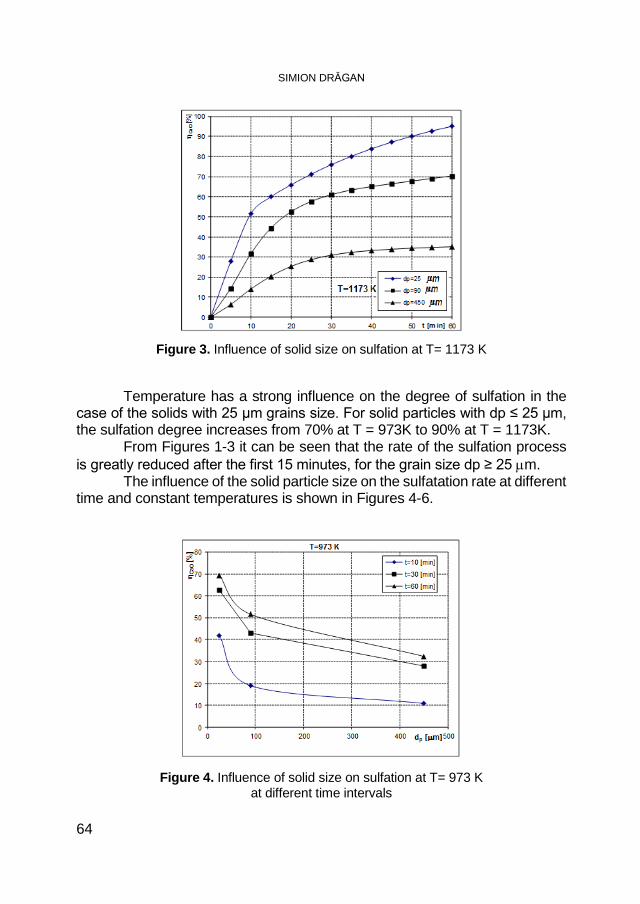
SIMION DRĂGAN
64
Figure 3. Influence of solid size on sulfation at T= 1173 K
Temperature has a strong influence on the degree of sulfation in the case of the solids with 25 μm grains size. For solid particles with dp ≤ 25 μm, the sulfation degree increases from 70% at T = 973K to 90% at T = 1173K.
From Figures 1-3 it can be seen that the rate of the sulfation process is greatly reduced after the first 15 minutes, for the grain size dp ≥ 25 µm.
The influence of the solid particle size on the sulfatation rate at different time and constant temperatures is shown in Figures 4-6.
Figure 4. Influence of solid size on sulfation at T= 973 K
at different time intervals
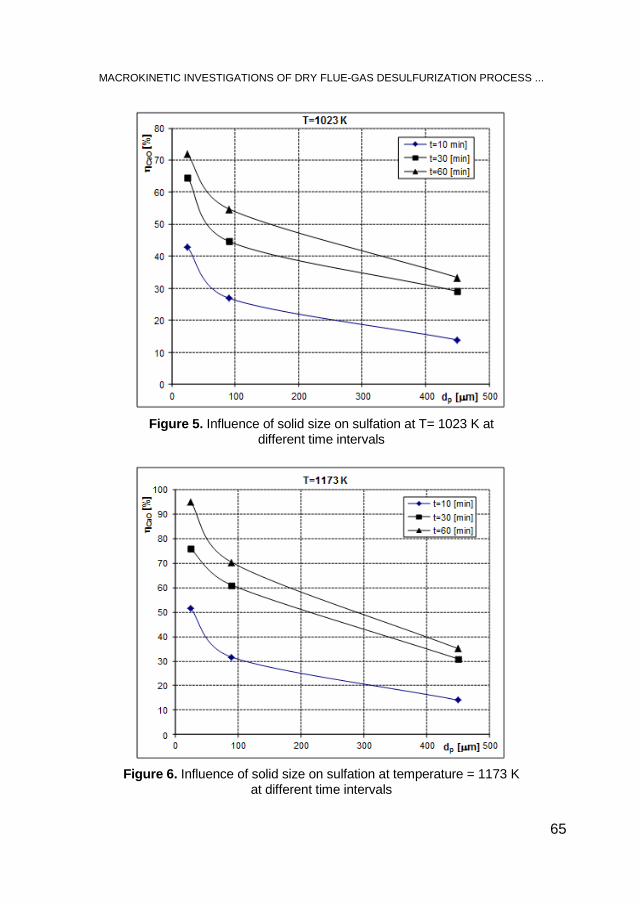
MACROKINETIC INVESTIGATIONS OF DRY FLUE-GAS DESULFURIZATION PROCESS ...
65
Figure 5. Influence of solid size on sulfation at T= 1023 K at
different time intervals
Figure 6. Influence of solid size on sulfation at temperature = 1173 K
at different time intervals
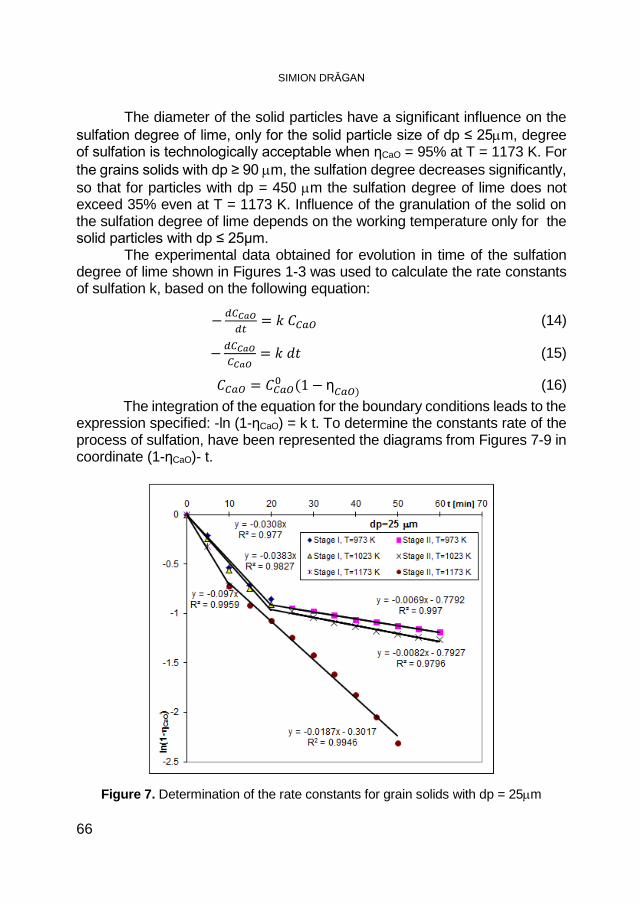
SIMION DRĂGAN
66
The diameter of the solid particles have a significant influence on the sulfation degree of lime, only for the solid particle size of dp ≤ 25µm, degree of sulfation is technologically acceptable when ηCaO = 95% at T = 1173 K. For the grains solids with dp ≥ 90 µm, the sulfation degree decreases significantly, so that for particles with dp = 450 µm the sulfation degree of lime does not exceed 35% even at T = 1173 K. Influence of the granulation of the solid on the sulfation degree of lime depends on the working temperature only for the solid particles with dp ≤ 25μm.
The experimental data obtained for evolution in time of the sulfation degree of lime shown in Figures 1-3 was used to calculate the rate constants of sulfation k, based on the following equation:
−𝑎𝑎𝐶𝐶𝐶𝐶𝐶𝐶𝐶𝐶𝑎𝑎𝑡𝑡
= 𝑘𝑘 𝐶𝐶𝐶𝐶𝑎𝑎𝐶𝐶 (14)
−𝑎𝑎𝐶𝐶𝐶𝐶𝐶𝐶𝐶𝐶 𝐶𝐶𝐶𝐶𝐶𝐶𝐶𝐶
= 𝑘𝑘 𝑑𝑑𝑑𝑑 (15)
𝐶𝐶𝐶𝐶𝑎𝑎𝐶𝐶 = 𝐶𝐶𝐶𝐶𝑎𝑎𝐶𝐶0 (1− η𝐶𝐶𝑎𝑎𝐶𝐶) (16) The integration of the equation for the boundary conditions leads to the
expression specified: -ln (1-ηCaO) = k t. To determine the constants rate of the process of sulfation, have been represented the diagrams from Figures 7-9 in coordinate (1-ηCaO)- t.
Figure 7. Determination of the rate constants for grain solids with dp = 25µm

MACROKINETIC INVESTIGATIONS OF DRY FLUE-GAS DESULFURIZATION PROCESS ...
67
Figure 8. Determination of the rate constants for grain solids with dp = 90µm
Figure 9. Determination of the rate constants for grain solids with dp = 450µm
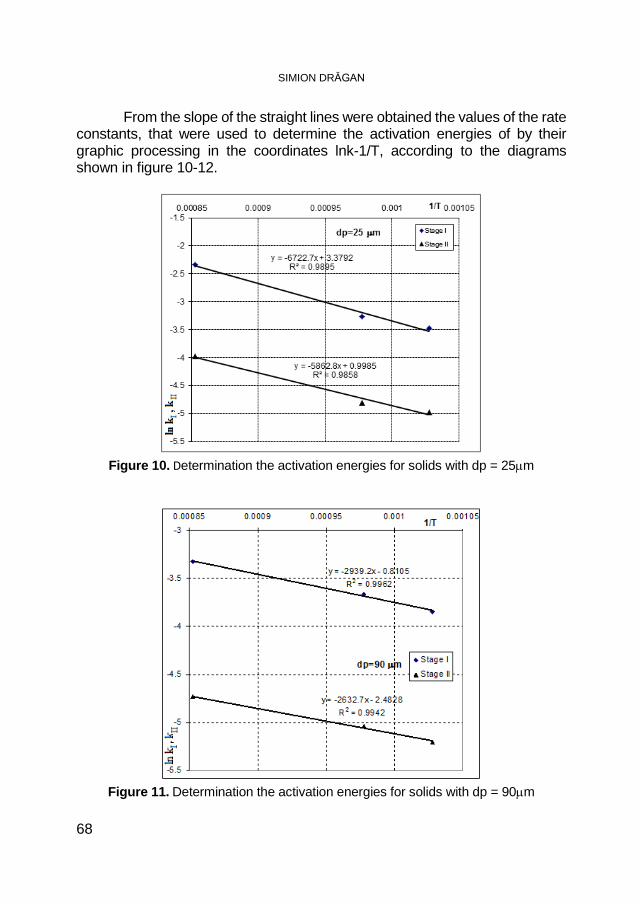
SIMION DRĂGAN
68
From the slope of the straight lines were obtained the values of the rate constants, that were used to determine the activation energies of by their graphic processing in the coordinates lnk-1/T, according to the diagrams shown in figure 10-12.
Figure 10. Determination the activation energies for solids with dp = 25µm
Figure 11. Determination the activation energies for solids with dp = 90µm

MACROKINETIC INVESTIGATIONS OF DRY FLUE-GAS DESULFURIZATION PROCESS ...
69
Figure 12. Determination the activation energies for solids with dp = 450µm
The diagrams analysis suggests a change in the macrokinetic mechanism by which the global desulfurisation process takes place in time.
The numerical values of the rate constants and activation energies corresponding to the two stage of the sulfation process of under the working conditions are shown in Table1.
Table 1. The constants rate k and activation energies Ea
dp [ µm]
k T [K] Ea [Kj/mol] 973 1023 1173 I II
25 kI 0.0308 0.0383 0.0971 55.92 48.76 kII 0.0069 0.0082 0.0187
90 kI 0.0214 0.0256 0.0361 21.9 21.51 kII 0.0055 0.0065 0.0088
450 kI 0.0123 0.0131 0.0142 6.54 4.95 kII 0.0017 0.0018 0.0019
It can be seen that the values of the rate constants increase with increasing temperature and decrease with increasing solid grain size. For the stage I corresponding to the start-up of the process, the constants rate kI are much higher than the constant rate kII corresponding to the final stage of the process.
SIMION DRĂGAN
70
The analysis of the sulfation process based on the activation energies Ea shows that it is carried out according to the macrokinetic mass transformation model, only for small granules of the solid with dp <25 μm and temperatures T> 973 K, where Ea has values higher than 42 Kj /mol. At higher granulations of the solid, the activation energy values shown that the sulfation process follows the pore-transfer macrokinetic model. The molar volume of CaSO4 that is formed is greater than the molar volume of the solid reagent, thus decreases the porosity of the solid. Thus, the Knudsen diffusion stage is passed, the share of mass transformation processes in the global process is decreasing, as evidenced by the strong decrease in the value of activation energies.
In the diffusion stage, the weight of mass transformation processes in the global process is decreasing, as evidenced by the strong decrease the activation energies.
CONCLUSIONS The dry injection of limestone fine particles in the power plant furnaces
is the second most commonly used process for flue gas desulfurization and acid rain mitigation. The limestone is quickly converted to lime which further reacts with sulfur dioxide. The complete calcination is a key factor for higher desulfurization efficiency.
The effect of the principal variables affecting sulfur dioxide retention (temperature and solid particle size) and macrokinetic mechanism have been investigated with TGA technique. The influence of temperature on the conversion of solid particles, at a given time, is rather significant. This may suggest a transformation rate-determining step, with a great activation energy. Temperature has a strong influence on the degree of sulfation in the case of the solids with 25μm grains size. The diameter of the solid particles have a significant influence on the sulfation degree of lime. The sulfation reaction rate increase with decreasing sorbent particle size and increasing with temperature.
It can be observed that the sulfation process was performed by two stages. It is carried out according to the macrokinetic mass transformation model, only for small granules of the solid with dp <25 μm and temperatures T> 973 K. where activation energy Ea has values higher than 42 Kj /mol. The first stage was controlled by chemical reaction and/or diffusion through porous system of the particle. As the reaction proceeded, the pore volume of solid has decreased due to molar volume of the product (CaSO4) was higher than reagent solid (CaO) and as a result the external pores were plugged. In this moment, the second stage began and it was controlled by diffusion through reaction product layer.
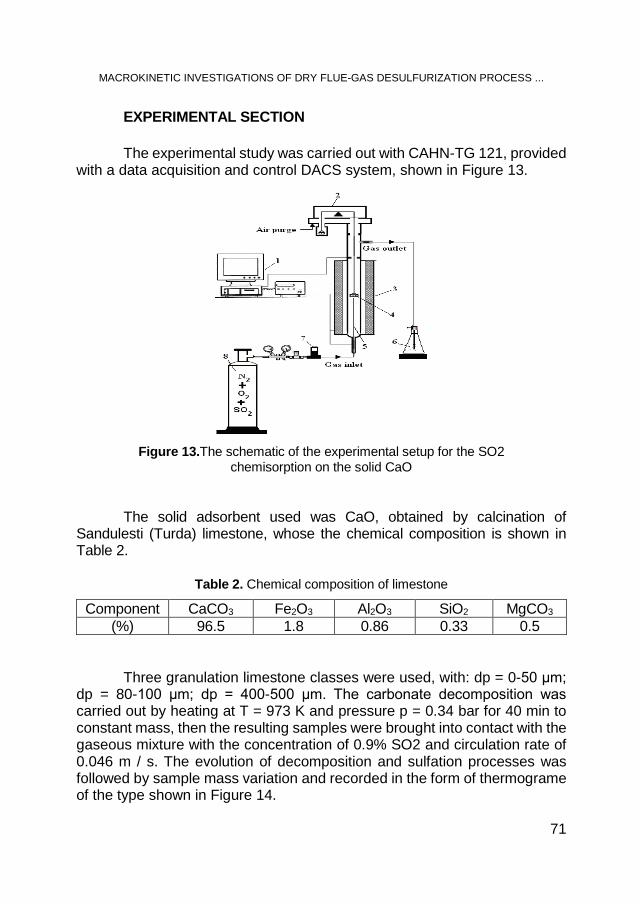
MACROKINETIC INVESTIGATIONS OF DRY FLUE-GAS DESULFURIZATION PROCESS ...
71
EXPERIMENTAL SECTION
The experimental study was carried out with CAHN-TG 121, provided with a data acquisition and control DACS system, shown in Figure 13.
Figure 13.The schematic of the experimental setup for the SO2
chemisorption on the solid CaO
The solid adsorbent used was CaO, obtained by calcination of Sandulesti (Turda) limestone, whose the chemical composition is shown in Table 2.
Table 2. Chemical composition of limestone
Component CaCO3 Fe2O3 Al2O3 SiO2 MgCO3
(%) 96.5 1.8 0.86 0.33 0.5
Three granulation limestone classes were used, with: dp = 0-50 μm; dp = 80-100 μm; dp = 400-500 μm. The carbonate decomposition was carried out by heating at T = 973 K and pressure p = 0.34 bar for 40 min to constant mass, then the resulting samples were brought into contact with the gaseous mixture with the concentration of 0.9% SO2 and circulation rate of 0.046 m / s. The evolution of decomposition and sulfation processes was followed by sample mass variation and recorded in the form of thermograme of the type shown in Figure 14.
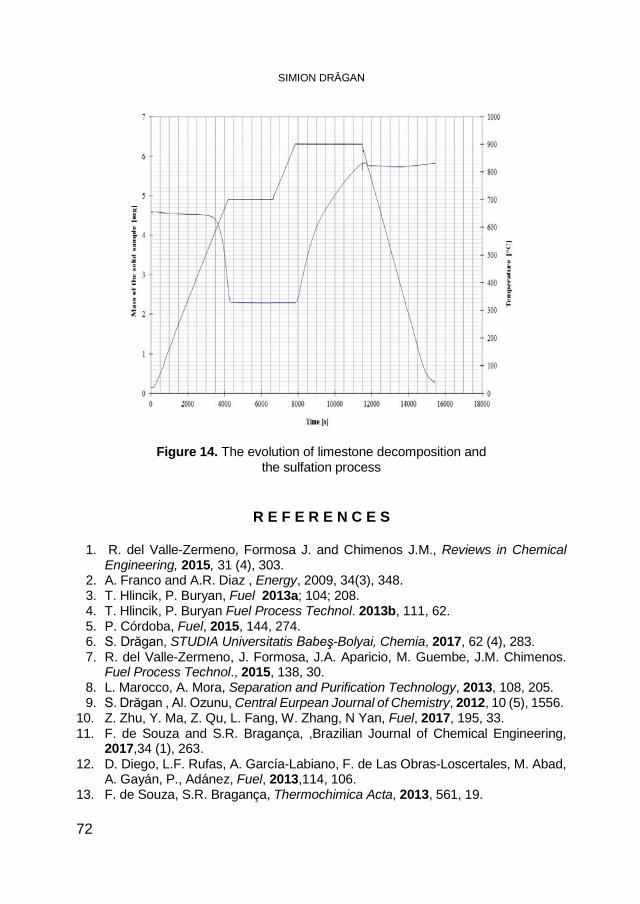
SIMION DRĂGAN
72
Figure 14. The evolution of limestone decomposition and
the sulfation process
R E F E R E N C E S
1. R. del Valle-Zermeno, Formosa J. and Chimenos J.M., Reviews in Chemical Engineering, 2015, 31 (4), 303.
2. A. Franco and A.R. Diaz , Energy, 2009, 34(3), 348. 3. T. Hlincik, P. Buryan, Fuel 2013a; 104; 208. 4. T. Hlincik, P. Buryan Fuel Process Technol. 2013b, 111, 62. 5. P. Córdoba, Fuel, 2015, 144, 274. 6. S. Drăgan, STUDIA Universitatis Babeş-Bolyai, Chemia, 2017, 62 (4), 283. 7. R. del Valle-Zermeno, J. Formosa, J.A. Aparicio, M. Guembe, J.M. Chimenos.
Fuel Process Technol., 2015, 138, 30. 8. L. Marocco, A. Mora, Separation and Purification Technology, 2013, 108, 205. 9. S. Drăgan , Al. Ozunu, Central Eurpean Journal of Chemistry, 2012, 10 (5), 1556.
10. Z. Zhu, Y. Ma, Z. Qu, L. Fang, W. Zhang, N Yan, Fuel, 2017, 195, 33. 11. F. de Souza and S.R. Bragança, ,Brazilian Journal of Chemical Engineering,
2017,34 (1), 263. 12. D. Diego, L.F. Rufas, A. García-Labiano, F. de Las Obras-Loscertales, M. Abad,
A. Gayán, P., Adánez, Fuel, 2013,114, 106. 13. F. de Souza, S.R. Bragança, Thermochimica Acta, 2013, 561, 19.
STUDIA UBB CHEMIA, LXIII, 3, 2018 (p. 73-85) (RECOMMENDED CITATION) DOI:10.24193/subbchem.2018.3.06
ANTIBACTERIAL ACTIVITY OF SILVER NANOPARTICLES OBTAINED BY CO-REDUCTION WITH SODIUM CITRATE
AND TANNIC ACID
SORIN RAPUNTEANa, REKA BALINTb, GERTRUD ALEXANDRA PALTINEANb, GHEORGHE TOMOAIAc,d, AURORA MOCANUb,*,
CSABA-PAL RACZb, OSSI HOROVITZb, MARIA TOMOAIA-COTISELb,d
ABSTRACT. The wet chemical synthesis of silver nanoparticles (AgNPs) by reduction of silver nitrate with sodium citrate, tannic acid, and their mixture is reported. The obtained silver nanoparticles were investigated by UV-Vis spectroscopy, scanning transmission electron microscopy (STEM), and atomic force microscopy (AFM) images and their antibacterial effect against Escherichia coli was assessed. Keywords: silver nanoparticles, sodium citrate, tannic acid, UV-Vis spectra, STEM, AFM, antibacterial effect
INTRODUCTION In the present war against antibiotic resistant bacterial strains, the old
remedies with antimicrobial properties, such as certain metals or metal oxides were revived, but in the modern formula of nanoparticles (NPs). Most research is consecrated to silver nanoparticles (AgNPs), single or in association with antibiotics [1-12]. Nevertheless, the mechanism of the antibacterial action of
a University of Agricultural Sciences and Veterinary Medicine of Cluj-Napoca, 3-5, Manastur
Str., RO-400372, Cluj-Napoca, Romania b Babes-Bolyai University of Cluj-Napoca, Faculty of Chemistry and Chemical Engineering,
Physical Chemistry Centre, 11 Arany J. Str., RO-400028 Cluj-Napoca, Romania c Iuliu Hatieganu University of Medicine and Pharmacy, Orthopedy and Traumatology
Department, 47 Mosoiu T. Str., RO-400132 Cluj-Napoca, Romania d Academy of Romanian Scientists, 54 Splaiul Independentei, RO-050094, Bucharest, Romania * Corresponding author [email protected]
S. RAPUNTEAN, R. BALINT, G.A. PALTINEAN, G. TOMOAIA, A. MOCANU, CS.-P RACZ, O. HOROVITZ, M. TOMOAIA-COTISEL
74
AgNPs is still not fully understood; is it due to the attack of AgNPs themselves on bacterial cells, or to the silver ions released by the nanoparticles, or to the production of reactive oxidative species [12-15], induced by AgNPs.
For the preparation of AgNPs, three categories of methods are mentioned in literature [14, 16-18]: chemical methods based on the reduction of Ag+ ions in aqueous or in organic solution, physico-chemical methods (photo-physical and electrochemical) and biosynthesis. For the chemical methods in aqueous solution, various reduction agents were proposed, such as sodium citrate, sodium borohydride, hydrazine, glucose, hydroquinone, gallic acid, β-cyclodextrin, ascorbic acid, various plant extracts [7, 14-22]. Although, the excess of reduction agents acts sometimes also as stabilizer of the colloidal system of AgNPs, frequently supplementary capping agents are introduced, such as starch, gelatin, polyvinylpyrrolidone (PVP), polyvinyl alcohol (PVA), poly-L-lysine, cetyltrimethyl-ammonium bromide (CTAB) and other surfactants [18, 23].
Tannic acid (TA, C76H52O46) was also proposed, single or associated with another reduction agent, for the synthesis of metal nanoparticles [24], having many phenolic groups in the structure. Due to its large molecule (molar mass: 1700 g), TA appears itself as nanoparticle (hydrodynamic diameter 1.63 nm) [25]. It becomes unstable when temperature and pH increase, and suffers hydrolysis and oxidation reactions. The AgNPs modified with TA were proposed as microbicides and for wound healing [26-28]. TA was used for the preparation of AgNPs [22, 24, 29-34]. TA was also used together with sodium citrate to prepare AgNPs [35, 36] mainly for catalytic properties [35].
Our study is the first investigation to compare the synthesis of AgNPs using trisodium citrate (TSC) and TA independently and together at various molar ratios for the reduction of Ag+ ions in AgNO3 aqueous solutions to obtain AgNPs. Further, the characteristics of AgNPs realized by co-reduction for different mole ratios of the reagents and their biological effect on Escherichia coli were examined.
RESULTS AND DISCUSSION The samples prepared (colloidal silver solutions) from the various
syntheses are presented in Table 1, along with the compositions of the mixtures of reactants (molar concentration and weight percentage), and the silver content in the final solution.
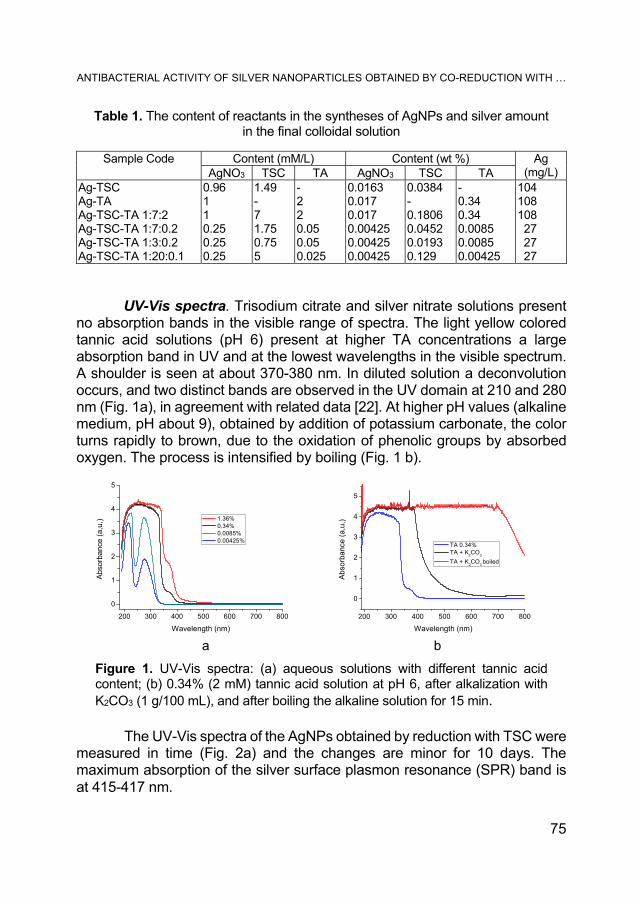
ANTIBACTERIAL ACTIVITY OF SILVER NANOPARTICLES OBTAINED BY CO-REDUCTION WITH …
75
Table 1. The content of reactants in the syntheses of AgNPs and silver amount in the final colloidal solution
UV-Vis spectra. Trisodium citrate and silver nitrate solutions present no absorption bands in the visible range of spectra. The light yellow colored tannic acid solutions (pH 6) present at higher TA concentrations a large absorption band in UV and at the lowest wavelengths in the visible spectrum. A shoulder is seen at about 370-380 nm. In diluted solution a deconvolution occurs, and two distinct bands are observed in the UV domain at 210 and 280 nm (Fig. 1a), in agreement with related data [22]. At higher pH values (alkaline medium, pH about 9), obtained by addition of potassium carbonate, the color turns rapidly to brown, due to the oxidation of phenolic groups by absorbed oxygen. The process is intensified by boiling (Fig. 1 b).
200 300 400 500 600 700 800
0
1
2
3
4
5
Abs
orba
nce
(a,u
,)
Wavelength (nm)
1.36% 0.34% 0.0085% 0.00425%
200 300 400 500 600 700 800
0
1
2
3
4
5
Abs
orba
nce
(a,u
,)
Wavelength (nm)
TA 0.34% TA + K
2CO
3
TA + K2CO
3 boiled
a b
Figure 1. UV-Vis spectra: (a) aqueous solutions with different tannic acid content; (b) 0.34% (2 mM) tannic acid solution at pH 6, after alkalization with K2CO3 (1 g/100 mL), and after boiling the alkaline solution for 15 min.
The UV-Vis spectra of the AgNPs obtained by reduction with TSC were
measured in time (Fig. 2a) and the changes are minor for 10 days. The maximum absorption of the silver surface plasmon resonance (SPR) band is at 415-417 nm.
Sample Code Content (mM/L) Content (wt %) Ag (mg/L) AgNO3 TSC TA AgNO3 TSC TA
Ag-TSC Ag-TA Ag-TSC-TA 1:7:2 Ag-TSC-TA 1:7:0.2 Ag-TSC-TA 1:3:0.2 Ag-TSC-TA 1:20:0.1
0.96 1 1 0.25 0.25 0.25
1.49 - 7 1.75 0.75 5
- 2 2 0.05 0.05 0.025
0.0163 0.017 0.017 0.00425 0.00425 0.00425
0.0384 - 0.1806 0.0452 0.0193 0.129
- 0.34 0.34 0.0085 0.0085 0.00425
104 108 108 27 27 27
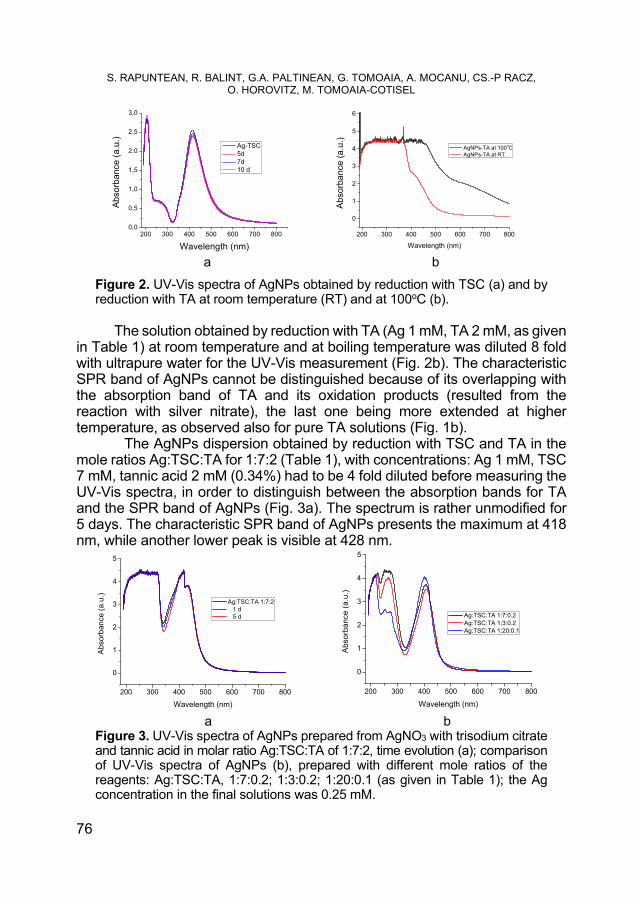
S. RAPUNTEAN, R. BALINT, G.A. PALTINEAN, G. TOMOAIA, A. MOCANU, CS.-P RACZ, O. HOROVITZ, M. TOMOAIA-COTISEL
76
200 300 400 500 600 700 8000,0
0,5
1,0
1,5
2,0
2,5
3,0A
bsor
ban
ce (
a.u
.)
Wavelength (nm)
Ag-TSC 5d 7d 10 d
200 300 400 500 600 700 800
0
1
2
3
4
5
6
Ab
sorb
an
ce (
a.u
.)
Wavelength (nm)
AgNPs-TA at 100oC AgNPs-TA at RT.
a b
Figure 2. UV-Vis spectra of AgNPs obtained by reduction with TSC (a) and by reduction with TA at room temperature (RT) and at 100oC (b).
The solution obtained by reduction with TA (Ag 1 mM, TA 2 mM, as given in Table 1) at room temperature and at boiling temperature was diluted 8 fold with ultrapure water for the UV-Vis measurement (Fig. 2b). The characteristic SPR band of AgNPs cannot be distinguished because of its overlapping with the absorption band of TA and its oxidation products (resulted from the reaction with silver nitrate), the last one being more extended at higher temperature, as observed also for pure TA solutions (Fig. 1b).
The AgNPs dispersion obtained by reduction with TSC and TA in the mole ratios Ag:TSC:TA for 1:7:2 (Table 1), with concentrations: Ag 1 mM, TSC 7 mM, tannic acid 2 mM (0.34%) had to be 4 fold diluted before measuring the UV-Vis spectra, in order to distinguish between the absorption bands for TA and the SPR band of AgNPs (Fig. 3a). The spectrum is rather unmodified for 5 days. The characteristic SPR band of AgNPs presents the maximum at 418 nm, while another lower peak is visible at 428 nm.
200 300 400 500 600 700 800
0
1
2
3
4
5
Abs
orba
nce
(a.u
.)
Wavelength (nm)
Ag:TSC:TA 1:7:2 1 d 5 d
200 300 400 500 600 700 800
0
1
2
3
4
5
Abs
orba
nce
(a.u
.)
Wavelength (nm)
Ag:TSC:TA 1:7:0.2 Ag:TSC:TA 1:3:0.2 Ag:TSC:TA 1:20:0.1
a b
Figure 3. UV-Vis spectra of AgNPs prepared from AgNO3 with trisodium citrate and tannic acid in molar ratio Ag:TSC:TA of 1:7:2, time evolution (a); comparison of UV-Vis spectra of AgNPs (b), prepared with different mole ratios of the reagents: Ag:TSC:TA, 1:7:0.2; 1:3:0.2; 1:20:0.1 (as given in Table 1); the Ag concentration in the final solutions was 0.25 mM.

ANTIBACTERIAL ACTIVITY OF SILVER NANOPARTICLES OBTAINED BY CO-REDUCTION WITH …
77
The spectra for the molar ratios Ag:TSC:TA 1:7:0.2 and 1:3:0.2, and 1:20:0.1 are compared in Fig. 3b. With a lowering of the TA content, the absorption band of TA and the SPR band of AgNPs become clearly separated; the maxima for AgNPs appear at 407 nm (1:7:0.2), 408 nm (1:3:0.2), and 402nm (1:20:0.1). The UV absorption band of TA in UV is split in two, as in Fig. 1a for low TA concentrations. In time, the AgNPs absorption bands remain almost unchanged for all samples (e.g. Fig. 3a).
STEM images. In the STEM images: Fig. 4a,b for AgNPs prepared with the Ag:TSC:TA 1:7:2 mole ratio, and Fig. 4c,d for those with 1:20:0.1 mole ratio, nearly spherical shaped AgNPs are observed. The sizes of the AgNPs in the samples were evaluated by measuring the diameters of a large number of particles on micrographs. For the different samples, the average diameter of particles was evaluated ± the standard deviation going from 10 ± 5 nm (Ag:TSC:TA for 1:20:0.1) to 31 ± 7 nm (Ag:TSC:TA for 1:7:2).
a b
c d
Figure 4. SE (a, c) and TE (b, d) images for AgNPs obtained with Ag:TSC:TA mole ratios 1:7:2 (a, b), and 1:20:0.1 (c, d). The scales in the STEM images correspond to 300 nm (a), 100 nm (c), and 50 nm (b, d).
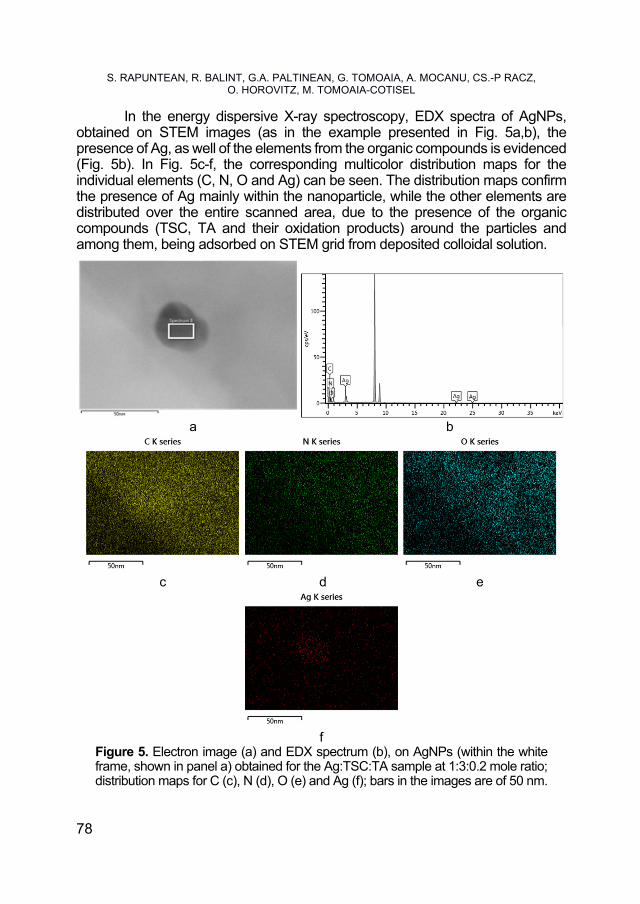
S. RAPUNTEAN, R. BALINT, G.A. PALTINEAN, G. TOMOAIA, A. MOCANU, CS.-P RACZ, O. HOROVITZ, M. TOMOAIA-COTISEL
78
In the energy dispersive X-ray spectroscopy, EDX spectra of AgNPs, obtained on STEM images (as in the example presented in Fig. 5a,b), the presence of Ag, as well of the elements from the organic compounds is evidenced (Fig. 5b). In Fig. 5c-f, the corresponding multicolor distribution maps for the individual elements (C, N, O and Ag) can be seen. The distribution maps confirm the presence of Ag mainly within the nanoparticle, while the other elements are distributed over the entire scanned area, due to the presence of the organic compounds (TSC, TA and their oxidation products) around the particles and among them, being adsorbed on STEM grid from deposited colloidal solution.
a b
c d e
f
Figure 5. Electron image (a) and EDX spectrum (b), on AgNPs (within the white frame, shown in panel a) obtained for the Ag:TSC:TA sample at 1:3:0.2 mole ratio; distribution maps for C (c), N (d), O (e) and Ag (f); bars in the images are of 50 nm.
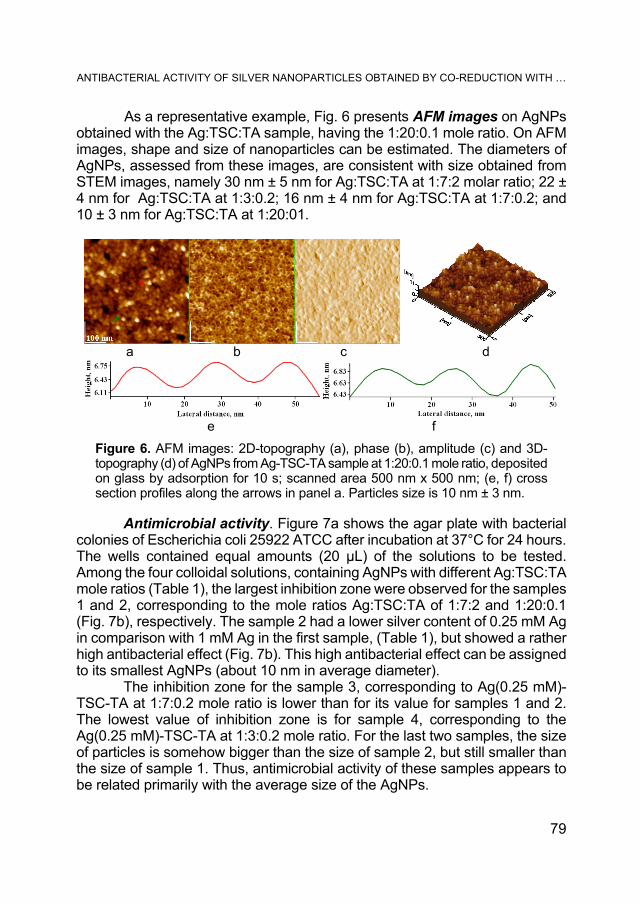
ANTIBACTERIAL ACTIVITY OF SILVER NANOPARTICLES OBTAINED BY CO-REDUCTION WITH …
79
As a representative example, Fig. 6 presents AFM images on AgNPs obtained with the Ag:TSC:TA sample, having the 1:20:0.1 mole ratio. On AFM images, shape and size of nanoparticles can be estimated. The diameters of AgNPs, assessed from these images, are consistent with size obtained from STEM images, namely 30 nm ± 5 nm for Ag:TSC:TA at 1:7:2 molar ratio; 22 ± 4 nm for Ag:TSC:TA at 1:3:0.2; 16 nm ± 4 nm for Ag:TSC:TA at 1:7:0.2; and 10 ± 3 nm for Ag:TSC:TA at 1:20:01.
a b c d
e f
Figure 6. AFM images: 2D-topography (a), phase (b), amplitude (c) and 3D-topography (d) of AgNPs from Ag-TSC-TA sample at 1:20:0.1 mole ratio, deposited on glass by adsorption for 10 s; scanned area 500 nm x 500 nm; (e, f) cross section profiles along the arrows in panel a. Particles size is 10 nm ± 3 nm.
Antimicrobial activity. Figure 7a shows the agar plate with bacterial
colonies of Escherichia coli 25922 ATCC after incubation at 37°C for 24 hours. The wells contained equal amounts (20 μL) of the solutions to be tested. Among the four colloidal solutions, containing AgNPs with different Ag:TSC:TA mole ratios (Table 1), the largest inhibition zone were observed for the samples 1 and 2, corresponding to the mole ratios Ag:TSC:TA of 1:7:2 and 1:20:0.1 (Fig. 7b), respectively. The sample 2 had a lower silver content of 0.25 mM Ag in comparison with 1 mM Ag in the first sample, (Table 1), but showed a rather high antibacterial effect (Fig. 7b). This high antibacterial effect can be assigned to its smallest AgNPs (about 10 nm in average diameter).
The inhibition zone for the sample 3, corresponding to Ag(0.25 mM)-TSC-TA at 1:7:0.2 mole ratio is lower than for its value for samples 1 and 2. The lowest value of inhibition zone is for sample 4, corresponding to the Ag(0.25 mM)-TSC-TA at 1:3:0.2 mole ratio. For the last two samples, the size of particles is somehow bigger than the size of sample 2, but still smaller than the size of sample 1. Thus, antimicrobial activity of these samples appears to be related primarily with the average size of the AgNPs.
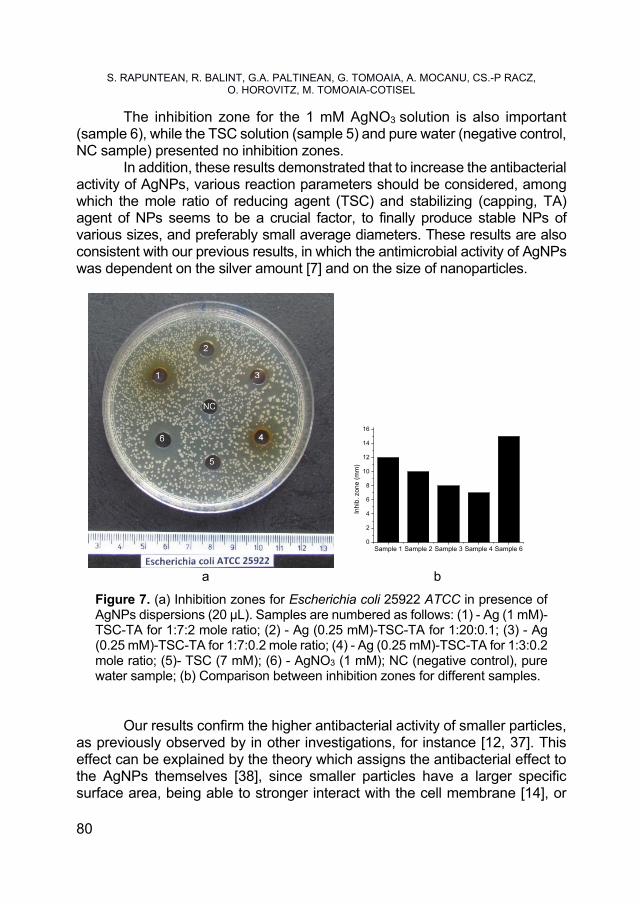
S. RAPUNTEAN, R. BALINT, G.A. PALTINEAN, G. TOMOAIA, A. MOCANU, CS.-P RACZ, O. HOROVITZ, M. TOMOAIA-COTISEL
80
The inhibition zone for the 1 mM AgNO3 solution is also important (sample 6), while the TSC solution (sample 5) and pure water (negative control, NC sample) presented no inhibition zones.
In addition, these results demonstrated that to increase the antibacterial activity of AgNPs, various reaction parameters should be considered, among which the mole ratio of reducing agent (TSC) and stabilizing (capping, TA) agent of NPs seems to be a crucial factor, to finally produce stable NPs of various sizes, and preferably small average diameters. These results are also consistent with our previous results, in which the antimicrobial activity of AgNPs was dependent on the silver amount [7] and on the size of nanoparticles.
Sample 1 Sample 2 Sample 3 Sample 4 Sample 60
2
4
6
8
10
12
14
16
Inh
ib.
zon
e (m
m)
a b
Figure 7. (a) Inhibition zones for Escherichia coli 25922 ATCC in presence of AgNPs dispersions (20 μL). Samples are numbered as follows: (1) - Ag (1 mM)-TSC-TA for 1:7:2 mole ratio; (2) - Ag (0.25 mM)-TSC-TA for 1:20:0.1; (3) - Ag (0.25 mM)-TSC-TA for 1:7:0.2 mole ratio; (4) - Ag (0.25 mM)-TSC-TA for 1:3:0.2 mole ratio; (5)- TSC (7 mM); (6) - AgNO3 (1 mM); NC (negative control), pure water sample; (b) Comparison between inhibition zones for different samples.
Our results confirm the higher antibacterial activity of smaller particles,
as previously observed by in other investigations, for instance [12, 37]. This effect can be explained by the theory which assigns the antibacterial effect to the AgNPs themselves [38], since smaller particles have a larger specific surface area, being able to stronger interact with the cell membrane [14], or

ANTIBACTERIAL ACTIVITY OF SILVER NANOPARTICLES OBTAINED BY CO-REDUCTION WITH …
81
maybe penetrate into the cell [1]. On the other hand, if the antibacterial effect were due to the Ag+ ions [13, 39], it is again the higher specific surface area which would guarantee a higher release of silver ions. To these reasoning we could add that for the diffusion in agar plates, which is slower than in liquid medium, smaller particles have a higher mobility, thus increasing the size of inhibition zones.
CONCLUSIONS The co-reduction of silver nitrate in aqueous solution with TSC and TA
proved to be a simple and rapid one-pot method to prepare AgNPs, with controlled size, from 30 to 10 nm, as shown by STEM and AFM images. The presence of elementary silver is evident form the UV-Vis spectra (characteristic SPR band) and from the EDX spectra and elements distribution maps. The antibacterial effect of the AgNPs was tested by measuring the inhibition zones on cultures of Escherichia coli. The effect was evident for all AgNPs samples, but the AgNPs with smallest size proved to be the most active. Thus AgNPs obtained by the investigated methods could be successfully used, as such or in association with antibiotics, against bacterial infections.
EXPERIMENTAL SECTION Synthesis of silver nanoparticles (AgNPs)
The reduction of silver nitrate with sodium citrate [40, 41] was achieved by boiling for 30 min, under continuous stirring, a mixture of 5 mL 1% trisodium citrate, TSC (Na3C6H5O7, high purity, above 99%, from Sigma Aldrich) aqueous solution with 125 mL 1 mM AgNO3 (from Merck, high purity above 99.5%). The mole ratio TSC/Ag was 1.55. The pale yellow solution obtained was cooled on an ice-water mixture at room temperature. The colloidal solution (Ag content 104 mg/L, 0.96 mM) kept in brown bottles at 4oC, was stable for at least 2 months
Tannic acid (TA) was also tested as reducing agent for AgNO3. The 10-2 M AgNO3 solution (10 mL) with 80 mL water was mixed with 10 mL 3.4% tannic acid (from Merck) solution (2•10-2 M) (molar ratio Ag/TA = 1:2) at room temperature and at boiling temperature. The yellow color due to the TA solution was intensified during the reaction, and shifted to brown, more intensely at high temperature. The resulting colloid solution had a silver content of 108 mg/L (1 mM).
S. RAPUNTEAN, R. BALINT, G.A. PALTINEAN, G. TOMOAIA, A. MOCANU, CS.-P RACZ, O. HOROVITZ, M. TOMOAIA-COTISEL
82
The co-reduction of silver nitrate with sodium citrate and tannic acid for variable Ag/TSC/TA mole ratios (Table 1) was performed [35, 36], by heating up the AgNO3 solution to boiling, and then adding the calculated amount of TSC and TA mixture. The solutions were kept boiling, under continuous stirring, for 15 min. The colloidal silver obtained by complete reduction of Ag+
to Ag was 1 mM in the Ag-TSC-TA for 1:7:2 mole ratio, and 0.25 mM for 1:7:0.2, 1:3:0.2 and 1:20:0.1 mole ratios.
Measurements and instrumentation
For UV-VIS absorption spectra measurements the Jasco UV/Vis V650 spectrophotometer was used, in the domain from 800 to 190 nm wavelength. Too intense colored solutions (containing TA or its oxidation products) had to be diluted with water before measurements.
STEM is a combined scanning electron (SE) and scanning transmission electron (TE ) microscope, Hitachi HD-2700, operating at a maximum accelerating voltage of 200 kV. STEM is equipped with energy-dispersive X-ray spectrometer (EDS), which has two EDX detectors, from Oxford Instruments. STEM-EDS equipment was also used for EDX elemental analysis.
Layers of AgNPs on glass support were prepared by vertical adsorption from the colloidal solutions for 10 s and dried in air. They were investigated by atomic force microscopy, AFM JEOL 4210 equipment, operated in tapping mode [42-48] using standard cantilevers with silicon nitride tips (resonant frequency in the range of 200-300 kHz and spring constant 17.5 N/m). On each film, areas from 10 μm x 10 μm up to 0.05 μm x 0.05 μm were scanned, and 2D- and 3D- topographies, phase and amplitude images and cross sections profiles in the adsorbed AgNPs layer were processed by the standard AFM procedures
Antibacterial assays. The bacterial strain tested was Escherichia coli ATCC 25922 (Gram negative bacteria), cultivated on glucose nutrient agar (Merck KGaA, Germany); suspensions in nutrient broth were prepared corresponding to a turbidity of 0.5 on the McFarland standards (1.5 x 10⁸
CFU/mL). The Kirby-Bauer technique [7] (disk diffusion assay) in nutrient agar
with glucose, was applied to evaluate the antimicrobial effect of the AgNPs solutions. On nutrient agar plates (3 mm thick, diameter 90 mm), the bacterial suspension was introduced and uniformly dispersed. After drying the agar surface, on each plate 6 wells (diameter 6 mm) in radial disposition and a central one were cut and in each 20 μL liquid samples were introduced, namely the four AgNPs dispersions obtained by reduction with TSC and TA (Table 1), TSC solution, 1 mM AgNO3 solution, and pure water as negative control in the
ANTIBACTERIAL ACTIVITY OF SILVER NANOPARTICLES OBTAINED BY CO-REDUCTION WITH …
83
central well. The plates were incubated for 24 h at 37oC, and after that the diameters of the inhibition zones formed around the samples were measured and photographed. The plates were kept under surveillance for another 72 h, in order to reveal possible changes in time. The antimicrobial effect of AgNPs was sustained on Escherichia coli ATCC 25922.
ACKNOWLEDGMENTS Authors acknowledge the financial support from Executive Unit for
Financing Higher Education, Research, Development and Innovation (UEFISCDI) through the project number 83.
R E F E R E N C E S
1. J.R. Morones, J.L. Elechiguerra, A. Camacho, K. Holt, J.B. Kouri, J.T. Ramırez, M. J. Yacaman, Nanotechnology, 2005, 16(10), 2346.
2. M. Rai, A. Yadav, A. Gade, Biotechnology Advances, 2009, 27(1), 76. 3. M.K. Rai, S.D. Deshmukh, A.P. Ingle, A.K. Gade, Journal of Applied. Microbiology,
2012, 112(5), 841. 4. M.J. Hajipour, K.M. Fromm, A.A. Ashkarran, D.J. de Aberasturi, I.R. de
Larramendi, T. Rojo, V. Serpooshan, W.J. Parak, M. Mahmoudi, Trends in Biotechnology, 2012, 30(10), 499.
5. S. Chernousova, M. Epple, Angewandte Chemie International Edition, 2013, 52(6), 1636.
6. A. Ravindran, P. Chandran, S. Sudheer Khan, Colloids and Surfaces B: Biointerfaces, 2013, 105, 342.
7. A. Mocanu, G. Furtos, S. Rapuntean, O. Horovitz, C. Flore, C. Garbo, A. Danisteanu, G. Rapuntean, C. Prejmerean, M. Tomoaia-Cotisel, Applied Surface Science, 2014, 298, 225.
8. G. Franci, A. Falanga, S. Galdiero, L. Palomba, M. Rai, G. Morelli, M. Galdiero, Molecules, 2015, 20(5), 8856.
9. B. Le Ouay, F. Stellacci, Nano Today, 2015, 10(3), 339. 10. N. Durán, G. Nakazato, A.B. Seabra, Applied Microbiology and Biotechnology,
2016, 100(15), 6555. 11. J.S. Möhler, W. Sim, M.A.T. Blaskovich, M.A. Cooper, Z.M. Ziora, Biotechnology
Advances, 2018, 36(5), 1391. 12. V. Pareek, R. Gupta, J. Panwar, Materials Science & Engineering C, 2018, 90,
739.
S. RAPUNTEAN, R. BALINT, G.A. PALTINEAN, G. TOMOAIA, A. MOCANU, CS.-P RACZ, O. HOROVITZ, M. TOMOAIA-COTISEL
84
13. R. Ma, C. Levard, S.M. Marinakos, Y. Cheng, J. Liu, F.M. Michel, G.E. Brown Jr, G.V. Lowry, Environmental Science & Technology, 2012, 46(2), 752.
14. J.J. Naddeo, M. Ratti, S.M. O’Malley, J.C. Griepenburg, D.M. Bubb, E.A. Klein, Advanced Science, Engineering and Medicine, 2015, 7(12), 1044.
15. U.T Khatoon, G.V.S. Nageswara Rao, K.M. Mohan, A. Ramanaviciene, A. Ramanavicius, Vacuum, 2017, 146, 259.
16. N.L. Pacioni, C.D. Borsarelli, V. Rey, A.V. Veglia, In „Silver Nanoparticle Applications in the Fabrication and Design of Medical and Biosensing Devices”, Springer, Switzerland, 2015, pp. 13-46.
17. K.S. Siddiqi, A. Husen, R.A.K. Rao, Journal of Nanobiotechnology, 2018, 16:14. https://doi.org/10.1186/s12951-018-0334-5
18. V. Chahar, B. Sharma, G. Shukla, A. Srivastava, A. Bhatnagar, Colloids and Surfaces A: Physicochemical and Engineering Aspects, 2018, 554, 149.
19. A. Mocanu, O. Horovitz, C.P. Racz, M. Tomoaia-Cotisel, Revue Roumaine de Chimie, 2015, 60(7-8), 721.
20. A.R. Shet, P. Ghose, L. Patil, V. Hombalimath, International Journal of Current Biotechnology, 2015, 3(2):1.
21. S. Aashritha, International Research Journal of Pharmacy, 2013, 4, 111. 22. Y. Hao, N. Zhang, J. Luo, X. Liu, NANO: Brief Reports and Reviews, 2018, 13
1850003, DOI: 10.1142/S1793292018500030. 23. A.L. Kubo, I. Capjak, I.V. Vrček, O.M. Bondarenko, I. Kurvet, H. Vija, A. Ivask, K.
Kasemets, A. Kahru, Colloids and Surfaces B: Biointerfaces, 2018, 170, 401. 24. T. Ahmad, Journal of Nanotechnology, 2014, Article ID 954206,
http://dx.doi.org/10.1155/2014/954206 25. M. Ocwieja, A. Popov, Z. Adamczyk, M. Morga, A. Ramanaviciene, A.
Ramanavicius, Colloids and Surfaces A: Physicochemical and Engineering Aspects, 2015, 477, 70.
26. P. Orlowski, M. Krzyzowska, R. Zdanowski, A. Winnicka, J. Nowakowska, W. Stankiewicz, E. Tomaszewska, G. Celichowski, J. Grobelny, Toxicology in Vitro, 2013, 27(6), 1798.
27. P. Orlowski, K. Soliwoda, E. Tomaszewska, K. Bien, A. Fruba, M. Gniadek, O. Labedz, Z. Nowak, G. Celichowski, J. Grobelny, M. Krzyzowska, Toxicology in Vitro, 2016, 35, 43.
28. P. Orlowski, M. Zmigrodzka, E. Tomaszewska, K. Ranoszek-Soliwoda, M. Czupryn, M. Antos-Bielska, J. Szemraj, G. Celichowski, J. Grobelny, M. Krzyzowska, International Journal of Nanomedicine, 2018, 13, 991.
29. S.K. Sivaraman, I. Elango, S. Kumar, V. Santhanam, Current Science, 2009, 97(7), 1055.
30. U.K. Parashar, V. Kumar, T. Bera, P.S. Saxena, G. Nath, S.K. Srivastava, R. Giri, A. Srivastava, Nanotechnology, 2011, 22(41), 415104.
31. I. Călinescu, M. Pătraşcu, A.I. Gavrilă, A. Trifan, C. Boscornea, U.P.B. Scientific Bulletin, Series B, 2011, 73(4), 1.
32. Y. Cao, R. Zheng, X Ji, H. Liu, R. Xie, W. Yang, Langmuir, 2014, 30(13), 3876. 33. K. Watcharaporn, M. Opaprakasit, V. Pimpan, Advanced Materials Research,
2014, 911, 110.
ANTIBACTERIAL ACTIVITY OF SILVER NANOPARTICLES OBTAINED BY CO-REDUCTION WITH …
85
34. T.Y. Kim, S.H. Cha, S. Cho, Y. Park, Archives of Pharmacal Research, 2016, 39, 465.
35. N.G. Bastus, F. Merkoci, J. Piella, V. Puntes, Chemistry of Materials, 2014, 26, 2836.
36. K. Ranoszek-Soliwoda, E. Tomaszewska, E. Socha, P. Krzyczmonik, A. Ignaczak, P. Orlowski, M. Krzyzowska, G. Celichowski, J. Grobelny, Journal of Nanoparticle Research, 2017, 19:273, DOI 10.1007/s11051-017-3973-9
37. M. Akter, M.T. Sikder, M.M. Rahman, A.K.M.A. Ullah, K.F.B. Hossain, S. Banik, T. Hosokawa, T. Saito, M. Kurasaki, Journal of Advanced Research, 2018, 9, 1.
38. S. Agnihotri, S. Mukherji, S. Mukherji, RSC Advances, 2014, 4, 3974. 39. Z. Xiu, Q. Zhang, H.L. Puppala, V.L. Colvin, P.J.J. Alvarez, Nano Letters, 2012,
12(8), 4271. 40. P.V. Kamat, M. Flumiani, G.V. Hartland, Journal of Physical Chemistry B, 1998,
102, 3123. 41. O. Horovitz, M. Tomoaia-Cotisel, C. Racz, G. Tomoaia, L.D. Bobos, A. Mocanu,
Studia Universitatis Babes-Bolyai, Chemia, 2009, 54(3), 89. 42. M. Tomoaia-Cotisel, A. Tomoaia-Cotisel, T. Yupsanis, G. Tomoaia, I. Balea, A.
Mocanu, C. Racz, Revue Roumaine de Chimie, 2006, 51(12), 1181. 43. G. Tomoaia, M. Tomoaia-Cotisel, A. Mocanu, O. Horovitz, L.D. Bobos, M. Crisan,
I. Petean, Journal of Optoelectronics and Advanced Materials, 2008, 10(4), 961. 44. G. Tomoaia, P.T. Frangopol, O. Horovitz, L.D. Bobos, A. Mocanu, M. Tomoaia-
Cotisel, Journal of Nanoscience and Nanotechnology, 2011, 11(9), 7762. 45. A. Mocanu, R.D. Pasca, G. Tomoaia, C. Garbo, P.T. Frangopol, O. Horovitz, M.
Tomoaia-Cotisel, International Journal of Nanomedicine, 2013, 8, 3867. 46. U.V. Zdrenghea, G. Tomoaia, D.V Pop-Toader, A. Mocanu, O. Horovitz, M.
Tomoaia-Cotisel, Combinatorial Chemistry & High Throughput Screening, 2011, 14(4), 237.
47. R.D. Pasca, A. Mocanu, S.C. Cobzac, I. Petean, O. Horovitz, M. Tomoaia-Cotisel, Particulate Science and Technology, 2014, 32(2), 131.
48. I. Petean, G. Tomoaia, O. Horovitz, A. Mocanu, M. Tomoaia-Cotisel, Journal of Optoelectronics and Advanced Materials, 2008, 10(9), 2289.


STUDIA UBB CHEMIA, LXIII, 3, 2018 (p. 87-94) (RECOMMENDED CITATION) DOI:10.24193/subbchem.2018.3.07
MICROWAVE IRRADIATION EFFECT ON POLYPHENOL CONTENT AND ANTIOXIDANT ACTIVITY OF BASIL
ILDIKO LUNGa, MARIA-LOREDANA SORANa*, OCSANA OPRIŞa, MANUELA STANa, CONSTANTIN BELEb
ABSTRACT. This study investigates the influence of microwave field derived from wireless router and mobile telephony sources on polyphenol content and antioxidant activity of basil. The total phenolic content of basil extracts was determined by Folin-Ciocalteu method. The amount of polyphenolic compounds in basil plants exposed to microwave irradiation was higher compared to control plants. Extracts of irradiated basil exhibit higher antioxidant activity than extracts of control plants, as evidenced by the three methods of determination used: 2,2-diphenylpicrylhydrazyl radical scavenging activity, oxygen radical absorbance capacity and Trolox equivalent antioxidant capacity assays. It was determined that microwave irradiation increased both antioxidant activity and polyphenol content of basil extracts. In addition, hydroalcoholic extracts obtained from basil plants exposed to GSM microwaves showed higher antioxidant activity than hydroalcoholic extracts of plants exposed to WLAN microwaves. Keywords: polyphenols, basil, microwave influence, antioxidant activity
INTRODUCTION The consumption of the phytochemical products/food supplements, in
special phenolic compounds is correlated with a series of beneficial effects in the body, such as reducing the risk of diabetes, obesity, coronary artery disease, cancer of the colon and gastrointestinal dysfunctions [1]. Because in plants phenolic compounds are found under different forms the extraction from plant material raises special problems [2, 3]. Currently the existing analyzes
a National Institute for Research and Development of Isotopic and Molecular Technologies, 67-
103 Donat str., RO-400293, Cluj-Napoca, Romania. b University of Agricultural Sciences and Veterinary Medicine, 3-5 Calea Manastur, RO-400372,
Cluj-Napoca, Romania. * Corresponding author [email protected]
ILDIKO LUNG, MARIA-L. SORAN, OCSANA OPRIŞ, MANUELA STAN, CONSTANTIN BELE
88
protocols appeals to classical techniques of liquid - solid extraction. Among these, the most commonly used are maceration, refluxing and Soxhlet extraction. Due to disadvantages that show they tend to be replaced by techniques with lower reagent consumption, lower energy and time, having however similar efficiency. For this purpose, have been implemented techniques such as ultrasound-assisted solvent extraction [4-6], microwave assisted solvent extraction [7], accelerated solvent extraction/pressurized liquid extraction carried out in dynamic and static mode [8] etc. Usually, for extraction of polyphenolic compounds must be performed an optimization [9] regarding the extraction system [10] solvent and plant material ratio, the effective time and extraction conditions, and each technique presenting specific parameters.
The obtained polyphenolic extract can be analyzed both globally - nonspecific, determining the total polyphenols and specific. In order to determine the total polyphenols, it is used spectrophotometric method, using specific reagents. There are two such reagents: Folin-Ciocalteu reagent and Arnow’s reagent [11-13]. The specific determination can be achieved through chromatographic methods, most used being high-performance liquid chromatography with diode array detector [10] or coupled with a mass spectrometer [14].
Basil is an important medicinal plant and a culinary herb from the Lamiaceae family, known for carminative, galactogogue, stomachic and antispasmodic properties used in folk medicine. It is also known for its anti-inflammatory, antiviral and antimicrobial activities [15].
Under various biotic and abiotic stresses, plants can respond to produce secondary metabolites such as phenolic compounds, terpenoids, and alkanoids [16, 17].
Currently, due to the technological development, there is an exponential growth in the use of mobile phones and wireless devices, thus leading to an increase of electromagnetic radiation level and the emergence of a new type of stress, the electromagnetic field, especially in the microwave range (1-100 GHz) [18, 19]. Numerous studies confirm that microwave radiation influences the living organisms, including plants, even at irradiation power under limits [20-22].
This manuscript reports the effect of the microwave field on polyphenolic content and antioxidant activity of basil. New results obtained by this work complete the study presented in our previous paper [23]. The basil was grown now in GSM and WLAN field. In this study, the grinding followed by centrifugation was used as extraction method instead of microwave assisted extraction. The antioxidant activity was determined and correlated with total polyphenol content.

MICROWAVE IRRADIATION EFFECT ON POLYPHENOL CONTENT AND ANTIOXIDANT ACTIVITY…
89
RESULTS AND DISCUSSION The basil seedlings were exposed to microwave radiation of GSM and
WLAN frequency bands. The effect on total phenolic content and antioxidant activity was studied for irradiated and control (non-irradiated) plant samples.
Determination of Total Phenolic Content In this work, the total polyphenol content of basil plants grown in the
presence of microwave field and in normal conditions was analysed by the conventional spectrophotometric Folin-Ciocalteu method (Figure 1).
Figure 1. Total polyphenol content expressed as gallic acid equivalents in basil.
The amount of polyphenolic compounds was expressed as mg gallic acid/g fresh weight (FW), using the linear equation of the standard calibration curve: y = 0.6687x + 0.007 (R2=0.9987). It was observed that in the case of microwave irradiated plants the polyphenolic amount was higher compared to the control plants. The highest polyphenol quantity was determined in basil irradiated with GSM frequency microwaves (10.23 mg GAE/g plant).
Total antioxidant activity Three antioxidant activity methods have been used to compare the
antioxidant activity of irradiated and reference basil plants. DPPH method is often used due to stability, simplicity and its reproducibility [24].
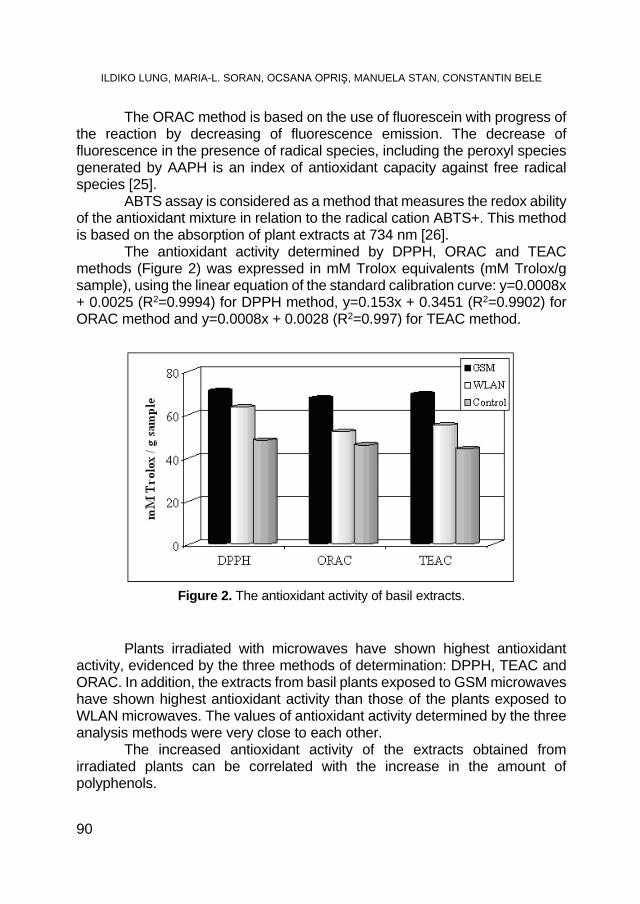
ILDIKO LUNG, MARIA-L. SORAN, OCSANA OPRIŞ, MANUELA STAN, CONSTANTIN BELE
90
The ORAC method is based on the use of fluorescein with progress of the reaction by decreasing of fluorescence emission. The decrease of fluorescence in the presence of radical species, including the peroxyl species generated by AAPH is an index of antioxidant capacity against free radical species [25].
ABTS assay is considered as a method that measures the redox ability of the antioxidant mixture in relation to the radical cation ABTS+. This method is based on the absorption of plant extracts at 734 nm [26].
The antioxidant activity determined by DPPH, ORAC and TEAC methods (Figure 2) was expressed in mM Trolox equivalents (mM Trolox/g sample), using the linear equation of the standard calibration curve: y=0.0008x + 0.0025 (R2=0.9994) for DPPH method, y=0.153x + 0.3451 (R2=0.9902) for ORAC method and y=0.0008x + 0.0028 (R2=0.997) for TEAC method.
Figure 2. The antioxidant activity of basil extracts.
Plants irradiated with microwaves have shown highest antioxidant activity, evidenced by the three methods of determination: DPPH, TEAC and ORAC. In addition, the extracts from basil plants exposed to GSM microwaves have shown highest antioxidant activity than those of the plants exposed to WLAN microwaves. The values of antioxidant activity determined by the three analysis methods were very close to each other.
The increased antioxidant activity of the extracts obtained from irradiated plants can be correlated with the increase in the amount of polyphenols.
MICROWAVE IRRADIATION EFFECT ON POLYPHENOL CONTENT AND ANTIOXIDANT ACTIVITY…
91
CONCLUSIONS The objective of the present study was to investigate the effect of low-
intensity microwave radiation on the total amount of polyphenols and antioxidant activity of basil. As result of our studies, microwave irradiation increased both antioxidant properties and polyphenol content of basil. Thus, the amount of total polyphenols in microwave irradiated plants increase with 33.73% (GSM) and 15.16% (WLAN) compared to control plants, respectively. In addition, the antioxidant activity was higher for the extracts obtained from GSM irradiated plants compared to WLAN.
EXPERIMENTAL SECTION Plant material The plant material used for the current experiment was basil, which
was primarily grown from seeds (ARO, Romania). Three weeks after sowing, the plants were placed in identical anechoic chambers [27]. Test (irradiated) and control plants were subjected to the same environment (humidity and temperature). Stimulation was performed with microwaves modulated by a specific generator in GSM frequency domain (860 - 910 MHz range) and WLAN communications protocol, in the 2.412 - 2.48 GHz frequency band. The irradiation was performed over two weeks, afterwards the plants were taken from the chambers and the vegetal material was extracted.
Chemical reagents 2,2’- Diphenyl – picrylhydrazyl (DPPH), 6 – hydroxy-2,5,7,8-
tetramethylchroman – 2 carboxylic acid (Trolox), fluorescein sodium salt, 2,2- azobis (2-amidinopropane) dihydrochloride (AAPH), 2,2’-azinobis(3-ethylbenzthiazoline-6-sulfonic acid) (ABTS), potassium persulfate, Folin-Ciocalteu reagent, gallic acid and anhydrous carbonate were employed from Sigma-Aldrich, Germany, while ethanol was purchased from Chimopar, Romania. All chemicals were of analytical grade.
Preparation of plant extracts One gram of fresh leaves was mortared with 1 g quartz sand after
which 25 mL of 80% ethanol was added. The mixture was stirred for 1 h at 4°C and then centrifuged at 10.000 rpm for 15 minutes. The supernatant was removed and the pellet was resumed with 5 mL 80% ethanol, stirred for 15 minutes and centrifuged following the same procedure. Supernatants have been finally combined. Each sample was extracted independently in triplicate and the analyses were performed in the same day. Each extract was performed in three parallel samples.
ILDIKO LUNG, MARIA-L. SORAN, OCSANA OPRIŞ, MANUELA STAN, CONSTANTIN BELE
92
Determination of Total Phenolic Content The total polyphenol content was spectrophotometrically determined,
using gallic acid as standard, according to the Folin-Ciocalteu method [28]. In a 10 mL volumetric flask to 1 mL of extract was added 5 mL of distilled water and 0.5 mL Folin-Ciocalteu reagent. After 3 min, 1.5 mL of sodium carbonate (5 g/L) was added and filled up to 10 mL with distilled water. Then, the samples were kept in a water bath at 50°C for 16 min. After cooling, their absorbances were read at 765 nm against distilled water as the blank, using a Shimadzu UV-160A spectrophotometer (Kyoto, Japan) with 1 cm optical path length quartz cuvette. All measurements were taken in triplicates and mean values were calculated.
The concentration of polyphenols in samples was derived from a standard curve of gallic acid ranging from 10 to 50 μg/mL (R2= 0.9996).
Evaluation of total antioxidant activity Antioxidant activity was investigated by three different in vitro
antioxidant methods: 2, 2-diphenylpicrylhydrazyl radical scavenging activity (DPPH), oxygen radical absorbance capacity (ORAC) and Trolox equivalent antioxidant capacity (TEAC) assays.
DPPH assay DPPH (80 μM) was dissolved in absolute ethanol (98%). The mixture
was vigorously stirred and allowed to perfecting for 10 minutes at room temperature. 96 well plates were filled with 40 μL samples and 250 μL radical solutions [29, 30]. The decrease of absorption for resulting solutions was monitored at 515 nm for 30 minutes. The results were expressed as mM Trolox / g plant.
ORAC assay AAPH (0.414 g) was dissolved in 10 mL of 75 mM phosphates buffer
(pH 7.4) to obtain a final concentration of 153 mM [31]. A stock solution of fluorescein (4 x 10⁻³M) was prepared in 75 mM phosphates buffer solution (pH = 7.4). For experimental measurements the exterior well plates were not used. These well plates were filled with 300 μL of water, while the interior well plates were used for the experimental measurements. Thus, were added 150 μL of the working solution of fluorescein sodium salt in each of the interior well plates. In the control well plates have been added 25 μL of phosphates buffer 75 mM. In the well plates for the standards were introduced 25 μL diluted Trolox and in the sample well plates 25 μL alcoholic extract of the analyzed samples. The samples were incubated for 30 min. for equilibration in the Synergy HT Multi-Detection Microplate TM reader device (Bioteck Instruments, Winooski, VT) at 37°C. Reactions were initiated by adding 25 μL AAPH solution. The fluorescence was measured by kinetic monitorization with data taken at each minute at 485 nm excitation filter, 20 nm bandpass, emission filters at 585 nm, 20 nm bandpass.
MICROWAVE IRRADIATION EFFECT ON POLYPHENOL CONTENT AND ANTIOXIDANT ACTIVITY…
93
TEAC assay ABTS stock solution was obtained by the reaction of 7 mM/L aqueous
solution and 2.45 mM/L potassium persulfate and a completion in the dark at room temperature for 12-16 h before use. The working solution of ABTS was obtained by ethanol dilution of the stock solution at absorption of 0.70 ± 0.02 AU at 734 nm, verified by Biotek Synergy HT spectrophotometer, USA. 17 μL of sample was added to 170 μL ABTS solution. The results were expressed as mM Trolox/g plant [25].
ACKNOWLEDGMENTS Financial assistance provided through the Ministry of Education and
Research of Romania (PN II Research Program, project 51-098 / 2007 and Human Resources program: project TE 76 / 2011) is gratefully acknowledged.
R E F E R E N C E S
1. K.A. Ross, T. Beta, S.D. Arntfield, Food Chemistry, 2009, 113, 336. 2. S. Nyiredy, Journal of Chromatography B, 2004, 812, 35. 3. P. Mattila, J.J. Kumpulainen, Journal of Agricultural and Food Chemistry, 2002,
50, 3660. 4. M. Kivilompolo, T. Hyotylainen, Journal of Chromatography A, 2009, 1216, 892. 5. R. Japon-Lujan, J.M. Luque-Rodriguez, M.D. Luque de Castro, Journal of
Chromatography A, 2006, 1108, 76. 6. R.M. Alonso-Salces, A. Barranco, E. Corta, L.A. Berrueta, B. Gallo, F. Vicente,
Talanta, 2005, 65, 654. 7. T.S. Ballard, P. Mallikarjunan, K. Zhou, S. O’Keefe, Food Chemistry, 2010, 120,
1185. 8. X. Jun, S. Deji, Z. Shou, L. Bingbing, L. Ye, Z. Rui, International Journal of
Pharmaceutics, 2009, 382, 139. 9. E.M. Silva, H. Rogez, Y. Larondelle, Separation and Purification Technology,
2007, 55, 381. 10. G.A. Akowuah, Z. Ismail, I. Norhayati, A. Sadikun, Food Chemistry, 2005, 93, 311. 11. S. Albu, E. Joyce, L. Paniwnyk, J.P. Lorimer, T.J. Mason, Ultrasonics
Sonochemistry, 2004, 11, 261. 12. R.J. Grubesic, J. Vukovic, D. Kremer, S. Vladimir-Knezevic, Journal of
Pharmaceutical and Biomedical Analysis, 2005, 39, 837.
ILDIKO LUNG, MARIA-L. SORAN, OCSANA OPRIŞ, MANUELA STAN, CONSTANTIN BELE
94
13. O. Yesil-Celiktas, P. Nartop, A. Gurel, E. Bedir, F. Vardar-Sukan, Journal of Plant Physiology, 2007, 164, 1536.
14. A. Figueirinha, A. Paranhos, J.J. Perez-Alonso, C. Santos-Buelga, M.T. Batista Food Chemistry, 2008, 110, 718.
15. M.T. Baratta, H.J.D. Dorman, S.G. Deans, A.C. Figueiredo, J.G. Barroso, G. Ruberto, Flavour and Fragrance Journal, 1998, 13, 234.
16. R.N. Bennett, R.M. Wallsgrove, New Phytologist, 1994, 127, 617. 17. D.K. Kliebenstein, Plant Cell & Environment, 2004, 27, 675. 18. A. Vashisth, S. Nagarajan, Bioelectromagnetics, 2008, 29, 571. 19. D. Roux, A. Vian, S. Girard, P. Bonnet, F. Paladian, E. Davies, G. Ledoigt Planta,
2008, 227, 883. 20. A. Vian, D. Roux, S. Girard, P. Bonnet, F. Paladian, E. Davies, G..Ledoigt, Plant
Signaling & Behavior, 2006, 1, 67. 21. W. Stankiewicz, M.P. Dabrowski, R. Kubacki, E. Sobiczewska, S. Szmigielski
Electromagnetic Biology and Medicine, 2006, 25, 45. 22. I. Lung, M.L. Soran, C. Tudoran, C. Marutoiu, Central European Journal of
Chemistry, 2013, 11, 535. 23. I. Lung, M.L. Soran, M. Stan, D. Podar, Advances in Research, 2013, 1, 1-10. 24. T. Katsube, H. Tabata, Y. Ohta, Y. Yamasaki, E. Anuurad, K. Shiwaku, Y. Yamane,
Journal of Agricultural and Food Chemistry, 2004, 52, 2391. 25. N. Pellegrini, M. Serafini, B. Colombi, D. Del Rio, S. Salvatore, M. Bianchi, F.
Brighenti, Journal of Nutrition, 2003, 133, 2812. 26. H.B. Li, C.C. Wong, K.W. Cheng, F. Chen, LWT - Food Science and Technology,
2008, 41, 385. 27. E. Surducan, V. Surducan, A. Halmagyi, “Process and installation for stimulating
plant development in microwaves field” Romanian Patent. RO 125068B1/2012. 28. K. Slinkard, V.L. Singleton, American Journal of Enology and Viticulture, 1977,
28, 49. 29. W. Brand-Williams, M.E. Cuvelier, C. Berset, LWT - Food Science and
Technology, 1995, 28, 25. 30. M.B. Arnao, A. Cano, J.F. Alcolea, M. Acosta, Phytochemical Analysis, 2001, 12,
138. 31. D. Huang, B. Ou, M. Hampsch-Woodill, J.A. Flanagan, R.L. Prior, Journal of
Agricultural and Food Chemistry, 2002, 50, 4437.
STUDIA UBB CHEMIA, LXIII, 3, 2018 (p. 95-116) (RECOMMENDED CITATION) DOI:10.24193/subbchem.2018.3.08
GUM ARABIC: AN OPTIMIZATION OF ULTRASONIC- ASSISTED EXTRACTION OF ANTIOXIDANT ACTIVITY
AHMED. A. M. ELNOURa b*, MOHAMED E. S. MIRGHANIa,c,*, NASSERELDIN A. KABBASHIa, MD Z. ALAMa
AND KHALID HAMID MUSAd
ABSTRACT. Gum Arabic (GA), also known as Acacia seyal gum (ASG), is a dried exudate from trees of Acacia senegal and Acacia seyal. It provides a rich source of non-viscous soluble fiber with significant health benefits and high antioxidant properties. Tonnes of raw GA are exported annually at a high cost with limited utilization in extraction form. Techniques for the extraction of the bioactive components of GA are available but the high extraction time and the capacity and quality of extraction hinders these procedures. Ultrasonic-assisted extraction is one of the most effective techniques for the recovery of antioxidant and phenolic compounds from ASG. A comparatively low extraction time has been reported for ultrasonication, but the influence of several extraction conditions such as temperature, time and ultrasonic power on the yield of extraction has not been thoroughly studied. This study investigates the optimal ultrasonic extraction conditions for maximum recovery of antioxidant and phenolic compounds from ASG using Response Surface Methodology (RSM) under the Central Composite Design (CCD). Three ultrasonic parameters, namely time in the range of (1-3 hours), power in the range of (1-3 level or 12 to 40 kHz) and temperature from (25-60 °C) were tested for their impact on antioxidant activity. The capacity of the extracts was determined by the scavenging activity of 1, 1-diphenyl-2-picrylhydrazyl (DPPH) radical, ferric reducing antioxidant power (FRAP) assay, and total phenolic compounds (TPC). The results indicated that ultrasonic time, power and temperature had a positive impact on antioxidant capacity and phenolic compounds. The optimum ultrasonic conditions were
a Bioenvironmental Engineering Research Centre (BERC), Biotechnology Engineering, Faculty
of Engineering, International Islamic University, Malaysia (IIUM), P. O. Box 10, Gombak. 50728 Kuala Lumpur, Malaysia.
b Department of Biochemistry & Gum Processing, Gum Arabic Research Centre, University of Kordofan, Box: 160. Elobied, Sudan
c International Institute for Halal Research and Training (INHART), IIUM, P. O. Box 10, Gombak. 50728 Kuala Lumpur, Malaysia.
d Department of Food Science and Human Nutrition College of Agriculture and Veterinary Medicine Qassim university, the kingdom of Saudi Arabia.
* Corresponding author: [email protected]
AHMED. A.M. ELNOUR, MOHAMED E.S. MIRGHANI, N.A. KABBASHI, MD Z. ALAM, KHALID H. MUSA
96
found to be a time of 3 hours, a power of 40 kHz, and a temperature of 42.50°C, under which, forty-eight bioactive compounds from the ASG extract were separated by Gas Chromatography coupled to Tandem Mass Spectrometry (GC-MS/MS).
Keywords: Acacia seyal gum, Bioactive compounds, Gum Arabic, Response Surface Methodology, Ultrasonication. INTRODUCTION Gum Arabic (GA) is an edible, dried, gummy biopolymer exudates
obtained from trees and branches of Acacia senegal and Acacia seyal. It grows predominantly in the African region of Sahel in Sudan. GA is one of the world’s major natural commodities of commerce and constitutes an important export commodity in countries such as Niger, Chad, Senegal, Nigeria, and especially Sudan which controls about 85% of the world’s export of GA [1]. Tones of GA are exported annually and has been estimated to the tune of US$ 40 million yearly over the last 20 years [1, 2]. Despite the fairly high prices, the supply of and demand for GA have declined steadily over the past few decades due to a number of reasons which bothers (aside from the uncontrollable natural phenomenon) on the regulatory policy to ensure food quality and safety of the raw gum[1, 3]. Strict international specification based on the microbiological and chemical characteristics of GA and similar products have been instituted to guarantee the identity, quality, and safety of the raw exudates. This poses several trade challenges. Gum Arabic (GA) produced by the traditional method exhibit high variability in microbiological quality. In its raw form, it is highly susceptible to bacteriological spoilage especially when stored in warehouses [1]. Traditional solutions to ensure that Gum Arabic reaches the end-user in good quality are expensive.
Spray-drying, for instance, which is a form of pasteurization of the gum through controlled exposure to high temperature, is an energy-intensive and costly procedure estimated at the US $1000 per ton [1]. Marketing GA to its end users is therefore costly, often requires a long chain of mediators, and mostly require further processing by its end users [4].
Chemically, GA is a complex mixture of macromolecules of different sizes and composition - mainly carbohydrates and proteins. It is rich in non-viscous soluble fibers with high dietary value, and also contains minerals like potassium, magnesium and calcium [5-8].GA antioxidant properties, nephroprotectant, and other effects have been highlighted in recent studies [9-11]. Its role in the metabolism of lipids [12, 13], and its positive effect in the
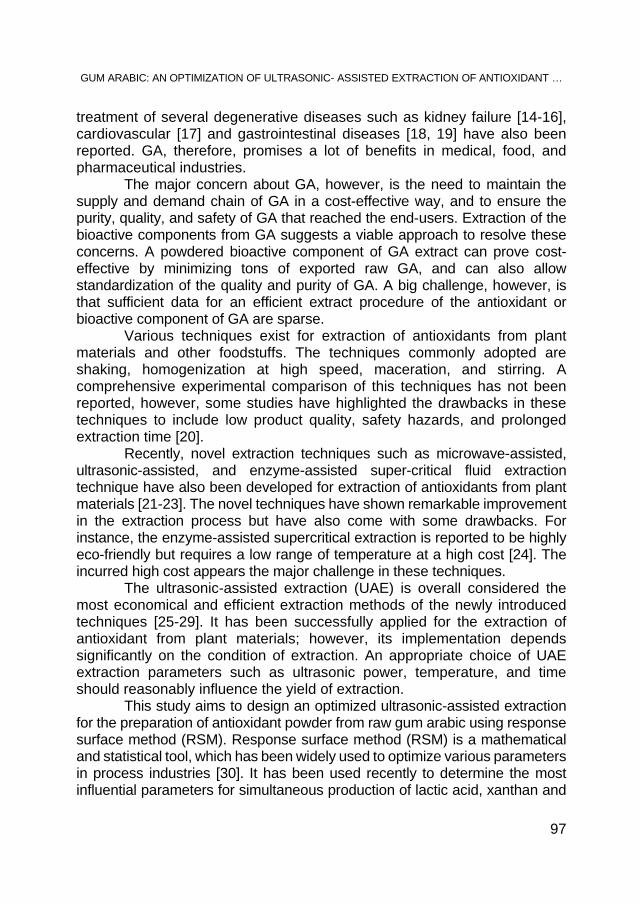
GUM ARABIC: AN OPTIMIZATION OF ULTRASONIC- ASSISTED EXTRACTION OF ANTIOXIDANT …
97
treatment of several degenerative diseases such as kidney failure [14-16], cardiovascular [17] and gastrointestinal diseases [18, 19] have also been reported. GA, therefore, promises a lot of benefits in medical, food, and pharmaceutical industries.
The major concern about GA, however, is the need to maintain the supply and demand chain of GA in a cost-effective way, and to ensure the purity, quality, and safety of GA that reached the end-users. Extraction of the bioactive components from GA suggests a viable approach to resolve these concerns. A powdered bioactive component of GA extract can prove cost-effective by minimizing tons of exported raw GA, and can also allow standardization of the quality and purity of GA. A big challenge, however, is that sufficient data for an efficient extract procedure of the antioxidant or bioactive component of GA are sparse.
Various techniques exist for extraction of antioxidants from plant materials and other foodstuffs. The techniques commonly adopted are shaking, homogenization at high speed, maceration, and stirring. A comprehensive experimental comparison of this techniques has not been reported, however, some studies have highlighted the drawbacks in these techniques to include low product quality, safety hazards, and prolonged extraction time [20].
Recently, novel extraction techniques such as microwave-assisted, ultrasonic-assisted, and enzyme-assisted super-critical fluid extraction technique have also been developed for extraction of antioxidants from plant materials [21-23]. The novel techniques have shown remarkable improvement in the extraction process but have also come with some drawbacks. For instance, the enzyme-assisted supercritical extraction is reported to be highly eco-friendly but requires a low range of temperature at a high cost [24]. The incurred high cost appears the major challenge in these techniques.
The ultrasonic-assisted extraction (UAE) is overall considered the most economical and efficient extraction methods of the newly introduced techniques [25-29]. It has been successfully applied for the extraction of antioxidant from plant materials; however, its implementation depends significantly on the condition of extraction. An appropriate choice of UAE extraction parameters such as ultrasonic power, temperature, and time should reasonably influence the yield of extraction.
This study aims to design an optimized ultrasonic-assisted extraction for the preparation of antioxidant powder from raw gum arabic using response surface method (RSM). Response surface method (RSM) is a mathematical and statistical tool, which has been widely used to optimize various parameters in process industries [30]. It has been used recently to determine the most influential parameters for simultaneous production of lactic acid, xanthan and
AHMED. A.M. ELNOUR, MOHAMED E.S. MIRGHANI, N.A. KABBASHI, MD Z. ALAM, KHALID H. MUSA
98
ethanol from molasses [31-34]. RSM can evaluate the impact of different multiple parameters, and simultaneously optimize experimental conditions [35-37]. Different RSM methods such as box–Behnken design (BBD), central composite design (CCD) and three-level full factorial designs (TFFD) have been used widely in various fields such as food, biology and chemistry. Although the CCD, which has been proven for its accurate fitness in different models and experiments, is more commonly adopted for RSM [32].
In this experimental study, UAE parameters namely power, time and temperature of extraction were optimized by RSM, adopting the central composite design (CCD), to obtain optimal extraction of total phenolic contents and antioxidant activity from ASG. To the best of the Authors’ knowledge, this is the first time the RSM has been deployed to optimize UAE parameters for optimal extraction of total phenolic compounds and antioxidant activity from GA. We also identified the composition of the extracts by GC-MS/MS and assessed the influence of ultrasound on the extraction efficiency and chemical compositions of the extracts.
RESULTS AND DISCUSSION FITTING THE MODEL Twenty experiments were conducted under different conditions of
ultrasonic extraction. Overall, the antioxidant activities or responses for the independent variables of ultrasonic-assisted extraction were recorded as shown in Table 1. The experiment labelled ‘8’ with a total ultrasonic extraction time of 3h, extraction power of 40kHz, and temperature of 60 ⁰C was found to produce the highest DPPH inhibition of 89.2%, FRAP of 26646 mg TE/100g DW, and total phenolic content (TPC) of 25145mg GAE/100g DW. In contrast, the experiment labelled ‘1’ with an extraction time of 1h, power of 12kHz, and temperature of 25 ⁰C produced the least responses with DPPH inhibition of 35.5%, FRAP of 6430 mg TE/100g DW and TPC of 4694 mg GAE/100g DW.
ANALYSIS OF VARIANCE In the prediction of optimized ultrasonic assisted extraction conditions
for the DPPH, FRAP and TPC assays, it is important to check the fitting of the RSM mathematical model to ensure its reliability. Different techniques for analysis of variance, such as lack of fit; R2; Predicted Residual Sum of Square (PRESS) for models; F-ratio; and Prob > F methods were analyzed to identify the fitting of the RSM mathematical models. “Lack of fit” assesses the model for appropriate effects when the test is conducted. R2 estimates the proportion of

GUM ARABIC: AN OPTIMIZATION OF ULTRASONIC- ASSISTED EXTRACTION OF ANTIOXIDANT …
99
variation in the response that can be attributed to the model rather than to random errors. An R2 value near 1 indicates that the model is a good predictor of the response. PRESS shows how well the predictive model fits each point in the design. The F-ratio indicates whether the model differs significantly from a model where all predicted values are the response mean. Prob > F measures the probability of obtaining an F-ratio as large as what is observed, given that all parameters except the intercept are zero. Small values of Prob > F indicate that the observed F-ratio is unlikely. Such values are considered evidence that there is at least one significant effect in the model [30].
Table 1. Antioxidant activities, of the extract of A. seyal gum under different conditions of ultrasonic-assisted extraction based on a central composite design
(CCD) for response surface analysis.
Run
Extraction Condition Analytical results
X2 Extraction time (hours)
X2 Extraction power (kHz)
X2 Extraction Temperature
(⁰C) DPPH
(Inhibition %)
Antioxidant Activity
FRAP (mg TE/100g
DW)
Total phenolic
Content (mg GAE/100g
DW) 1 1 (-1) 12 (-1) 25 (-1) 35.5 6430 4694 2 3 (1) 12 (-1) 25 (-1) 43.2 7607 5876 3 1 (-1) 40 (1) 25 (-1) 46.8 8254 5862 4 3 (1) 40 (1) 25 (-1) 57.2 17183 11798 5 1 (-1) 12 (-1) 60 (1) 58.4 10298 6770 6 3 (1) 12 (-1) 60 (1) 83.3 26646 18307 7 1 (-1) 40 (1) 60 (1) 56.5 11369 8963 8 3 (1) 40 (1) 60 (1) 89.2 26646 25145 9 1 (-1.68179) 26 (0) 42.5 (0) 55.4 9860 7406 10 3 (1.68179) 26 (0) 42.5 (0) 70.7 17451 12768 11 2 (0) 12 (-1.68179) 42.5 (0) 78.2 15740 12201 12 2 (0) 40 (1.68179) 42.5 (0) 80.9 14592 12194 13 2 (0) 26 (0) 25 (-1.68179) 81.5 13452 10814 14 2 (0) 26 (0) 60 (1.68179) 86.2 24995 17413 15 2 (0) 26 (0) 42.5 (0) 56.6 23141 15575 16 2 (0) 26 (0) 42.5 (0) 79.9 18560 13622 17 2 (0) 26 (0) 42.5 (0) 83.4 19887 13704 18 2 (0) 26 (0) 42.5 (0) 83.9 17380 13342 19 2 (0) 26 (0) 42.5 (0) 79.7 19158 13745 20 2 (0) 26 (0) 42.5 (0) 55.3 16503 12133 * All results are the means ± SD (n = 3).
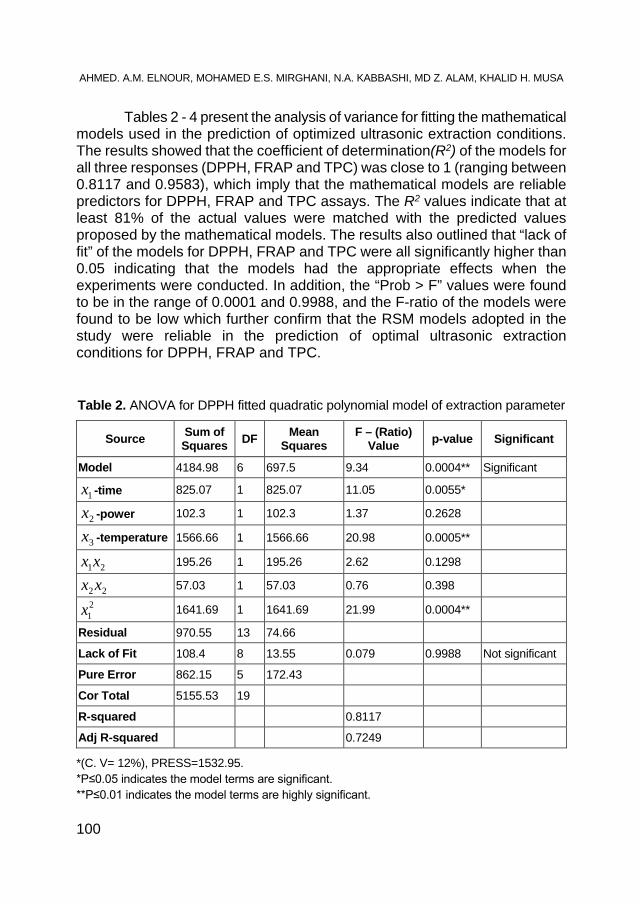
AHMED. A.M. ELNOUR, MOHAMED E.S. MIRGHANI, N.A. KABBASHI, MD Z. ALAM, KHALID H. MUSA
100
Tables 2 - 4 present the analysis of variance for fitting the mathematical models used in the prediction of optimized ultrasonic extraction conditions. The results showed that the coefficient of determination(R2) of the models for all three responses (DPPH, FRAP and TPC) was close to 1 (ranging between 0.8117 and 0.9583), which imply that the mathematical models are reliable predictors for DPPH, FRAP and TPC assays. The R2 values indicate that at least 81% of the actual values were matched with the predicted values proposed by the mathematical models. The results also outlined that “lack of fit” of the models for DPPH, FRAP and TPC were all significantly higher than 0.05 indicating that the models had the appropriate effects when the experiments were conducted. In addition, the “Prob > F” values were found to be in the range of 0.0001 and 0.9988, and the F-ratio of the models were found to be low which further confirm that the RSM models adopted in the study were reliable in the prediction of optimal ultrasonic extraction conditions for DPPH, FRAP and TPC. Table 2. ANOVA for DPPH fitted quadratic polynomial model of extraction parameter
Source Sum of Squares DF Mean
Squares F – (Ratio)
Value p-value Significant
Model 4184.98 6 697.5 9.34 0.0004** Significant
1x -time 825.07 1 825.07 11.05 0.0055*
2x -power 102.3 1 102.3 1.37 0.2628
3x -temperature 1566.66 1 1566.66 20.98 0.0005**
21xx 195.26 1 195.26 2.62 0.1298
22xx 57.03 1 57.03 0.76 0.398 21x 1641.69 1 1641.69 21.99 0.0004**
Residual 970.55 13 74.66
Lack of Fit 108.4 8 13.55 0.079 0.9988 Not significant
Pure Error 862.15 5 172.43
Cor Total 5155.53 19
R-squared 0.8117
Adj R-squared 0.7249
*(C. V= 12%), PRESS=1532.95. *P≤0.05 indicates the model terms are significant. **P≤0.01 indicates the model terms are highly significant.

GUM ARABIC: AN OPTIMIZATION OF ULTRASONIC- ASSISTED EXTRACTION OF ANTIOXIDANT …
101
THE DPPH RESPONSE SURFACE ANALYSIS OF ANTIOXIDANT ACTIVITY
The effects of factors such as extraction time, power, and temperature, denoted 1x , 2x and 3x respectively in equation (3) were carefully studied. The significance of each coefficient was determined by F-values and p-values. The regression equation in coded level, neglecting insignificant terms, was generated as:
)3(16.1867.294.499.1120.308.978.77%
21
3231321
xxxxxxxxDPPH
−
−+++++=
Results indicated that the quadratic relationship between the DPPH
inhibition and extraction factors have a good regression coefficient (R2= 0.8117). Higher F-value with lower p-value always led to more significant correspondence amongst the independent variables. The terms 1x , 2x , 3x
31xx and 21x were significant with a p-value less than 0.05. However, 1x , 2x and
23
22 xx , were not significant due to a higher p-value (i.e. higher than 0.05).
Figure 1 showed the complex interaction between time, temperature, and extraction power. The highest anti-scavenging activity (DPPH) was observed at both higher time of extraction and lower temperature (see Figure 1A). However, the increase in temperature at a fixed extraction time led to an increase in the extraction of antioxidant activity using DPPH assay. The extraction reached a maximum but at the lowest temperature tested. Figure 1B showed the interaction between the temperature and time of extraction on the antioxidant scavenging (DPPH %). An increase in the antioxidant activity was noticed as the extraction temperature increased up to 60 ⁰C, but decreased thereafter. A significant increase in the antioxidant capacity was also observed at high ultrasonic power. However, the trend was reversed as the ultrasonic power reached the third level at 40 kHz (see Fig 1C). High temperature might decrease the antioxidants activity due to the increase of thermal effect or due to degradation of bioactive compounds. High temperatures degrade phenolic compounds, leading to a reduction in the antioxidants [32, 38, 39].
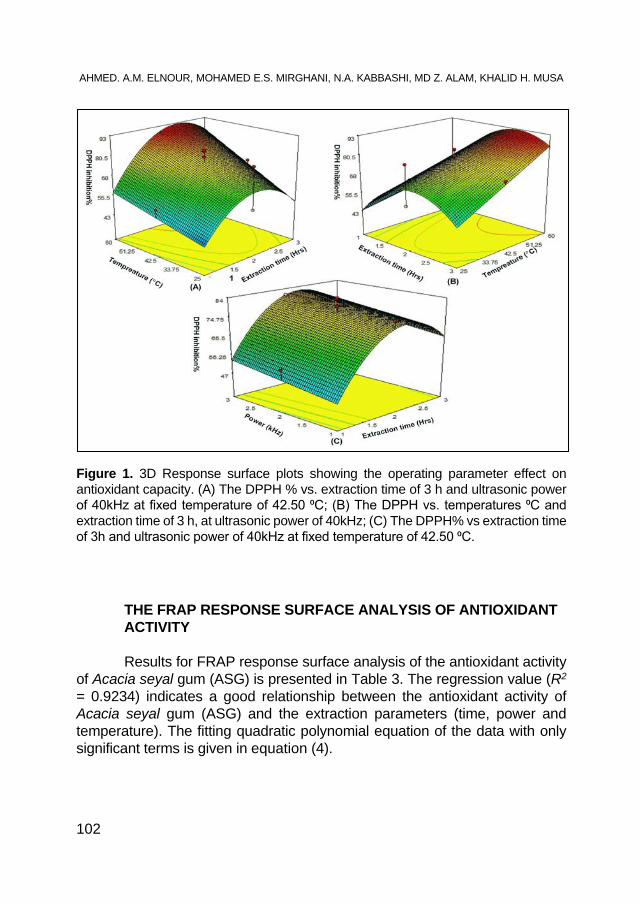
AHMED. A.M. ELNOUR, MOHAMED E.S. MIRGHANI, N.A. KABBASHI, MD Z. ALAM, KHALID H. MUSA
102
Figure 1. 3D Response surface plots showing the operating parameter effect on antioxidant capacity. (A) The DPPH % vs. extraction time of 3 h and ultrasonic power of 40kHz at fixed temperature of 42.50 ⁰C; (B) The DPPH vs. temperatures ⁰C and extraction time of 3 h, at ultrasonic power of 40kHz; (C) The DPPH% vs extraction time of 3h and ultrasonic power of 40kHz at fixed temperature of 42.50 ⁰C.
THE FRAP RESPONSE SURFACE ANALYSIS OF ANTIOXIDANT ACTIVITY Results for FRAP response surface analysis of the antioxidant activity
of Acacia seyal gum (ASG) is presented in Table 3. The regression value (R2 = 0.9234) indicates a good relationship between the antioxidant activity of Acacia seyal gum (ASG) and the extraction parameters (time, power and temperature). The fitting quadratic polynomial equation of the data with only significant terms is given in equation (4).
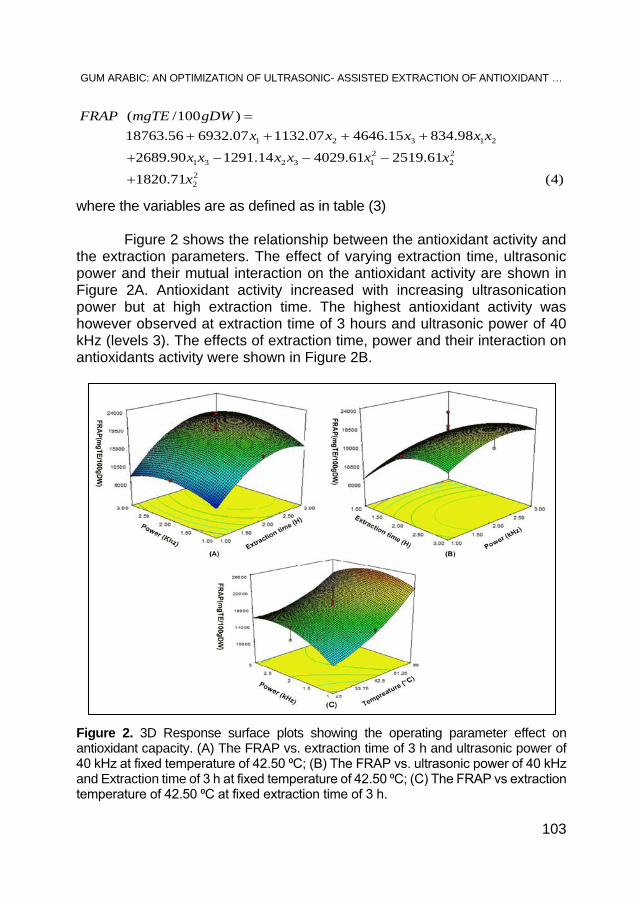
GUM ARABIC: AN OPTIMIZATION OF ULTRASONIC- ASSISTED EXTRACTION OF ANTIOXIDANT …
103
)4(71.182061.251961.402914.129190.2689
98.83415.464607.113207.693256.18763)100/(
22
22
213231
21321
xxxxxxx
xxxxxgDWmgTEFRAP
+
−−−+
++++=
where the variables are as defined as in table (3) Figure 2 shows the relationship between the antioxidant activity and
the extraction parameters. The effect of varying extraction time, ultrasonic power and their mutual interaction on the antioxidant activity are shown in Figure 2A. Antioxidant activity increased with increasing ultrasonication power but at high extraction time. The highest antioxidant activity was however observed at extraction time of 3 hours and ultrasonic power of 40 kHz (levels 3). The effects of extraction time, power and their interaction on antioxidants activity were shown in Figure 2B.
Figure 2. 3D Response surface plots showing the operating parameter effect on antioxidant capacity. (A) The FRAP vs. extraction time of 3 h and ultrasonic power of 40 kHz at fixed temperature of 42.50 ⁰C; (B) The FRAP vs. ultrasonic power of 40 kHz and Extraction time of 3 h at fixed temperature of 42.50 ⁰C; (C) The FRAP vs extraction temperature of 42.50 ⁰C at fixed extraction time of 3 h.
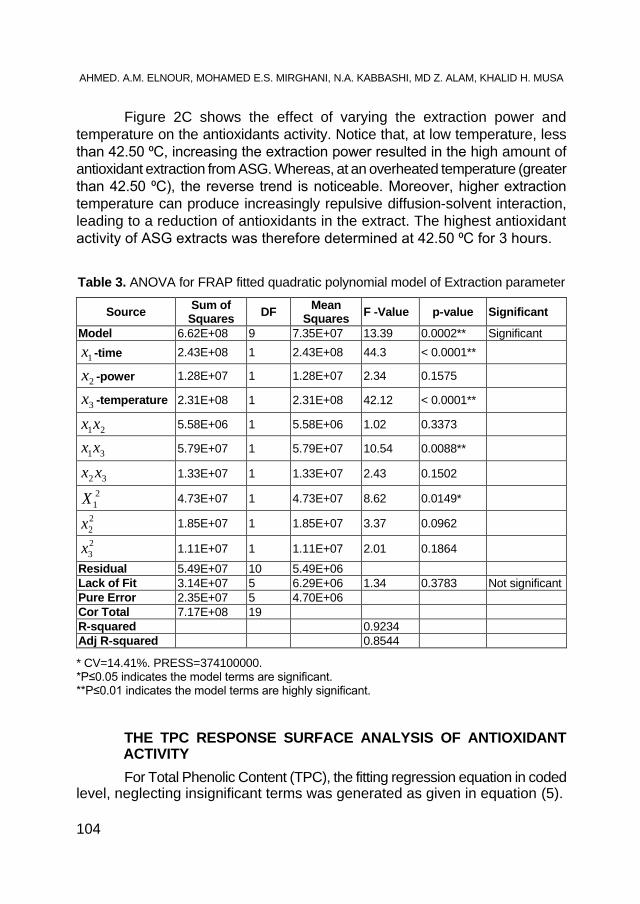
AHMED. A.M. ELNOUR, MOHAMED E.S. MIRGHANI, N.A. KABBASHI, MD Z. ALAM, KHALID H. MUSA
104
Figure 2C shows the effect of varying the extraction power and temperature on the antioxidants activity. Notice that, at low temperature, less than 42.50 ⁰C, increasing the extraction power resulted in the high amount of antioxidant extraction from ASG. Whereas, at an overheated temperature (greater than 42.50 ⁰C), the reverse trend is noticeable. Moreover, higher extraction temperature can produce increasingly repulsive diffusion-solvent interaction, leading to a reduction of antioxidants in the extract. The highest antioxidant activity of ASG extracts was therefore determined at 42.50 ⁰C for 3 hours.
Table 3. ANOVA for FRAP fitted quadratic polynomial model of Extraction parameter
* CV=14.41%. PRESS=374100000. *P≤0.05 indicates the model terms are significant. **P≤0.01 indicates the model terms are highly significant.
THE TPC RESPONSE SURFACE ANALYSIS OF ANTIOXIDANT ACTIVITY
For Total Phenolic Content (TPC), the fitting regression equation in coded level, neglecting insignificant terms was generated as given in equation (5).
Source Sum of Squares DF Mean
Squares F -Value p-value Significant Model 6.62E+08 9 7.35E+07 13.39 0.0002** Significant
1x -time 2.43E+08 1 2.43E+08 44.3 < 0.0001**
2x -power 1.28E+07 1 1.28E+07 2.34 0.1575
3x -temperature 2.31E+08 1 2.31E+08 42.12 < 0.0001**
21xx 5.58E+06 1 5.58E+06 1.02 0.3373
31xx 5.79E+07 1 5.79E+07 10.54 0.0088**
32 xx 1.33E+07 1 1.33E+07 2.43 0.1502 2
1X 4.73E+07 1 4.73E+07 8.62 0.0149* 22x 1.85E+07 1 1.85E+07 3.37 0.0962 23x 1.11E+07 1 1.11E+07 2.01 0.1864
Residual 5.49E+07 10 5.49E+06 Lack of Fit 3.14E+07 5 6.29E+06 1.34 0.3783 Not significant Pure Error 2.35E+07 5 4.70E+06 Cor Total 7.17E+08 19 R-squared 0.9234 Adj R-squared 0.8544

GUM ARABIC: AN OPTIMIZATION OF ULTRASONIC- ASSISTED EXTRACTION OF ANTIOXIDANT …
105
)5(29.131629.131664.101830.312914.257586.117468.367134.161118.401906.13650
)100/(
23
221
3132321
xxxxxxxxxx
gDWmgGAETPC
++−−
++++++=
Where; the variables are as defined as in Table (4). Results from experimentation (see, Table 4) indicate that the quadratic
relationship between TPC and the extraction factors have a good regression coefficient ( 2R = 0.8117). Terms with 21xx and 2
1x were not significant due to a higher p-value (i.e. higher than 0.05) and were eliminated. Figure 3 shows the plot of the complex interaction between extraction time, ultrasonication power, and extraction temperature.
Figure 3. 3D response surface plots showing the operating parameter effect on antioxidant capacity. (A) The TPC (mg GAE/100g DW) vs. extraction time of 3 h and Ultrasonic power of 40kHz at fixed temperature of 42.50 ⁰C;(B) The TPC (mg GAE/100g DW) vs. ultrasonic power of 40kHz and extraction time of 3 h at fixed temperature of 42.50 ⁰C; (C) The TPC (mg GAE/100g DW) vs extraction temperature 42.50 ⁰C and ultrasonic power of 48kHz at fixed extraction time of 3h.
The highest total phenolic contents were observed at higher extraction
time and ultrasonication power as shown in Figure 3A. Increase in both ultrasonication power and extraction time under a fixed temperature resulted in an increase in the total phenolic contents. However, a maximum is reached at the lowest extraction temperature in the range of temperature studied.
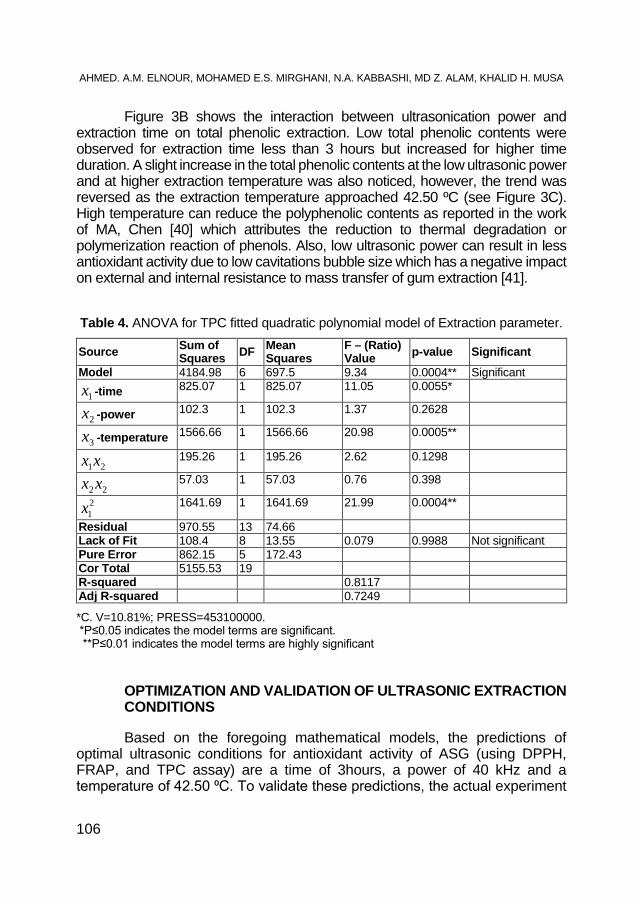
AHMED. A.M. ELNOUR, MOHAMED E.S. MIRGHANI, N.A. KABBASHI, MD Z. ALAM, KHALID H. MUSA
106
Figure 3B shows the interaction between ultrasonication power and extraction time on total phenolic extraction. Low total phenolic contents were observed for extraction time less than 3 hours but increased for higher time duration. A slight increase in the total phenolic contents at the low ultrasonic power and at higher extraction temperature was also noticed, however, the trend was reversed as the extraction temperature approached 42.50 ºC (see Figure 3C). High temperature can reduce the polyphenolic contents as reported in the work of MA, Chen [40] which attributes the reduction to thermal degradation or polymerization reaction of phenols. Also, low ultrasonic power can result in less antioxidant activity due to low cavitations bubble size which has a negative impact on external and internal resistance to mass transfer of gum extraction [41].
Table 4. ANOVA for TPC fitted quadratic polynomial model of Extraction parameter.
*C. V=10.81%; PRESS=453100000. *P≤0.05 indicates the model terms are significant. **P≤0.01 indicates the model terms are highly significant
OPTIMIZATION AND VALIDATION OF ULTRASONIC EXTRACTION CONDITIONS Based on the foregoing mathematical models, the predictions of
optimal ultrasonic conditions for antioxidant activity of ASG (using DPPH, FRAP, and TPC assay) are a time of 3hours, a power of 40 kHz and a temperature of 42.50 ⁰C. To validate these predictions, the actual experiment
Source Sum of Squares DF Mean
Squares F – (Ratio) Value p-value Significant
Model 4184.98 6 697.5 9.34 0.0004** Significant
1x -time 825.07 1 825.07 11.05 0.0055*
2x -power 102.3 1 102.3 1.37 0.2628
3x -temperature 1566.66 1 1566.66 20.98 0.0005**
21xx 195.26 1 195.26 2.62 0.1298
22 xx 57.03 1 57.03 0.76 0.398
21x 1641.69 1 1641.69 21.99 0.0004**
Residual 970.55 13 74.66 Lack of Fit 108.4 8 13.55 0.079 0.9988 Not significant Pure Error 862.15 5 172.43 Cor Total 5155.53 19 R-squared 0.8117 Adj R-squared 0.7249
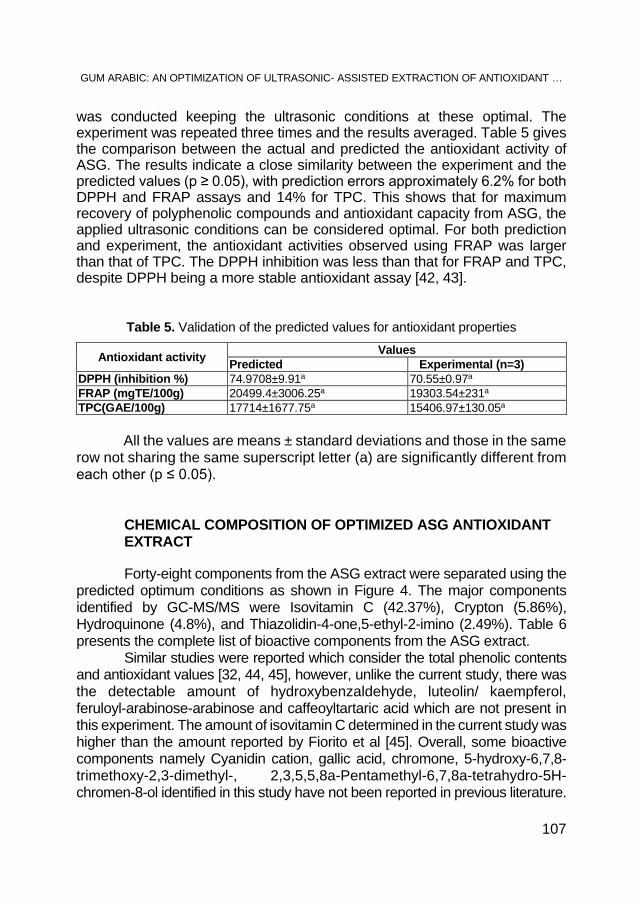
GUM ARABIC: AN OPTIMIZATION OF ULTRASONIC- ASSISTED EXTRACTION OF ANTIOXIDANT …
107
was conducted keeping the ultrasonic conditions at these optimal. The experiment was repeated three times and the results averaged. Table 5 gives the comparison between the actual and predicted the antioxidant activity of ASG. The results indicate a close similarity between the experiment and the predicted values (p ≥ 0.05), with prediction errors approximately 6.2% for both DPPH and FRAP assays and 14% for TPC. This shows that for maximum recovery of polyphenolic compounds and antioxidant capacity from ASG, the applied ultrasonic conditions can be considered optimal. For both prediction and experiment, the antioxidant activities observed using FRAP was larger than that of TPC. The DPPH inhibition was less than that for FRAP and TPC, despite DPPH being a more stable antioxidant assay [42, 43].
Table 5. Validation of the predicted values for antioxidant properties
Antioxidant activity Values Predicted Experimental (n=3)
DPPH (inhibition %) 74.9708±9.91a 70.55±0.97a FRAP (mgTE/100g) 20499.4±3006.25a 19303.54±231a TPC(GAE/100g) 17714±1677.75a 15406.97±130.05a
All the values are means ± standard deviations and those in the same row not sharing the same superscript letter (a) are significantly different from each other (p ≤ 0.05).
CHEMICAL COMPOSITION OF OPTIMIZED ASG ANTIOXIDANT EXTRACT Forty-eight components from the ASG extract were separated using the
predicted optimum conditions as shown in Figure 4. The major components identified by GC-MS/MS were Isovitamin C (42.37%), Crypton (5.86%), Hydroquinone (4.8%), and Thiazolidin-4-one,5-ethyl-2-imino (2.49%). Table 6 presents the complete list of bioactive components from the ASG extract.
Similar studies were reported which consider the total phenolic contents and antioxidant values [32, 44, 45], however, unlike the current study, there was the detectable amount of hydroxybenzaldehyde, luteolin/ kaempferol, feruloyl-arabinose-arabinose and caffeoyltartaric acid which are not present in this experiment. The amount of isovitamin C determined in the current study was higher than the amount reported by Fiorito et al [45]. Overall, some bioactive components namely Cyanidin cation, gallic acid, chromone, 5-hydroxy-6,7,8-trimethoxy-2,3-dimethyl-, 2,3,5,5,8a-Pentamethyl-6,7,8a-tetrahydro-5H-chromen-8-ol identified in this study have not been reported in previous literature.
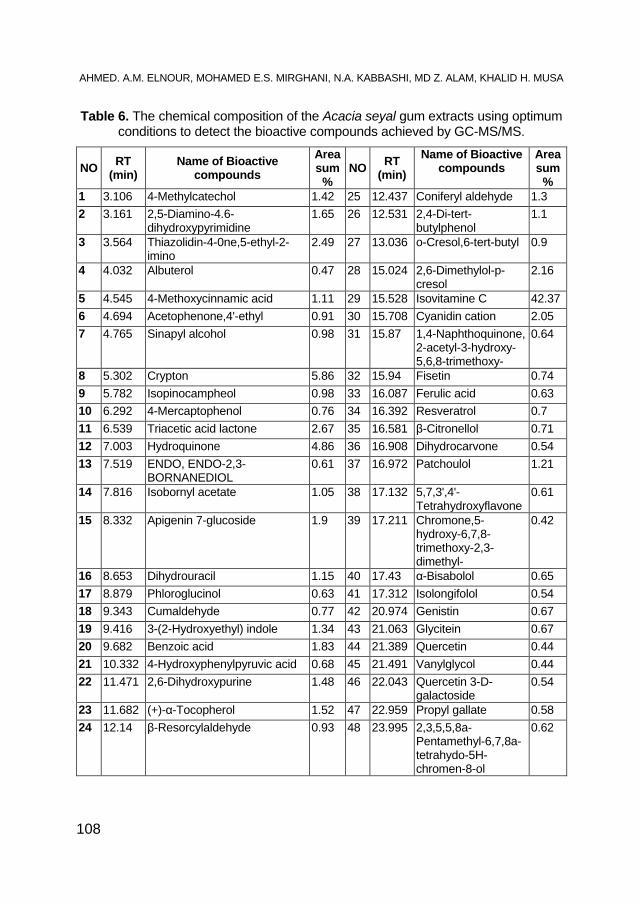
AHMED. A.M. ELNOUR, MOHAMED E.S. MIRGHANI, N.A. KABBASHI, MD Z. ALAM, KHALID H. MUSA
108
Table 6. The chemical composition of the Acacia seyal gum extracts using optimum conditions to detect the bioactive compounds achieved by GC-MS/MS.
NO RT (min)
Name of Bioactive compounds
Area sum
% NO RT
(min) Name of Bioactive
compounds Area sum
% 1 3.106 4-Methylcatechol 1.42 25 12.437 Coniferyl aldehyde 1.3 2 3.161 2,5-Diamino-4.6-
dihydroxypyrimidine 1.65 26 12.531 2,4-Di-tert-
butylphenol 1.1
3 3.564 Thiazolidin-4-0ne,5-ethyl-2-imino
2.49 27 13.036 o-Cresol,6-tert-butyl 0.9
4 4.032 Albuterol 0.47 28 15.024 2,6-Dimethylol-p-cresol
2.16
5 4.545 4-Methoxycinnamic acid 1.11 29 15.528 Isovitamine C 42.37 6 4.694 Acetophenone,4'-ethyl 0.91 30 15.708 Cyanidin cation 2.05 7 4.765 Sinapyl alcohol 0.98 31 15.87 1,4-Naphthoquinone,
2-acetyl-3-hydroxy-5,6,8-trimethoxy-
0.64
8 5.302 Crypton 5.86 32 15.94 Fisetin 0.74 9 5.782 Isopinocampheol 0.98 33 16.087 Ferulic acid 0.63 10 6.292 4-Mercaptophenol 0.76 34 16.392 Resveratrol 0.7 11 6.539 Triacetic acid lactone 2.67 35 16.581 β-Citronellol 0.71 12 7.003 Hydroquinone 4.86 36 16.908 Dihydrocarvone 0.54 13 7.519 ENDO, ENDO-2,3-
BORNANEDIOL 0.61 37 16.972 Patchoulol 1.21
14 7.816 Isobornyl acetate 1.05 38 17.132 5,7,3',4'-Tetrahydroxyflavone
0.61
15 8.332 Apigenin 7-glucoside 1.9 39 17.211 Chromone,5-hydroxy-6,7,8-trimethoxy-2,3-dimethyl-
0.42
16 8.653 Dihydrouracil 1.15 40 17.43 α-Bisabolol 0.65 17 8.879 Phloroglucinol 0.63 41 17.312 Isolongifolol 0.54 18 9.343 Cumaldehyde 0.77 42 20.974 Genistin 0.67 19 9.416 3-(2-Hydroxyethyl) indole 1.34 43 21.063 Glycitein 0.67 20 9.682 Benzoic acid 1.83 44 21.389 Quercetin 0.44 21 10.332 4-Hydroxyphenylpyruvic acid 0.68 45 21.491 Vanylglycol 0.44 22 11.471 2,6-Dihydroxypurine 1.48 46 22.043 Quercetin 3-D-
galactoside 0.54
23 11.682 (+)-α-Tocopherol 1.52 47 22.959 Propyl gallate 0.58 24 12.14 β-Resorcylaldehyde 0.93 48 23.995 2,3,5,5,8a-
Pentamethyl-6,7,8a-tetrahydo-5H-chromen-8-ol
0.62
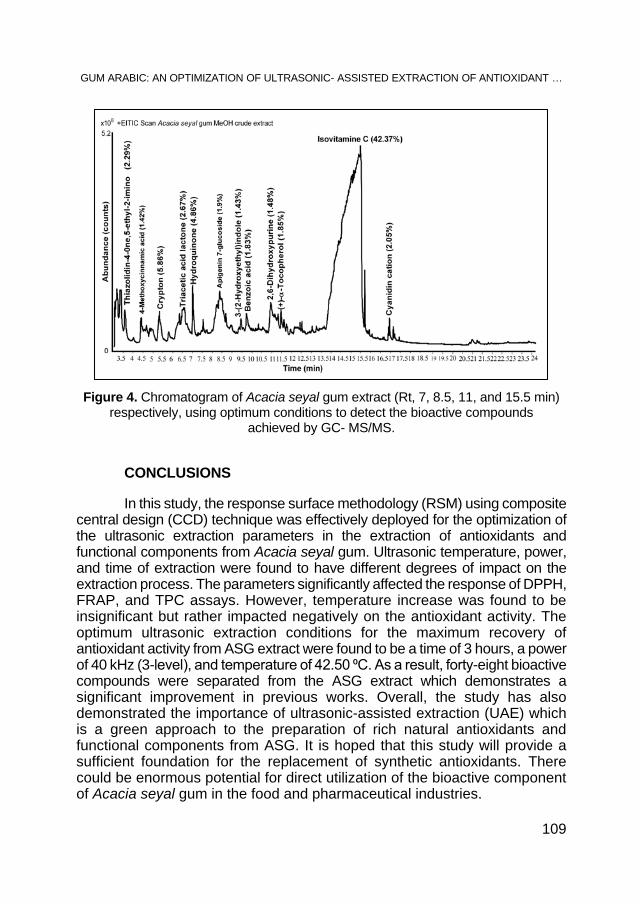
GUM ARABIC: AN OPTIMIZATION OF ULTRASONIC- ASSISTED EXTRACTION OF ANTIOXIDANT …
109
Figure 4. Chromatogram of Acacia seyal gum extract (Rt, 7, 8.5, 11, and 15.5 min) respectively, using optimum conditions to detect the bioactive compounds
achieved by GC- MS/MS. CONCLUSIONS In this study, the response surface methodology (RSM) using composite
central design (CCD) technique was effectively deployed for the optimization of the ultrasonic extraction parameters in the extraction of antioxidants and functional components from Acacia seyal gum. Ultrasonic temperature, power, and time of extraction were found to have different degrees of impact on the extraction process. The parameters significantly affected the response of DPPH, FRAP, and TPC assays. However, temperature increase was found to be insignificant but rather impacted negatively on the antioxidant activity. The optimum ultrasonic extraction conditions for the maximum recovery of antioxidant activity from ASG extract were found to be a time of 3 hours, a power of 40 kHz (3-level), and temperature of 42.50 ⁰C. As a result, forty-eight bioactive compounds were separated from the ASG extract which demonstrates a significant improvement in previous works. Overall, the study has also demonstrated the importance of ultrasonic-assisted extraction (UAE) which is a green approach to the preparation of rich natural antioxidants and functional components from ASG. It is hoped that this study will provide a sufficient foundation for the replacement of synthetic antioxidants. There could be enormous potential for direct utilization of the bioactive component of Acacia seyal gum in the food and pharmaceutical industries.
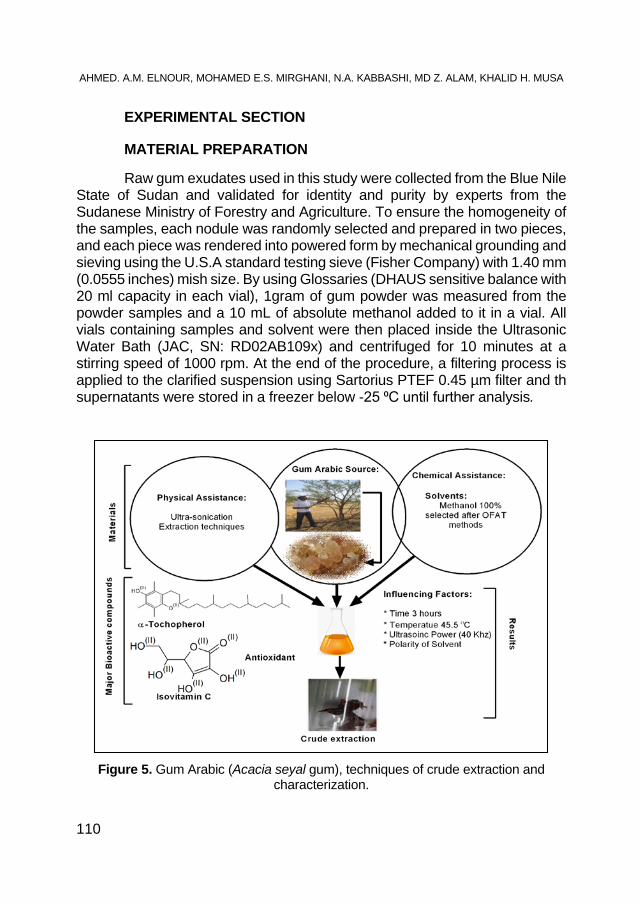
AHMED. A.M. ELNOUR, MOHAMED E.S. MIRGHANI, N.A. KABBASHI, MD Z. ALAM, KHALID H. MUSA
110
EXPERIMENTAL SECTION MATERIAL PREPARATION Raw gum exudates used in this study were collected from the Blue Nile
State of Sudan and validated for identity and purity by experts from the Sudanese Ministry of Forestry and Agriculture. To ensure the homogeneity of the samples, each nodule was randomly selected and prepared in two pieces, and each piece was rendered into powered form by mechanical grounding and sieving using the U.S.A standard testing sieve (Fisher Company) with 1.40 mm (0.0555 inches) mish size. By using Glossaries (DHAUS sensitive balance with 20 ml capacity in each vial), 1gram of gum powder was measured from the powder samples and a 10 mL of absolute methanol added to it in a vial. All vials containing samples and solvent were then placed inside the Ultrasonic Water Bath (JAC, SN: RD02AB109x) and centrifuged for 10 minutes at a stirring speed of 1000 rpm. At the end of the procedure, a filtering process is applied to the clarified suspension using Sartorius PTEF 0.45 µm filter and th supernatants were stored in a freezer below -25 ⁰C until further analysis.
Figure 5. Gum Arabic (Acacia seyal gum), techniques of crude extraction and characterization.
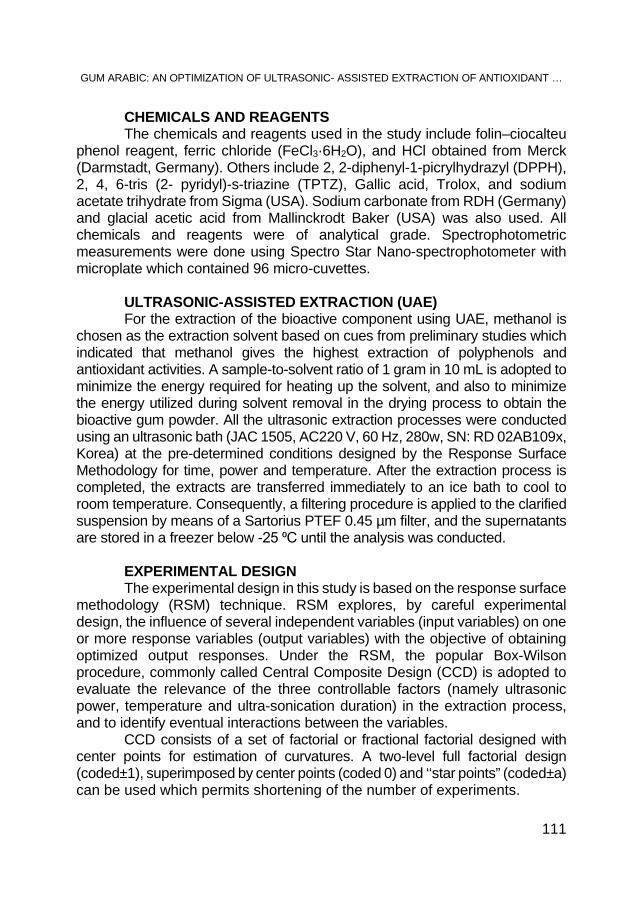
GUM ARABIC: AN OPTIMIZATION OF ULTRASONIC- ASSISTED EXTRACTION OF ANTIOXIDANT …
111
CHEMICALS AND REAGENTS The chemicals and reagents used in the study include folin–ciocalteu
phenol reagent, ferric chloride (FeCl3·6H2O), and HCl obtained from Merck (Darmstadt, Germany). Others include 2, 2-diphenyl-1-picrylhydrazyl (DPPH), 2, 4, 6-tris (2- pyridyl)-s-triazine (TPTZ), Gallic acid, Trolox, and sodium acetate trihydrate from Sigma (USA). Sodium carbonate from RDH (Germany) and glacial acetic acid from Mallinckrodt Baker (USA) was also used. All chemicals and reagents were of analytical grade. Spectrophotometric measurements were done using Spectro Star Nano-spectrophotometer with microplate which contained 96 micro-cuvettes.
ULTRASONIC-ASSISTED EXTRACTION (UAE) For the extraction of the bioactive component using UAE, methanol is
chosen as the extraction solvent based on cues from preliminary studies which indicated that methanol gives the highest extraction of polyphenols and antioxidant activities. A sample-to-solvent ratio of 1 gram in 10 mL is adopted to minimize the energy required for heating up the solvent, and also to minimize the energy utilized during solvent removal in the drying process to obtain the bioactive gum powder. All the ultrasonic extraction processes were conducted using an ultrasonic bath (JAC 1505, AC220 V, 60 Hz, 280w, SN: RD 02AB109x, Korea) at the pre-determined conditions designed by the Response Surface Methodology for time, power and temperature. After the extraction process is completed, the extracts are transferred immediately to an ice bath to cool to room temperature. Consequently, a filtering procedure is applied to the clarified suspension by means of a Sartorius PTEF 0.45 µm filter, and the supernatants are stored in a freezer below -25 ⁰C until the analysis was conducted.
EXPERIMENTAL DESIGN The experimental design in this study is based on the response surface
methodology (RSM) technique. RSM explores, by careful experimental design, the influence of several independent variables (input variables) on one or more response variables (output variables) with the objective of obtaining optimized output responses. Under the RSM, the popular Box-Wilson procedure, commonly called Central Composite Design (CCD) is adopted to evaluate the relevance of the three controllable factors (namely ultrasonic power, temperature and ultra-sonication duration) in the extraction process, and to identify eventual interactions between the variables.
CCD consists of a set of factorial or fractional factorial designed with center points for estimation of curvatures. A two-level full factorial design (coded±1), superimposed by center points (coded 0) and ‘‘star points” (coded±a) can be used which permits shortening of the number of experiments.
AHMED. A.M. ELNOUR, MOHAMED E.S. MIRGHANI, N.A. KABBASHI, MD Z. ALAM, KHALID H. MUSA
112
‘‘Star points” are axial experiments located on variable axes at a distance from the reference center. They establish new extremes for the parameters of the factors involved which provide the basis for the estimation of curvatures for the model. The value of star points is a function of the desired properties of the experimental design and also of the number of experiments involved in the model. A virtual cube can be imagined where each axis of the cube corresponds to a variable under study. In the experimental analysis, the central composite design points describe a sphere around the factorial cube. Preliminary experiments allow pointing the variables at five different coded levels: -α (=1.68), 1, 0, +1, +α (= +1.68).
A total of 20 experiments were conducted including six replications at the center point to evaluate experimental error. The independent variables are the extraction temperature, 25–60 ⁰C, extraction time, 1-3 hours, and ultrasonic power was 12– 40 kHz (or Low to high level coded 1-3). The coded values of the independent variables for CCD are shown in Table 7. Total phenolic (TPC), DPPH and FRAP were selected as the response of the design experiments (Y). Table 7 shows the coded and actual values for CCD of the independent variables.
The model equations, 3D graph plots, and the 2D contour plots were developed using the design of experiment (DOE) software version ® 7.0.0. The software also allows predicting the optimum conditions of the independent variables. A second order equation given in (1) was used to express the level of antioxidant activity and the content of phenolic compounds as a function of the independent variables.
∑∑∑ ∑+=== =
+++=3
1
2
1
2
1
3
1
20iiii i
i ijxixjiixixiy ββββ (1)
Y in the equation is the predicted response which represents the level
of antioxidant activity (measured in mg TE or GAE/100g); 0β represent the regression coefficients or intercept; iβ models the linear effect of the variables,
iiβ represents the squared effect; ijβ denotes the interaction effect; while ix and jx represent the independent variables affecting the output responses. The experimental data were analysed by the Design-Expert software ® [7.0.0] and the coefficients estimated by means of their F-value. Consequently, to obtain the optimum experimental conditions of total phenolic contents and the level of antioxidant activity, statistical analyses were performed namely analysis of variance (ANOVA), regression analysis, and plotting of response surface figures.
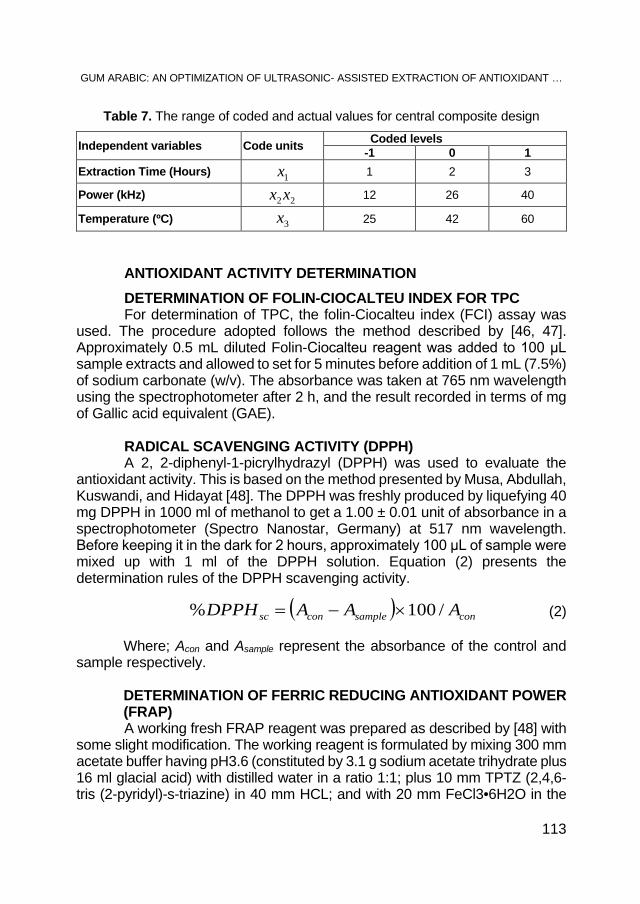
GUM ARABIC: AN OPTIMIZATION OF ULTRASONIC- ASSISTED EXTRACTION OF ANTIOXIDANT …
113
Table 7. The range of coded and actual values for central composite design
Independent variables Code units Coded levels -1 0 1
Extraction Time (Hours) 1x 1 2 3
Power (kHz) 22 xx 12 26 40
Temperature (ºC) 3x 25 42 60
ANTIOXIDANT ACTIVITY DETERMINATION DETERMINATION OF FOLIN-CIOCALTEU INDEX FOR TPC For determination of TPC, the folin-Ciocalteu index (FCI) assay was
used. The procedure adopted follows the method described by [46, 47]. Approximately 0.5 mL diluted Folin-Ciocalteu reagent was added to 100 μL sample extracts and allowed to set for 5 minutes before addition of 1 mL (7.5%) of sodium carbonate (w/v). The absorbance was taken at 765 nm wavelength using the spectrophotometer after 2 h, and the result recorded in terms of mg of Gallic acid equivalent (GAE).
RADICAL SCAVENGING ACTIVITY (DPPH) A 2, 2-diphenyl-1-picrylhydrazyl (DPPH) was used to evaluate the
antioxidant activity. This is based on the method presented by Musa, Abdullah, Kuswandi, and Hidayat [48]. The DPPH was freshly produced by liquefying 40 mg DPPH in 1000 ml of methanol to get a 1.00 ± 0.01 unit of absorbance in a spectrophotometer (Spectro Nanostar, Germany) at 517 nm wavelength. Before keeping it in the dark for 2 hours, approximately 100 μL of sample were mixed up with 1 ml of the DPPH solution. Equation (2) presents the determination rules of the DPPH scavenging activity.
( ) consampleconsc AAADPPH /100% ×−= (2) Where; Acon and Asample represent the absorbance of the control and
sample respectively.
DETERMINATION OF FERRIC REDUCING ANTIOXIDANT POWER (FRAP) A working fresh FRAP reagent was prepared as described by [48] with
some slight modification. The working reagent is formulated by mixing 300 mm acetate buffer having pH3.6 (constituted by 3.1 g sodium acetate trihydrate plus 16 ml glacial acid) with distilled water in a ratio 1:1; plus 10 mm TPTZ (2,4,6-tris (2-pyridyl)-s-triazine) in 40 mm HCL; and with 20 mm FeCl3•6H2O in the
AHMED. A.M. ELNOUR, MOHAMED E.S. MIRGHANI, N.A. KABBASHI, MD Z. ALAM, KHALID H. MUSA
114
ratio of 10:1:1. After 30 minutes, about 1 ml of FRAP reagent was added to 100 μL of samples. By using a spectrophotometer, the absorbance was placed at 595 nm wavelength, and the experimental result presented in milligram (mg) of Trolox equivalent (TE) per 100 g of fresh sample (mg TE/100 g of FW).
GC-MS/MS ANALYSIS GC-MS/MS analysis was used to identify compounds in the extracted
Acacia seyal gum (ASG), in accordance with the method reported by Stankov-Jovanović et al. [49]. The analysis was carried out using a GC (from Agilent Technologies 7890A) interfaced with a mass-selective detector (MSD) (Agilent 7000 Triple Quad). The MSD is equipped with Agilent HP-5ms (5%-phenyl methyl polysiloxane) capillary column with dimension 30 m × 0.25 mm i. d. and 0.25 μm film thickness. The carrier gas used is helium which has a linear velocity of 1 ml/min. Injector and detector temperatures were at 200 ⁰C and 250 ⁰C, respectively, and the volume of the injected sample was 1μl. The MS operating parameters were given as: ionization potential, 70 eV, interface temperature, 250 ⁰C, and acquisition mass range, 50-600. Consequently, the identification of components was done by comparison of their mass spectra and retention time with those of the authentic/standard compounds; by computer matching with NIST and WILEY library; and by comparison of the fragmentation pattern of the mass spectral data with those reported in the literature.
ACKNOWLEDGMENTS The authors would like to acknowledge express their gratitude to the
Department of Biotechnology Engineering (BTE), Faculty of Engineering at the International Islamic University Malaysia (IIUM) and the International Institute for Halal Research and Training (INHART) at IIUM. The 1st author would like to express his gratitude to Dr. Elbasheir Sallam for his continuous and unlimited financial support in conducting this research.
R E F E R E N C E S
1. D. Anderson, Forest Ecology and Management, 1993, 58. 2. B. Elmqvist, L. Olsson, E.M. Elamin, A. Warren, Agroforestry systems, 2005, 64. 3. A. Islam, G. Phillips, A. Sljivo, M. Snowden, P. Williams, Food Hydrocolloids,
1997,11.
GUM ARABIC: AN OPTIMIZATION OF ULTRASONIC- ASSISTED EXTRACTION OF ANTIOXIDANT …
115
4. G.A. Yasseen, A.A. Salih, M.E. Ahmed, Procedia-Social and Behavioral Sciences, 2014,120.
5. S. Al Assaf, G.O. Phillips, P.A. Williams, Food Hydrocolloids, 2005,19. 6. B.H. Ali, S. Beegam, I. Al-Lawati, M. Waly, M. Al Za'abi, A. Nemmar, Physiological
Research, 2013, 62. 7. J.W. Bainbridge, A.J. Smith, S.S. Barker, S. Robbie, R. Henderson, K. Balaggan,
A. Viswanathan, G.E. Holder, A. Stockman, N. Tyler, New England Journal of Medicine, 2008, 358.
8. A.A.H.M. Elnour, Fractionation; Physicochemical and Functional Properties of Acacia Polyacantha Gum, in, UOFK, 2015.
9. B.H. Ali, M.S. Al Moundhri, Food and Chemical Toxicology, 2006, 44. 10. J.A. Hinson, A.B. Reid, S.S. McCullough, L.P. James, Drug Metabolism Reviews,
2004, 36. 11. H. Trommer, R.H. Neubert, International Journal of Pharmaceutics, 2005,298. 12. C.J. Evans, D. Keith, H. Morrison, K. Magendzo, R.H. Edwards, SCIENCE-NEW
YORK THEN WASHINGTON-, 1992, 258. 13. A. Tiss, F. Carrière, R. Verger, Analytical Biochemistry, 2001, 294. 14. B.H. Ali, G. Blunden, M.O. Tanira, A. Nemmar, Food and chemical Toxicology,
2008, 46. 15. D.Z. Bliss, T.P. Stein, C.R. Schleifer, R.G. Settle, The American journal of clinical
nutrition, 1996,63. 16. N. Matsumoto, S. Riley, D. Fraser, S. Al-Assaf, E. Ishimura, T. Wolever, G.
Phillips, A.O. Phillips, Kidney international, 2006, 69. 17. D.A. Glover, K. Ushida, A.O. Phillips, S.G. Riley, Food Hydrocolloids, 2009, 23. 18. K.U. Rehman, M.A. Wingertzahn, S. Teichberg, R.G. Harper, R.A. Wapnir,
Digestive diseases and sciences, 2003, 48. 19. R.A. Wapnir, B. Sherry, C.N. Codipilly, L.O. Goodwin, I. Vancurova, Digestive
diseases and sciences, 2008, 53. 20. F. Chemat, M.A. Vian, G. Cravotto, International journal of molecular sciences,
2012, 13. 21. F. Fathordoobady, H. Mirhosseini, J. Selamat, M.Y.A. Manap, Food Chemistry,
2016, 202. 22. H.K. Kala, R. Mehta, K.K. Sen, R. Tandey, V. Mandal, Trends in Analytical
Chemistry, 2016, 85, Part C. 23. D.-P. Xu, J. Zheng, Y. Zhou, Y. Li, S. Li, H.-B. Li, Food Chemistry, 2017, 217. 24. M. Mushtaq, B. Sultana, F. Anwar, A. Adnan, S.S.H. Rizvi, The Journal of
Supercritical Fluids, 2015, 104. 25. F. Chemat, G. Cravotto, "Enhancing Extraction Processes in the Food Industry",
CRC Press, Taylor and Francis Group, Boca Raton, London, New York, 2011, chapter 6.
26. F. Chemat, N. Rombaut, A.-G. Sicaire, A. Meullemiestre, A.-S. Fabiano-Tixier, M. Abert-Vian, Ultrasonics Sonochemistry, 2017, 34.
27. E. Roselló-Soto, C.M. Galanakis, M. Brnčić, V. Orlien, F.J. Trujillo, R. Mawson, K. Knoerzer, B.K. Tiwari, F.J. Barba, Trends in Food Science & Technology, 2015, 42.
AHMED. A.M. ELNOUR, MOHAMED E.S. MIRGHANI, N.A. KABBASHI, MD Z. ALAM, KHALID H. MUSA
116
28. G. Ruiz-Montañez, J. Ragazzo-Sánchez, M. Calderón-Santoyo, G. Velazquez-De La Cruz, J.R. de León, A. Navarro-Ocaña, Food chemistry, 2014, 159.
29. L. Wang, C.L. Weller, Trends in Food Science & Technology, 2006, 17. 30. R.H. Myers, D.C. Montgomery, C.M. Anderson-Cook, Response surface
methodology: process and product optimization using designed experiments, John Wiley & Sons, 2016.
31. K. Chaisu, A.L. Charles, Y.-K. Guu, T.-B. Yen, C.-H. Chiu, APCBEE procedia, 2014, 8.
32. M. Chen, Y. Zhao, S. Yu, Food chemistry, 2015, 172. 33. C. Kotzamanidis, T. Roukas, G. Skaracis, World Journal of Microbiology and
Biotechnology, 2002, 18. 34. R.S. Makkar, S.S. Cameotra, I.M. Banat, AMB express, 2011, 1. 35. L.V. Candioti, M.M. De Zan, M.S. Cámara, H.C. Goicoechea, Talanta, 2014, 124. 36. Z. Šumić, A. Vakula, A. Tepić, J. Čakarević, J. Vitas, B. Pavlić, Food Chemistry,
2016, 203. 37. Y. Yuan, Y. Gao, L. Mao, J. Zhao, Food Chemistry, 2008, 107. 38. E. Dorta, M.G. Lobo, M. González, LWT-Food Science and Technology, 2012, 45. 39. F.B. Abdelaal, R.K. Rowe, Geotextiles and Geomembranes, 2014, 42. 40. Y.-Q. Ma, J.-C. Chen, D.-H. Liu, X.-Q. Ye, Ultrasonics Sonochemistry, 2009, 16. 41. M. Esclapez, J. García-Pérez, A. Mulet, J. Cárcel, Food Engineering Reviews,
2011, 3. 42. M.N. Alam, N.J. Bristi, M. Rafiquzzaman, Saudi Pharmaceutical Journal, 2013, 21. 43. J. Kubola, S. Siriamornpun, Food Chemistry, 2008, 110. 44. W. Greenaway, F.R. Whatley, Phytochemistry, 1991, 30. 45. S. Fiorito, V.A. Taddeo, S. Genovese, F. Epifano, Tetrahedron Letters, 2016, 57. 46. K.H. Musa, A. Abdullah, K. Jusoh, V. Subramaniam, Food Analytical Methods,
2011, 4. 47. Q.V. Vuong, C.D. Goldsmith, T.T. Dang, V.T. Nguyen, D.J. Bhuyan, E.
Sadeqzadeh, C.J. Scarlett, M.C. Bowyer, Antioxidants, 2014,3. 48. K.H. Musa, A. Abdullah, B. Kuswandi, M.A. Hidayat, Food chemistry, 2013,141. 49. V. Stankov-Jovanović, M. Ilić, V. Mitić, T. Mihajilov-Krstev, S. Simonović, S.N.
Mandić, J. Tabet, R. Cole, Journal of pharmaceutical and biomedical analysis, 2015,111.
STUDIA UBB CHEMIA, LXIII, 3, 2018 (p. 117-127) (RECOMMENDED CITATION) DOI:10.24193/subbchem.2018.3.09
OXIDATIVE STRESS MARKERS IN ACUTE MYOCARDIAL INFARCTION TREATED BY PRIMARY PERCUTANEOUS
CORONARY INTERVENTION
DAN-ALEXANDRU TĂTARUa,b, DAN-MIRCEA OLINICa,b *, ANDRADA URDĂa, MARIA OLINICa,b, REMUS ORĂSANa
ABSTRACT. The current study analysed the dynamics of oxidative stress markers in patients with acute ST-elevation myocardial infarction treated by primary percutaneous intervention. Excessive reactive oxygen species production is known to induce myocardial reperfusion injury. There are few studies that evaluated oxidative stress markers in the interventional era, the historical papers were all based on thrombolysis as a mean of reperfusion. Thirty-seven patients were included. Peripheral venous blood samples were obtained prior to coronary angioplasty, at 1 hour and 24 hours after that. Plasma malondialdehyde, reduced glutathione / oxidised glutathione ratio and total antioxidant capacity were determined. Malondialdehyde was significantly lower at 1 hour (3.1 ± 0.96 nmol/ml vs 2.68 ± 0.81 nmol/ml, p<0.01) and 24 hours (3.1 ± 0.96 nmol/ml vs 2.15 ± 0.95 nmol/ml, p<0.01). Also, reduced glutathione / oxidised glutathione ratio dropped significantly at 1 hour (3.25 Q1-Q3 2.17-5.19 vs 2.33 Q1-Q3 1.53-2.82, p<0.01) and at 24 hours (3.25 Q1-Q3 2.17-5.19 vs 1.96 Q1-Q3 1.28-2.85, p<0.01). Total antioxidant capacity had non-significant variation. There was no correlation between these markers and time from symptom-onset or left ventricular ejection fraction. Reperfusion of the occluded coronary artery by percutaneous coronary intervention in acute myocardial infarction led to a rapid decrease of reduced glutathione / oxidised glutathione ratio, that may indicate a depletion of antioxidants as a consequence of overproduction of reactive oxygen species in the damaged area. However, the malondialdehyde level significantly decreased after vessel opening. This may suggest low reperfusion injury after angioplasty.
Keywords: Oxidative stress, acute myocardial infarction, malondialdehyde, glutathione, total antioxidant capacity
a Iuliu Hațieganu University, Faculty of General Medicine, 8 Victor Babeș street, RO-400012,
Cluj-Napoca, Romania b Cluj County Emergency Hospital, Interventional Cardiology Department, 3-5 Clinicilor street,
RO-400006, Cluj-Napoca, Romania * Corresponding author: [email protected]

DAN-A. TĂTARU, DAN-M. OLINIC, ANDRADA URDĂ, MARIA OLINIC, REMUS ORĂSAN
118
INTRODUCTION Cardiovascular diseases (CVD) are the leading cause of death globally
[1]. Myocardial infarction and stroke account for 80% of CVD deaths in males and 75% in females [2]. The principal objective of therapy for acute ST-elevation myocardial infarction (STEMI) is timely restoration of coronary blood flow, to preserve as much heart muscle as possible and to prevent further complications. This can be done by thrombolysis or percutaneous coronary intervention (PCI). However, a sudden restoration of oxygen supply to a previously ischemic myocardium can lead to myocardial reperfusion injury [3], that can paradoxically reduce the beneficial effect of vessel opening. This culminates with the death of cardiac myocytes that were viable immediately before myocardial reperfusion, thus leading to an increase in infarct size.
The mechanism of myocardial reperfusion injury is not fully understood and it is most probably multifactorial: oxidative stress, lipid peroxidation [3], inflammation, microvascular obstruction [4] and excessive cathecolamine release [5].
Malondialdehyde (MDA), a stable lipid peroxidation end-product, is frequently used as a marker of oxidative stress and reactive oxygen species (ROS) production [6].
Reduced glutathione (GSH) is an important antioxidant serving as an electron donor and thereby preventing damage to important cellular components caused by ROS. Oxidised glutathione, also known as glutathione disulphide (GSSG), is a compound that gives information about the usage of GSH during oxidative stress reactions [7]. In a resting cell, the molar GSH: GSSG ratio exceeds 100:1, while in various models of oxidative stress this ratio has been demonstrated to decrease to values of 10:1 and even 1:1 [8].
In contrast to Folin-Ciocâlteu method which is used only ‘in vitro’ [9], the scavenging of the 1,1-diphenyl-2-picrylhydrazyl (DPPH) free radical offers a simple approach for evaluating the ‘in vivo’ total antioxidant capacity (TAC) of biological sources [10].
The aim of the current study was to determine the dynamics of MDA, GSH/GSSG ratio and TAC (before reperfusion, 1 hour and 24 hours after angioplasty) in patients admitted with STEMI undergoing emergency successful primary PCI of the infarct-related artery and study the correlation with the time from symptom-onset and left ventricular ejection fraction (LVEF). The variation of oxidative stress markers was statistically evaluated using t-test for paired samples or Wilcoxon Signed Ranks Test, depending on the variable distribution and Pearson’s coefficient to determine correlations.
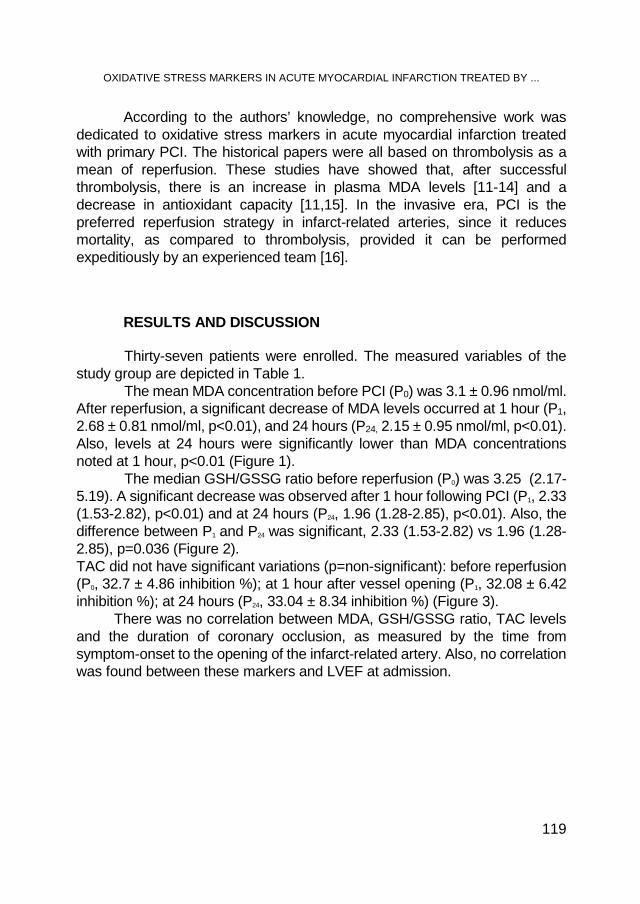
OXIDATIVE STRESS MARKERS IN ACUTE MYOCARDIAL INFARCTION TREATED BY ...
119
According to the authors’ knowledge, no comprehensive work was dedicated to oxidative stress markers in acute myocardial infarction treated with primary PCI. The historical papers were all based on thrombolysis as a mean of reperfusion. These studies have showed that, after successful thrombolysis, there is an increase in plasma MDA levels [11-14] and a decrease in antioxidant capacity [11,15]. In the invasive era, PCI is the preferred reperfusion strategy in infarct-related arteries, since it reduces mortality, as compared to thrombolysis, provided it can be performed expeditiously by an experienced team [16].
RESULTS AND DISCUSSION Thirty-seven patients were enrolled. The measured variables of the
study group are depicted in Table 1. The mean MDA concentration before PCI (P0) was 3.1 ± 0.96 nmol/ml.
After reperfusion, a significant decrease of MDA levels occurred at 1 hour (P1, 2.68 ± 0.81 nmol/ml, p<0.01), and 24 hours (P24, 2.15 ± 0.95 nmol/ml, p<0.01). Also, levels at 24 hours were significantly lower than MDA concentrations noted at 1 hour, p<0.01 (Figure 1).
The median GSH/GSSG ratio before reperfusion (P0) was 3.25 (2.17-5.19). A significant decrease was observed after 1 hour following PCI (P1, 2.33 (1.53-2.82), p<0.01) and at 24 hours (P24, 1.96 (1.28-2.85), p<0.01). Also, the difference between P1 and P24 was significant, 2.33 (1.53-2.82) vs 1.96 (1.28-2.85), p=0.036 (Figure 2). TAC did not have significant variations (p=non-significant): before reperfusion (P0, 32.7 ± 4.86 inhibition %); at 1 hour after vessel opening (P1, 32.08 ± 6.42 inhibition %); at 24 hours (P24, 33.04 ± 8.34 inhibition %) (Figure 3). There was no correlation between MDA, GSH/GSSG ratio, TAC levels and the duration of coronary occlusion, as measured by the time from symptom-onset to the opening of the infarct-related artery. Also, no correlation was found between these markers and LVEF at admission.
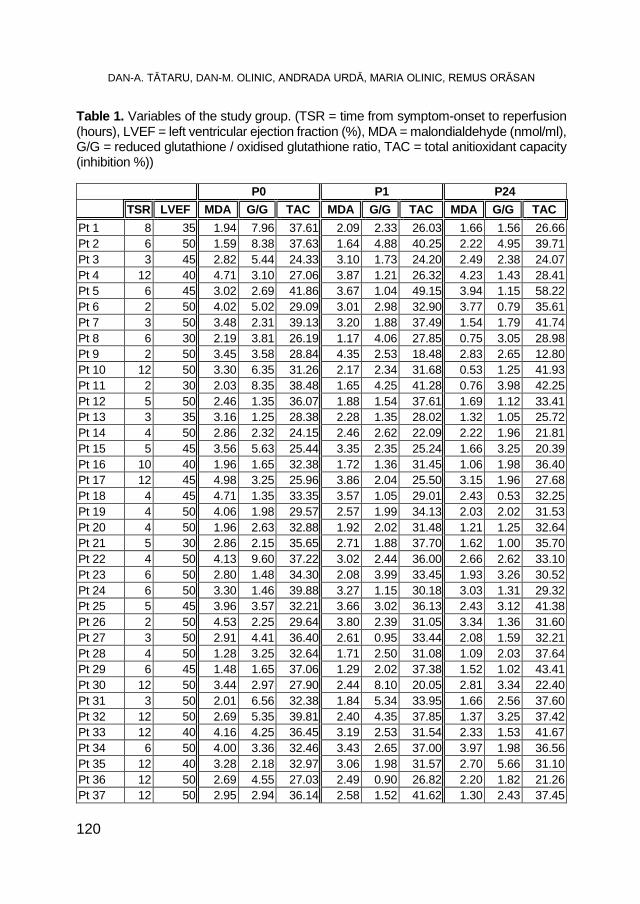
DAN-A. TĂTARU, DAN-M. OLINIC, ANDRADA URDĂ, MARIA OLINIC, REMUS ORĂSAN
120
Table 1. Variables of the study group. (TSR = time from symptom-onset to reperfusion (hours), LVEF = left ventricular ejection fraction (%), MDA = malondialdehyde (nmol/ml), G/G = reduced glutathione / oxidised glutathione ratio, TAC = total anitioxidant capacity (inhibition %))
P0 P1 P24 TSR LVEF MDA G/G TAC MDA G/G TAC MDA G/G TAC Pt 1 8 35 1.94 7.96 37.61 2.09 2.33 26.03 1.66 1.56 26.66 Pt 2 6 50 1.59 8.38 37.63 1.64 4.88 40.25 2.22 4.95 39.71 Pt 3 3 45 2.82 5.44 24.33 3.10 1.73 24.20 2.49 2.38 24.07 Pt 4 12 40 4.71 3.10 27.06 3.87 1.21 26.32 4.23 1.43 28.41 Pt 5 6 45 3.02 2.69 41.86 3.67 1.04 49.15 3.94 1.15 58.22 Pt 6 2 50 4.02 5.02 29.09 3.01 2.98 32.90 3.77 0.79 35.61 Pt 7 3 50 3.48 2.31 39.13 3.20 1.88 37.49 1.54 1.79 41.74 Pt 8 6 30 2.19 3.81 26.19 1.17 4.06 27.85 0.75 3.05 28.98 Pt 9 2 50 3.45 3.58 28.84 4.35 2.53 18.48 2.83 2.65 12.80 Pt 10 12 50 3.30 6.35 31.26 2.17 2.34 31.68 0.53 1.25 41.93 Pt 11 2 30 2.03 8.35 38.48 1.65 4.25 41.28 0.76 3.98 42.25 Pt 12 5 50 2.46 1.35 36.07 1.88 1.54 37.61 1.69 1.12 33.41 Pt 13 3 35 3.16 1.25 28.38 2.28 1.35 28.02 1.32 1.05 25.72 Pt 14 4 50 2.86 2.32 24.15 2.46 2.62 22.09 2.22 1.96 21.81 Pt 15 5 45 3.56 5.63 25.44 3.35 2.35 25.24 1.66 3.25 20.39 Pt 16 10 40 1.96 1.65 32.38 1.72 1.36 31.45 1.06 1.98 36.40 Pt 17 12 45 4.98 3.25 25.96 3.86 2.04 25.50 3.15 1.96 27.68 Pt 18 4 45 4.71 1.35 33.35 3.57 1.05 29.01 2.43 0.53 32.25 Pt 19 4 50 4.06 1.98 29.57 2.57 1.99 34.13 2.03 2.02 31.53 Pt 20 4 50 1.96 2.63 32.88 1.92 2.02 31.48 1.21 1.25 32.64 Pt 21 5 30 2.86 2.15 35.65 2.71 1.88 37.70 1.62 1.00 35.70 Pt 22 4 50 4.13 9.60 37.22 3.02 2.44 36.00 2.66 2.62 33.10 Pt 23 6 50 2.80 1.48 34.30 2.08 3.99 33.45 1.93 3.26 30.52 Pt 24 6 50 3.30 1.46 39.88 3.27 1.15 30.18 3.03 1.31 29.32 Pt 25 5 45 3.96 3.57 32.21 3.66 3.02 36.13 2.43 3.12 41.38 Pt 26 2 50 4.53 2.25 29.64 3.80 2.39 31.05 3.34 1.36 31.60 Pt 27 3 50 2.91 4.41 36.40 2.61 0.95 33.44 2.08 1.59 32.21 Pt 28 4 50 1.28 3.25 32.64 1.71 2.50 31.08 1.09 2.03 37.64 Pt 29 6 45 1.48 1.65 37.06 1.29 2.02 37.38 1.52 1.02 43.41 Pt 30 12 50 3.44 2.97 27.90 2.44 8.10 20.05 2.81 3.34 22.40 Pt 31 3 50 2.01 6.56 32.38 1.84 5.34 33.95 1.66 2.56 37.60 Pt 32 12 50 2.69 5.35 39.81 2.40 4.35 37.85 1.37 3.25 37.42 Pt 33 12 40 4.16 4.25 36.45 3.19 2.53 31.54 2.33 1.53 41.67 Pt 34 6 50 4.00 3.36 32.46 3.43 2.65 37.00 3.97 1.98 36.56 Pt 35 12 40 3.28 2.18 32.97 3.06 1.98 31.57 2.70 5.66 31.10 Pt 36 12 50 2.69 4.55 27.03 2.49 0.90 26.82 2.20 1.82 21.26 Pt 37 12 50 2.95 2.94 36.14 2.58 1.52 41.62 1.30 2.43 37.45
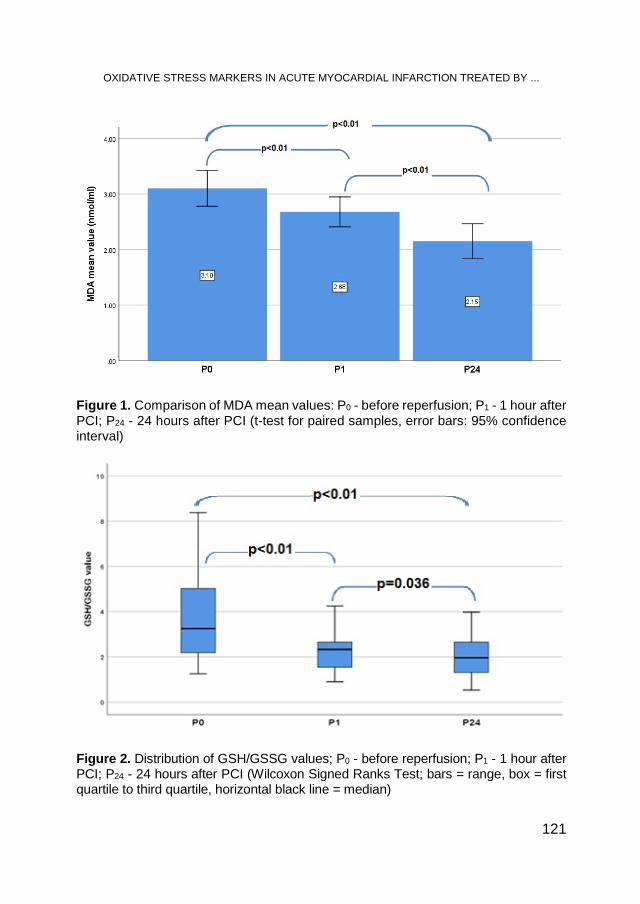
OXIDATIVE STRESS MARKERS IN ACUTE MYOCARDIAL INFARCTION TREATED BY ...
121
Figure 1. Comparison of MDA mean values: P0 - before reperfusion; P1 - 1 hour after PCI; P24 - 24 hours after PCI (t-test for paired samples, error bars: 95% confidence interval)
Figure 2. Distribution of GSH/GSSG values; P0 - before reperfusion; P1 - 1 hour after PCI; P24 - 24 hours after PCI (Wilcoxon Signed Ranks Test; bars = range, box = first quartile to third quartile, horizontal black line = median)
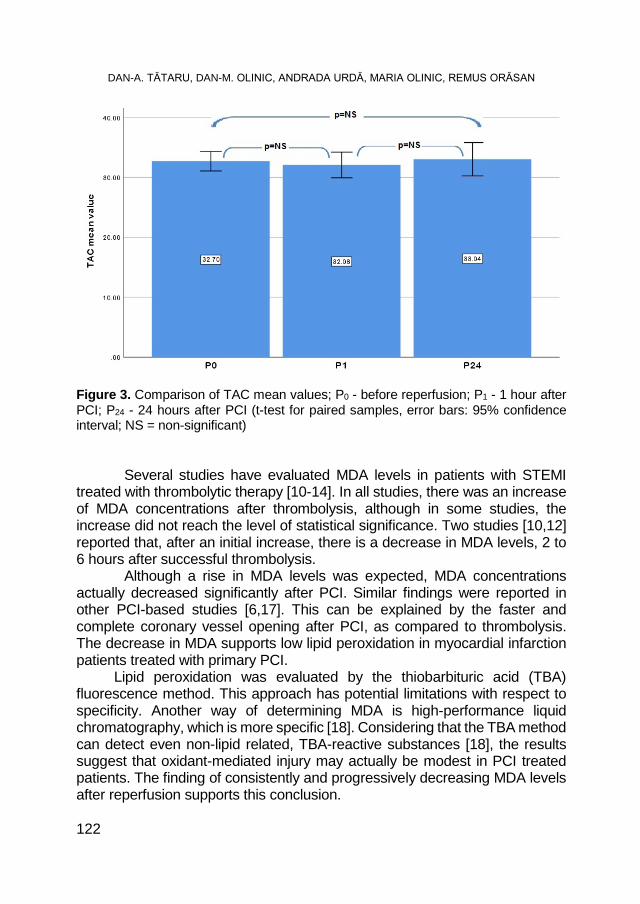
DAN-A. TĂTARU, DAN-M. OLINIC, ANDRADA URDĂ, MARIA OLINIC, REMUS ORĂSAN
122
Figure 3. Comparison of TAC mean values; P0 - before reperfusion; P1 - 1 hour after PCI; P24 - 24 hours after PCI (t-test for paired samples, error bars: 95% confidence interval; NS = non-significant)
Several studies have evaluated MDA levels in patients with STEMI treated with thrombolytic therapy [10-14]. In all studies, there was an increase of MDA concentrations after thrombolysis, although in some studies, the increase did not reach the level of statistical significance. Two studies [10,12] reported that, after an initial increase, there is a decrease in MDA levels, 2 to 6 hours after successful thrombolysis.
Although a rise in MDA levels was expected, MDA concentrations actually decreased significantly after PCI. Similar findings were reported in other PCI-based studies [6,17]. This can be explained by the faster and complete coronary vessel opening after PCI, as compared to thrombolysis. The decrease in MDA supports low lipid peroxidation in myocardial infarction patients treated with primary PCI. Lipid peroxidation was evaluated by the thiobarbituric acid (TBA) fluorescence method. This approach has potential limitations with respect to specificity. Another way of determining MDA is high-performance liquid chromatography, which is more specific [18]. Considering that the TBA method can detect even non-lipid related, TBA-reactive substances [18], the results suggest that oxidant-mediated injury may actually be modest in PCI treated patients. The finding of consistently and progressively decreasing MDA levels after reperfusion supports this conclusion.
OXIDATIVE STRESS MARKERS IN ACUTE MYOCARDIAL INFARCTION TREATED BY ...
123
GSH/GSSG ratio had a significant decrease after PCI, showing increased oxidative stress and a possible sign of myocardial reperfusion injury, which is in contrast with reduced lipid peroxidation. Similarly, another study reported that human hearts subjected to cardioplegia and subsequent reperfusion show oxidative stress, without an increase in lipid peroxidation [19].
TAC levels had non-significant variations before and after vessel opening. Other authors reported a significant drop in the first hours after PCI reperfusion, but the levels returned to baseline values on the third day [6]. In the mentioned study [6], TAC levels were assessed by a different method, using the 2,2‘-azino-bis(3-ethylbenzthiazoline-6-sulphonic acid) reaction [20].
Although an experimental study on rat hearts reported increased MDA levels during prolongation of ischemia [21], there was no correlation in the present study between oxidative stress markers and the time from symptom-onset to reperfusion, which is similar to other PCI studies [6].
In animal models with acute myocardial infarction, a significant positive correlation between GSH/GSSG ratio and LVEF was observed [22]. In contrast, there was no correlation between LVEF and oxidative stress markers in this study group.
The present study showed that in STEMI patients, PCI reduces some of the oxidative stress burden, such as lipid peroxidation, while enhacing ROS production by other pathways. This may suggest different mechanisms leading to oxidative stress. Further studies are needed to properly differentiate the pathophysiology of oxidative stress production after reperfusion.
CONCLUSION In STEMI patients, the decrease in GSH/GSSG ratio after PCI
suggests increased oxidative stress and is a possible marker of myocardial reperfusion injury.
However, the decrease in MDA levels immediately after vessel opening suggests low oxidative damage after PCI.
There were no significant variations in TAC before and after PCI. No correlations between MDA, GSH/GSSG ratio, TAC and time from
symptom-onset to reperfusion or LVEF were observed. EXPERIMENTAL SECTION The study complied with the Declaration of Helsinki [23]. Written
consent was obtained from each patient before the procedure. Patients diagnosed with STEMI and admitted to the Cluj County Emergency Hospital,
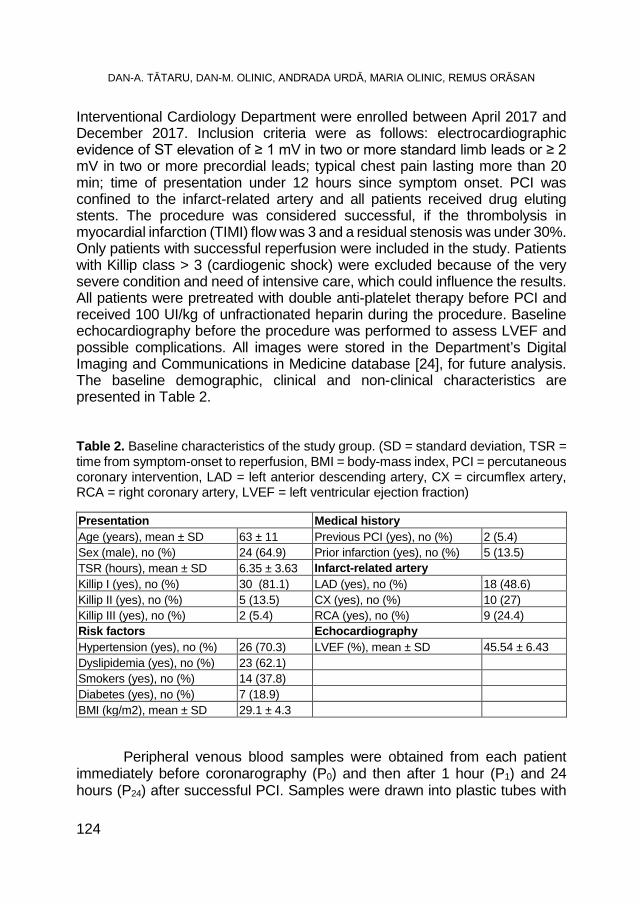
DAN-A. TĂTARU, DAN-M. OLINIC, ANDRADA URDĂ, MARIA OLINIC, REMUS ORĂSAN
124
Interventional Cardiology Department were enrolled between April 2017 and December 2017. Inclusion criteria were as follows: electrocardiographic evidence of ST elevation of ≥ 1 mV in two or more standard limb leads or ≥ 2 mV in two or more precordial leads; typical chest pain lasting more than 20 min; time of presentation under 12 hours since symptom onset. PCI was confined to the infarct-related artery and all patients received drug eluting stents. The procedure was considered successful, if the thrombolysis in myocardial infarction (TIMI) flow was 3 and a residual stenosis was under 30%. Only patients with successful reperfusion were included in the study. Patients with Killip class > 3 (cardiogenic shock) were excluded because of the very severe condition and need of intensive care, which could influence the results. All patients were pretreated with double anti-platelet therapy before PCI and received 100 UI/kg of unfractionated heparin during the procedure. Baseline echocardiography before the procedure was performed to assess LVEF and possible complications. All images were stored in the Department’s Digital Imaging and Communications in Medicine database [24], for future analysis. The baseline demographic, clinical and non-clinical characteristics are presented in Table 2. Table 2. Baseline characteristics of the study group. (SD = standard deviation, TSR = time from symptom-onset to reperfusion, BMI = body-mass index, PCI = percutaneous coronary intervention, LAD = left anterior descending artery, CX = circumflex artery, RCA = right coronary artery, LVEF = left ventricular ejection fraction) Presentation Medical history Age (years), mean ± SD 63 ± 11 Previous PCI (yes), no (%) 2 (5.4) Sex (male), no (%) 24 (64.9) Prior infarction (yes), no (%) 5 (13.5) TSR (hours), mean ± SD 6.35 ± 3.63 Infarct-related artery Killip I (yes), no (%) 30 (81.1) LAD (yes), no (%) 18 (48.6) Killip II (yes), no (%) 5 (13.5) CX (yes), no (%) 10 (27) Killip III (yes), no (%) 2 (5.4) RCA (yes), no (%) 9 (24.4) Risk factors Echocardiography Hypertension (yes), no (%) 26 (70.3) LVEF (%), mean ± SD 45.54 ± 6.43 Dyslipidemia (yes), no (%) 23 (62.1) Smokers (yes), no (%) 14 (37.8) Diabetes (yes), no (%) 7 (18.9) BMI (kg/m2), mean ± SD 29.1 ± 4.3 Peripheral venous blood samples were obtained from each patient immediately before coronarography (P0) and then after 1 hour (P1) and 24 hours (P24) after successful PCI. Samples were drawn into plastic tubes with
OXIDATIVE STRESS MARKERS IN ACUTE MYOCARDIAL INFARCTION TREATED BY ...
125
EDTA. Blood was centrifuged within 1 hour at 1500 rpm for 15 minutes, and the collected plasma was stored at –30° C until analysis, within 28 days. All the reagents were supplied by Sigma (Deisenhofen, Germany).
MDA was determined by the TBA reaction [25]. First, 50 µl of plasma was boiled with 1 ml of 10 mM 2-TBA and 1 ml of 75 mM K2HPO4, pH=3. After sudden cooling, the product was extracted with n-butanol. Using fluorescence spectrometry (Lambda 35, Perkin Elmer, USA), the sample was measured at an emission wavelength of 534 nm with a synchronous fluorescence technique at a difference of 14 nm between the excitation and emission wavelength. The MDA levels were calculated according to a calibration curve realised with known concentrations of MDA.
GSH was determined by fluorescence spectrometry [26]. A 500 µl aliquot of plasma is added to 500 µl of cold 10% trichloroacetic acid. After 10 minutes in ice, the mixture is centrifuged (3000 rpm for 15 minutes) and 200 µl of the supernatant is mixed with 1.7 ml of phosphate buffer and 0.1 ml of o-phthalaldehyde. After 15 minutes, the fluorescence at 350 nm excitation and 420 nm emission is read against a blank (Lambda 35, Perkin Elmer, USA).
For GSSG estimation [27], 250 µl of the plasma sample was incubated with 0,1 ml 40 nM N-ethylmaleimide for 30 minutes followed by addition of 0,65 ml of 0.1 M NaOH. Thereafter, the same procedure was followed for fluorescence development as used in GSH measurement, except in place of the buffer, 0.1 M NaOH was used.
The concentrations of GSH and GSSG were calculated from calibration curves and are expressed in μmol/ml.
TAC was determined by measurement of DPPH method [28]. The reduction assay was performed by adding 20 µl of plasma to 400 µl of 0.1 mM methanol solution of DPPH and phosphate buffer, pH=7,4. After 30-minute incubation at ambient temperature, absorbance of the samples at 520 nm was measured (Lambda 35, Perkin Elmer, USA) and compared with that of a reference sample containing only DPPH solution and phosphate buffer. TAC was measured in inhibition % as [(reference extinction - serum extinction) / reference extinction] x 100.
The statistical analysis was performed using SPSS software v25 for Windows (IBM, USA). The Shapiro-Wilk test was used to assess for a normal distribution. The t-test for paired samples was used for normally distributed data and Wilcoxon Signed Ranks Test for paired samples for not normally distributed. The significance threshold was set at p=0.05. The data are presented as mean ± standard deviation for normally distributed samples; otherwise as median and interquartile range (Q1‒Q3), where Q1 = first quartile and Q3 = third quartile. Correlation analysis was performed using Pearson’s correlation coefficient.
DAN-A. TĂTARU, DAN-M. OLINIC, ANDRADA URDĂ, MARIA OLINIC, REMUS ORĂSAN
126
ACKNOWLEDGEMENTS
We thank our colleagues from The Oxidative Stress Laboratory, part of the Physiology Department, Iuliu Hatieganu University, who provided insight and expertise that greatly assisted the research.
R E F E R E N C E S
1. D. Olinic, M. Spinu, M. Olinic, C. Homorodean, D. Tataru, A. Liew, G. Schernthaner, A. Stanek, G. Fowkes, M. Catalano, International Angiology, 2018, 37, 327.
2. A.S. Go, D. Mozaffarian, V.L. Roger, Circulation, 2013, 127, e6. 3. D. Yellon, D. Hausenloy, New England Journal of Medicine, 2007, 357, 1121. 4. M. Marc, A.C. Iancu, C. Ober, C. Homorodean, S. Balanescu, A.V. Sitar, S.
Bolboaca, I. M. Dregoesc, Scientific Reports, 2018, 8, 1897. 5. C. Homorodean, M. Ober, M. Olinic, R. Homorodean, A. Hassoune, D. Tătaru, M.
Spînu, D. Olinic, Medical Ultrasonography, 2016, 18, 475. 6. E. Sedláková, O. Rácz, E. Lovásová, R. Beňačka, M. Kurpas, A. Chmelárová, J.
Sedlák, M. Studenčan, Central European Journal of Medicine, 2009, 4, 26. 7. D.M. Mitrea, S. Clichici, A. Filip, D. Olteanu, I. Baldea, R. Moldovan, N. Decea,
O.A. Hoteiuc, Studia UBB Chemia, 2017, 62, 89. 8. Y. Chai, S. Ashraf, K. Rokutan, R. Johnston, J. Thomas, Archives of Biochemistry
and Biophysics, 1994, 310, 273. 9. I. Simon, D. Simedru, L. Dordai, E. Luca, V. Fuss, A. Becze, Studia UBB Chemia,
2016, 61, 505. 10. S.B. Kedare, R.P. Singh, Journal of Food Science and Technology, 2011, 48,
412. 11. T. Beard, D. Carrie, M. Boyer, B. Boudjemaa, J. Ferrières, M. Delay, Archives des
maladies du coeur et des vaisseaux, 1994, 87, 1289. 12. K. Iqbal, M.A. Rauoof, M. Mir, N. Tramboo, J. Malik, B. Naikoo, American Journal
of Cardiology, 2002, 89, 334. 13. I. Young, J. Purvis, J. Lightbody, A. Adgey, European Heart Journal, 1993, 14,
1027. 14. S. Pucheu, C.H. Coudray, G. Vanzetto, A. Favier, J. Machecourt, J. de Leiris,
Free Radical Biology and Medicine, 1995, 19, 873. 15. K. Berg, P. Jynge, K. Bjerve, S, Skarra, S. Basu, R. Wiseth, Free Radical
Research, 2005, 6, 629. 16. B. Ibanez and the ESC Taskforce, European Heart Journal, 2017, 00, 1. 17. K. Olsson, J. Harnek, A. Ohlin A, N. Pavlidis, B. Thorvinger, H. Ohlin,
Scandinavian Cardiovascular Journal, 2002, 36, 237.

OXIDATIVE STRESS MARKERS IN ACUTE MYOCARDIAL INFARCTION TREATED BY ...
127
18. C. Ceconi, A. Cargoni, E. Pasini, et al, American Journal of Physiology-Heart and Circulatory Physiology, 1991, 260, H1057.
19. M. Janssen, J.F. Koster, E. Bos, J. De Jong, Circulation Research, 1993, 73, 681. 20. C. Rice Evans, N. Miller, Methods in Enzymology, 1994, 234, 279. 21. B. Tavazzi, D. Di Pierro, M. Bartolini, M. Marino, S. Distefano, M. Galvano, Free
Radical Research, 1998, 1, 25. 22. A. Tavares, A. da Rosa Araujo, S. Llesuy, et al, Experimental and Clinical
Cardiology, 2012, 17, 263. 23. World Medical Association, Journal of the American Medical Association, 2013,
310, 2191. 24. C. Homorodean, M. Olinic, D.M. Olinic, Medical Ultrasonography, 2012, 14, 29. 25. M. Conti, P.C. Morand, P. Levillain, A. Lemonnier, Clinical Chemistry, 1991, 37,
1273. 26. M.L. Hu, Methods in Enzymology, 1994, 233, 380. 27. P. Vats, V.K. Singh, S.S. Sing, Aviation, Space and Environmental Medicine,
2008, 79, 1106. 28. A. Janaszewska, G. Bartosz, Scandinavian Journal of Clinical and Laboratory
Investigation, 2002, 62, 231.


STUDIA UBB CHEMIA, LXIII, 3, 2018 (p. 129-135) (RECOMMENDED CITATION) DOI:10.24193/subbchem.2018.3.10
SYNTHESIS AND CHARACTERIZATION OF MUC-1 FUNCTIONALIZED GOLD NANOPARTICLES
CRISTIAN T. MATEAa, TEODORA MOCANa,b*, FLAVIU TABARANa,c, TEODORA POPd, OFELIA MOSTEANUd, LUCIAN MOCANa,e,
CLAUDIU ZDREHUSe
ABSTRACT. Gold nanoparticles have been functionalized with the biologically active MUC-1 peptide conjugated to KLH and the obtained bio-nanostructure was characterized using an array of techniques such as: UV-Vis and ATR-FT-IR spectroscopy, dynamic light scattering (DLS) and atomic force microscopy (AFM). A 54 nm monodisperse bio-nanostructure with high aqueous stability was obtained.
Keywords: gold nanoparticles, functionalization, MUC-1 peptide
INTRODUCTION
Metal nanoparticles and especially gold nanoparticles (GNPs) have attracted a lot of interest from the scientific community due to their unique properties such as: large surface-to-volume ration, optoelectronic properties, rich functionality, low toxicity and high biocompatibility [1, 2]. Recent advances in the fields of nanoparticles synthesis and functionalization resulted in novel medical applications [3, 4]. One area of biomedical research in which GNPs have center stage is the development of carriers for cellular delivery of drugs, proteins and non-cell-penetrating peptides [5-8].
a Department of Nanomedicine “Octavian Fodor” Gastroenterology Institute, Cluj-Napoca,
Romania b Department of Physiology, “Iuliu Hatieganu” University of Medicine and Pharmacy, Cluj-Napoca,
Romania c Department of Pathology, Faculty of Veterinary Medicine, University of Agricultural Sciences and
Veterinary Medicine d 3rd Gastroenterology Department “Iuliu Hatieganu” University of Medicine and Pharmacy, Cluj-
Napoca, Romania e 3rd Surgery Clinic “Iuliu Hatieganu ” University of Medicine and Pharmacy Cluj-Napoca Romania * Corresponding author: [email protected]
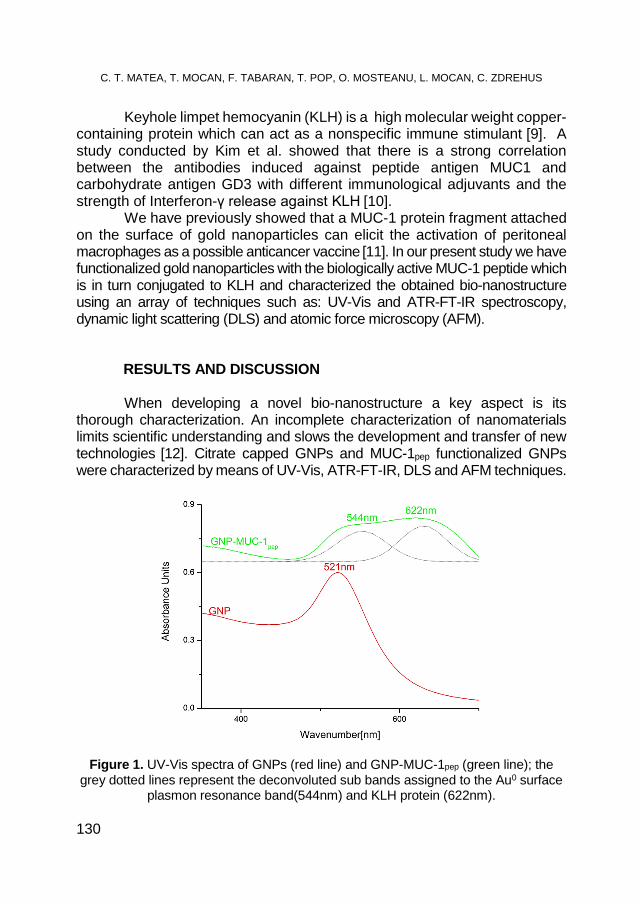
C. T. MATEA, T. MOCAN, F. TABARAN, T. POP, O. MOSTEANU, L. MOCAN, C. ZDREHUS
130
Keyhole limpet hemocyanin (KLH) is a high molecular weight copper-containing protein which can act as a nonspecific immune stimulant [9]. A study conducted by Kim et al. showed that there is a strong correlation between the antibodies induced against peptide antigen MUC1 and carbohydrate antigen GD3 with different immunological adjuvants and the strength of Interferon-γ release against KLH [10].
We have previously showed that a MUC-1 protein fragment attached on the surface of gold nanoparticles can elicit the activation of peritoneal macrophages as a possible anticancer vaccine [11]. In our present study we have functionalized gold nanoparticles with the biologically active MUC-1 peptide which is in turn conjugated to KLH and characterized the obtained bio-nanostructure using an array of techniques such as: UV-Vis and ATR-FT-IR spectroscopy, dynamic light scattering (DLS) and atomic force microscopy (AFM).
RESULTS AND DISCUSSION
When developing a novel bio-nanostructure a key aspect is its thorough characterization. An incomplete characterization of nanomaterials limits scientific understanding and slows the development and transfer of new technologies [12]. Citrate capped GNPs and MUC-1pep functionalized GNPs were characterized by means of UV-Vis, ATR-FT-IR, DLS and AFM techniques.
Figure 1. UV-Vis spectra of GNPs (red line) and GNP-MUC-1pep (green line); the grey dotted lines represent the deconvoluted sub bands assigned to the Au0 surface
plasmon resonance band(544nm) and KLH protein (622nm).
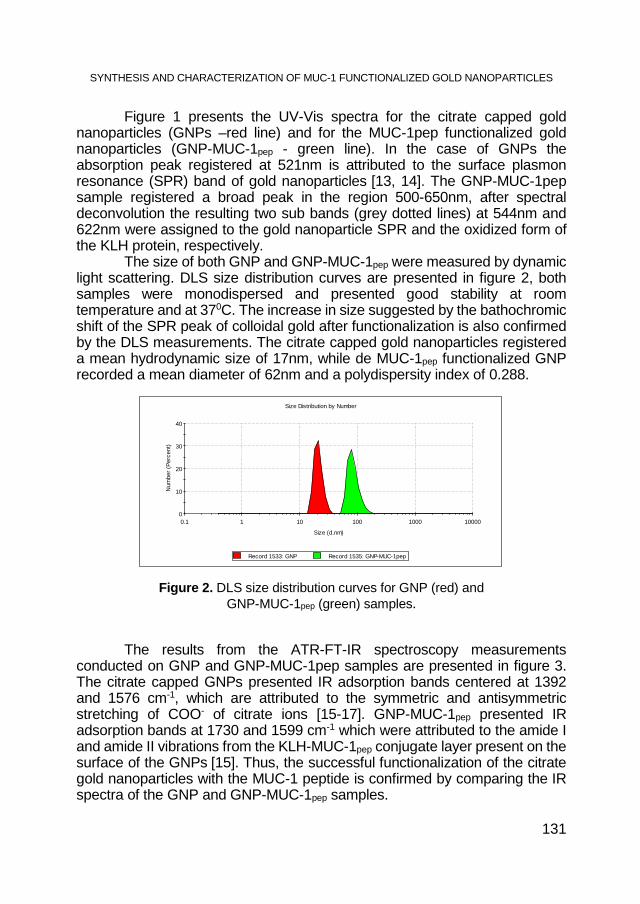
SYNTHESIS AND CHARACTERIZATION OF MUC-1 FUNCTIONALIZED GOLD NANOPARTICLES
131
Figure 1 presents the UV-Vis spectra for the citrate capped gold nanoparticles (GNPs –red line) and for the MUC-1pep functionalized gold nanoparticles (GNP-MUC-1pep - green line). In the case of GNPs the absorption peak registered at 521nm is attributed to the surface plasmon resonance (SPR) band of gold nanoparticles [13, 14]. The GNP-MUC-1pep sample registered a broad peak in the region 500-650nm, after spectral deconvolution the resulting two sub bands (grey dotted lines) at 544nm and 622nm were assigned to the gold nanoparticle SPR and the oxidized form of the KLH protein, respectively.
The size of both GNP and GNP-MUC-1pep were measured by dynamic light scattering. DLS size distribution curves are presented in figure 2, both samples were monodispersed and presented good stability at room temperature and at 370C. The increase in size suggested by the bathochromic shift of the SPR peak of colloidal gold after functionalization is also confirmed by the DLS measurements. The citrate capped gold nanoparticles registered a mean hydrodynamic size of 17nm, while de MUC-1pep functionalized GNP recorded a mean diameter of 62nm and a polydispersity index of 0.288.
Figure 2. DLS size distribution curves for GNP (red) and GNP-MUC-1pep (green) samples.
The results from the ATR-FT-IR spectroscopy measurements conducted on GNP and GNP-MUC-1pep samples are presented in figure 3. The citrate capped GNPs presented IR adsorption bands centered at 1392 and 1576 cm-1, which are attributed to the symmetric and antisymmetric stretching of COO- of citrate ions [15-17]. GNP-MUC-1pep presented IR adsorption bands at 1730 and 1599 cm-1 which were attributed to the amide I and amide II vibrations from the KLH-MUC-1pep conjugate layer present on the surface of the GNPs [15]. Thus, the successful functionalization of the citrate gold nanoparticles with the MUC-1 peptide is confirmed by comparing the IR spectra of the GNP and GNP-MUC-1pep samples.
0
10
20
30
40
0.1 1 10 100 1000 10000
Num
ber (
Perc
ent)
Size (d.nm)
Size Distribution by Number
Record 1533: GNP Record 1535: GNP-MUC-1pep
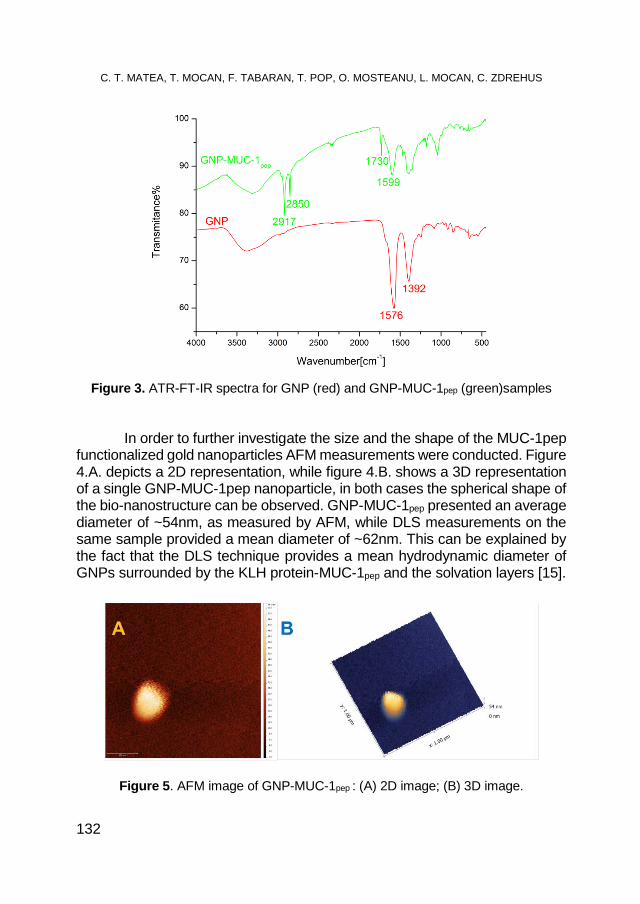
C. T. MATEA, T. MOCAN, F. TABARAN, T. POP, O. MOSTEANU, L. MOCAN, C. ZDREHUS
132
Figure 3. ATR-FT-IR spectra for GNP (red) and GNP-MUC-1pep (green)samples
In order to further investigate the size and the shape of the MUC-1pep functionalized gold nanoparticles AFM measurements were conducted. Figure 4.A. depicts a 2D representation, while figure 4.B. shows a 3D representation of a single GNP-MUC-1pep nanoparticle, in both cases the spherical shape of the bio-nanostructure can be observed. GNP-MUC-1pep presented an average diameter of ~54nm, as measured by AFM, while DLS measurements on the same sample provided a mean diameter of ~62nm. This can be explained by the fact that the DLS technique provides a mean hydrodynamic diameter of GNPs surrounded by the KLH protein-MUC-1pep and the solvation layers [15].
Figure 5. AFM image of GNP-MUC-1pep : (A) 2D image; (B) 3D image.

SYNTHESIS AND CHARACTERIZATION OF MUC-1 FUNCTIONALIZED GOLD NANOPARTICLES
133
CONCLUSIONS Gold nanoparticles were functionalized with a KLH-MUC-1 peptide
conjugate yielding a 54nm monodisperse bio-nanostructure with high aqueous stability. The characterization of the obtained material involved UV-Vis and FT-IR spectroscopies in order to confirm the success of the functionalization step. The dynamic light scattering and atomic force microscopy techniques were employed to determine the size and shape of the GNPs prior and after functionalization. Investigations into the biological interactions of this novel bio-nanostructure are required in order to determine its potential for medical applications.
EXPERIMENTAL SECTION HAuCl4 (≥99.9%), tri-sodium citrate (≥99%), DL-dithiotreitol (DTT)
(≥99%) and NaH2PO4 were purchased from Sigma-Aldrich™ (Darmstadt, Germany). MUC-1 peptide, aminoacid one letter code – TSAPDNRPALGSTA, attached to keyhole limpet hemocyanin (KLH) protein was purchased from Abcam (Austin, USA). All reagents were used as received, without further purification.
Citrate capped gold nanoparticles (GNPs) were obtained by employing a modified Turkevich method. Briefly, 9.8mg HAuCl4 were dissolved in 20 mL distilled water and heated to 1000C, to this, 2mL sodium citrate (20mg/mL) were added. The reaction was allowed to continue for 2 hours under reflux and continuous stirring, during this stage the solution turned from pale-yellow to dark-red. For the functionalization of the GNPs with KLH-MUC-1 conjugate, a 100μL KLH-MUC-1pep solution (1mg/mL) was mixed with 300μL DTT 100mM (pH=8.5) and was added to 10mL GNP solution and kept under vigorous agitation for 5 minutes. The obtained GNP-MUC-1pep was subjected to a centrifugation step at 15000RPM/30min. and the resulting pellet was re-dispersed in H2O bidist. The purified GNP-MUC-1pep sample presented good stability over several weeks, at room temperature and at 40C.
UV-Vis spectroscopy was performed on the samples with a Shimadzu UV-1800 spectrophotometer. The GNP and GNP-MUC-1pep spectras were recorded from 800nm to 200nm with a spectral resolution of 0.5nm. OriginLab® software 7.0 was used to normalize all recorded spectras.
Dynamic light scattering (DLS) measurements were performed with a Nano S90 instrument (Malvern Instruments, Westborough, UK) at 250C at 900
scattering angles.
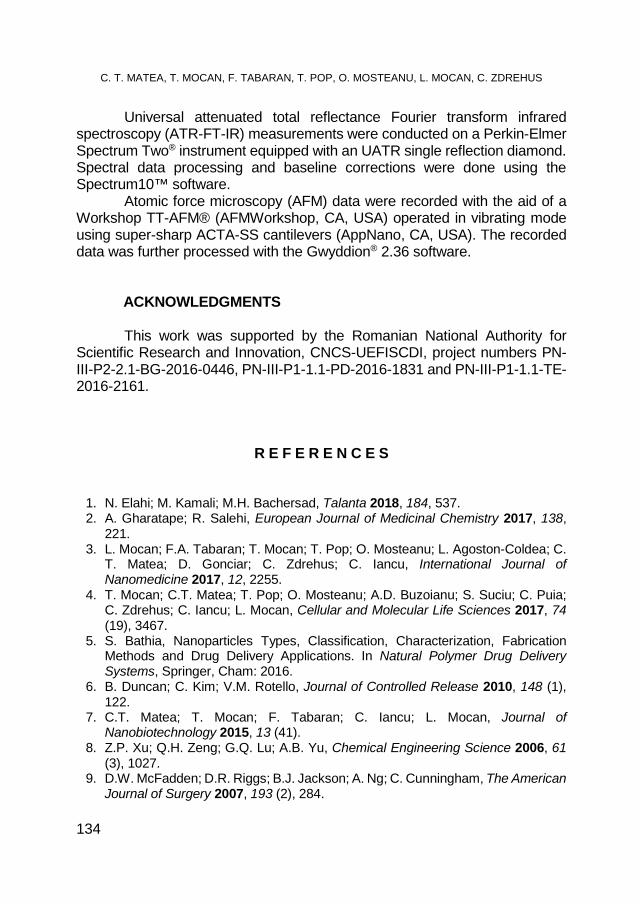
C. T. MATEA, T. MOCAN, F. TABARAN, T. POP, O. MOSTEANU, L. MOCAN, C. ZDREHUS
134
Universal attenuated total reflectance Fourier transform infrared spectroscopy (ATR-FT-IR) measurements were conducted on a Perkin-Elmer Spectrum Two® instrument equipped with an UATR single reflection diamond. Spectral data processing and baseline corrections were done using the Spectrum10™ software.
Atomic force microscopy (AFM) data were recorded with the aid of a Workshop TT-AFM® (AFMWorkshop, CA, USA) operated in vibrating mode using super-sharp ACTA-SS cantilevers (AppNano, CA, USA). The recorded data was further processed with the Gwyddion® 2.36 software.
ACKNOWLEDGMENTS This work was supported by the Romanian National Authority for
Scientific Research and Innovation, CNCS-UEFISCDI, project numbers PN-III-P2-2.1-BG-2016-0446, PN-III-P1-1.1-PD-2016-1831 and PN-III-P1-1.1-TE-2016-2161.
R E F E R E N C E S
1. N. Elahi; M. Kamali; M.H. Bachersad, Talanta 2018, 184, 537. 2. A. Gharatape; R. Salehi, European Journal of Medicinal Chemistry 2017, 138,
221. 3. L. Mocan; F.A. Tabaran; T. Mocan; T. Pop; O. Mosteanu; L. Agoston-Coldea; C.
T. Matea; D. Gonciar; C. Zdrehus; C. Iancu, International Journal of Nanomedicine 2017, 12, 2255.
4. T. Mocan; C.T. Matea; T. Pop; O. Mosteanu; A.D. Buzoianu; S. Suciu; C. Puia; C. Zdrehus; C. Iancu; L. Mocan, Cellular and Molecular Life Sciences 2017, 74 (19), 3467.
5. S. Bathia, Nanoparticles Types, Classification, Characterization, Fabrication Methods and Drug Delivery Applications. In Natural Polymer Drug Delivery Systems, Springer, Cham: 2016.
6. B. Duncan; C. Kim; V.M. Rotello, Journal of Controlled Release 2010, 148 (1), 122.
7. C.T. Matea; T. Mocan; F. Tabaran; C. Iancu; L. Mocan, Journal of Nanobiotechnology 2015, 13 (41).
8. Z.P. Xu; Q.H. Zeng; G.Q. Lu; A.B. Yu, Chemical Engineering Science 2006, 61 (3), 1027.
9. D.W. McFadden; D.R. Riggs; B.J. Jackson; A. Ng; C. Cunningham, The American Journal of Surgery 2007, 193 (2), 284.
SYNTHESIS AND CHARACTERIZATION OF MUC-1 FUNCTIONALIZED GOLD NANOPARTICLES
135
10. S.K. Kim; G. Ragupathi; C. Musselli; S.-J. Choi; Y.S. Park; P.O. Livingston, Vaccine 2000, 18, 597.
11. T. Mocan; C. Matea; F. Tabaran; C. Iancu; R. Orasan; L. Mocan, Journal of Cancer 2015, 6 (6), 583.
12. D.R. Baer; M.H. Engellhard; G E. johnson; J. Laskin; J. Lai; K. Mueller; P. Munusamy; S. Thevuthasan; H. Wang; N. Washton, Jornal of Vacuum Science and Technology A 2013, 31 (5).
13. L. Shang; Y. Wang; J. Jiang; S. Dong, Langmuir 2007, 23, 2714-2721. 14. Y. Wang; Y. Ni, Talanta 2014, 119, 320. 15. G. Mandal; M. Bardhan; T. Ganguly, Colloids and Surfaces B: Biointerfaces 2010,
81 (178-184). 16. J. Park; J. Shumaker-Parry, Journal of the American Chemical Society 2014, 136,
1907-1921. 17. X. Zou; E. Ying; S. Dong, Nanotechnology 2006, 17 (4758-4764).

STUDIA UBB CHEMIA, LXIII, 3, 2018 (p. 137-154) (RECOMMENDED CITATION) DOI:10.24193/subbchem.2018.3.11
PREPARATION AND CHARACTERIZATION OF HYDROXYAPATITE BASED NANO-COMPOSITE
BIOMORPHIC IMPLANTS
RÉKA BARABÁSa, MELINDA RIGÓa, MARGIT ENISZNÉ-BÓDOGHb, CORINA MOISAc, OANA CADARd*
ABSTRACT. The aim of this study was the preparation and characterization of different biomorphic implants based on calcined cattle bones coated with hydroxyapatite (Hap) based nanocomposites in different ratios. For comparison, molded nanocomposites were also produced as biomorphic implants. The obtained nanocomposite/implants were characterized using X-ray diffraction, light microscopy and scanning electron microscopy, Brunauer-Emmett-Teller surface area and apparent porosity. The release of Ca and P in simulated body fluid was monitored by X-ray fluorescence. The adsorption capacity and extended-release dosage of implants were investigated with ibuprofen, an anti-inflammatory drug, by UV-VIS spectroscopy. The highest adsorption efficiency and stability were obtained for sintered (S) (Hap-) and 20% gelatin (G) nanocomposite (Hap-20G-S) and bone parts coated with Hap-S and Hap-20G-S nanocomposite, respectively. The best results (high adsorption efficiency and slow release - low desorption capacity) were obtained for molded Hap-20G-S composite, without bone. In summary, the cattle bones with hydroxyapatite coatings show great promise in production of inexpensive and patient-specific bone implants.
Keywords: biomorphic implants, hydroxyapatite, gelatin, carbon nanotubes, ibuprofen
a Babeș-Bolyai University, Faculty of Chemistry and Chemical Engineering, Hungarian Line of
Study, 11 Arany Janos Street, RO-400028 Cluj-Napoca Romania b University of Pannonia, Institute of Materials Engineering, 10 Egyetem Street, H-8200
Veszprem, Hungary c University of Oradea, Medicine and Pharmacy Faculty, Department of Pharmacy, 29 Nicolae
Jiga Street, RO-410028, Oradea, Romania d INCDO-INOE 2000, Research Institute for Analytical Instrumentation, 67 Donath Street, RO-
400293 Cluj-Napoca, Romania * Corresponding author: [email protected]
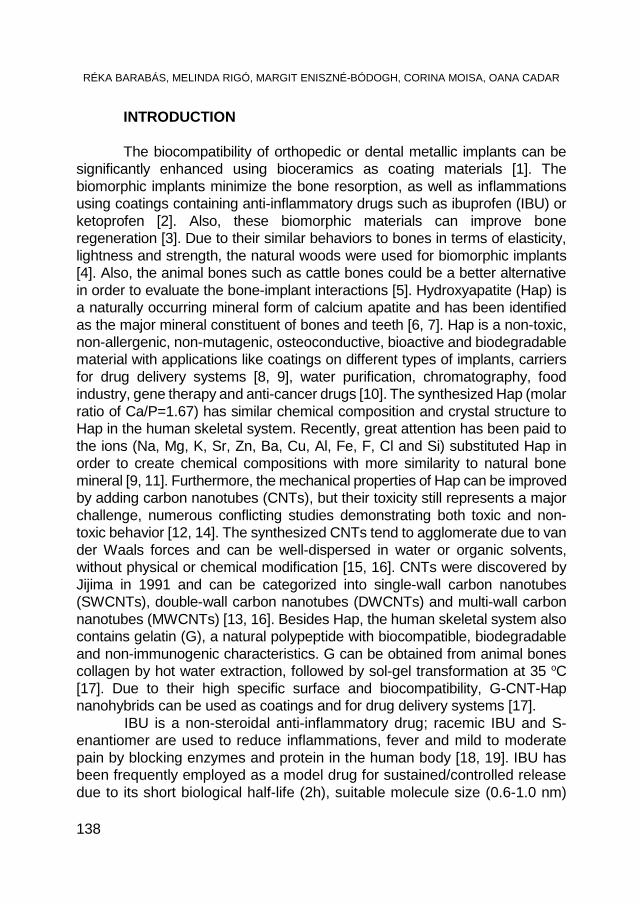
RÉKA BARABÁS, MELINDA RIGÓ, MARGIT ENISZNÉ-BÓDOGH, CORINA MOISA, OANA CADAR
138
INTRODUCTION The biocompatibility of orthopedic or dental metallic implants can be
significantly enhanced using bioceramics as coating materials [1]. The biomorphic implants minimize the bone resorption, as well as inflammations using coatings containing anti-inflammatory drugs such as ibuprofen (IBU) or ketoprofen [2]. Also, these biomorphic materials can improve bone regeneration [3]. Due to their similar behaviors to bones in terms of elasticity, lightness and strength, the natural woods were used for biomorphic implants [4]. Also, the animal bones such as cattle bones could be a better alternative in order to evaluate the bone-implant interactions [5]. Hydroxyapatite (Hap) is a naturally occurring mineral form of calcium apatite and has been identified as the major mineral constituent of bones and teeth [6, 7]. Hap is a non-toxic, non-allergenic, non-mutagenic, osteoconductive, bioactive and biodegradable material with applications like coatings on different types of implants, carriers for drug delivery systems [8, 9], water purification, chromatography, food industry, gene therapy and anti-cancer drugs [10]. The synthesized Hap (molar ratio of Ca/P=1.67) has similar chemical composition and crystal structure to Hap in the human skeletal system. Recently, great attention has been paid to the ions (Na, Mg, K, Sr, Zn, Ba, Cu, Al, Fe, F, Cl and Si) substituted Hap in order to create chemical compositions with more similarity to natural bone mineral [9, 11]. Furthermore, the mechanical properties of Hap can be improved by adding carbon nanotubes (CNTs), but their toxicity still represents a major challenge, numerous conflicting studies demonstrating both toxic and non-toxic behavior [12, 14]. The synthesized CNTs tend to agglomerate due to van der Waals forces and can be well-dispersed in water or organic solvents, without physical or chemical modification [15, 16]. CNTs were discovered by Jijima in 1991 and can be categorized into single-wall carbon nanotubes (SWCNTs), double-wall carbon nanotubes (DWCNTs) and multi-wall carbon nanotubes (MWCNTs) [13, 16]. Besides Hap, the human skeletal system also contains gelatin (G), a natural polypeptide with biocompatible, biodegradable and non-immunogenic characteristics. G can be obtained from animal bones collagen by hot water extraction, followed by sol-gel transformation at 35 oC [17]. Due to their high specific surface and biocompatibility, G-CNT-Hap nanohybrids can be used as coatings and for drug delivery systems [17].
IBU is a non-steroidal anti-inflammatory drug; racemic IBU and S-enantiomer are used to reduce inflammations, fever and mild to moderate pain by blocking enzymes and protein in the human body [18, 19]. IBU has been frequently employed as a model drug for sustained/controlled release due to its short biological half-life (2h), suitable molecule size (0.6-1.0 nm)
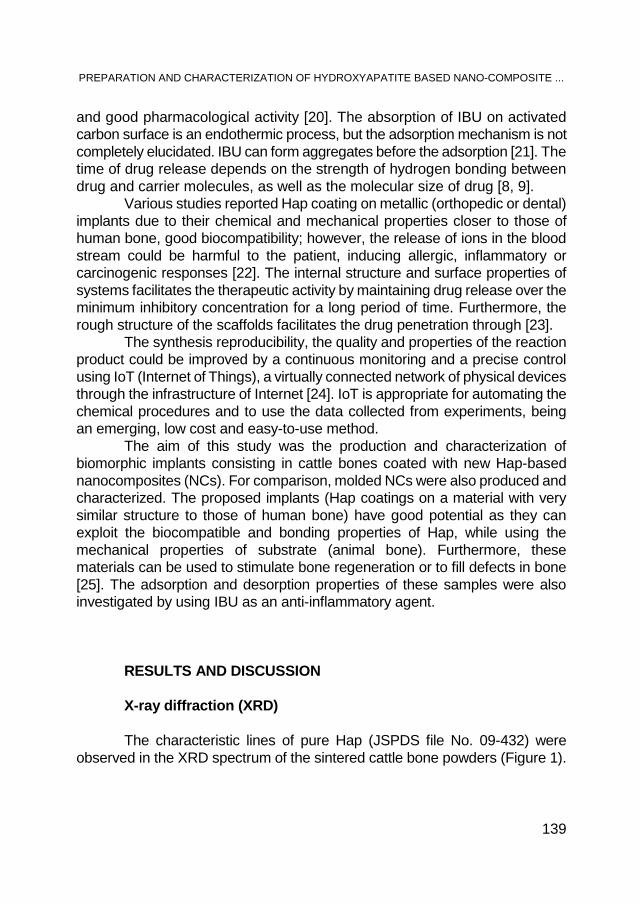
PREPARATION AND CHARACTERIZATION OF HYDROXYAPATITE BASED NANO-COMPOSITE ...
139
and good pharmacological activity [20]. The absorption of IBU on activated carbon surface is an endothermic process, but the adsorption mechanism is not completely elucidated. IBU can form aggregates before the adsorption [21]. The time of drug release depends on the strength of hydrogen bonding between drug and carrier molecules, as well as the molecular size of drug [8, 9].
Various studies reported Hap coating on metallic (orthopedic or dental) implants due to their chemical and mechanical properties closer to those of human bone, good biocompatibility; however, the release of ions in the blood stream could be harmful to the patient, inducing allergic, inflammatory or carcinogenic responses [22]. The internal structure and surface properties of systems facilitates the therapeutic activity by maintaining drug release over the minimum inhibitory concentration for a long period of time. Furthermore, the rough structure of the scaffolds facilitates the drug penetration through [23].
The synthesis reproducibility, the quality and properties of the reaction product could be improved by a continuous monitoring and a precise control using IoT (Internet of Things), a virtually connected network of physical devices through the infrastructure of Internet [24]. IoT is appropriate for automating the chemical procedures and to use the data collected from experiments, being an emerging, low cost and easy-to-use method.
The aim of this study was the production and characterization of biomorphic implants consisting in cattle bones coated with new Hap-based nanocomposites (NCs). For comparison, molded NCs were also produced and characterized. The proposed implants (Hap coatings on a material with very similar structure to those of human bone) have good potential as they can exploit the biocompatible and bonding properties of Hap, while using the mechanical properties of substrate (animal bone). Furthermore, these materials can be used to stimulate bone regeneration or to fill defects in bone [25]. The adsorption and desorption properties of these samples were also investigated by using IBU as an anti-inflammatory agent.
RESULTS AND DISCUSSION X-ray diffraction (XRD) The characteristic lines of pure Hap (JSPDS file No. 09-432) were
observed in the XRD spectrum of the sintered cattle bone powders (Figure 1).
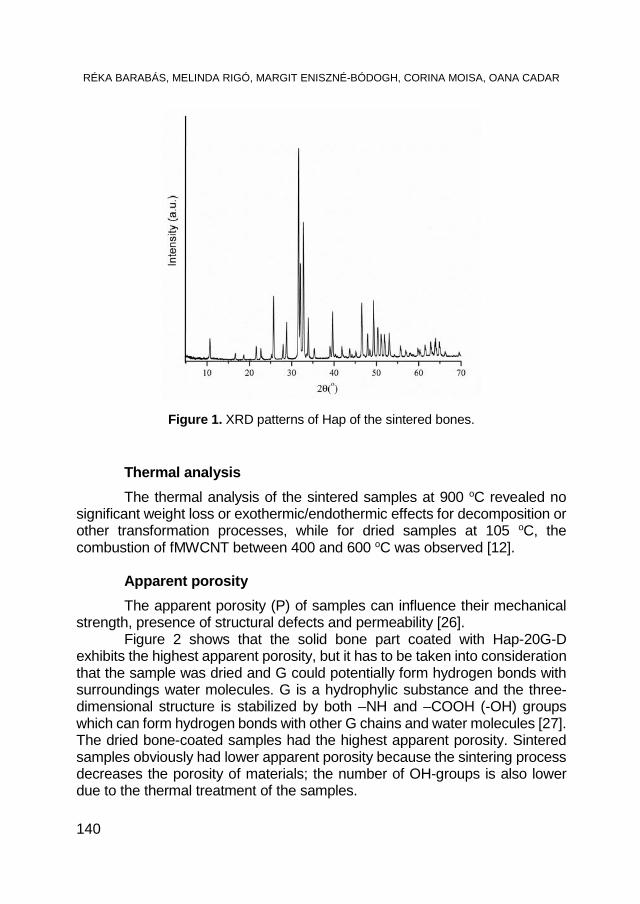
RÉKA BARABÁS, MELINDA RIGÓ, MARGIT ENISZNÉ-BÓDOGH, CORINA MOISA, OANA CADAR
140
Figure 1. XRD patterns of Hap of the sintered bones.
Thermal analysis
The thermal analysis of the sintered samples at 900 oC revealed no significant weight loss or exothermic/endothermic effects for decomposition or other transformation processes, while for dried samples at 105 oC, the combustion of fMWCNT between 400 and 600 oC was observed [12].
Apparent porosity
The apparent porosity (P) of samples can influence their mechanical strength, presence of structural defects and permeability [26].
Figure 2 shows that the solid bone part coated with Hap-20G-D exhibits the highest apparent porosity, but it has to be taken into consideration that the sample was dried and G could potentially form hydrogen bonds with surroundings water molecules. G is a hydrophylic substance and the three-dimensional structure is stabilized by both –NH and –COOH (-OH) groups which can form hydrogen bonds with other G chains and water molecules [27]. The dried bone-coated samples had the highest apparent porosity. Sintered samples obviously had lower apparent porosity because the sintering process decreases the porosity of materials; the number of OH-groups is also lower due to the thermal treatment of the samples.
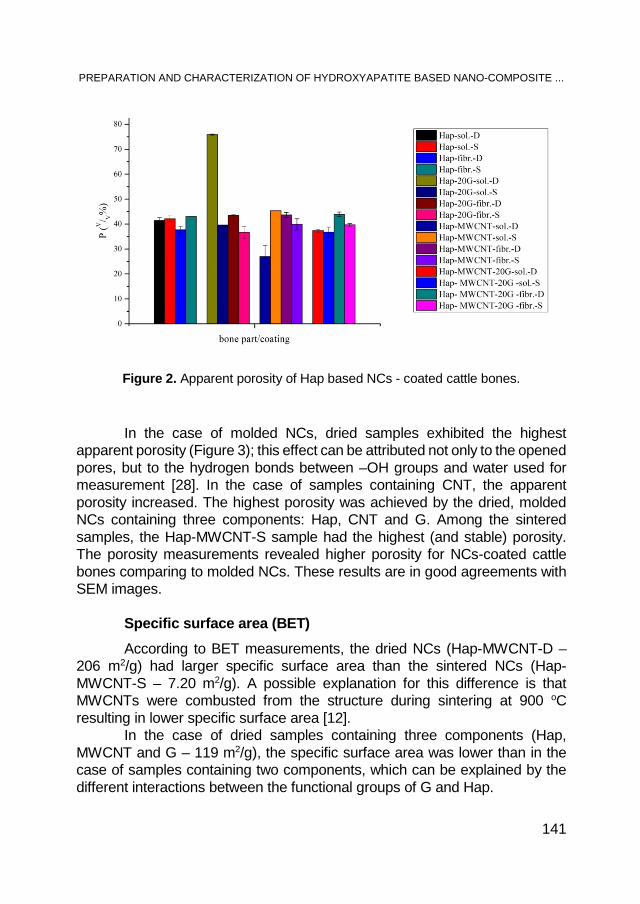
PREPARATION AND CHARACTERIZATION OF HYDROXYAPATITE BASED NANO-COMPOSITE ...
141
Figure 2. Apparent porosity of Hap based NCs - coated cattle bones.
In the case of molded NCs, dried samples exhibited the highest apparent porosity (Figure 3); this effect can be attributed not only to the opened pores, but to the hydrogen bonds between –OH groups and water used for measurement [28]. In the case of samples containing CNT, the apparent porosity increased. The highest porosity was achieved by the dried, molded NCs containing three components: Hap, CNT and G. Among the sintered samples, the Hap-MWCNT-S sample had the highest (and stable) porosity. The porosity measurements revealed higher porosity for NCs-coated cattle bones comparing to molded NCs. These results are in good agreements with SEM images.
Specific surface area (BET)
According to BET measurements, the dried NCs (Hap-MWCNT-D – 206 m2/g) had larger specific surface area than the sintered NCs (Hap-MWCNT-S – 7.20 m2/g). A possible explanation for this difference is that MWCNTs were combusted from the structure during sintering at 900 oC resulting in lower specific surface area [12].
In the case of dried samples containing three components (Hap, MWCNT and G – 119 m2/g), the specific surface area was lower than in the case of samples containing two components, which can be explained by the different interactions between the functional groups of G and Hap.
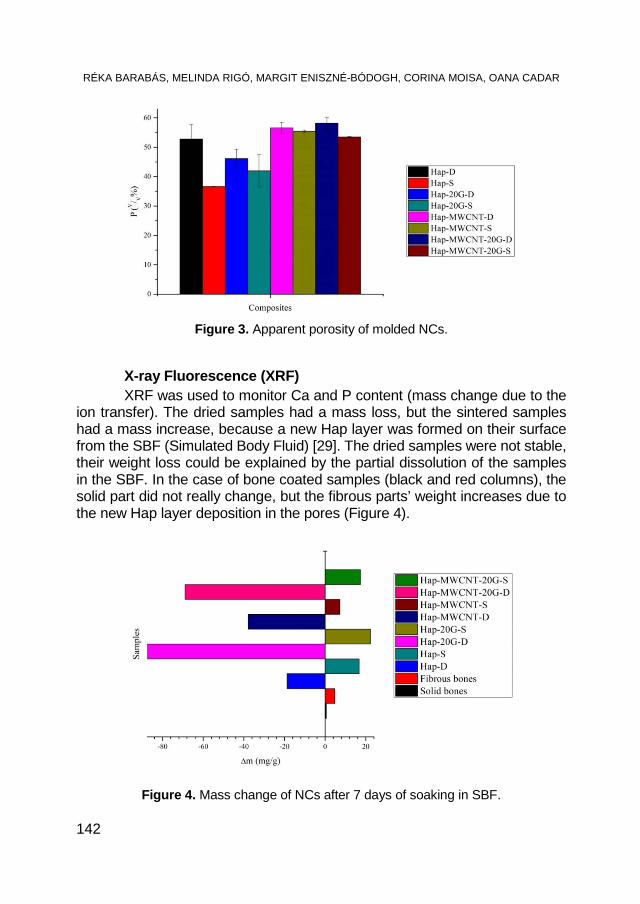
RÉKA BARABÁS, MELINDA RIGÓ, MARGIT ENISZNÉ-BÓDOGH, CORINA MOISA, OANA CADAR
142
Figure 3. Apparent porosity of molded NCs.
X-ray Fluorescence (XRF) XRF was used to monitor Ca and P content (mass change due to the
ion transfer). The dried samples had a mass loss, but the sintered samples had a mass increase, because a new Hap layer was formed on their surface from the SBF (Simulated Body Fluid) [29]. The dried samples were not stable, their weight loss could be explained by the partial dissolution of the samples in the SBF. In the case of bone coated samples (black and red columns), the solid part did not really change, but the fibrous parts’ weight increases due to the new Hap layer deposition in the pores (Figure 4).
Figure 4. Mass change of NCs after 7 days of soaking in SBF.
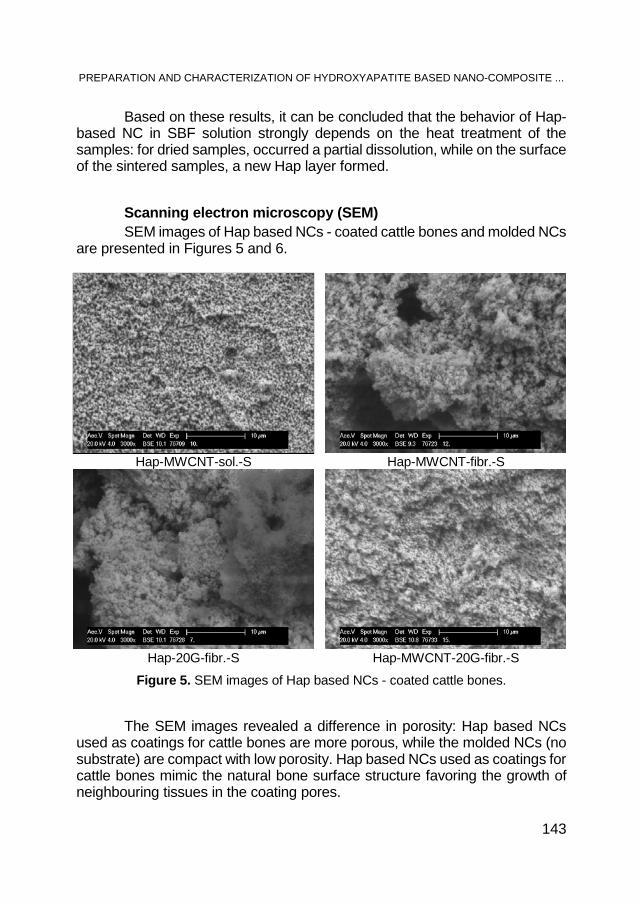
PREPARATION AND CHARACTERIZATION OF HYDROXYAPATITE BASED NANO-COMPOSITE ...
143
Based on these results, it can be concluded that the behavior of Hap-based NC in SBF solution strongly depends on the heat treatment of the samples: for dried samples, occurred a partial dissolution, while on the surface of the sintered samples, a new Hap layer formed.
Scanning electron microscopy (SEM) SEM images of Hap based NCs - coated cattle bones and molded NCs
are presented in Figures 5 and 6.
Hap-MWCNT-sol.-S Hap-MWCNT-fibr.-S
Hap-20G-fibr.-S Hap-MWCNT-20G-fibr.-S
Figure 5. SEM images of Hap based NCs - coated cattle bones.
The SEM images revealed a difference in porosity: Hap based NCs used as coatings for cattle bones are more porous, while the molded NCs (no substrate) are compact with low porosity. Hap based NCs used as coatings for cattle bones mimic the natural bone surface structure favoring the growth of neighbouring tissues in the coating pores.
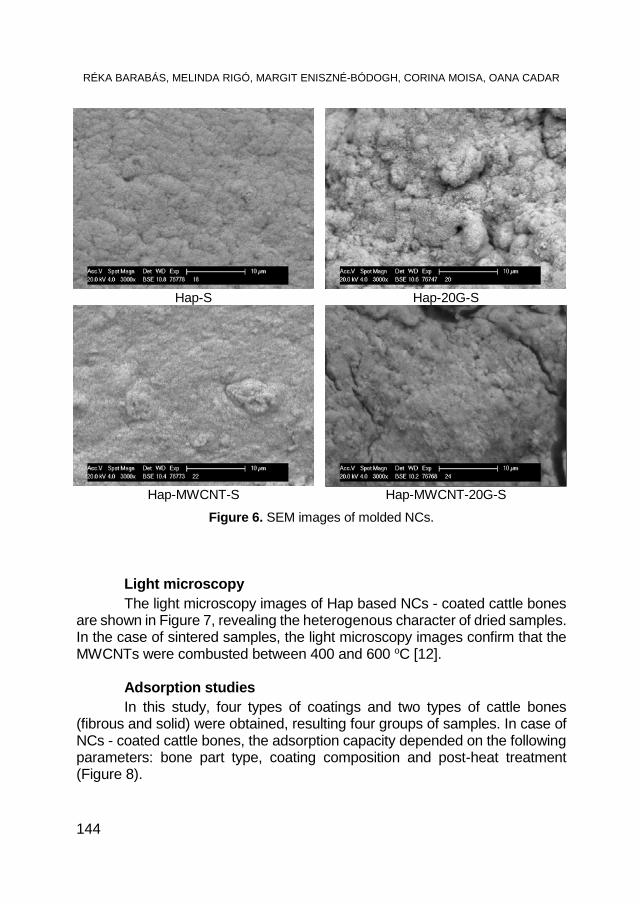
RÉKA BARABÁS, MELINDA RIGÓ, MARGIT ENISZNÉ-BÓDOGH, CORINA MOISA, OANA CADAR
144
Hap-S Hap-20G-S
Hap-MWCNT-S Hap-MWCNT-20G-S
Figure 6. SEM images of molded NCs.
Light microscopy The light microscopy images of Hap based NCs - coated cattle bones
are shown in Figure 7, revealing the heterogenous character of dried samples. In the case of sintered samples, the light microscopy images confirm that the MWCNTs were combusted between 400 and 600 oC [12].
Adsorption studies In this study, four types of coatings and two types of cattle bones
(fibrous and solid) were obtained, resulting four groups of samples. In case of NCs - coated cattle bones, the adsorption capacity depended on the following parameters: bone part type, coating composition and post-heat treatment (Figure 8).
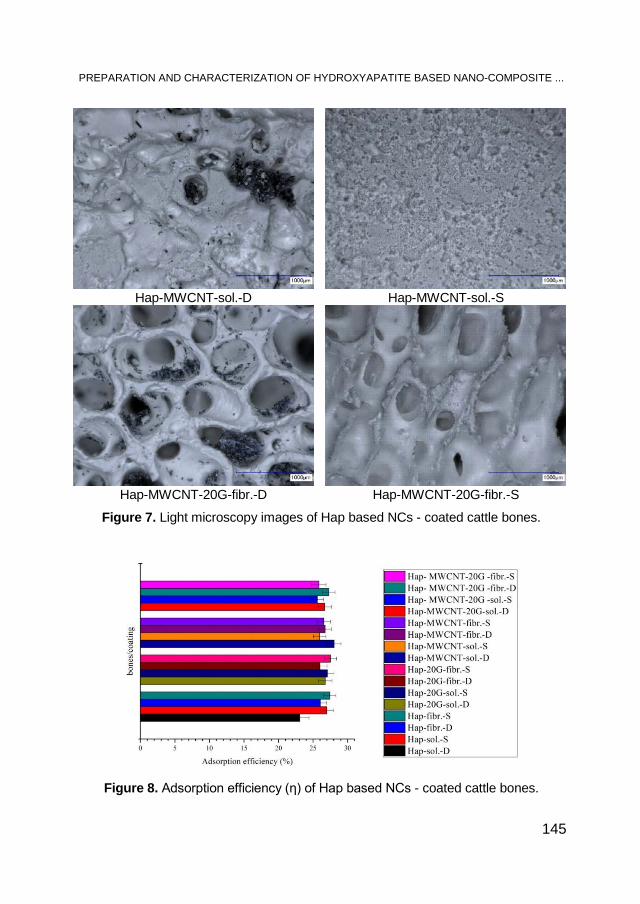
PREPARATION AND CHARACTERIZATION OF HYDROXYAPATITE BASED NANO-COMPOSITE ...
145
Hap-MWCNT-sol.-D Hap-MWCNT-sol.-S
Hap-MWCNT-20G-fibr.-D Hap-MWCNT-20G-fibr.-S
Figure 7. Light microscopy images of Hap based NCs - coated cattle bones.
Figure 8. Adsorption efficiency (η) of Hap based NCs - coated cattle bones.
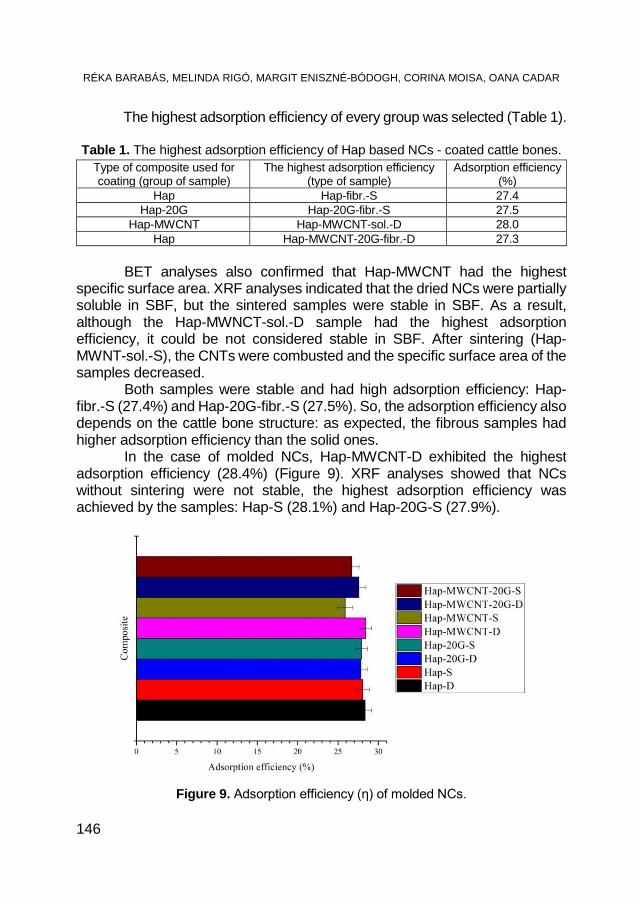
RÉKA BARABÁS, MELINDA RIGÓ, MARGIT ENISZNÉ-BÓDOGH, CORINA MOISA, OANA CADAR
146
The highest adsorption efficiency of every group was selected (Table 1). Table 1. The highest adsorption efficiency of Hap based NCs - coated cattle bones.
Type of composite used for coating (group of sample)
The highest adsorption efficiency (type of sample)
Adsorption efficiency (%)
Hap Hap-fibr.-S 27.4 Hap-20G Hap-20G-fibr.-S 27.5
Hap-MWCNT Hap-MWCNT-sol.-D 28.0 Hap Hap-MWCNT-20G-fibr.-D 27.3
BET analyses also confirmed that Hap-MWCNT had the highest
specific surface area. XRF analyses indicated that the dried NCs were partially soluble in SBF, but the sintered samples were stable in SBF. As a result, although the Hap-MWNCT-sol.-D sample had the highest adsorption efficiency, it could be not considered stable in SBF. After sintering (Hap-MWNT-sol.-S), the CNTs were combusted and the specific surface area of the samples decreased.
Both samples were stable and had high adsorption efficiency: Hap-fibr.-S (27.4%) and Hap-20G-fibr.-S (27.5%). So, the adsorption efficiency also depends on the cattle bone structure: as expected, the fibrous samples had higher adsorption efficiency than the solid ones.
In the case of molded NCs, Hap-MWCNT-D exhibited the highest adsorption efficiency (28.4%) (Figure 9). XRF analyses showed that NCs without sintering were not stable, the highest adsorption efficiency was achieved by the samples: Hap-S (28.1%) and Hap-20G-S (27.9%).
Figure 9. Adsorption efficiency (η) of molded NCs.
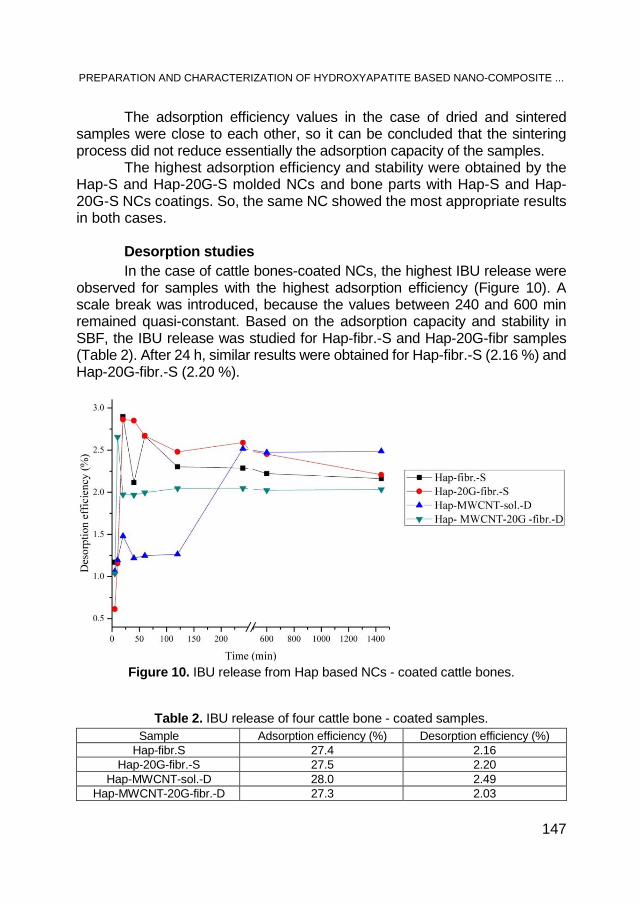
PREPARATION AND CHARACTERIZATION OF HYDROXYAPATITE BASED NANO-COMPOSITE ...
147
The adsorption efficiency values in the case of dried and sintered samples were close to each other, so it can be concluded that the sintering process did not reduce essentially the adsorption capacity of the samples.
The highest adsorption efficiency and stability were obtained by the Hap-S and Hap-20G-S molded NCs and bone parts with Hap-S and Hap-20G-S NCs coatings. So, the same NC showed the most appropriate results in both cases.
Desorption studies In the case of cattle bones-coated NCs, the highest IBU release were
observed for samples with the highest adsorption efficiency (Figure 10). A scale break was introduced, because the values between 240 and 600 min remained quasi-constant. Based on the adsorption capacity and stability in SBF, the IBU release was studied for Hap-fibr.-S and Hap-20G-fibr samples (Table 2). After 24 h, similar results were obtained for Hap-fibr.-S (2.16 %) and Hap-20G-fibr.-S (2.20 %).
Figure 10. IBU release from Hap based NCs - coated cattle bones.
Table 2. IBU release of four cattle bone - coated samples. Sample Adsorption efficiency (%) Desorption efficiency (%)
Hap-fibr.S 27.4 2.16 Hap-20G-fibr.-S 27.5 2.20
Hap-MWCNT-sol.-D 28.0 2.49 Hap-MWCNT-20G-fibr.-D 27.3 2.03

RÉKA BARABÁS, MELINDA RIGÓ, MARGIT ENISZNÉ-BÓDOGH, CORINA MOISA, OANA CADAR
148
Based on XRF and adsorption (stability in SBF) results, Hap-S, Hap-20G-S, Hap-MWCNT-S, and Hap-MWCNT-20G-S were chosen as relevant to investigate the desorption efficiency (Figure 11). A scale break between 600 and 1440 min on x-axis was introduced, because the values at 120, 240 and 360 min remained quasi-constant. Hap-20G-S had the slowest IBU release (retard effect), after 24 h, only 1.57% of IBU was desorbed.
Figure 11. Desorption efficiency of molded NCs.
Regarding the desorption process, the difference in behavior of bone and boneless samples can be explained by the different surface morphology on which IBU was adsorbed. The different surface morphology was also confirmed by SEM images.
For the molded NCs, a rapid decrease of desorption after 5 to 10 h was observed, after which the process stabilized and increased steadily. This variation can be attributed to equilibrium processes in the solvent, desorption being an oscillating process until reaching equilibrium [35].
Table 3 shows a comparison between the adsorption and desorption efficiency of both types of samples (molded NCs and cattle bones with coating).
PREPARATION AND CHARACTERIZATION OF HYDROXYAPATITE BASED NANO-COMPOSITE ...
149
Table 3. The best results for IBU release – molded NCs. Sample Adsorption efficiency (%) Desorption efficiency (%)
Hap-fibr.S 27.4 2.16 Hap-20G-fibr.-S 27.5 2.21
Hap-S 28.1 2.68 Hap-20G-S 27.9 1.58
Hap-MWCNT-S 25.9 3.20 Hap-MWCNT-20G-S 26.7 2.59
The best results (high adsorption efficiency and slow release - low
desorption capacity) were obtained for molded and sintered Hap-20G-S NCs. In the case of Hap based NCs - coated fibrous cattle bones, a low desorption capacity due to the porous character of bones was observed.
CONCLUSIONS The purpose of this study was the preparation and characterization of
NCs containing Hap, MWCNT and G in different ratios and their application as coatings for cattle bones (solid and fibrous) and for comparison molded NCs were also prepared. In the case of samples dried at 105 oC, the presence of CNTs increased the absorption capacity, while in the case of samples sintered at 900 oC, CNTs were combusted at 400-600 oC, resulting in a decrease of the absorption capacity. However, the sintered samples were more stable in SBF than dried ones. As a result, future studies to find the optimal sintering temperature to provide both the presence of CNTs and a good stability of samples in SBF are required. HAP-S and Hap-20G-S samples (NCs - coated cattle bones and molded NCs) presented high adsorption capacity. According to porosity measurements and SEM images, the NCs - coated cattle bones exhibited higher porosity than molded NCs. Comparing the obtained results for NCs - coated cattle bones and molded NCs, it can be concluded that the quality of coating depends not only on the coated material but also on the quality and structure of support (solid or fibrous). The studied NCs are materials with promising applications in engineering of bone implants due to their excellent chemical and structural properties.
EXPERIMENTAL SECTION Materials All reagents were of analytical grade (Merck, Germany) and used
without further purification. Pepsin from porcine gastric mucosa (P7125) and trypsin from porcine pancreas (T7409) were purchased from Sigma Aldrich
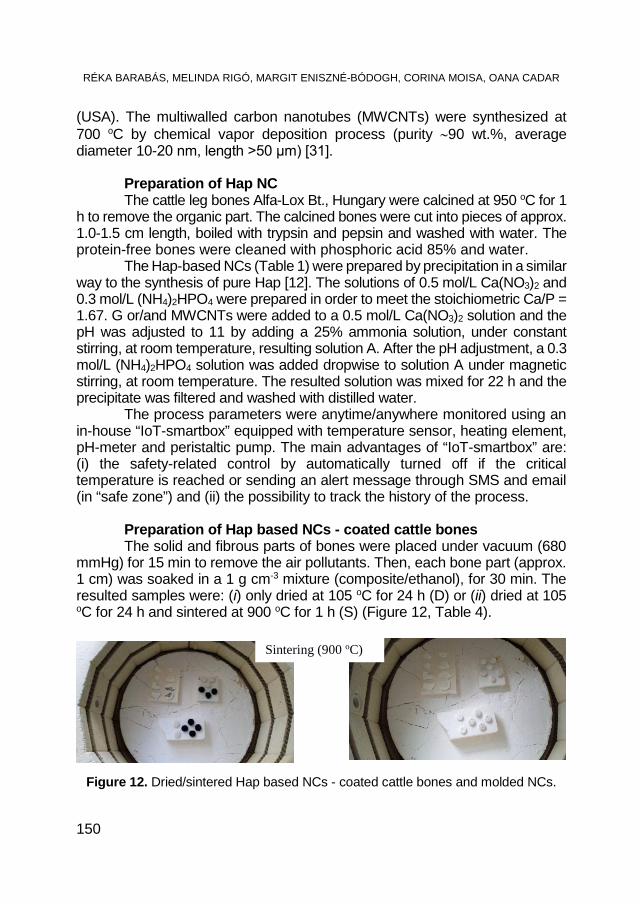
RÉKA BARABÁS, MELINDA RIGÓ, MARGIT ENISZNÉ-BÓDOGH, CORINA MOISA, OANA CADAR
150
(USA). The multiwalled carbon nanotubes (MWCNTs) were synthesized at 700 oC by chemical vapor deposition process (purity ∼90 wt.%, average diameter 10-20 nm, length >50 μm) [31].
Preparation of Hap NC The cattle leg bones Alfa-Lox Bt., Hungary were calcined at 950 oC for 1
h to remove the organic part. The calcined bones were cut into pieces of approx. 1.0-1.5 cm length, boiled with trypsin and pepsin and washed with water. The protein-free bones were cleaned with phosphoric acid 85% and water.
The Hap-based NCs (Table 1) were prepared by precipitation in a similar way to the synthesis of pure Hap [12]. The solutions of 0.5 mol/L Ca(NO3)2 and 0.3 mol/L (NH4)2HPO4 were prepared in order to meet the stoichiometric Ca/P = 1.67. G or/and MWCNTs were added to a 0.5 mol/L Ca(NO3)2 solution and the pH was adjusted to 11 by adding a 25% ammonia solution, under constant stirring, at room temperature, resulting solution A. After the pH adjustment, a 0.3 mol/L (NH4)2HPO4 solution was added dropwise to solution A under magnetic stirring, at room temperature. The resulted solution was mixed for 22 h and the precipitate was filtered and washed with distilled water.
The process parameters were anytime/anywhere monitored using an in-house “IoT-smartbox” equipped with temperature sensor, heating element, pH-meter and peristaltic pump. The main advantages of “IoT-smartbox” are: (i) the safety-related control by automatically turned off if the critical temperature is reached or sending an alert message through SMS and email (in “safe zone”) and (ii) the possibility to track the history of the process.
Preparation of Hap based NCs - coated cattle bones The solid and fibrous parts of bones were placed under vacuum (680
mmHg) for 15 min to remove the air pollutants. Then, each bone part (approx. 1 cm) was soaked in a 1 g cm-3 mixture (composite/ethanol), for 30 min. The resulted samples were: (i) only dried at 105 oC for 24 h (D) or (ii) dried at 105 oC for 24 h and sintered at 900 oC for 1 h (S) (Figure 12, Table 4).
Figure 12. Dried/sintered Hap based NCs - coated cattle bones and molded NCs.
Sintering (900 oC)
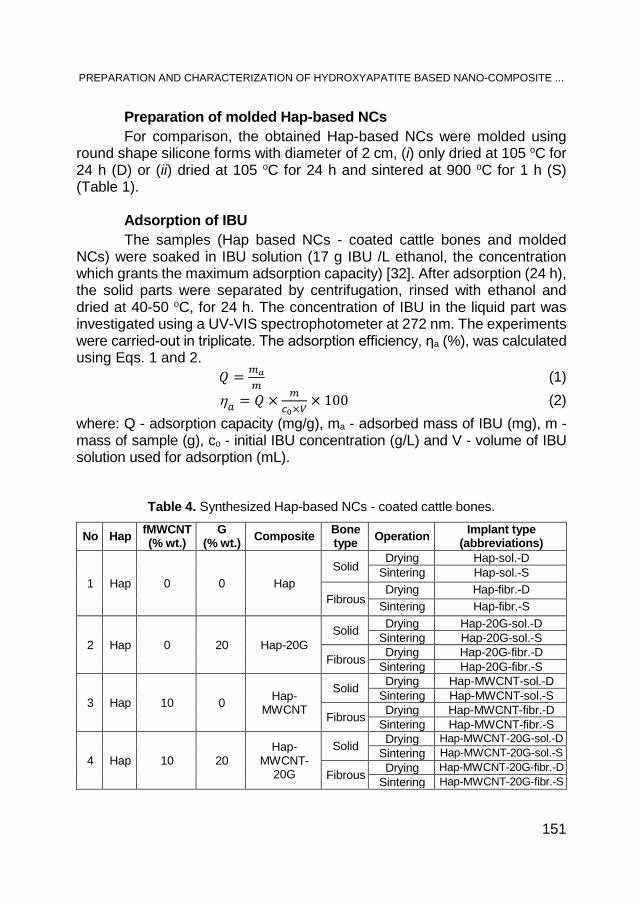
PREPARATION AND CHARACTERIZATION OF HYDROXYAPATITE BASED NANO-COMPOSITE ...
151
Preparation of molded Hap-based NCs For comparison, the obtained Hap-based NCs were molded using
round shape silicone forms with diameter of 2 cm, (i) only dried at 105 oC for 24 h (D) or (ii) dried at 105 oC for 24 h and sintered at 900 oC for 1 h (S) (Table 1).
Adsorption of IBU The samples (Hap based NCs - coated cattle bones and molded
NCs) were soaked in IBU solution (17 g IBU /L ethanol, the concentration which grants the maximum adsorption capacity) [32]. After adsorption (24 h), the solid parts were separated by centrifugation, rinsed with ethanol and dried at 40-50 oC, for 24 h. The concentration of IBU in the liquid part was investigated using a UV-VIS spectrophotometer at 272 nm. The experiments were carried-out in triplicate. The adsorption efficiency, ηa (%), was calculated using Eqs. 1 and 2.
𝑄𝑄 = 𝑚𝑚𝑎𝑎𝑚𝑚
(1) η𝑎𝑎 = 𝑄𝑄 × 𝑚𝑚
𝑐𝑐0×𝑉𝑉× 100 (2)
where: Q - adsorption capacity (mg/g), ma - adsorbed mass of IBU (mg), m - mass of sample (g), co - initial IBU concentration (g/L) and V - volume of IBU solution used for adsorption (mL).
Table 4. Synthesized Hap-based NCs - coated cattle bones.
No Hap fMWCNT (% wt.)
G (% wt.) Composite Bone
type Operation Implant type (abbreviations)
1 Hap 0 0 Hap Solid
Drying Hap-sol.-D Sintering Hap-sol.-S
Fibrous Drying Hap-fibr.-D
Sintering Hap-fibr.-S
2 Hap 0 20 Hap-20G Solid Drying Hap-20G-sol.-D
Sintering Hap-20G-sol.-S
Fibrous Drying Hap-20G-fibr.-D Sintering Hap-20G-fibr.-S
3 Hap 10 0 Hap-MWCNT
Solid Drying Hap-MWCNT-sol.-D Sintering Hap-MWCNT-sol.-S
Fibrous Drying Hap-MWCNT-fibr.-D Sintering Hap-MWCNT-fibr.-S
4 Hap 10 20 Hap-
MWCNT-20G
Solid Drying Hap-MWCNT-20G-sol.-D Sintering Hap-MWCNT-20G-sol.-S
Fibrous Drying Hap-MWCNT-20G-fibr.-D Sintering Hap-MWCNT-20G-fibr.-S
RÉKA BARABÁS, MELINDA RIGÓ, MARGIT ENISZNÉ-BÓDOGH, CORINA MOISA, OANA CADAR
152
Desorption of IBU The release of IBU was investigated by soaking each sample in 20 mL
SBF (pH=7.4) at room temperature. SBF was prepared according to Kokubo method [33, 34]. 2 mL sample was removed at different time intervals, t (5, 10, 20, 30, 60, 120, 240, 360, 600 and 1440 min) and immediately replaced with an equal volume of fresh SBF. The amount of IBU released was measured using a UV-VIS spectrophotometer at 224.5 nm. The experiments were carried-out in triplicate. The desorption efficiency, ηd (%), was calculated using the amount of IBU adsorbed and the amount of IBU released in SBF.
Characterization XRD analysis was performed at room temperature, using a PW3710
X’Pert X-ray diffractometer (Philips, Nederlands), operating at 40 kV, 30 mA with CuKα radiation (λ=1.542 Å);
The thermal analysis was performed using a Q-1500 D Derivatograph (MOM, Hungary) in Pt crucibles using α-Al2O3 as inert material, by heating from room temperature to 1000 oC (5 oC/min);
The apparent porosity (P), that represents pores accessible to the fluid used in the test, was determined using the Archimedes method based on the principle that a solid with certain bulk immersed in a liquid displaces an amount of liquid equal to the bulk of the liquid when immersed: The following equation was used to calculate the apparent porosity (open pores).
𝑃𝑃 = �𝑚𝑚𝑠𝑠𝑎𝑎𝑠𝑠𝑚𝑚𝑑𝑑𝑑𝑑
− 𝑚𝑚𝑠𝑠𝑎𝑎𝑠𝑠𝑚𝑚𝑠𝑠𝑠𝑠𝑠𝑠
�× 100 (5)
where: mdr - the mass of the dry sample (g), msat - the mass of the sample saturated with liquid (g) and msub - the mass of the sample submerged in liquid (g) [35];
The specific surface area was determined using Asap 2000 equipment (Micromeritics Instruments Inc., USA) from data on nitrogen adsorption; The morphological characteristics of NCs was examined by a XL30-ESEM microscope (Philips, Netherlands) at 20 kV using a Keyence-VHX 2000 Light microscope;
The mass change of NCs was investigated by XRF. The samples were soaked in SBF for 7 days, at 37 oC and removed after 1, 3 and 7 days. The Ca and P release was monitored using an energy dispersive X-ray Fluorescence (XRF) MiniPal4, PANalytical operating at 14 kV, 202 uA. The Ca and P content (mass change due to the ion transfer) was calculated considering the Ca and P content of SBF;
The IBU adsorption-desorption studies were performed using a V-560 UV-VIS spectrophotometer (Jasco, Japan).

PREPARATION AND CHARACTERIZATION OF HYDROXYAPATITE BASED NANO-COMPOSITE ...
153
ACKNOWLEDGMENT M.R. greatly acknowledges the support of the EU Erasmus
Programme.
R E F E R E N C E S
1. O. Gryshkov, N.I. Klyui, V.P. Temchenko, V.S. Kyselov, A. Chatterjee, A.E. Belyaev, L. Lauterboeck, D. Iarmolenko, B. Glasmacher, Materials Science and Engineering C, 2016, 68, 143.
2. A.I. Pearce, R.G. Richards, S. Milz, S.G. Pearce, European Cells & Materials, 2007, 13, 1.
3. Y. Li, S.K. Chen, L. Li, L. Qin, X.L. Wang, Y.X. Lai, Journal of Orthopaedic Research, 2015, 3, 95.
4. G. Filardo, E. Kon, A. Tampieri, R. Cabezas-Rodriguez, A. Di Martino, M. Fini, G. Giavaresi, M. Lelli, J. Martinez Fernandez, L. Martini, J. Ramirez-Rico, F. Salamanna, M. Sandri, S. Sprio, M. Marcacci, Tissue Engineering Part A, 2014, 20, 763.
5. N. Baldini, M. De Sanctis, M. Ferrari, Dental Materials, 2011, 27, 61. 6. D. McConnell, “Carbonate Apatites”, pp. 39-47 in Apatite: Its crystal chemistry,
mineralogy, utilization, and geologic and biologic occurrences, Springer-Verlag, New York, 1973.
7. T. Sakae, H. Nakada, J.P. LeGeros, Journal of Hard Tissue Biology, 2015, 24 111.
8. K. Tomoda, H. Ariizumi, T. Nakaji, L. Makino, Colloids and Surfaces B, 2010, 76 226.
9. M. Cziko, E.S. Bogya, C. Paizs, G. Katona, Z. Konya, A. Kukovecz, R. Barabas, Materials Chemistry and Physics, 2016, 180, 314.
10. C.F. Dai, S.P. Li, X.D. Li, Colloids and Surfaces B, 2015, 136, 262. 11. R. Barabas, M. Cziko, I. Dekany, L. Bizo, E.S. Bogya, Chemical Papers, 2013,
67, 1414. 12. R. Barabas, G. Katona, E.S. Bogya, M.V. Diudea, A. Szentes, B. Zsirka, J.
Kovacs, L. Kekedy-Nagy, M., Cziko, Ceramics International, 2015, 41, 12717. 13. S. Dadras, V.M. Farahani, Physica B, 2015, 477, 94. 14. D. Lahiri, S. Ghosh, A. Agarwal, Materials Science and Engineering C, 2012, 32,
1727. 15. A. Abrishamchian, T. Hooshmand, M. Mohammadi, F. Najafi, Materials Science
and Engineering C, 2013, 33, 2002. 16. D. Gopi, E. Shinyjoy, M. Sekar, M. Surendiran, L. Kavitha, T.S. Sampath Kumar,
Corrosion Science, 2013, 73, 321.
RÉKA BARABÁS, MELINDA RIGÓ, MARGIT ENISZNÉ-BÓDOGH, CORINA MOISA, OANA CADAR
154
17. I.K. Yoon, J.Y. Hwang, J.W. Seo, W.C. Jang, H.W. Kim, U.S. Sing, Carbon, 2014, 77, 379.
18. S.D. Bergese, K. Candiotti, S.S. Ayad, S. Soghomonyan, T.J. Gan, Clinical Therapeutics, 2015, 37, 360.
19. T.J. Gan, K. Candiotti, A. Turan, A. Buvanendran, B.K. Philip, E.R. Viscusi, S. Soghomonyan, Clinical Therapeutics, 2015, 37, 368.
20. M. Oner, E. Yetiz, E. Ay, U. Uysal, Ceramics International, 2011, 37, 2117. 21. D. Musmarra, M. Prisciandaro, M. Capocelli, D. Karatza, P., Iovino, S. Canzano,
A. Lancia, Ultrasonics Sonochemistry, 2016, 29, 76. 22. B.G.X. Zhang, D.E. Myers, G.G. Wallace, M. Brandt, P.F.M. Choong,
International Journal of Molecular Sciences, 2014, 15, 11878. 23. P. Diaz-Rodriguez, A. Perez-Estevez, R. Seoane, P. Gonzalez, J. Serra, M.
Landin, ISRN Pharmaceutics, 2013, Article ID 104529, 8 pages. 24. E. Brown, "Who Needs the Internet of Things?", Linux.com, Retrieved 23 October
2016. 25. S.T. Ho, D.W. Hutmacher, Biomaterials, 2006, 27, 1362. 26. P. Spulveda, F.S. Ortega, M.D.M. Innocentini, V.C. Pandolfelli, Journal of the
American Ceramic Society, 2000, 83, 3021. 27. A. Duconseille, T. Astruc, N. Quintana, F. Meersman, V. Sante-Lhoutellier, Food
Hydrocolloids, 2015, 43, 360. 28. Z.C. Chen, X.L. Zhang, K. Zhou, H. Cai, C.Q. Liu, Advances in Applied Ceramics,
2015,114, 183. 29. P. Sooksaen, N. Pengusawan, S. Karawatthanaworrakul, S. Pianpraditkul,
Advances in Condensed Matter Physics, 2015, Article ID 158582, 9 pages. 30. G. Neupane, R.J. Donahoe, Y. Arai, Chemical Geology, 2014, 368, 31. 31. A. Szentes, G. Horvath, C., Varga, G. Harrach, Hungarian Journal of Industry and
Chemistry, 2011, 39, 113. 32. E. Chevalier, M. Viana, S. Cazalbou, L. Makein, J. Dubois, D. Chulia, Acta
Biomaterialia, 2010, 6, 266. 33. T. Kokubo, H. Kushitani, S. Sakka, T. Kitsugi, T. Yamamuro, Journal of
Biomedical Materials Research, 1990, 24, 721. 34. C. Moisa, L.G. Vicas, M. Ganea, E.A. Levei, O. Cadar, C. Berce, Farmacia, 2018,
66, 176. 35. S.T. Ho, D.W. Hutmacher, Biomaterials, 2006, 27, 1362.
STUDIA UBB CHEMIA, LXIII, 3, 2018 (p. 155-170) (RECOMMENDED CITATION) DOI:10.24193/subbchem.2018.3.12
IONIC EXCHANGE STUDIES FOR CORRECTING WATER QUALITY INDICATORS
SILVIA BURCĂa, CERASELLA INDOLEANa∗
ABSTRACT. For this study, a natural ionic exchanger (zeolitic volcanic tuff) and a synthetic anionic exchanger were considered, to remove iron and manganese ions, reduce COD, chlorides and conductivity values from water. It was worked with a zeolitic volcanic tuff cropped out from Macicas area, Romania, and a synthetic anionic exchanger Amberlite A-21. A groundwater and surface sources of drinking water from Ialomiţa-Muntenia (Romania) catchment were analysed, with iron and manganese contents (0.2527–0.3059 mg Fetot/L, 0.0234 mg Mn/L), COD (14.530–17.064 mg KMnO4/L), chlorides contents (170.95 mg/L), pH=7.70, and with electrical conductivity of 1433-1451 µS/cm. The ionic exchange process has been achieved in batch and continuous-flow conditions. The process was realized in static regime, with good results, the highest efficiencies for iron and manganese ions removal being 99% and 79-95%, respectively. Keywords: municipal water source, food water, zeolitic volcanic tuff, ionic exchange
INTRODUCTION The availability of adequate freshwater resources, is vital to food safety
and production (primary such as irrigation, livestock watering, aquaculture and processing: ingredient, transport medium and hygiene aid) [1].
If the water is drinkable, then, it could be accepted for all food uses [2]. However, not all uses require that water to be of this standards and, where it is possible, it can use other sources of water or reuse water. Consequently, the water quality requirements will need to be appropriately tailored [3-6].
a Babeş-Bolyai University, Faculty of Chemistry and Chemical Engineering, 11 Arany Janos
str., RO-400028, Cluj-Napoca, Romania ∗Corresponding author: [email protected]
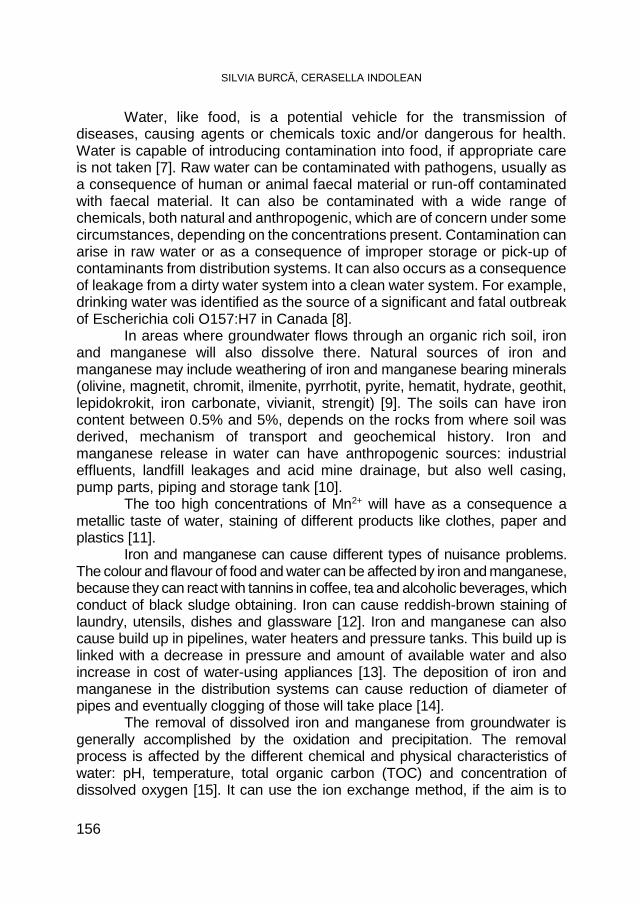
SILVIA BURCĂ, CERASELLA INDOLEAN
156
Water, like food, is a potential vehicle for the transmission of diseases, causing agents or chemicals toxic and/or dangerous for health. Water is capable of introducing contamination into food, if appropriate care is not taken [7]. Raw water can be contaminated with pathogens, usually as a consequence of human or animal faecal material or run-off contaminated with faecal material. It can also be contaminated with a wide range of chemicals, both natural and anthropogenic, which are of concern under some circumstances, depending on the concentrations present. Contamination can arise in raw water or as a consequence of improper storage or pick-up of contaminants from distribution systems. It can also occurs as a consequence of leakage from a dirty water system into a clean water system. For example, drinking water was identified as the source of a significant and fatal outbreak of Escherichia coli O157:H7 in Canada [8].
In areas where groundwater flows through an organic rich soil, iron and manganese will also dissolve there. Natural sources of iron and manganese may include weathering of iron and manganese bearing minerals (olivine, magnetit, chromit, ilmenite, pyrrhotit, pyrite, hematit, hydrate, geothit, lepidokrokit, iron carbonate, vivianit, strengit) [9]. The soils can have iron content between 0.5% and 5%, depends on the rocks from where soil was derived, mechanism of transport and geochemical history. Iron and manganese release in water can have anthropogenic sources: industrial effluents, landfill leakages and acid mine drainage, but also well casing, pump parts, piping and storage tank [10].
The too high concentrations of Mn2+ will have as a consequence a metallic taste of water, staining of different products like clothes, paper and plastics [11].
Iron and manganese can cause different types of nuisance problems. The colour and flavour of food and water can be affected by iron and manganese, because they can react with tannins in coffee, tea and alcoholic beverages, which conduct of black sludge obtaining. Iron can cause reddish-brown staining of laundry, utensils, dishes and glassware [12]. Iron and manganese can also cause build up in pipelines, water heaters and pressure tanks. This build up is linked with a decrease in pressure and amount of available water and also increase in cost of water-using appliances [13]. The deposition of iron and manganese in the distribution systems can cause reduction of diameter of pipes and eventually clogging of those will take place [14].
The removal of dissolved iron and manganese from groundwater is generally accomplished by the oxidation and precipitation. The removal process is affected by the different chemical and physical characteristics of water: pH, temperature, total organic carbon (TOC) and concentration of dissolved oxygen [15]. It can use the ion exchange method, if the aim is to

IONIC EXCHANGE STUDIES FOR CORRECTING WATER QUALITY INDICATORS
157
remove small quantities of iron and manganese, because it will be the risk of rapid clogging. The process of iron and manganese removing by ion exchange is accomplished by using strong acid cations [16].
In the brewery industry, for example, water is an essential component for the final product quality, together with yeast, barley and hops, and breweries pay great attention on sourcing of this raw material. The production and processing of high quality water is a very important factor, due to its influence on both the production process (yeast requires potassium, sodium and calcium for optimum fermentation) and on the taste of the final product [17, 18]. Aside from these requirements, there is legislation governing water quality parameters in such industries, obliging brewers to use high drinking quality water for most production processes [19, 20].
In this study, zeolitic volcanic tuff and cationic exchanger were used to retain iron and manganese ions, and reduce the concentration of dissolved salts, in order to obtain adequate quality water for use in the brewery industry.
RESULTS AND DISCUSSION Samples of drinking water collected from Ialomiţa-Muntenia (Romania)
catchment (groundwater and surface water sources) are characterized by a high content of dissolved salts, iron and manganese concentration, close to the maximum allowable value (MVA). The initial pH was around neutral. The presence of ammonium and nitrite ions in samples was not detected. The measured values of physico-chemical indicators are shown in Table 1.
Table 1. Physico-chemical indicators values for Ialomiţa-Muntenia
(Romania) catchment Water
Sample Fetot mg/L
Mn2+ mg/L
COD mg KMnO4/L
Cl- mg/L
Conductivity µS/cm
pH
Groundwater (GW) 0.305 0.023 14.536 177.90 1433 7.6 Surface water (SW) 0.252 0.023 17.064 170.95 1451 7.7
Batch mode analysis Experimental determinations, in static regime, showed that the
equilibrium of the iron and manganese ions removal by ion exchange on ZVT-H was reached after 24 hours. Concentrations of the iron and manganese ions are very small in the samples collected, below the MVA, imposed by the Romanian legislation (50 µg Mn2+/L and 200 µg Fetotal/L [21], Figure 1 and Figure 2).
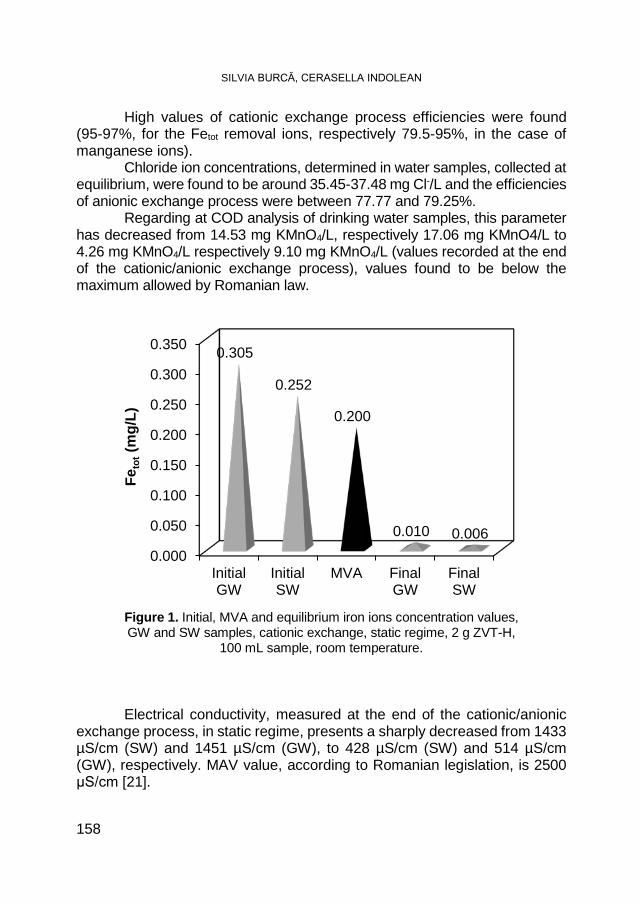
SILVIA BURCĂ, CERASELLA INDOLEAN
158
High values of cationic exchange process efficiencies were found (95-97%, for the Fetot removal ions, respectively 79.5-95%, in the case of manganese ions).
Chloride ion concentrations, determined in water samples, collected at equilibrium, were found to be around 35.45-37.48 mg Cl-/L and the efficiencies of anionic exchange process were between 77.77 and 79.25%.
Regarding at COD analysis of drinking water samples, this parameter has decreased from 14.53 mg KMnO4/L, respectively 17.06 mg KMnO4/L to 4.26 mg KMnO4/L respectively 9.10 mg KMnO4/L (values recorded at the end of the cationic/anionic exchange process), values found to be below the maximum allowed by Romanian law.
Figure 1. Initial, MVA and equilibrium iron ions concentration values, GW and SW samples, cationic exchange, static regime, 2 g ZVT-H,
100 mL sample, room temperature. Electrical conductivity, measured at the end of the cationic/anionic
exchange process, in static regime, presents a sharply decreased from 1433 µS/cm (SW) and 1451 µS/cm (GW), to 428 µS/cm (SW) and 514 µS/cm (GW), respectively. MAV value, according to Romanian legislation, is 2500 μS/cm [21].
0.000
0.050
0.100
0.150
0.200
0.250
0.300
0.350
InitialGW
InitialSW
MVA FinalGW
FinalSW
0.305
0.252
0.200
0.010 0.006
Feto
t(m
g/L)

IONIC EXCHANGE STUDIES FOR CORRECTING WATER QUALITY INDICATORS
159
Fixed bed column analysis The breakthrough curves for Fetot and Mn2+ sorption on ZVT-H, at an
inlet concentration of 0.252 mg Fetot/L and 0.023 mg Mn2+/L are shown in Figure 3. As it was expected, Fetotal and Mn2+ sorption was very high, in 370-400 minutes, and then the concentration at the column outlet increased slowly, because the zeolitic volcanic tuff was getting saturated.
Fig. 2. Initial, MVA and equilibrium manganese ions concentrations, cationic
exchange, static regime, 2 g ZVT-H, 100 mL sample, room temperature.
The values of the breakthrough time (tb) and exhaustion time (ts), of the breakthrough curves, obtained for iron and manganese ions were 10.6 h and 38.89 h respectively, for manganese ions sorption, 32.82 h and 36.86 h, respectively for iron ions sorption. It can be observed that the values of breakthrough time for manganese ions was almost three times smaller than breakthrough time for sorption of iron ions (10.6 h for manganese ions, compared to 32.82 h, for iron ions).
MVA for manganese ions has a lower value than the MVA for iron ions (0.005 mg Mn2+/L, compared to 0.200 mg Fetot /L) [22].
It was found that the maximum sorption capacity values of iron ions is higher than the maximum sorption capacity values for manganese ions (0.543 mg Fetot/g ZVT-H compared to 0.044 mg Mn2+/g ZVT-H, respectively), because the inlet concentration of iron ions is higher than inlet concentration of manganese ions (Figure 4 and Figure 5).
0
0.005
0.01
0.015
0.02
0.025
InitialGW
Initial SW MVA Final GW Final SW
0.023 0.023
0.005
0.0010.003
Mn2+
(mg/
L)
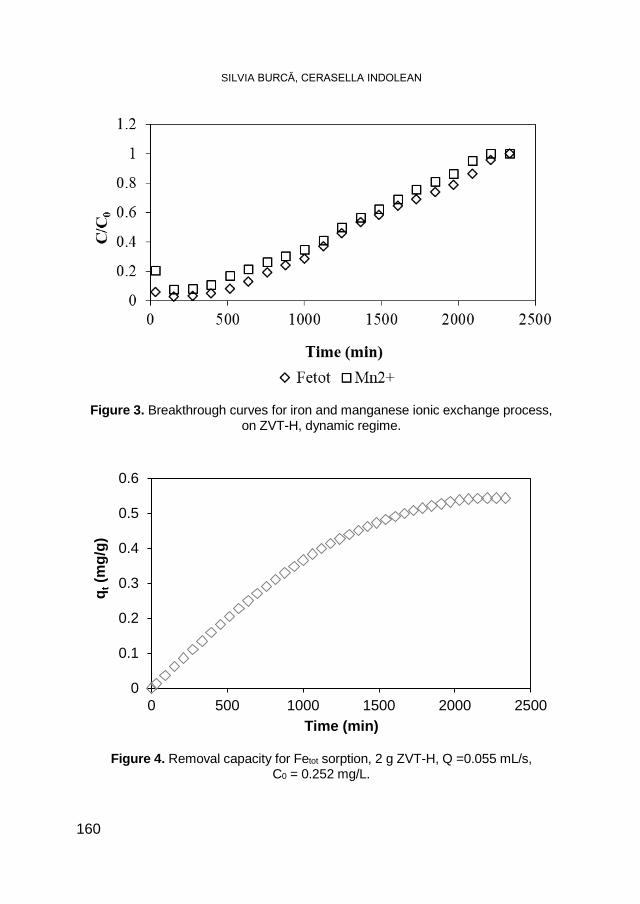
SILVIA BURCĂ, CERASELLA INDOLEAN
160
Figure 3. Breakthrough curves for iron and manganese ionic exchange process,
on ZVT-H, dynamic regime.
Figure 4. Removal capacity for Fetot sorption, 2 g ZVT-H, Q =0.055 mL/s,
C0 = 0.252 mg/L.
0
0.1
0.2
0.3
0.4
0.5
0.6
0 500 1000 1500 2000 2500
q t(m
g/g)
Time (min)

IONIC EXCHANGE STUDIES FOR CORRECTING WATER QUALITY INDICATORS
161
Figure 5. Removal capacity for Mn2+ sorption, 2 g ZVT-H, Q =0.055 mL/s, C0 = 0.023 mg/L
Figure 6. Breakthrough curve for Cl- sorption, 2 g A-21 anionic exchanger, C0=170.95 mg Cl-/L, Q = 0.055 mL/s.
0
0.01
0.02
0.03
0.04
0.05
0 500 1000 1500 2000 2500
q t(m
g/g)
Time (min)
0
0.2
0.4
0.6
0.8
1
1.2
0 500 1000 1500 2000
C/C
0
Time (min)

SILVIA BURCĂ, CERASELLA INDOLEAN
162
The breakthrough curve for Cl- sorption, on synthetic resin Amberlite A-21, with an inlet concentration of 170.96 mg Cl-/L is shown in Figure 6. The exit time value (ts) of the breakthrough curves obtained for chlorides ions was 41.91 h, MVA for chlorides ions in the drinking water being 250 mg Cl-/L [22]. The maximum sorption capacity values of chlorides ions was 98.85 mg Cl-/g, Figure 7.
Figure 7. Removal capacity for chlorides sorption, 2 g A-21,
Q =0.055 mL/s, C0 = 170.95 mg Cl-/L.
Breakthrough curves modeling To describe the fixed bed column behaviour and to scale it up for
industrial applications, three models – Thomas, Wolborska, and Yoon-Nelson – were used, in order to fit better the experimental data with the appropriate model.
Thomas model This model is suitable for adsorption process where the external and
internal diffusion limitations are absent, this is frequently applied to estimate the adsorptive capacity of adsorbent and predict breakthrough curves, assumes plug flow behavior in the bed, uses Langmuir isotherm for equilibrium and second order reversible reaction kinetics [23, 24]. Adsorption kinetics is described as the following equation:
∂q∂t
= 𝑘𝑘1�𝑞𝑞0 − 𝑞𝑞�𝐶𝐶 − 𝑘𝑘2𝑞𝑞(𝐶𝐶0 − 𝐶𝐶) (1)
0
20
40
60
80
100
120
0 500 1000 1500 2000 2500
q t(m
g/g)
Time (min)
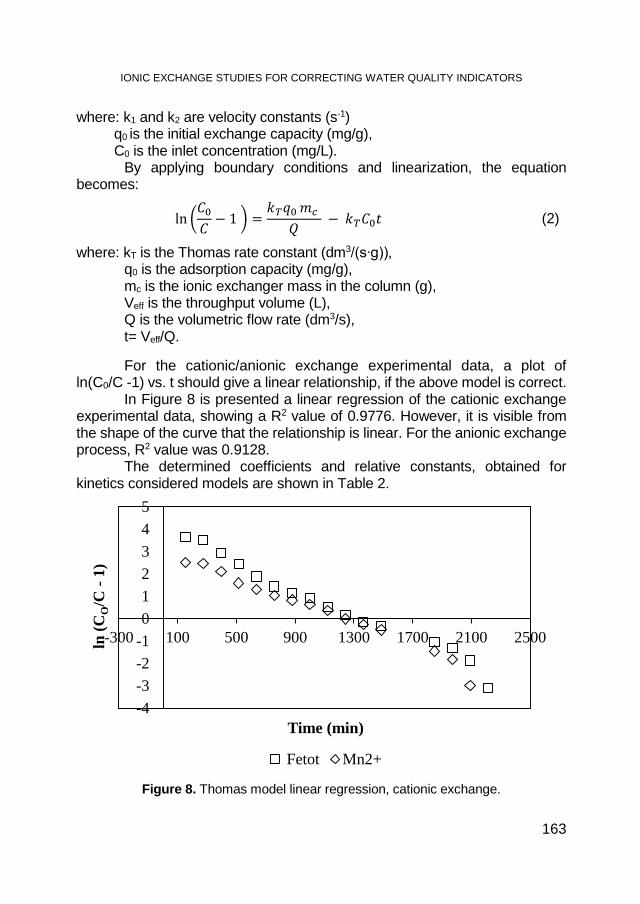
IONIC EXCHANGE STUDIES FOR CORRECTING WATER QUALITY INDICATORS
163
where: k1 and k2 are velocity constants (s-1) q0 is the initial exchange capacity (mg/g), C0 is the inlet concentration (mg/L).
By applying boundary conditions and linearization, the equation becomes:
ln �𝐶𝐶0𝐶𝐶− 1 � =
𝑘𝑘𝑇𝑇𝑞𝑞0 𝑚𝑚𝑐𝑐 𝑄𝑄
− 𝑘𝑘𝑇𝑇𝐶𝐶0𝑡𝑡 (2)
where: kT is the Thomas rate constant (dm3/(s∙g)), q0 is the adsorption capacity (mg/g), mc is the ionic exchanger mass in the column (g), Veff is the throughput volume (L), Q is the volumetric flow rate (dm3/s), t= Veff/Q. For the cationic/anionic exchange experimental data, a plot of
ln(C0/C -1) vs. t should give a linear relationship, if the above model is correct. In Figure 8 is presented a linear regression of the cationic exchange
experimental data, showing a R2 value of 0.9776. However, it is visible from the shape of the curve that the relationship is linear. For the anionic exchange process, R2 value was 0.9128.
The determined coefficients and relative constants, obtained for kinetics considered models are shown in Table 2.
Figure 8. Thomas model linear regression, cationic exchange.
-4-3-2-1012345
-300 100 500 900 1300 1700 2100 2500ln (C
O/C
-1)
Time (min)
Fetot Mn2+
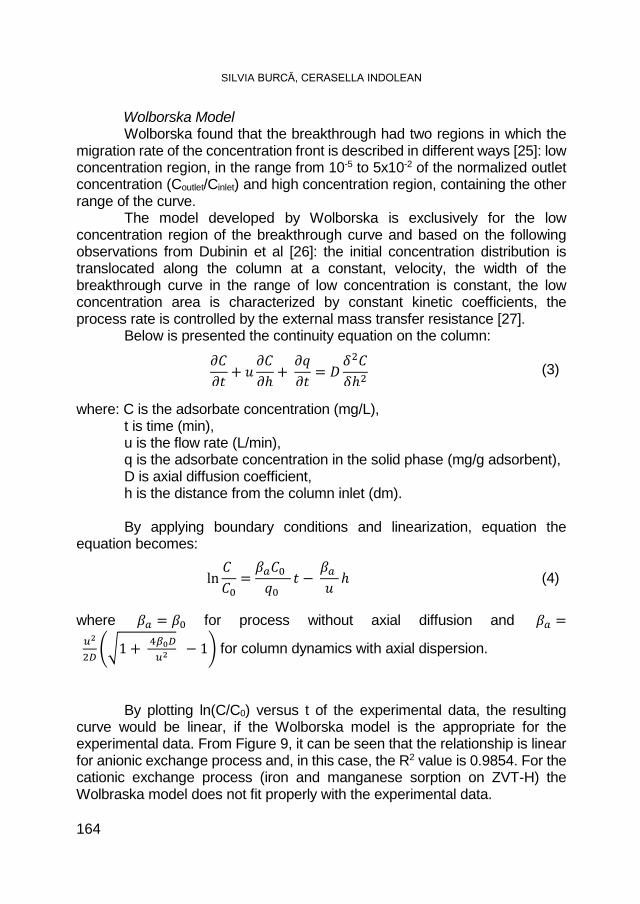
SILVIA BURCĂ, CERASELLA INDOLEAN
164
Wolborska Model Wolborska found that the breakthrough had two regions in which the
migration rate of the concentration front is described in different ways [25]: low concentration region, in the range from 10-5 to 5x10⁻² of the normalized outlet concentration (Coutlet/Cinlet) and high concentration region, containing the other range of the curve.
The model developed by Wolborska is exclusively for the low concentration region of the breakthrough curve and based on the following observations from Dubinin et al [26]: the initial concentration distribution is translocated along the column at a constant, velocity, the width of the breakthrough curve in the range of low concentration is constant, the low concentration area is characterized by constant kinetic coefficients, the process rate is controlled by the external mass transfer resistance [27].
Below is presented the continuity equation on the column:
𝜕𝜕𝐶𝐶𝜕𝜕𝑡𝑡
+ 𝑢𝑢𝜕𝜕𝐶𝐶𝜕𝜕ℎ
+ 𝜕𝜕𝑞𝑞𝜕𝜕𝑡𝑡
= 𝐷𝐷𝛿𝛿2𝐶𝐶𝛿𝛿ℎ2
(3) where: C is the adsorbate concentration (mg/L),
t is time (min), u is the flow rate (L/min), q is the adsorbate concentration in the solid phase (mg/g adsorbent), D is axial diffusion coefficient, h is the distance from the column inlet (dm). By applying boundary conditions and linearization, equation the
equation becomes:
ln𝐶𝐶 𝐶𝐶0
=𝛽𝛽𝑎𝑎𝐶𝐶0 𝑞𝑞0
𝑡𝑡 − 𝛽𝛽𝑎𝑎 𝑢𝑢ℎ (4)
where 𝛽𝛽𝑎𝑎 = 𝛽𝛽0 for process without axial diffusion and 𝛽𝛽𝑎𝑎 =
𝑢𝑢2
2𝐷𝐷��1 + 4𝛽𝛽0𝐷𝐷
𝑢𝑢2 − 1� for column dynamics with axial dispersion.
By plotting ln(C/C0) versus t of the experimental data, the resulting
curve would be linear, if the Wolborska model is the appropriate for the experimental data. From Figure 9, it can be seen that the relationship is linear for anionic exchange process and, in this case, the R2 value is 0.9854. For the cationic exchange process (iron and manganese sorption on ZVT-H) the Wolbraska model does not fit properly with the experimental data.
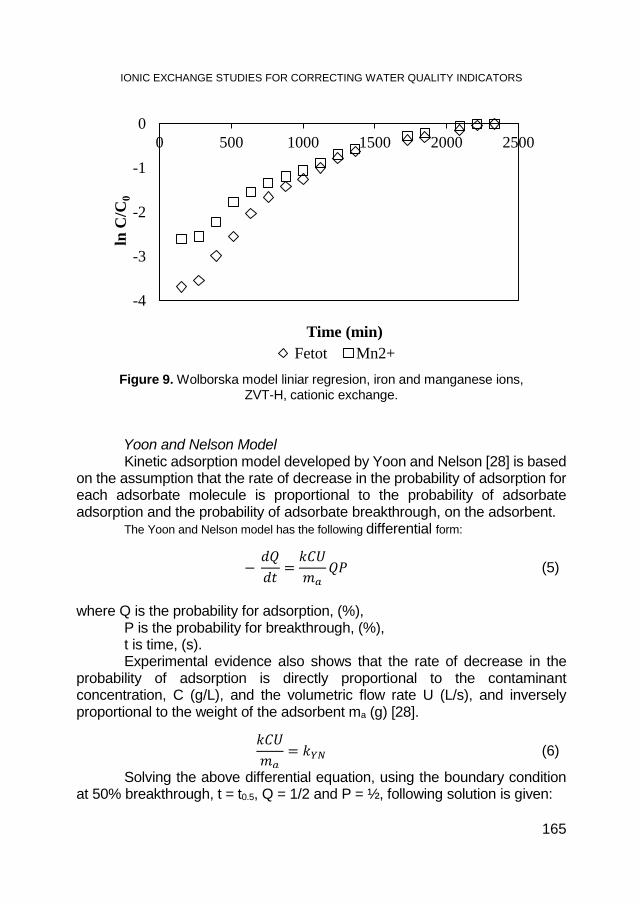
IONIC EXCHANGE STUDIES FOR CORRECTING WATER QUALITY INDICATORS
165
Figure 9. Wolborska model liniar regresion, iron and manganese ions,
ZVT-H, cationic exchange.
Yoon and Nelson Model Kinetic adsorption model developed by Yoon and Nelson [28] is based
on the assumption that the rate of decrease in the probability of adsorption for each adsorbate molecule is proportional to the probability of adsorbate adsorption and the probability of adsorbate breakthrough, on the adsorbent.
The Yoon and Nelson model has the following differential form:
− 𝑑𝑑𝑄𝑄𝑑𝑑𝑡𝑡
=𝑘𝑘𝐶𝐶𝑘𝑘𝑚𝑚𝑎𝑎
𝑄𝑄𝑄𝑄 (5)
where Q is the probability for adsorption, (%),
P is the probability for breakthrough, (%), t is time, (s). Experimental evidence also shows that the rate of decrease in the
probability of adsorption is directly proportional to the contaminant concentration, C (g/L), and the volumetric flow rate U (L/s), and inversely proportional to the weight of the adsorbent ma (g) [28].
𝑘𝑘𝐶𝐶𝑘𝑘𝑚𝑚𝑎𝑎
= 𝑘𝑘𝑌𝑌𝑌𝑌 (6)
Solving the above differential equation, using the boundary condition at 50% breakthrough, t = t0.5, Q = 1/2 and P = ½, following solution is given:
-4
-3
-2
-1
00 500 1000 1500 2000 2500
ln C
/C0
Time (min) Fetot Mn2+
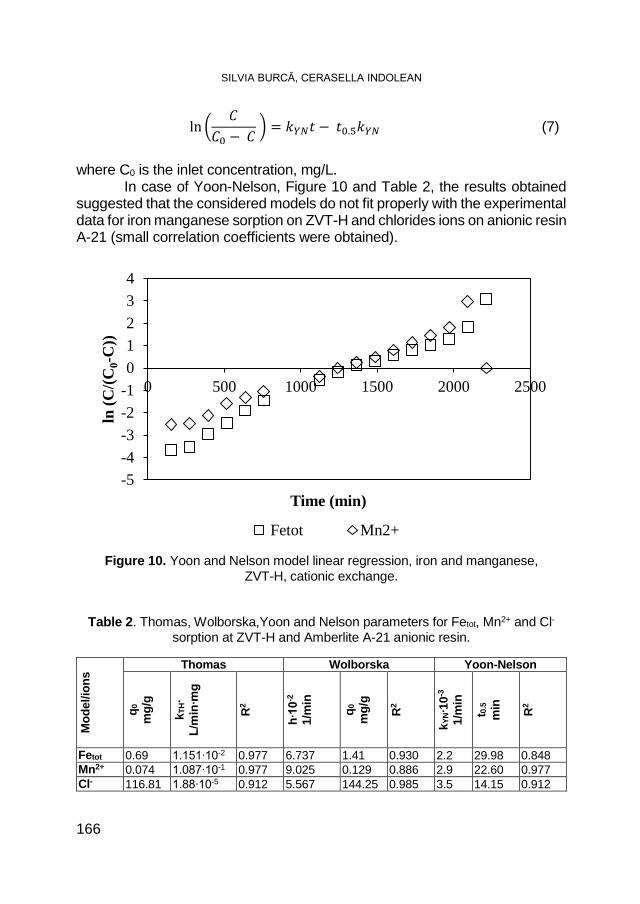
SILVIA BURCĂ, CERASELLA INDOLEAN
166
ln �𝐶𝐶
𝐶𝐶0 − 𝐶𝐶 � = 𝑘𝑘𝑌𝑌𝑌𝑌𝑡𝑡 − 𝑡𝑡0.5𝑘𝑘𝑌𝑌𝑌𝑌 (7)
where C0 is the inlet concentration, mg/L.
In case of Yoon-Nelson, Figure 10 and Table 2, the results obtained suggested that the considered models do not fit properly with the experimental data for iron manganese sorption on ZVT-H and chlorides ions on anionic resin A-21 (small correlation coefficients were obtained).
Figure 10. Yoon and Nelson model linear regression, iron and manganese,
ZVT-H, cationic exchange.
Table 2. Thomas, Wolborska,Yoon and Nelson parameters for Fetot, Mn2+ and Cl- sorption at ZVT-H and Amberlite A-21 anionic resin.
Mod
el/io
ns
Thomas Wolborska Yoon-Nelson
q 0
mg/
g
k TH∙
L/
min
∙mg
R2
h∙10
-2
1/m
in
q 0
mg/
g
R2
k YN∙
10-3
1/
min
t 0.5
min
R2
Fetot 0.69 1.151∙10-2 0.977 6.737 1.41 0.930 2.2 29.98 0.848 Mn2+ 0.074 1.087∙10-1 0.977 9.025 0.129 0.886 2.9 22.60 0.977 Cl- 116.81 1.88∙10-5 0.912 5.567 144.25 0.985 3.5 14.15 0.912
-5-4-3-2-101234
0 500 1000 1500 2000 2500
ln (C
/(C0-
C))
Time (min)
Fetot Mn2+
IONIC EXCHANGE STUDIES FOR CORRECTING WATER QUALITY INDICATORS
167
CONCLUSIONS Two materials, a natural ionic exchanger (zeolitic volcanic tuff) and a
synthetic anionic exchanger were utilized to remove iron and manganese ions, chlorides and to reduce conductivity and COD values from ground water (GW) and surface water (SW) samples, from Ialomiţa-Muntenia (Romania) catchment.
When the experimental determinations were conducted in static regime, it was found that the equilibrium of the iron and manganese ions removal was reached after 24 hours, utilizing an ion exchange process, on ZVT-H.
In dynamic regime, the values of breakthrough time for manganese ions was almost three times smaller than breakthrough time for sorption of iron ions (10.6 h for manganese ions, compared to 32.82 h, for iron ions).
The maximum sorption capacity values for Fetot is higher than the maximum sorption capacity values for Mn2+ (0.543 mg Fetot/g ZVT-H compared to 0.044 mg Mn2+/g ZVT-H).
To describe the fixed bed column behaviour and to scale it up for industrial applications, three models – Thomas, Wolborska and Yoon-Nelson – were used, in order to fit the experimental data with the suitable model.
Good agreement between the predicted theoretical breakthrough curves and the experimental results were observed for Thomas model, in the case of Fetot and Mn2+ ions (correlation coefficients of 0.977), and for Wolborska model, in the case of Cl- ions (correlation coefficients of 0.985).
EXPERIMENTAL SECTION
Ionic exchanger In this study was used zeolitic volcanic tuff (ZVT) from Măcicaş (M),
Romania. The sedimentary zeolitic rocks belong to the Dej Tuff Complex of a Lower Badenian age [21]. According to our previous studies of the ZVT from this outcrop, the main zeolite present in these rocks is clinoptilolite, representing 60–70% of the total mineral phases [22- 24]. ZVT samples were first subjected to a physical treatment (grinding, size separation, washing) followed by an acide treatment [29-30].
Beside the ZVT in H form (ZVT-H) sample and anionic resin Amberlite 21 (A-21)(Sigma-Aldrich) were also used. The synthetic exchanger considered is dimethylamino-resin (weakly basic), with maximum temperature operating of 100ºC, moisture content 57%, surface area 25 m2/g, porosity 48% and total exchange capacity 1.3 meq/ml, 4.8 meq/g respectively.
SILVIA BURCĂ, CERASELLA INDOLEAN
168
Water sampling and analysis For the ionic exchange study it were used drinking water samples
from Ialomiţa-Muntenia (Romania) catchment. Water samples were characterized using the physico-chemical methods according to Romanian legislation (Laws 458/2002, 311/2004). The following water quality parameters were determined: pH, chemical oxygen demand (COD) in mg KMnO4 mg/L, electrical conductivity (µS/cm), Mn2+, Fetotal, Cl-, NO2
-, NH4+ (mg/L). pH and
electrical conductivity were determined using a Consort C863 pH meter (SR ISO 10523/96, SR ISO 7887/97). Chemical oxygen demand and chlorides were determined by volumetric method (Romanian STAS 7313-82, STAS 3326-76, STAS 3002-85). Concentration of Mn2+, Fetotal, NO2
- and NH4+ were
determined using molecular absorption (SR 8662-1, 2/96, SR 13315/96, STAS 3048/2-96, STAS 6328/85) with a UV VIS Spectrometer Jenway 6305. Each sample was measured three times, the averaged values were presented.
Ionic exchange experiments The cationic exchange process was realised in batch reactor, in static
regime using 2 g of the 0.2-0.4 mm particle size of ZVT-H and 100 ml water (exchanger: water =2:100). Solution samples were collected every 24 h for iron, manganese and COD concentrations measurement, until the equilibrium was reached. Then anionic exchange process was conducted under the same conditions (static regime, 2 g of the anionic resin A-21 and 50 ml water), samples were collected for chloride concentration measurement, until the equilibrium was reached.
It also worked in dynamic regime, on a two fixed bed columns (di= 14.5 mm), containing 2 g of the 0.2-0.4, mm grain size ZVT-H, respectively 2 g anionic resin A-21. It was worked with a flow rate of 0.055 mL/s. The effluent was collected at the outflow of the column every 100 mL, until the zeolitic volcanic tuff and anionic resin have been exhausted, in order to determine the exact concentration of iron and manganese ions, respectively chloride concentration and also, their evolution during the ionic exchange process.
Experiments were carried out without any modification of temperature (room temperature).
Exchange capacities, CEC, q in mg/g ZVT-H, mg/g A-21, and removal efficiencies, E (%), were calculated to establish the efficiency of the considered process [31].
𝒒𝒒 = 𝑪𝑪𝟎𝟎− 𝑪𝑪𝒆𝒆
𝒎𝒎∙ 𝑽𝑽𝟏𝟏𝟎𝟎𝟎𝟎𝟎𝟎
(batch mode) (8) 𝒒𝒒𝒕𝒕 = 𝑪𝑪𝟎𝟎− 𝑪𝑪𝒆𝒆𝒎𝒎
∙ 𝑽𝑽𝟏𝟏𝟎𝟎𝟎𝟎𝟎𝟎
+ 𝒒𝒒𝒕𝒕−𝟏𝟏 (fixed bed)
(9)
IONIC EXCHANGE STUDIES FOR CORRECTING WATER QUALITY INDICATORS
169
𝑬𝑬(%) =𝑪𝑪𝟎𝟎 − 𝑪𝑪𝒆𝒆𝑪𝑪𝟎𝟎
∙ 𝟏𝟏𝟎𝟎𝟎𝟎 (10)
where: C0, Ce are the initial and equilibrium zinc ion concentrations (mg/L); q is the ionic exchange capacity (mg/g), V is the volume of water (mL), m is the mass of ionic exchanger (g). The kinetics of iron and manganese sorption on ZVT-H respectively
chloride sorption on Amberlite A-21, was studied taken into consideration the three models: Thomas, Wolbraska and Yoon-Nelson.
R E F E R E N C E S
1. R.S. Ayers, DW. Westcot DW, "Water quality for agriculture. FAO irrigation and drainage", 29, Rome. ISBN 92-5-102263-1, 1976.
2. S. Barlow, G. Kozianowski, G. Wurtzen, J. Schlatter, Chemical Toxicology, 2001;39, 893.
3. T. Asano, F.L. Burton, H. Leverenz, R. Tsuchihashi, G. Tchobanoglous, "Water reuse: issues, technologies and applications", New York, McGraw-Hill, 2007.
4. J. Bartram, T. A. Stenstrom, L. Fewtrell, "Harmonised assessment of risk for water-related microbiological hazards: an overview". In: L. Fewtrell, J. Bartram, (eds) Water-quality: guidelines, standards and health – risk assessment and management for water-related infectious disease. IWA, London, for the WHO; 2001.
5. G. Bitton, R. Harvey, "Transport of pathogens through soils and aquifers". In: R. Mitchell New concepts in environmental microbiology, 19th edn. New York, Wiley, 1992.
6. U.J. Blumenthal, D.D. Mara, A. Peasey, G. Ruiz-Palacios, R. Stott, Bulletin of the World Health Organization, 2000, 78, 1104.
7. T. Asano, A.D. Levine, Wastewater reclamation, recycling, and reuse: an introduction. Asano, T. Wastewater reclamation and reuse. Technomic, Lancaster, PA, 1998.
8. W. Kondro, "E. coli outbreak deaths spark judicial inquiry in Canada", Lancet 355, 2000, 2058.
9. P. Mouchet, Journal American Water Works Association, 1992;84, 158. 10. B. Gaskill, Water Technology, 1996, 19, 10. 11. D. H. Paul, Water Science Technology, 1995, 18(9), 30. 12. G.S. Pellington, Water Review, 1992, 10(l), 1.
SILVIA BURCĂ, CERASELLA INDOLEAN
170
13. J. Mc, Peak, Water Technology, 1988,11(5), 40. 14. M.C. Keller, Water Technology, 1995,18(9), 35. 15. Y.H. Zhang, Water Technology, 1996, 19(8), 81. 16. Water Quality Association. Water Treatment Fundamentals. Lisle, Ill; 1983. 17. J. Van Newenhizen, Water Technology, 1983, 21(l), 40. 18. T. Asano, D. Richard, R.W. Crites, G. Tchobanoglous, Water Science
Technology, 1992, 4, :37. 19. Codex Alimentarius Commission. Proposed draft guidelines for the hygienic
reuse of processing water in food plants. Codex Committee on Food Hygiene, FAO, 36th session, Washington D.C., USA, CX/FH/01/9; 2004.
20. Codex Alimentarius Commission. Procedural manual, 16th edn. ISSN 1020-8070. FAO, Rome; 2006.
21. Commission of the European Communities. Quality of water intended for human consumption, Council Directive 98/83/EC; 1998.
22. Law 458/2002, 311/2004, 107/1996, 311/2004, 112/2006, HG 188/2002, HG 352/2005 (in Roumanian).
23. E. Gilca, A. Maicaneanu, P. Ilea, Central European Journal Chemistry, 2014, 12(8), 821.
24. A. Wolborska, Water Research, 1989, 23, 85. 25. H.C. Thomas, Jornal of the American Chemical Society, 1944, 66, 1466. 26. M. Dubinin, K. Nikolaev, N. Poljakov, L. Petrova, "Investigation of adsorption
dynamics in a broad range of breakthrough concentrations". Institute of Physical Chemistry, Academy of Sciences of the USSR. Translated from Izvestiya Akademii Nauk SSSR, Seriya Khimicheskaya. 1972, 2, 1265.
27. M. Dubinin, K. Nikolaev, N. Poljakov, G. Pirozhkov, "Pore structures of charcoal adsorbents and the adsorbability of gases and vapors". Institute of Physical Chemistry, Academy of Sciences of the USSR, Moscow. Translated from Izvestiya Akademii Nauk SSSR, Seriya Khimicheskaya, 1980;8, 1728.
28. Y.H. Yoon, J.H. Nelson, American Industrial Hygiene Association Journal, 1984, 45, 509.
29. H. Bedelean, M Stanca, A. Maicaneanu, S. Burca, Studies and Research, Geology-Geography, 2005,10(53), 881.
30. M Stanca, A. Maicaneanu, S. Burca, H. Bedelean, Studia Universitatis Babeş-Bolyai Chemia, 2006, LI(2), 187.
31. A. Maicaneanu, H. Bedelean, M. Stanca, "Zeolitii naturali. Caracterizare si aplicatii in protectia mediului", Cluj University Press, Cluj-Napoca, Romania; 2008.