Celuloză şi Hârtie 2010, vol.59, nr.3 C E L U L O Z Ã...
48
Celuloză şi Hârtie 2010, vol.59, nr.3 1 C E L U L O Z Ã C E L U L O Z Ã C E L U L O Z Ã C E L U L O Z Ã ȘI H Â R T I E H Â R T I E H Â R T I E H Â R T I E VOL. VOL. VOL. VOL.59 N N N NO. O. O. O. 3/20 /20 /20 /2010 10 10 10 MANAGEMENT BOARD G. Balogh, M. Botez, Eng. D. Buteică (Chairman), C-tin Chiriac (Vicechairman), P.H.Kohler, G. Crăciun, R. Crăciun, C. Ferrero, A. Itu, P.H. Kohler, Şt. Lupan, A. Oncioiu, A. Popovici, D. Tărăşenie, A. Vais, V. Vasiliu C U P R I N S CONTENTS ELENA BOBU, CRISTIAN BANARIE, PAUL OBROCEA, FLORIN CIOLACU, DAN GAVRILESCU ELENA BOBU, CRISTIAN BANARIE, PAUL OBROCEA, FLORIN CIOLACU, DAN GAVRILESCU Influenţa conţinutului de material neutilizabil din hârtia recuperată asupra eficienţei procesului de reciclare. Studiu de caz 3 Impact of unusable material content from recovered paper on recycling effectiveness. Case study 3 VIOLETA NEGREANU, RACHILA IEREMIE, MARIA CANTEA, VASILE NEGREANU VIOLETA NEGREANU, RACHILA IEREMIE, MARIA CANTEA, VASILE NEGREANU Aspecte generale privind poluarea solului şi apei subterane în fabricile de celuloză şi hârtie 9 General aspects concerning soil and underground water pollution at pulp and paper making 9 CONSTANTIN CHIRIAC, BORIS ANDRONIC, EVA CRISTIAN, GHEORGHE CAZAN, CRISTIAN MORMOCEA, VALENTINA SCARLET CONSTANTIN CHIRIAC, BORIS ANDRONIC, EVA CRISTIAN, GHEORGHE CAZAN, CRISTIAN MORMOCEA, VALENTINA SCARLET Evaluarea resursei potenţiale de materii prime/materiale secundare a sectorului papetar din România şi analiza contextului legislativ 15 Evaluation of potential source of raw materials/secondary materials (recovered paper) of the paper sector in Romania and analysis of legislative frame 15 GHEORGHE DUŢUC, DAN GAVRILESCU, ALEXANDRU BOTAR, GRIGORE CRĂCIUN GHEORGHE DUŢUC, DAN GAVRILESCU, ALEXANDRU BOTAR, GRIGORE CRĂCIUN Fosfonaţii – aditivi pentru fierberea lemnului de răşinoase 29 Phosphonates – additives for softwood delignification 29 DAN BUTEICĂ DAN BUTEICĂ Aplicaţii ale nanotehnologiilor în partea umedă a maşinii de hârtie 36 Applications of nanotechnologies in the wet-end chemistry 36 Recenzie carte 47 Book review 47 Quarterly journal edited by THE TECHNICAL ASSOCIATION FOR ROMANIAN PULP AND PAPER INDUSTRY and PULP AND PAPER R&D INSTITUTE – SC CEPROHART SA – Brăila, Romania Sponsorized by THE ROMANIAN OWNERSHIP OF PULP AND PAPER INDUSTRY ISSN: 1220 - 9848
Transcript of Celuloză şi Hârtie 2010, vol.59, nr.3 C E L U L O Z Ã...
Celuloză şi Hârtie 2010, vol.59, nr.3
1
C E L U L O Z Ã C E L U L O Z Ã C E L U L O Z Ã C E L U L O Z Ã ȘIIII
H Â R T I EH Â R T I EH Â R T I EH Â R T I E
VOL.VOL.VOL.VOL.55559999 N N N NO.O.O.O. 3333/20/20/20/2010101010
MANAGEMENT BOARD
G. Balogh, M. Botez, Eng. D. Buteică (Chairman), C-tin Chiriac (Vicechairman), P.H.Kohler, G. Crăciun,
R. Crăciun, C. Ferrero, A. Itu, P.H. Kohler, Şt. Lupan, A. Oncioiu, A. Popovici, D. Tărăşenie, A. Vais,
V. Vasiliu
C U P R I N S CONTENTS ELENA BOBU, CRISTIAN BANARIE, PAUL OBROCEA, FLORIN CIOLACU, DAN GAVRILESCU
ELENA BOBU, CRISTIAN BANARIE, PAUL OBROCEA, FLORIN CIOLACU, DAN GAVRILESCU
Influenţa conţinutului de material neutilizabil din hârtia recuperată asupra eficienţei procesului de reciclare. Studiu de caz
3
Impact of unusable material content from recovered paper on recycling effectiveness. Case study
3
VIOLETA NEGREANU, RACHILA IEREMIE, MARIA CANTEA, VASILE NEGREANU
VIOLETA NEGREANU, RACHILA IEREMIE, MARIA CANTEA, VASILE NEGREANU
Aspecte generale privind poluarea solului şi apei subterane în fabricile de celuloză şi hârtie
9
General aspects concerning soil and underground water pollution at pulp and paper making
9
CONSTANTIN CHIRIAC, BORIS ANDRONIC, EVA CRISTIAN, GHEORGHE CAZAN, CRISTIAN MORMOCEA, VALENTINA SCARLET
CONSTANTIN CHIRIAC, BORIS ANDRONIC, EVA CRISTIAN, GHEORGHE CAZAN, CRISTIAN MORMOCEA, VALENTINA SCARLET
Evaluarea resursei potenţiale de materii prime/materiale secundare a sectorului papetar din România şi analiza contextului legislativ
15
Evaluation of potential source of raw materials/secondary materials (recovered paper) of the paper sector in Romania and analysis of legislative frame
15
GHEORGHE DUŢUC, DAN GAVRILESCU, ALEXANDRU BOTAR, GRIGORE CRĂCIUN
GHEORGHE DUŢUC, DAN GAVRILESCU, ALEXANDRU BOTAR, GRIGORE CRĂCIUN
Fosfonaţii – aditivi pentru fierberea lemnului de răşinoase
29
Phosphonates – additives for softwood delignification
29
DAN BUTEICĂ
DAN BUTEICĂ
Aplicaţii ale nanotehnologiilor în partea umedă a maşinii de hârtie
36
Applications of nanotechnologies in the wet-end chemistry
36
Recenzie carte
47
Book review
47
Quarterly journal edited by THE TECHNICAL ASSOCIATION FOR ROMANIAN PULP AND PAPER INDUSTRY and
PULP AND PAPER R&D INSTITUTE – SC CEPROHART SA – Brăila, Romania
Sponsorized by THE ROMANIAN OWNERSHIP OF PULP AND PAPER INDUSTRY
ISSN: 1220 - 9848

Celuloză şi Hârtie 2010, vol.59, nr.3
2
EDITORIAL STAFFEDITORIAL STAFFEDITORIAL STAFFEDITORIAL STAFF
Angels Pelach - University of Girona, Spain
Branka Lozo - Faculty of Graphic Arts, University of Zagreb, Croatia
Naceur Belgacem - INP- Pagora Grenoble, France
Ivo Valchev - University of Chemical Technology & Metallurgy, Sofia, Bulgaria
Elena Bobu - “Gheorghe Asachi” Technical University of Iaşi, Romania
Dan Gavrilescu - “Gheorghe Asachi” Technical University of Iaşi, Romania (Editor)
Paul Obrocea - “Gheorghe Asachi” Technical University of Iaşi, Romania
Valentin I. Popa - “Gheorghe Asachi” Technical University of Iaşi, Romania
Emanuel Poppel - “Gheorghe Asachi” Technical University of Iaşi, Romania
Teodor Măluţan - “Gheorghe Asachi” Technical University of Iaşi, Romania
Constantin Stanciu - “Dunărea de Jos” University of Galaţi, Romania
Petronela Nechita - Pulp and Paper Research and Development Institute - SC CEPROHART SA, Brăila,
Romania (Deputy Editor)
Daniela Manea – Pulp and Paper Research and Development Institute - SC CEPROHART SA, Brăila,
Romania
Eva Cristian – Pulp and Paper Research and Development Institute - SC CEPROHART SA, Brăila,
Romania
Nicoleta Gherghe – SC VRANCART SA Adjud, Romania
Mihai Banu - SC AMBRO SA, Suceava, Romania
The foreign readers may subscribe by TECHNICAL ASSOCIATION FOR ROMANIAN PULP AND PAPER INDUSTRY, (ATICHR), Walter Mărăcineanu Square no.1-3, Entry 2, Fl. 2, Room 177-178, Land 1, Bucharest, RO-78101, phone: + 40 21 315 01 62, + 40 21 315 01 75, Fax: +40 21 315 00 27, E-mail: [email protected] ; [email protected] The articles, information, advertising can be sent on “CELULOZĂ şi HÂRTIE” editorial office address: Al.I.Cuza Blvd, no.3, 810019, Braila, Romania, phone: +40 239 619 741, fax: +40 239 680 280, e-mail: [email protected], or Walter Mărăcineanu Square, no. 1-3, land 1, Bucharest, phone: + 40 21 315 01 62, + 40 21 315 01 75 Aknowledged in Romania, in the Polymer Materials Sciences field, by the National Council of the Scientific Research from the Higher Education (CNCSIS), C group. Indexed in PaperBase Abstracts, PIRA International (www.paperbase.org, www.piranet.com)
Printed by OFFSET GRAFIC SERV Srl, Brăila, Phone: +40 239 618 206
Celuloză şi Hârtie 2010, vol.59, nr.3
3
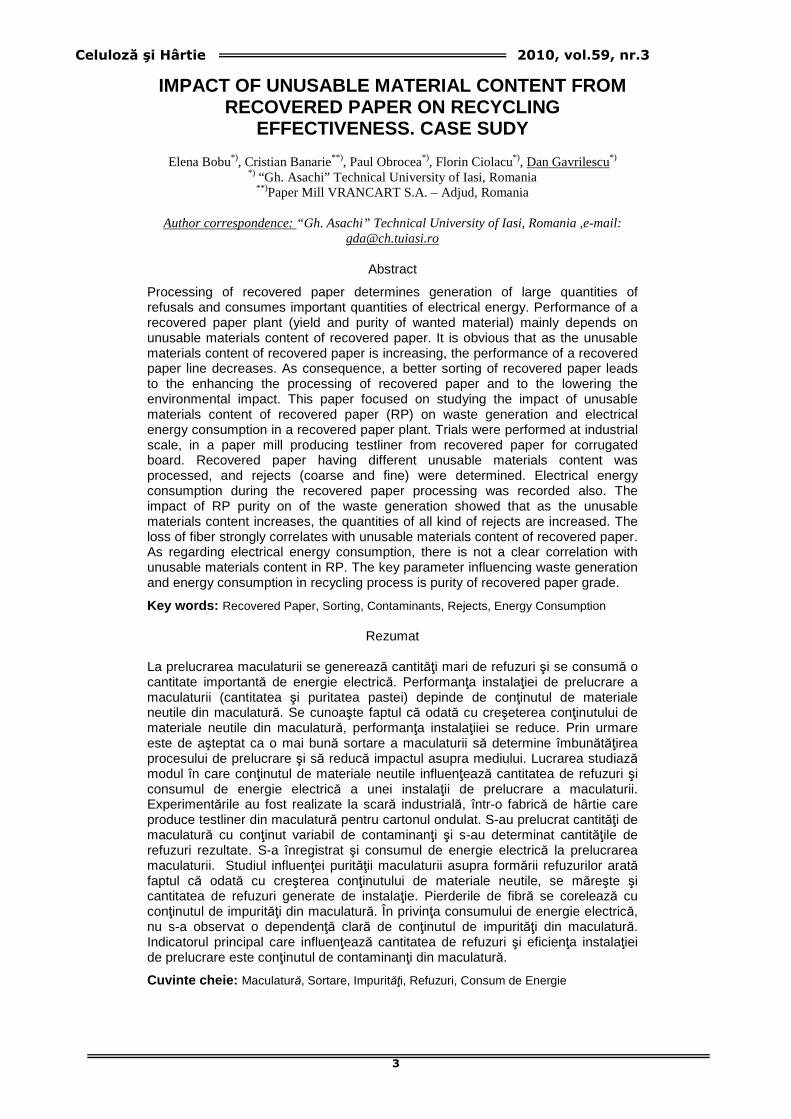
IMPACT OF UNUSABLE MATERIAL CONTENT FROM RECOVERED PAPER ON RECYCLING
EFFECTIVENESS. CASE SUDY
Elena Bobu*), Cristian Banarie**) , Paul Obrocea*), Florin Ciolacu*), Dan Gavrilescu*) *) “Gh. Asachi” Technical University of Iasi, Romania
**) Paper Mill VRANCART S.A. – Adjud, Romania
Author correspondence: “Gh. Asachi” Technical University of Iasi, Romania ,e-mail: [email protected]
Abstract
Processing of recovered paper determines generation of large quantities of refusals and consumes important quantities of electrical energy. Performance of a recovered paper plant (yield and purity of wanted material) mainly depends on unusable materials content of recovered paper. It is obvious that as the unusable materials content of recovered paper is increasing, the performance of a recovered paper line decreases. As consequence, a better sorting of recovered paper leads to the enhancing the processing of recovered paper and to the lowering the environmental impact. This paper focused on studying the impact of unusable materials content of recovered paper (RP) on waste generation and electrical energy consumption in a recovered paper plant. Trials were performed at industrial scale, in a paper mill producing testliner from recovered paper for corrugated board. Recovered paper having different unusable materials content was processed, and rejects (coarse and fine) were determined. Electrical energy consumption during the recovered paper processing was recorded also. The impact of RP purity on of the waste generation showed that as the unusable materials content increases, the quantities of all kind of rejects are increased. The loss of fiber strongly correlates with unusable materials content of recovered paper. As regarding electrical energy consumption, there is not a clear correlation with unusable materials content in RP. The key parameter influencing waste generation and energy consumption in recycling process is purity of recovered paper grade.
Key words: Recovered Paper, Sorting, Contaminants, Rejects, Energy Consumption
Rezumat
La prelucrarea maculaturii se generează cantităţi mari de refuzuri şi se consumă o cantitate importantă de energie electrică. Performanţa instalaţiei de prelucrare a maculaturii (cantitatea şi puritatea pastei) depinde de conţinutul de materiale neutile din maculatură. Se cunoaşte faptul că odată cu creşeterea conţinutului de materiale neutile din maculatură, performanţa instalaţiiei se reduce. Prin urmare este de aşteptat ca o mai bună sortare a maculaturii să determine îmbunătăţirea procesului de prelucrare şi să reducă impactul asupra mediului. Lucrarea studiază modul în care conţinutul de materiale neutile influenţează cantitatea de refuzuri şi consumul de energie electrică a unei instalaţii de prelucrare a maculaturii. Experimentările au fost realizate la scară industrială, într-o fabrică de hârtie care produce testliner din maculatură pentru cartonul ondulat. S-au prelucrat cantităţi de maculatură cu conţinut variabil de contaminanţi şi s-au determinat cantităţile de refuzuri rezultate. S-a înregistrat şi consumul de energie electrică la prelucrarea maculaturii. Studiul influenţei purităţii maculaturii asupra formării refuzurilor arată faptul că odată cu creşterea conţinutului de materiale neutile, se măreşte şi cantitatea de refuzuri generate de instalaţie. Pierderile de fibră se corelează cu conţinutul de impurităţi din maculatură. În privinţa consumului de energie electrică, nu s-a observat o dependenţă clară de conţinutul de impurităţi din maculatură. Indicatorul principal care influenţează cantitatea de refuzuri şi eficienţa instalaţiei de prelucrare este conţinutul de contaminanţi din maculatură.
Cuvinte cheie: Maculatură, Sortare, Impurităţi, Refuzuri, Consum de Energie
Celuloză şi Hârtie 2010, vol.59, nr.3
4
INTRODUCTION
The quality of RP supplied to paper mills impacts the sustainability of paper recycling by influencing the paper recycling chain, but mainly the processes, resources, consumption and emissions in the paper mill. The low quality of recovered paper is due to the high content of unusable components (non-paper and paper and board detrimental to production) which, during recycling, will lead to: ● Low yield of recovered paper processing (recycled fibre flow to paper machine / recovered paper flow in the processing plant), resulting in: direct economic impact, due to the increase of fibre raw material cost per ton of recycled paper; environmental impact, associated with increases in the wet waste volume generated in RP processing, as well as with energy consumption for wet waste management, as a function of the end-of-life solution selected. ● Low quality of recycled pulp, associated with the increase in the short fibres, ash, and stickies content, originated in recovered paper contamination, can produce: economic impact, due higher costs with energy, chemicals or virgin fibres needed to keep the quality of the end product constant; environmental impact, due to the higher energy and water consumption and associated emissions.
RP processing always generates loss of material as rejects. Typical dry basis yields of 90% are obtained with OCC (1.04 and 1.05 grades). Graphic papers (1.11 grade) often have 75-88% yields, although some yields below 70% have been reported, particularly when processing
mainly coated waste paper [1]. The yield loss represents solid wastes and dissolved or very fine material which ends up in the aqueous effluent. Usually 1- 4% of the original RP weight ends up in the aqueous stream, and the rest becomes solid waste [2].
At present, it is recognized that there is not an optimal collection system which can be considered as universal, because it depends on social and economic factors, different at regional and even local level. For this reason, the recovery strategy has to include a sorting process allowing the separation of different components of recovered paper and its classification as EN 643 grades Sorting is the very first stage, after collection, where the non–paper, paper and board that are non–recyclable or unsuited to the grade have to be removed [3]. Practically, the method and intensity of sorting determine the quality (the type and content of different contaminants) of the recovered paper supplied to the paper mill.
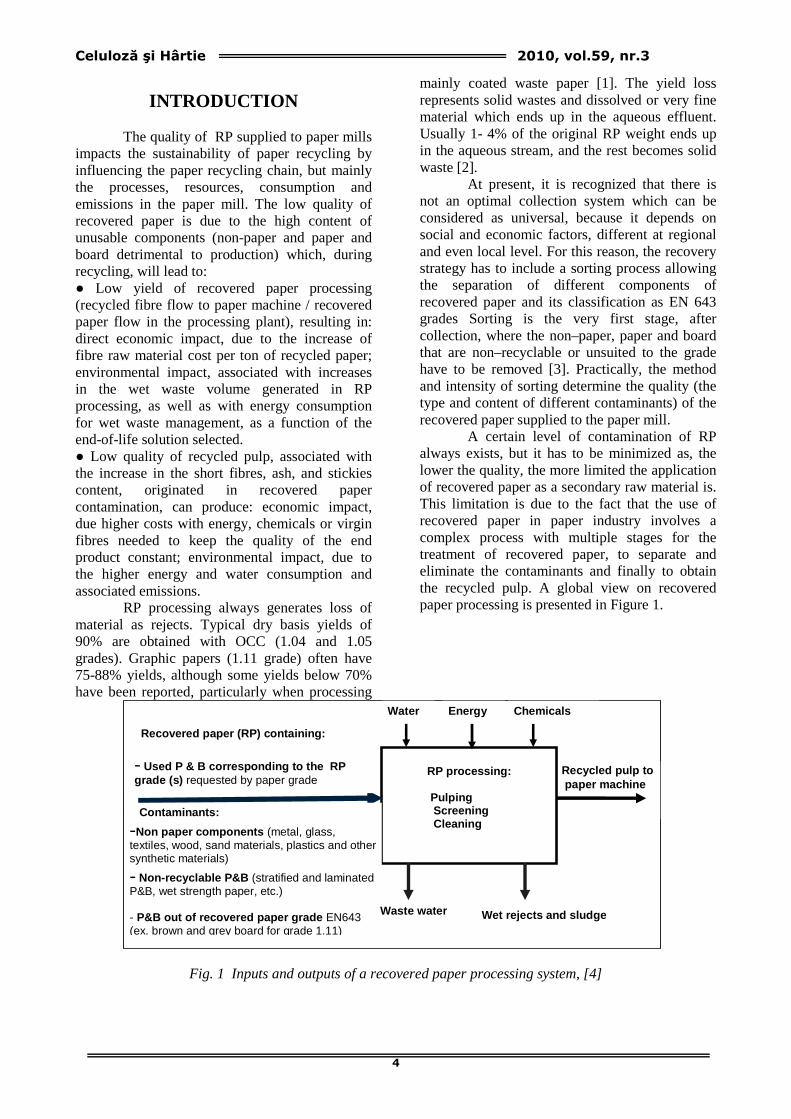
A certain level of contamination of RP always exists, but it has to be minimized as, the lower the quality, the more limited the application of recovered paper as a secondary raw material is. This limitation is due to the fact that the use of recovered paper in paper industry involves a complex process with multiple stages for the treatment of recovered paper, to separate and eliminate the contaminants and finally to obtain the recycled pulp. A global view on recovered paper processing is presented in Figure 1.
Recycled pulp to paper machine
RP processing:
Pulping Screening Cleaning
Recovered paper (RP) containing:
- Used P & B corresponding to the RP grade (s) requested by paper grade
Contaminants:
-Non paper components (metal, glass, textiles, wood, sand materials, plastics and other synthetic materials)
- Non-recyclable P&B (stratified and laminated P&B, wet strength paper, etc.) - P&B out of recovered paper grade EN643 (ex. brown and grey board for grade 1.11)
Water Energy Chemicals
Waste water Wet rejects and sludge
Fig. 1 Inputs and outputs of a recovered paper processing system, [4]
Celuloză şi Hârtie 2010, vol.59, nr.3
5
This paper focused on the general objective of the SORT-IT project: to enable sustainable and cost-effective paper recovery at above 95% yield of all recyclable paper and board grades, and to provide recovered qualities of least 98% purity that will allow the best possible re-use in paper & board products.
The interactions between unusable materials content of recovered paper and waste generation and electrical energy consumption in a recovered paper plant are presented in this paper. Trials were performed at industrial scale, in a paper mill producing testliner from recovered paper.
MILL – SCALE TRIALS
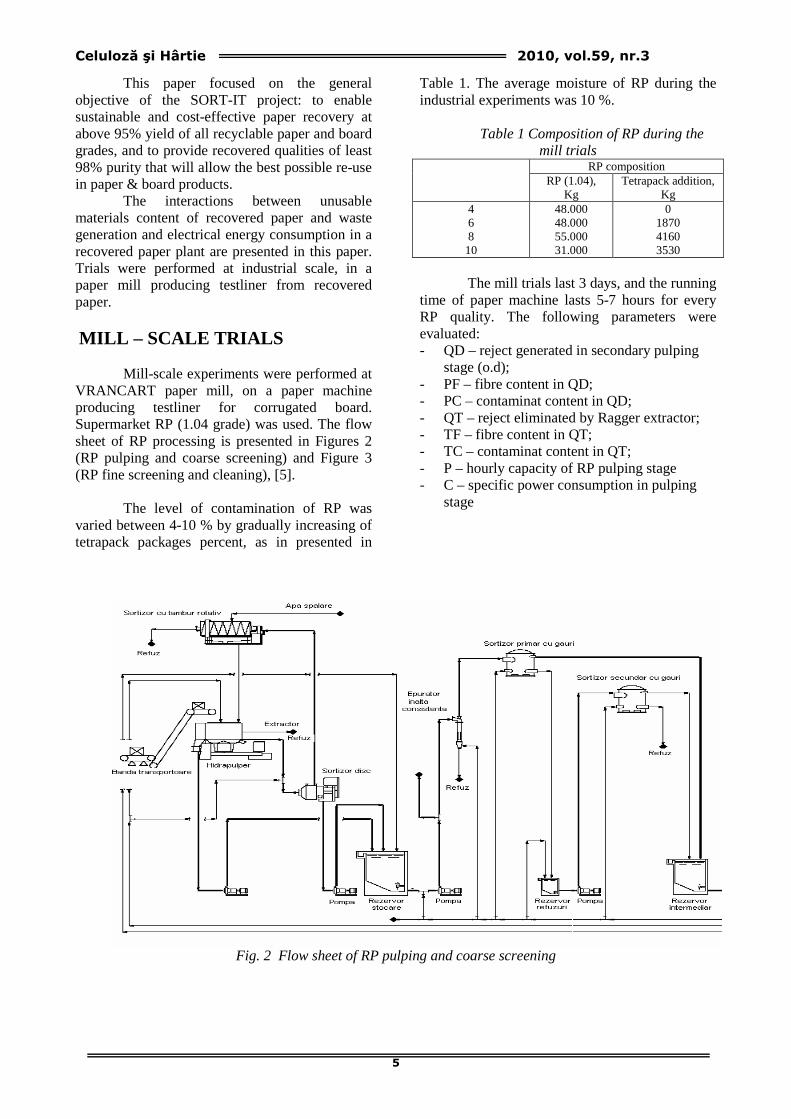
Mill-scale experiments were performed at VRANCART paper mill, on a paper machine producing testliner for corrugated board. Supermarket RP (1.04 grade) was used. The flow sheet of RP processing is presented in Figures 2 (RP pulping and coarse screening) and Figure 3 (RP fine screening and cleaning), [5].
The level of contamination of RP was varied between 4-10 % by gradually increasing of tetrapack packages percent, as in presented in
Table 1. The average moisture of RP during the industrial experiments was 10 %.
Table 1 Composition of RP during the
mill trials RP composition
RP (1.04), Kg
Tetrapack addition, Kg
4 6 8 10
48.000 48.000 55.000 31.000
0 1870 4160 3530
The mill trials last 3 days, and the running
time of paper machine lasts 5-7 hours for every RP quality. The following parameters were evaluated: - QD – reject generated in secondary pulping
stage (o.d); - PF – fibre content in QD; - PC – contaminat content in QD; - QT – reject eliminated by Ragger extractor; - TF – fibre content in QT; - TC – contaminat content in QT; - P – hourly capacity of RP pulping stage - C – specific power consumption in pulping
stage
Fig. 2 Flow sheet of RP pulping and coarse screening
Celuloză şi Hârtie 2010, vol.59, nr.3
6
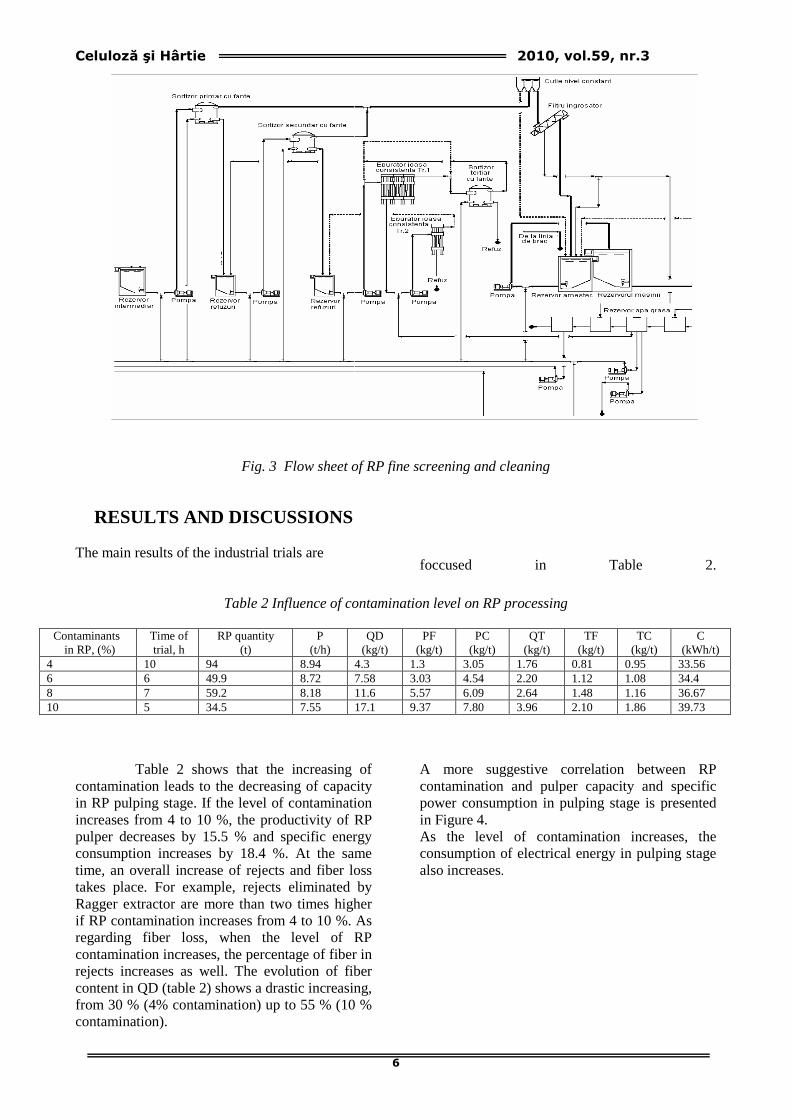
Fig. 3 Flow sheet of RP fine screening and cleaning
RESULTS AND DISCUSSIONS The main results of the industrial trials are
foccused in Table 2.
Table 2 Influence of contamination level on RP processing
Contaminants in RP, (%)
Time of trial, h
RP quantity (t)
P (t/h)
QD (kg/t)
PF (kg/t)
PC (kg/t)
QT (kg/t)
TF (kg/t)
TC (kg/t)
C (kWh/t)
4 10 94 8.94 4.3 1.3 3.05 1.76 0.81 0.95 33.56 6 6 49.9 8.72 7.58 3.03 4.54 2.20 1.12 1.08 34.4 8 7 59.2 8.18 11.6 5.57 6.09 2.64 1.48 1.16 36.67 10 5 34.5 7.55 17.1 9.37 7.80 3.96 2.10 1.86 39.73
Table 2 shows that the increasing of contamination leads to the decreasing of capacity in RP pulping stage. If the level of contamination increases from 4 to 10 %, the productivity of RP pulper decreases by 15.5 % and specific energy consumption increases by 18.4 %. At the same time, an overall increase of rejects and fiber loss takes place. For example, rejects eliminated by Ragger extractor are more than two times higher if RP contamination increases from 4 to 10 %. As regarding fiber loss, when the level of RP contamination increases, the percentage of fiber in rejects increases as well. The evolution of fiber content in QD (table 2) shows a drastic increasing, from 30 % (4% contamination) up to 55 % (10 % contamination).
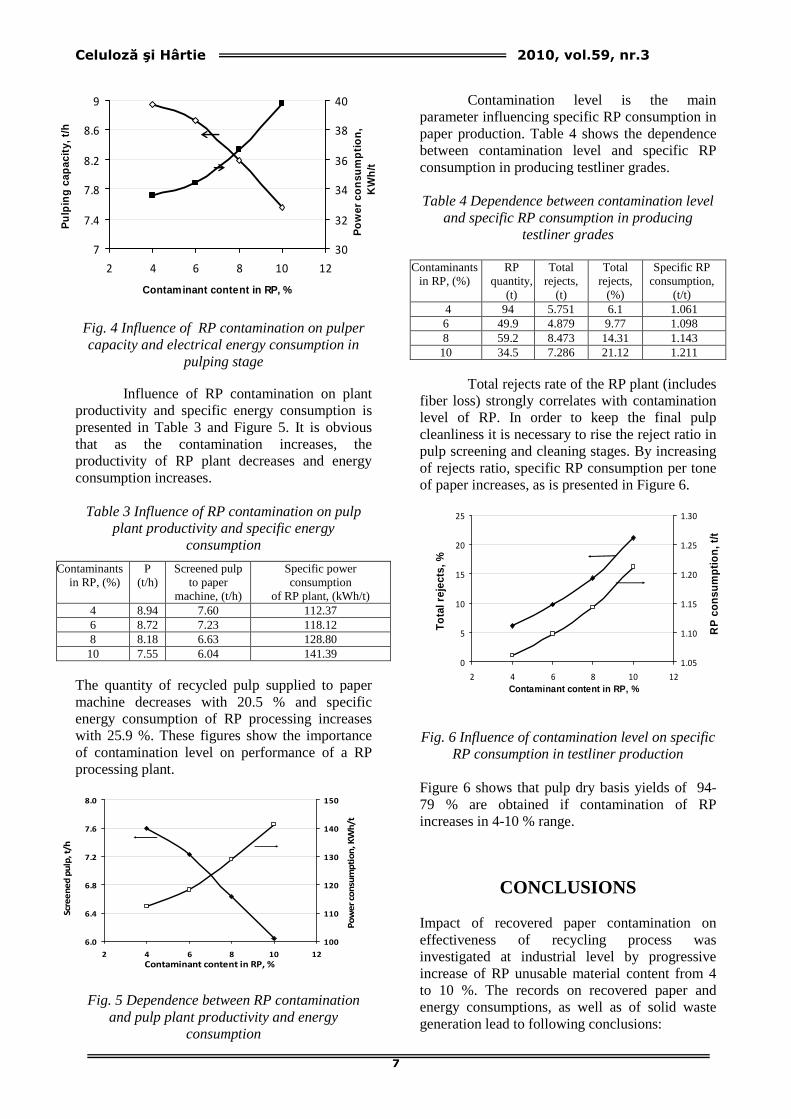
A more suggestive correlation between RP contamination and pulper capacity and specific power consumption in pulping stage is presented in Figure 4. As the level of contamination increases, the consumption of electrical energy in pulping stage also increases.
Celuloză şi Hârtie 2010, vol.59, nr.3
7
Fig. 4 Influence of RP contamination on pulper capacity and electrical energy consumption in
pulping stage
Influence of RP contamination on plant productivity and specific energy consumption is presented in Table 3 and Figure 5. It is obvious that as the contamination increases, the productivity of RP plant decreases and energy consumption increases.
Table 3 Influence of RP contamination on pulp plant productivity and specific energy
consumption
Contaminants in RP, (%)
P (t/h)
Screened pulp to paper
machine, (t/h)
Specific power consumption
of RP plant, (kWh/t) 4 8.94 7.60 112.37 6 8.72 7.23 118.12 8 8.18 6.63 128.80 10 7.55 6.04 141.39
The quantity of recycled pulp supplied to paper machine decreases with 20.5 % and specific energy consumption of RP processing increases with 25.9 %. These figures show the importance of contamination level on performance of a RP processing plant.
Fig. 5 Dependence between RP contamination and pulp plant productivity and energy
consumption
Contamination level is the main
parameter influencing specific RP consumption in paper production. Table 4 shows the dependence between contamination level and specific RP consumption in producing testliner grades. Table 4 Dependence between contamination level
and specific RP consumption in producing testliner grades
Contaminants
in RP, (%) RP
quantity, (t)
Total rejects,
(t)
Total rejects,
(%)
Specific RP consumption,
(t/t) 4 94 5.751 6.1 1.061 6 49.9 4.879 9.77 1.098 8 59.2 8.473 14.31 1.143 10 34.5 7.286 21.12 1.211
Total rejects rate of the RP plant (includes
fiber loss) strongly correlates with contamination level of RP. In order to keep the final pulp cleanliness it is necessary to rise the reject ratio in pulp screening and cleaning stages. By increasing of rejects ratio, specific RP consumption per tone of paper increases, as is presented in Figure 6.
Fig. 6 Influence of contamination level on specific RP consumption in testliner production
Figure 6 shows that pulp dry basis yields of 94-79 % are obtained if contamination of RP increases in 4-10 % range.
CONCLUSIONS
Impact of recovered paper contamination on effectiveness of recycling process was investigated at industrial level by progressive increase of RP unusable material content from 4 to 10 %. The records on recovered paper and energy consumptions, as well as of solid waste generation lead to following conclusions:
7
7.4
7.8
8.2
8.6
9
2 4 6 8 10 12
Contaminant content in RP, %
Pul
ping
cap
acity
, t/h
30
32
34
36
38
40
Pow
er c
onsu
mpt
ion,
K
Wh/
t
6.0
6.4
6.8
7.2
7.6
8.0
2 4 6 8 10 12
Contaminant content in RP, %
Scr
ee
ne
d p
ulp
, t/
h
100
110
120
130
140
150
Po
we
r co
nsu
mp
tio
n, K
Wh
/t
0
5
10
15
20
25
2 4 6 8 10 12
Contaminant content in RP, %
Tota
l rej
ects
, %
1.05
1.10
1.15
1.20
1.25
1.30
RP
con
sum
ptio
n, t/
t
Celuloză şi Hârtie 2010, vol.59, nr.3
8
• Increasing of RP contamination leads to decreasing of capacity in pulping stage with 15.5 % and specific energy consumption increased by 18.4 %;
• The content of good fibers in rejects increases drastic as well from 30 % (4% contamination) up to 55 % (10 % contamination);
• The quantity of RP pulp supplied to paper machine decreases with 20.5 % and specific energy consumption of RP processing increases with 25.9 %. Pulp dry basis yields of 94-79 % are obtained if contamination of RP increases in 4-10 % range
ACKNOWLEDGEMENTS
Financial support from the Seventh Framework Programme: Recovered Paper SORTing with Innovative Technologies, (SORT-IT), grant agreement no.: 211888 is gratefully acknowledged.
REFERENCES
1. Gavrilescu D., Bobu E., Driving forces and barriers for sustainable use of recovered paper in papermaking, Environmental Engineering and Management Journal, September/October 2009, Vol. 8, No.5, 1129-1134
2. Bobu E., Gavrilescu D., Overview on Paper and Board Recycling in Europe, 5-th International Conference on Environmental Engineering and Management, September 15-19, 2009, Tulcea, Danube Delta, Romania
3. Bobu E., and Gavrilescu D., Paper and board recycling in Europe overview on current situation FP 7 - SORT IT Technical meeting & General Assembly, 26-27 November 2009, Munich, Germany
4. Bobu E., Deliverable Report, - Project SORT-IT, grant no. 211888, WP4, D.4.2., Part 2, 2010
5. Banarie C., Master Thesis, TU Iasi, 2008
Celuloză şi Hârtie 2010, vol.59, nr.3
9
GENERAL ASPECTS CONCERNING SOIL AND UNDERGROUND WATER POLLUTION AT PULP AND
PAPER MAKING
Violeta Negreanu, Rachila Ieremie, Maria Cantea, Vasile Negreanu
Pulp and Paper Research and Development Institute - SC Ceprohart SA/Branch Suceava/Romania
Author correspondence: Pulp and Paper Research and Development Institute - SC Ceprohart SA
Suceava Branch e-mail:[email protected], tel: 0230 522 655
Abstract The main problems the present paper is focused on regard the study of investigation and evaluation ways concerning soil and undersoil pollution and recovery of affected areas, according to environmental legislation in force. The first part of the paper presents some legislative and theoretical aspects concerning the analysis of geological and hydrological environment as well as the depollution methods. The second part of the paper shows a case study regarding remediation of soil affected by historical pollution at pulp and paper making. The study sustains the pulp and papermaking in order to solve the environmental pollution problems and especially, those related to soil and underground water pollution, in order to elaborate the technical interpretative documentation required to get the deeds of arrangement. Key words: Soil, Underground water, Pollution, Depollution methods
Rezumat
În această lucrare sunt prezentate metodele de investigare şi evaluare a gradului de poluare a solului şi subsolului şi reconstruirea zonelor afectate în conformitate cu legislaţia în vigoare privind protecţia mediului. În prima parte sunt prezentate câteva aspecte teoretice şi legislative cu privire la analiza geologică şi hidrologică şi la metodele de investigare. În a doua parte se prezintă un studiu de caz privind remedierea solului afectat de poluarea istorică provenită de la fabricarea celulozei şi hârtiei. În studiu se prezintă problemele legate de poluarea solului şi a apei subterane şi modalităţile de elaborare a documentaţiei tehnice de interpretare în scopul rezolvării lor. Cuvinte cheie: Sol, Apă subterană, Poluare, Metode de depoluare
INTRODUCTION
Natural resources of Romania and industrialization policies prior to 1990 encouraged the development of highly polluting activities in the pulp and paper industry (eg.: bisulphite cooking, bleaching with chlorine, fuel storage, organic and inorganic waste disposal etc.). As a result of execution of these activities, soil and subsoil were contaminated local or regional with natural and synthetic organic substances, heavy
metals, hydrocarbons etc., causing over time the appearance and expansion of contaminated sites which currently affects environmental conditions. This raises serious investigations aimed, such as: risk assessment of contaminated sites for human population and ecosystem components; methods of investigation and assessment of contaminated sites; assuming responsibilities in the investigation and assessment of contaminated sites and establish the most appropriate and
Celuloză şi Hârtie 2010, vol.59, nr.3
10
effective methods to remedy the affected areas by historical pollution [1].
In this context, our country is taken a series of laws on soil and subsoil protection of which the most important for our problem is the Government Decision no. 1408/19.11.2007 concerning the investigation and assessment of soil and subsoil pollution and the Government Decision no. 1403/19.11.2007 concerning the restoration of the soil, subsoil and terrestrial ecosystems were affected [2], [3].
The aim of investigating and assessing soil and subsoil pollution is is the delimitation of the polluted area, clarifying the nature and intensity of pollution identified, the relationship of pollutants with mineral matrix of rocks and geological environment structure, migration routes and transport of pollutants and risk assessment of geological data necessary to compile programs or geological environmental remediation projects. Investigation of geological environment for assessment of contamination is achieved through specific methods soil, geological and/or hydrogeological, geochemical and geophysical.
Remediation methods of contaminated soil must be determined taking into account on the one hand the total effects of contaminated soil on human health, on the source of water, on ecosystems, on buildings and sites important to the community etc., and on the other hand it must be evaluated in detail, so that it can be known benefits of remediation / decontamination and financial effort that can be achieved. For soil decontamination methods using both physicochemical and biotechnological methods [4].
The best known Physicochemical methods are: excavation method, injection method "venting", the method of flotation, electrical extraction method, extraction by heating, washing with solvents, washing with water. Usually physicochemical methods consist of the removal of polluted soil, treating it (with one or more methods above) and then putting it back. Physicochemical methods are generally avoided because of achieving generates huge costs due to transport and storage. But the advantage to solve the problem quickly and may be an optimal solution where time takes precedence over decontamination remediation budget. Biotechnological methods are based on using bacteria or plants for soil remediation. Using bacteria for the remediation to treat, recycle and even eliminate unwanted or dangerous elements in the soil, such as hydrocarbons or heavy metals. Using plant or phyto-remediation can be
performed for the total destruction of pollutants, or for their stabilization in soil. Of remediation techniques with the most popular herbs are phyto-stabilization, phyto-extraction fizo-degradation, phyto-volatilization.
EXPERIMENTAL
Case study, subject of this paper, focused on researching and evaluating soil and subsoil pollution at the site of pulp and paper sector in the country, affected by historical pollution as a result of final cessation of the manufacture of bleached sulphite pulp from softwood and final closure of organic and inorganic waste dump. Investigation and assessment study was done by using a combination of research methods including pedological, hydrological and geochemical. Research methodology consisted of:
• Research of existing and specific data on analysed area;
• Work in the field, direct observation, sampling;
• Geochemical Sampling of soil and groundwater samples;
A. Research of existing and specific data on analysed area
Following tests carried out by researchers
from the Institute of Pedology and Agrochemistry Bucharest, the profile of soil to a depth of 100 cm, showed that the geological environment of the industrial site, as a result of anthropogenic activity, shows specific characteristics of alluvial protosols class with sandy to clayey texture.
Following tests carried out on soil profiles, on samples of plants and vegetal material, results that the geological environment of the adjacent industrial objective, as a result of anthropogenic activity, shows specific characteristics of clayluvisoil class (brown clay type soils, brown luvic soils and albic luvisoils), cambisoils class (brown type mesobasic), non-devoloped or cropped soils class (alluvial protosoils and erodidsoil type).
From the data provided by existing drilling at the site examined, results that the aquifer levels of first category, groundwater, is encountered at depths than 6-8 m, hydrostatic level is at approx. 1-15 m from ground level, depending of limestone formations in the area. Temporal variation of flow is 6-15 l/s conditioned by: the local rainfall regime, oscillations of the surface water level, emissary river, technical losses in the technological process of analyzed objective, or neighborhoods.

Celuloză şi Hârtie 2010, vol.59, nr.3
11
On analyzed site the hydrostatic level lies at a depth of 1.95 m. However, recent excavations carried out on site demonstrate that hydrostatic level is even less than 1 m deep. To the information available from geotechnical studies performed on the platform, in terms of migrating groundwater, river receiving the effluent of analyzed objective is a drain for the area whose groundwater flow direction is parallel to the riverbed.
B. Work in the field, direct observation, sampling
The geotechnical trenches performed on
site revealed a geological sequence represented by: blocks, gravel and sand in interspaces (crystalline nature and sedimentary), above which were made loamy sand, who constitute alteration crust of the earth (clay-type accumulation) with weak to moderate clay content.
Soil samples were taken from two depths, located at 5 cm, respectively, 30-40 cm from soil surface, under the provisions of Order No. 184/97. Collection points for soil samples are presented in table 1.
Table 1 Collection points for soil samples
Plane position Name of adjacent plant Zone A Industrial site - Less sensitive use (site inoperable) Point: E1 Diesel oil deposit area / dismantled area Point: E2 Sulfur deposit area / dismantled area Point: E3 Ammonium sulphite plant area / dismantled area Point: E4 Storage facilities area and chemical preparation / dismantled area Point: S4 Fuel-oil tanks, south side / dismantled and monitored area Point: S5 Bleaching agent preparation plant /dismantled and monitored area Point: S6 Old waste storehouse, east side / dismantled and monitored area Zone B Outdoor enclosure - Sensitive Use Point: S7 Outside the company enclosure, in the SE side
Soil sampling was done taking into
account the following criteria: areas that have been used to temporarily store raw materials, auxiliary materials, fuels containing hazardous substances and / or hazardous waste, the distribution of all cardinal directions, near sources of pollution, including sources of air pollution; to be included soils both of less sensitive use category - Zone A, and the sensitive use category - Zone B Groundwater samples were taken from the two existing drilling site:
• F1 drilling (Diesel oil deposit area);
• F3 drilling (drain of treatment plant).
Groundwater are affected by historical pollution and/or current activities, by wastewater emissions falling to the ground and underground, because of possible leaks from sewage systems, accidental spills from plants, deposits of mud and waste on site and also because of transport phenomena of atmospheric emissions of precipitation fell during the year, especially during Steam Boiler operation on diesel oil. Although concrete platforms were approx. 80% of the enclosure, located on the right side of the
receiver, corrosiveness of working environment and the age of platforms have created possible pathways of pollutants in soil and groundwater. C. Geochemical Sampling Soil
Impact assessment of soil pollution in the area affected by historical pollution - was conducted by SC CEPROHART SA Braila - Research and Design Institute of Pulp and Paper Industry. Investigations have resulted in physical and chemical analysis carried out on soil samples taken from two depths required by law, namely: Ord. 184/1997 and Ord. 756/1997.
Nature and degree of soil pollution were based on physical-chemical analysis results of soil samples collected in the study area: the dismantled - demolished installations and outside the company. Soil pollution indicators have been established under the provisions of Ord MAPPM no. 184/97 Annex A.3.1, depending on area history, the risk of attack on building materials, the utilizations and the risk of polluting the groundwater pH, sulphates, sulphides, chlorides,
Celuloză şi Hârtie 2010, vol.59, nr.3
12
phenols, oil products, nitrates, nitrites, copper, nickel, lead. Soil samples were pretreated in accordance with ISO 11466 / 1999 by separating coarse material, removing plant debris, drying and mixing the sample, and chemical analysis were performed to determine the nature and extent of pollution. For the determination of heavy metals: Pb, Ni, Cu, standardized method was applied ISO 11047/98 - "Soil quality. Determination of Cu, Pb, Ni in the aqueous extract with aqua regia” and spectrophotometer DR/2800 of the SC CEPROHART S.A Braila environmental laboratory. Spectrophotometer DR/2800 was used to determine indicators: sulphates, sulphides, phenols, nitrates, nitrites, chlorides, ammonia nitrogen.
Groundwater According to standardized methods have
been carried out for the following indicators: pH, COD, ammonium, nitrites, nitrates, sulphides, sulphates, phenols, extractible substances in petroleum ether (ESPE), Cu, Ni, Pb. Heavy metal group analyzed only lead is classified as potentially toxic chemicals, other Ni, Cu, are undesirable chemicals group, elements belonging to the natural composition of water and can cause changes in physical and organoleptic properties of water , making it unfit for consumption. To determine indicators of water pollution, using the DR 2800 spectrophotometer, COD reactor, Multimeter Multi 340i WTH (dissolved oxygen, conductivity, pH) and standard analytical methods.
RESULTS AND DISCUSSION
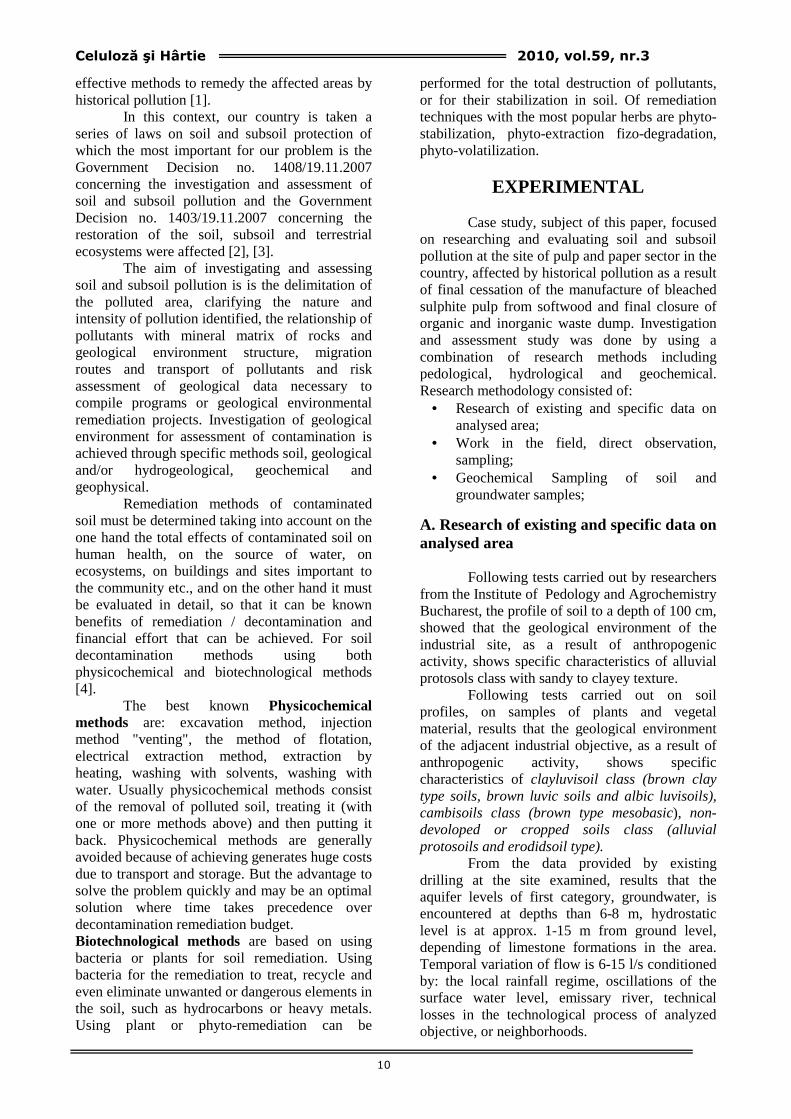
The test results of soil samples are presented in Table 2. Analysis of data contained in the table it was found that soil samples at both depths, revealed
the presence in soil of all compounds proposed to investigate, as follows:
• pH of soil samples is included in the area: slightly alkaline soil with 7.6 to 7.9 in the sensitive land use - sample S7 and weak acid and neutral soils with values ranging from 5.94 to 7.01 to use less sensitive area;
• Sulphide concentrations at all points analyzed are below the alert threshold;
• Sulphate concentrations in the sensitive area of service below the alert threshold. For industrial use zone points E2, E3 and E4 levels are between warning threshold and the threshold of intervention, but values closer than the action alert threshold;
• Phenol concentrations in the samples from the site at both depths studied below the alert threshold for the type of service covered less sensitive, for use of sensitive values are below normal;
• With regard to petroleum products to points E1 and S4 values are below the alert threshold for the use of less sensitive;
• In all samples from the site at both depths studied, concentrations in metal ions: copper, nickel, lead levels are above normal but lower concentrations to alert thresholds for less sensitive soil.
• The soil blank sample, S7, in the neighborhood of the site, at both depths studied, concentrations of chemical elements in soil are covered under the alert threshold for the type of usage sensitive, although metal concentrations are above the normal usage of sensitive soils.
Table 2 Test results concerning the content of pollutants in soil [mg/kg dry]
Sample H, cm
pH Sulphide Sulphate NH4 NO3 NO2 Phenol Cl p.p Pb Cu Ni
Zone A Less sensitive land use, industrial use area 5 6,39 12,5 453 - - - 0,14 - 379 68,5 92,1 59,5 E1 30 6,45 abs 1.235 - - - 0,17 - 294 63,6 88,4 70,2 5 6,79 284 11.873 - - - 0,38 - - 76,3 68.9 88.1 E2 30 6,83 173 10.373 - - - 0,33 - - 79,6 72,6 74,2 5 6,10 163 10.876 13,8 24,7 8,3 0,30 21,4 - 83,0 59,6 99,3 E3 30 6,32 89 10.173 11,3 19,8 7,6 0,22 19,5 - 73,8 67,2 89,0 5 5,94 29,8 7.451 9,2 10,5 25,3 0,30 14,0 - 109 75,7 74,6 E4 30 6,02 48,9 6.956 6,7 12,4 19,3 0,33 15,1 - 68,9 69,3 59,2 5 6,91 abs 352 - - - 0,21 - 187 65,2 49,6 66,5 S4 30 7,01 18,5 401 - - - 0,24 - 212 70,1 57,9 61,4
Celuloză şi Hârtie 2010, vol.59, nr.3
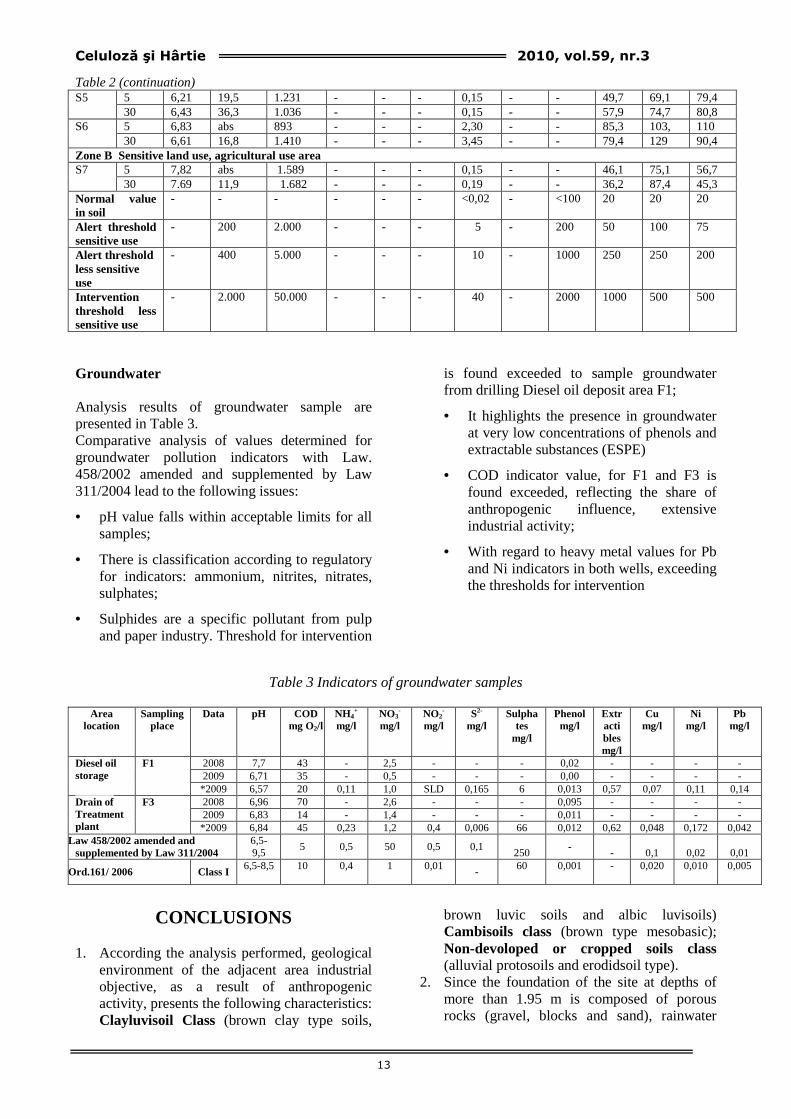
13
Table 2 (continuation) 5 6,21 19,5 1.231 - - - 0,15 - - 49,7 69,1 79,4 S5 30 6,43 36,3 1.036 - - - 0,15 - - 57,9 74,7 80,8 5 6,83 abs 893 - - - 2,30 - - 85,3 103, 110 S6 30 6,61 16,8 1.410 - - - 3,45 - - 79,4 129 90,4
Zone B Sensitive land use, agricultural use area 5 7,82 abs 1.589 - - - 0,15 - - 46,1 75,1 56,7 S7 30 7.69 11,9 1.682 - - - 0,19 - - 36,2 87,4 45,3
Normal value in soil
- - - - - - <0,02 - <100 20 20 20
Alert threshold sensitive use
- 200 2.000 - - - 5 - 200 50 100 75
Alert threshold less sensitive use
- 400 5.000 - - - 10 - 1000 250 250 200
Intervention threshold less sensitive use
- 2.000 50.000 - - - 40 - 2000 1000 500 500
Groundwater Analysis results of groundwater sample are presented in Table 3. Comparative analysis of values determined for groundwater pollution indicators with Law. 458/2002 amended and supplemented by Law 311/2004 lead to the following issues:
• pH value falls within acceptable limits for all samples;
• There is classification according to regulatory for indicators: ammonium, nitrites, nitrates, sulphates;
• Sulphides are a specific pollutant from pulp and paper industry. Threshold for intervention
is found exceeded to sample groundwater from drilling Diesel oil deposit area F1;
• It highlights the presence in groundwater at very low concentrations of phenols and extractable substances (ESPE)
• COD indicator value, for F1 and F3 is found exceeded, reflecting the share of anthropogenic influence, extensive industrial activity;
• With regard to heavy metal values for Pb and Ni indicators in both wells, exceeding the thresholds for intervention
Table 3 Indicators of groundwater samples
Area location
Sampling place
Data pH COD mg O2/l
NH4+
mg/l NO3
- mg/l
NO2-
mg/l S2-
mg/l Sulpha
tes mg/l
Phenol mg/l
Extractibles mg/l
Cu mg/l
Ni mg/l
Pb mg/l
2008 7,7 43 - 2,5 - - - 0,02 - - - - 2009 6,71 35 - 0,5 - - - 0,00 - - - -
Diesel oil storage
F1
*2009 6,57 20 0,11 1,0 SLD 0,165 6 0,013 0,57 0,07 0,11 0,14 2008 6,96 70 - 2,6 - - - 0,095 - - - - 2009 6,83 14 - 1,4 - - - 0,011 - - - -
Drain of Treatment plant
F3
*2009 6,84 45 0,23 1,2 0,4 0,006 66 0,012 0,62 0,048 0,172 0,042 Law 458/2002 amended and
supplemented by Law 311/2004 6,5-9,5
5 0,5 50 0,5 0,1
250 -
-
0,1
0,02
0,01
Ord.161/ 2006 Class I 6,5-8,5 10 0,4 1 0,01
- 60 0,001 - 0,020
0,010
0,005
CONCLUSIONS
1. According the analysis performed, geological
environment of the adjacent area industrial objective, as a result of anthropogenic activity, presents the following characteristics: Clayluvisoil Class (brown clay type soils,
brown luvic soils and albic luvisoils) Cambisoils class (brown type mesobasic); Non-devoloped or cropped soils class (alluvial protosoils and erodidsoil type).
2. Since the foundation of the site at depths of more than 1.95 m is composed of porous rocks (gravel, blocks and sand), rainwater
Celuloză şi Hârtie 2010, vol.59, nr.3
14
infiltrates into the depths and dissipate historical pollutants.
3. Current and past activities on the site examined lead to an impact on groundwater, by the pollution with oxidisable organic substances, phenols, extractable substances and heavy metals as a cumulative effect of prolonged operation of the pulp and paper mill.
4. However, considering that in many "hot points", the pollution was stopped by the closure of production capacity (eg. Pulp mill), and continue to appreciate gradually decrease the pollution of soil and underground site.
5. In the area of old waste storehouse it is recommended to rebuild the plant surface soil layer at the end of the operation of decontamination, according to the final destination of the land as "sensitive use". Typically, this reconstruction is achieved through well-established farming methods (early rehabilitation overburden layer plant decontamination operation, whether to add the contribution of fertile surface layer in other areas, with appropriate addition of fertilizer - preferably of natural origin, ploughing/disking
soil and seeding of grass species (eg., Trifolium repens variety S100, 2.75 kg / ha)
REFERENCES
1. Technical guide on procedures for investigating and assessing the soil and subsoil contamination – project
2. GD. 1408/2007, published in O.G Part I no. 802/23 November 2007.
3. GD. 1403/2007, published in O.G Part I no. 804/26 November 2007.
4. Neag G., Remediation of soil and groundwater, Book of Science House, Cluj - Napoca, 122-223, (1997)
Celuloză şi Hârtie 2010, vol.59, nr.3
15
EVALUAREA RESURSEI POTEN ŢIALE DE MATERII PRIME/MATERIALE SECUNDARE A SECTORULUI
PAPETAR DIN ROMÂNIA ŞI ANALIZA CONTEXTULUI LEGISLATIV
Constantin Chiriac*), Boris Andronic**) , Eva Cristian**) ,
Gheorghe Cazan**) , Cristian Mormocea**) , Valentina Scarlet**) *)ROMPAP, Bucureşti, România; **) S.C. CEPROHART S.A. Brăila, România
Corespondenţa autor: Institutul de Cercetare-Dezvoltare pentru Celuloză şi Hârtie
SC Ceprohart SA Brăila, B/dul Al.I Cuza nr.3, Braila, tel: 0239 619 741, e-mail: [email protected]
Rezumat
În ultimii ani, industria românească de hârtii şi cartoane a evoluat spre producerea de sortimente papetare, care utilizează ca materie primă fibroasă maculatura într-o proporţie majoritară, la unele sortimente cum ar fi hârtiile igienico – sanitar şi hârtiile de ambalaj şi chiar de 100% la hârtiile pentru carton ondulat şi hârtia de ziar. La nivelul anului 2009 cantitatea de maculatură colectată/reciclată s-a cifrat la 324 t, la o rată de colectare de cca. 41% şi o rată de utilizare de 93,4%. În prezent, unităţile de reciclare a maculaturii se confruntă cu o serie de dificultăţi privind asigurarea necesarului de maculatură, datorită competiţiei externe, din ce în ce mai acerbe. Prezenta lucrare a fost elaborată în perioada 2008-2010 în cadrul Programului Sectorial în domeniul cercetării – dezvoltării în industrie/2008, având drept obiectiv general, creşterea gradului de reciclare, respectiv valorificare a deşeurilor de hârtii şi cartoane. Conform Planului de realizare a proiectului, lucrarea a fost elaborată şi structurată pe trei direcţii principale şi anume: - Situaţia actuală şi de perspectivă privind necesarul şi modul de asigurare cu maculatură al sectorului papetar, comparativ cu ţările UE; - Analiza legislaţiei naţionale şi europene privind deşeurile, deşeurile reciclabile şi deşeurile de ambalaje, precum şi implicaţiile transpunerii noii Directive cadru privind deşeurile, asupra reciclării interne a maculaturii; - Propuneri de măsuri/acţiuni pentru creşterea gradului de colectare, respectiv de reciclare a maculaturii, inclusiv prin crearea de operatori zonali de intermediere şi centre de colectare a maculaturii proprii sectorului papetar. Cuvinte cheie: Reciclare, Valorificare, Colectare, Hârtii şi Cartoane Recuperate
Abstract
The Romanian paper and board industry has developed to the production of paper grades, that use as raw material, a major percentage of recovered paper for sanitary papers and even 100% for container board and newspaper. In 2009, the collected/recycled recovered paper quantity represented 324 t, at a collection rate of around 41% and a use rate of 93.4%. At present, the recovered paper recycling units are facing difficulties concerning the provision of recovered paper requirement due to the increasingly keen foreign competition. The present paper was carried out in 2008-2010 within the Sectoral Research-Development Program in industry/ 2008, having as general objective, the rise of recycling degree, recovery of paper and board waste, respectively. According to the Project Plan, the paper has been elaborated and structured on three main directions, namely: - The current and far-reaching situation concerning requirement and way of
covering the recovered paper requirement of the paper industry, compared to the EU countries;

Celuloză şi Hârtie 2010, vol.59, nr.3
16
- Analysis of the national and European legislation regarding waste, recyclable waste and packaging waste, as well as the implications of transferring the new Waste Framework Directive onto domestic waste paper recycling;
- Proposals of measures/actions to rise the collection rate, the recovered paper recycling rate respectively, including by means of creating intermediation area operators and collection centers of waste paper from the paper sector.
Key words: Recycling, Valorization, Collection, Paper and Boards Recovered
INTRODUCERE I. Analiza situaţiei actuale şi de perspectivă privind necesarul şi modul de asigurare cu maculatură a sectorului papetar, comparativ cu ţările UE
În cadrul sectorului papetar, care reprezintă singurul valorificator/reciclator pentru maculatură la nivel naţional, se manifestă în mod ciclic următoarele fenomene specifice economiei de piaţă: • Fluctuaţii mari în oferta de preţ şi cantitate a
colectorilor; • Apariţia de stocuri mari de maculatură fie la
colectori, fie la reciclatori, sau • Criză de maculatură şi preţuri foarte mari; • Creşterea cererii/ofertei la export şi reducerea
corespunzătoare a ofertei pentru reciclatorii interni.
În prezent, unităţile de reciclare a maculaturii se confruntă cu mari dificultăţi privind asigurarea necesarului de maculatură, datorită competiţiei externe, din ce în ce mai acerbe. Astfel că, situaţia actuală poate fi caracterizată prin: - Cantitate insuficientă de maculatură pe piaţă,
datorită creşterii dramatice a exportului (cca 5.000 t/lună);
- Creştere continuă a preţurilor (cca 105 – 120 Euro/t în cazul maculaturii din C.O.);
- Înrăutăţirea calităţii maculaturii pentru consumul intern, ca urmare a valorificării la export a maculaturii de calitate mai bună;
- Condiţionarea livrării maculaturii din c.o. cu livrarea unor cantităţi de maculatură din ziare şi reviste (ca efect al închiderii fabricii LETEA, Bacău).
Principala competiţie la care trebuie să facă faţă la ora actuală reciclatorii din sector este competiţia cu exportul. Exportul de maculatură în anul 2009 a crescut alarmant datorită în principal:
- unor preţuri mai mari şi a unor condiţii de plată mai avantajoase, oferite colectorilor de maculatură în cazul exportului,
- apariţiei unei capacităţi noi de producţie pentru hârtiile miez-capac, mare consumatoare de maculatură, cum este cazul firmei DUNAPACK în Ungaria.
Escaladarea preţurilor la maculatura din România poate pune în pericol asigurarea cu materia primă fibroasă principală a sectorului de celuloză şi hârtie, mai ales că în viitorul apropiat, vor apărea pe piaţă şi alţi noi consumatori de maculatură din carton ondulat. Cum s-a ajuns aici?
Evoluţia principalilor indicatori ai sectorului papetar din România în perioada 2001 – 2009 se prezintă în tabelul 1 şi în figurile 1 şi 2.
Celuloză şi Hârtie 2010, vol.59, nr.3
17
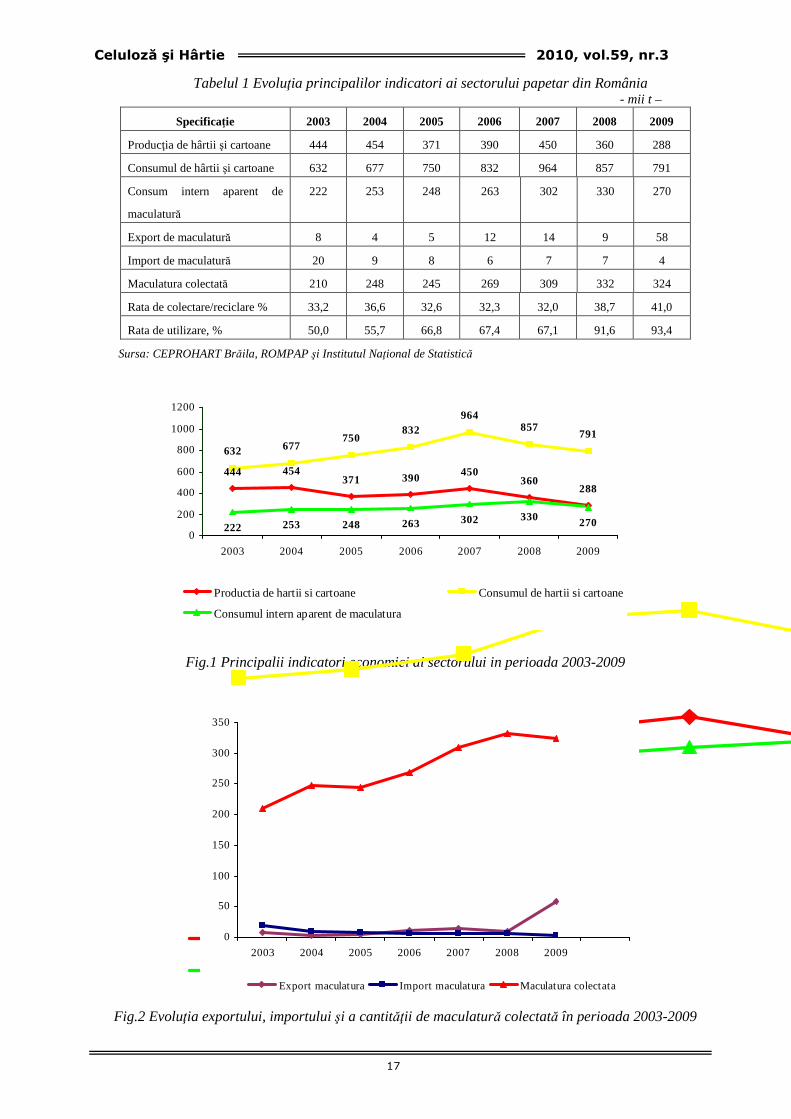
Tabelul 1 Evoluţia principalilor indicatori ai sectorului papetar din România - mii t –
Specificaţie 2003 2004 2005 2006 2007 2008 2009
Producţia de hârtii şi cartoane 444 454 371 390 450 360 288
Consumul de hârtii şi cartoane 632 677 750 832 964 857 791
Consum intern aparent de
maculatură
222 253
248
263
302
330
270
Export de maculatură 8 4 5 12 14 9 58
Import de maculatură 20 9 8 6 7 7 4
Maculatura colectată 210 248 245 269 309 332 324
Rata de colectare/reciclare % 33,2 36,6 32,6 32,3 32,0 38,7 41,0
Rata de utilizare, % 50,0 55,7 66,8 67,4 67,1 91,6 93,4
Sursa: CEPROHART Brăila, ROMPAP şi Institutul Naţional de Statistică
Fig.1 Principalii indicatori economici ai sectorului in perioada 2003-2009
444 454371 390
450360
632 677750
932 964857
222 253 248 263 302 330
0
200
400
600
800
1000
1200
2003 2004 2005 2006 2007 2008
Productia de hartii si cartoane Consumul de hartii si cartoane
Consumul intern aparent de maculatura
Fig.2 Evoluţia exportului, importului şi a cantităţii de maculatură colectată în perioada 2003-2009
0
50
100
150
200
250
300
350
2003 2004 2005 2006 2007 2008 2009
Export maculatura Import maculatura Maculatura colectata
444 454371 390 450
360288
632 677750
832964
857791
222 253 248 263 302 330 2700
200
400
600
800
1000
1200
2003 2004 2005 2006 2007 2008 2009
Productia de hartii si cartoane Consumul de hartii si cartoane
Consumul intern aparent de maculatura

Celuloză şi Hârtie 2010, vol.59, nr.3
18
Din datele prezentate în tabelul 1, figurile 1 şi 2, rezultă că:
• Producţia de hârtii şi cartoane a cunoscut două vârfuri, în anii 2004 şi 2007, când nivelurile de producţie au fost de 454 mii tone, respectiv de 450 mii tone, în concordanţă cu evoluţia economiei din România;
• Începând cu anul 2008 se constată o reducere semnificativă a nivelului de producţie, reducerea accentuându-se şi mai mult în anul 2009, datorită încetării activităţii la societăţile CELHART DONARIS Brăila, CELROM Tr. Severin, CAHIRO Scăieni şi MUCART Cluj, concomitent cu reducerea producţiei la celelalte societăţi;
• Ca urmare a închiderii fabricilor
producătoare de celuloză şi semiceluloză, industria de celuloză şi hârtie din ţara noastră a evoluat spre producţia de sortimente papetare, care pot utiliza maculatura ca materie primă fibroasă, într-o proporţie majoritară, respectiv hârtii pentru carton ondulat, hârtie de ziar şi hârtii igienico-sanitare;
• Cantitatea de maculatură colectată în anul 2009 a fost apropiată de cea colectată în anul 2008 (cca 332/324 t), dar rata de colectare a crescut de la 38,7 % la 41 % ; această valoare de 41 % a ratei de colectare se situează însă mult sub cea realizată de media ţărilor CEPI de 72,2%;
Fig. 3 Evoluţia ratei de colectare/reciclare a maculaturii în general, comparativ cu rata de
colectare/reciclare CEPI, în perioada 2003-2009
• Rata de utilizare a maculaturii cunoaşte un salt semnificativ de la 67,1% în 2007,
la 91,6% în 2008 şi respectiv 93,4% în 2009;
Fig. 4 Evoluţia ratei de utilizare a maculaturii în general, comparativ cu rata de utilizare CEPI, în perioada 2003 – 2009
33.2 36.6 32.6 32.3 3238.7 41
56.5 58.8 62.1 63.1 64.6 66.772.2
010
2030
4050
6070
80
2002 2003 2004 2005 2006 2007 2008 2009 2010
Rata de colectare/reciclare Romania % Rata de colectare/reciclare CEPI %
5055.7
66.8 67.4 67.1
91.6 93.4
44.3 45.5 47.8 49.7 49.6 49.1 50.7
0
20
40
60
80
100
2002 2003 2004 2005 2006 2007 2008 2009 2010
Rata de utilizare Romania % Rata de utilizare CEPI %
Celuloză şi Hârtie 2010, vol.59, nr.3
19
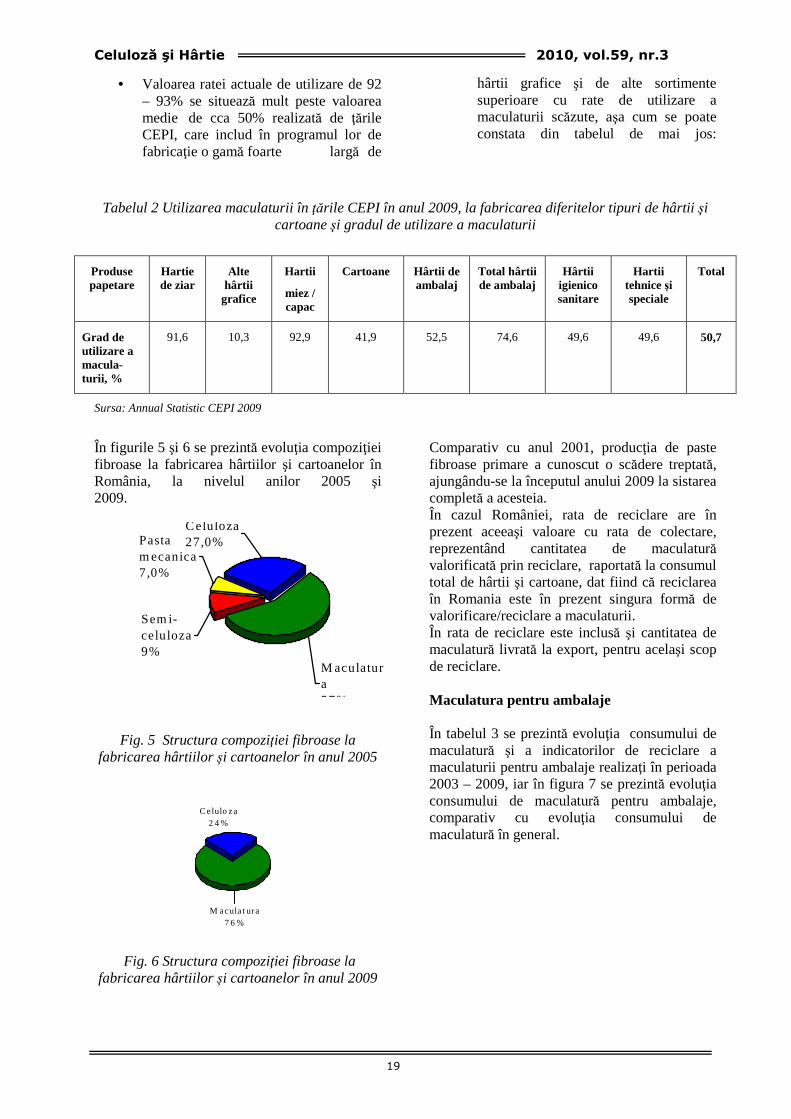
• Valoarea ratei actuale de utilizare de 92 – 93% se situează mult peste valoarea medie de cca 50% realizată de ţările CEPI, care includ în programul lor de fabricaţie o gamă foarte largă de
hârtii grafice şi de alte sortimente superioare cu rate de utilizare a maculaturii scăzute, aşa cum se poate constata din tabelul de mai jos:
Tabelul 2 Utilizarea maculaturii în ţările CEPI în anul 2009, la fabricarea diferitelor tipuri de hârtii şi
cartoane şi gradul de utilizare a maculaturii
Produse papetare
Hartie de ziar
Alte hârtii grafice
Hartii
miez / capac
Cartoane Hârtii de ambalaj
Total hârtii de ambalaj
Hârtii igienico sanitare
Hartii tehnice şi speciale
Total
Grad de utilizare a macula-turii, %
91,6 10,3 92,9 41,9 52,5 74,6 49,6 49,6 50,7
Sursa: Annual Statistic CEPI 2009
În figurile 5 şi 6 se prezintă evoluţia compoziţiei fibroase la fabricarea hârtiilor şi cartoanelor în România, la nivelul anilor 2005 şi 2009.
Pasta m ecanica7,0%
Celuloza27,0%
M aculatura57%
Sem i-celuloza9%
Fig. 5 Structura compoziţiei fibroase la
fabricarea hârtiilor şi cartoanelor în anul 2005
M acula t ura7 6 %
Celulo za2 4 %
Fig. 6 Structura compoziţiei fibroase la fabricarea hârtiilor şi cartoanelor în anul 2009
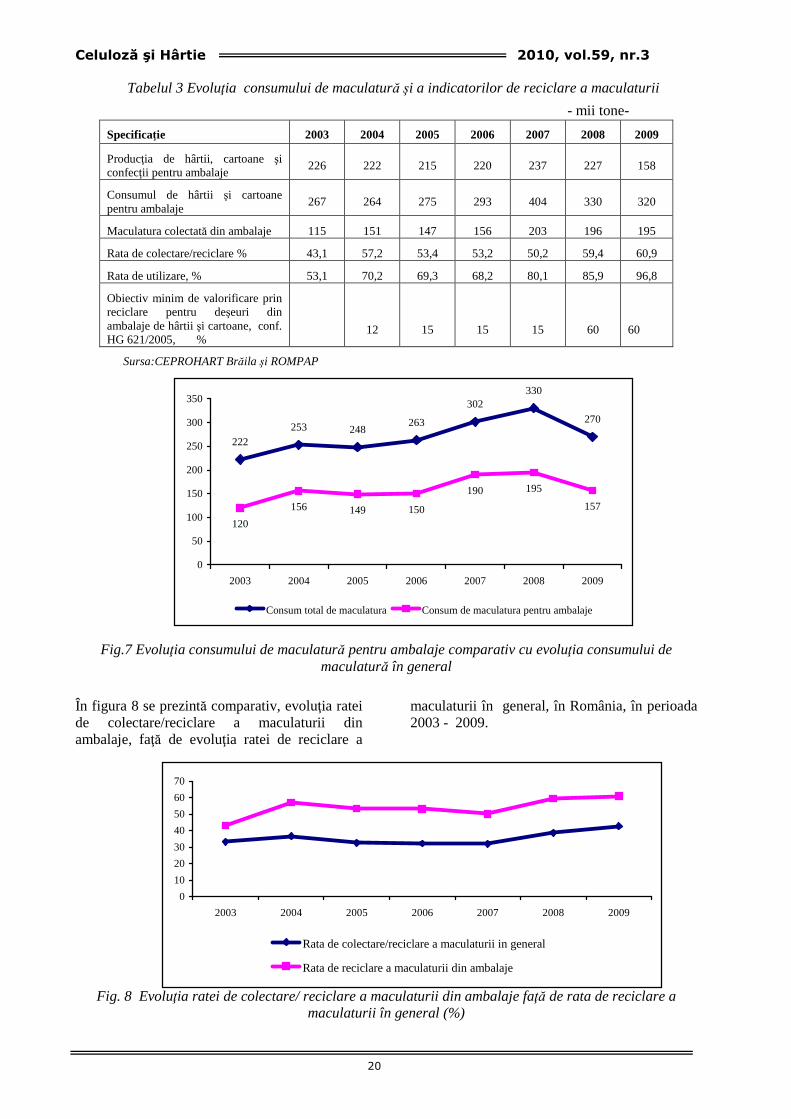
Comparativ cu anul 2001, producţia de paste fibroase primare a cunoscut o scădere treptată, ajungându-se la începutul anului 2009 la sistarea completă a acesteia. În cazul României, rata de reciclare are în prezent aceeaşi valoare cu rata de colectare, reprezentând cantitatea de maculatură valorificată prin reciclare, raportată la consumul total de hârtii şi cartoane, dat fiind că reciclarea în Romania este în prezent singura formă de valorificare/reciclare a maculaturii. În rata de reciclare este inclusă şi cantitatea de maculatură livrată la export, pentru acelaşi scop de reciclare. Maculatura pentru ambalaje În tabelul 3 se prezintă evoluţia consumului de maculatură şi a indicatorilor de reciclare a maculaturii pentru ambalaje realizaţi în perioada 2003 – 2009, iar în figura 7 se prezintă evoluţia consumului de maculatură pentru ambalaje, comparativ cu evoluţia consumului de maculatură în general.
Celuloză şi Hârtie 2010, vol.59, nr.3
20
Tabelul 3 Evoluţia consumului de maculatură şi a indicatorilor de reciclare a maculaturii
- mii tone-
Specificaţie 2003 2004 2005 2006 2007 2008 2009
Producţia de hârtii, cartoane şi confecţii pentru ambalaje
226 222 215 220 237 227 158
Consumul de hârtii şi cartoane pentru ambalaje
267 264 275 293 404 330 320
Maculatura colectată din ambalaje 115 151 147 156 203 196 195
Rata de colectare/reciclare % 43,1 57,2 53,4 53,2 50,2 59,4 60,9
Rata de utilizare, % 53,1 70,2 69,3 68,2 80,1 85,9 96,8
Obiectiv minim de valorificare prin reciclare pentru deşeuri din ambalaje de hârtii şi cartoane, conf. HG 621/2005, %
12
15
15
15
60
60
Sursa:CEPROHART Brăila şi ROMPAP
Fig.7 Evoluţia consumului de maculatură pentru ambalaje comparativ cu evoluţia consumului de
maculatură în general
În figura 8 se prezintă comparativ, evoluţia ratei de colectare/reciclare a maculaturii din ambalaje, faţă de evoluţia ratei de reciclare a
maculaturii în general, în România, în perioada 2003 - 2009.
Fig. 8 Evoluţia ratei de colectare/ reciclare a maculaturii din ambalaje faţă de rata de reciclare a
maculaturii în general (%)
222253 248
263
302330
270
120
156 149 150
190 195
157
0
50
100
150
200
250
300
350
2003 2004 2005 2006 2007 2008 2009
Consum total de maculatura Consum de maculatura pentru ambalaje
0
10
20
30
40
50
60
70
2003 2004 2005 2006 2007 2008 2009
Rata de colectare/reciclare a maculaturii in general
Rata de reciclare a maculaturii din ambalaje
Celuloză şi Hârtie 2010, vol.59, nr.3
21
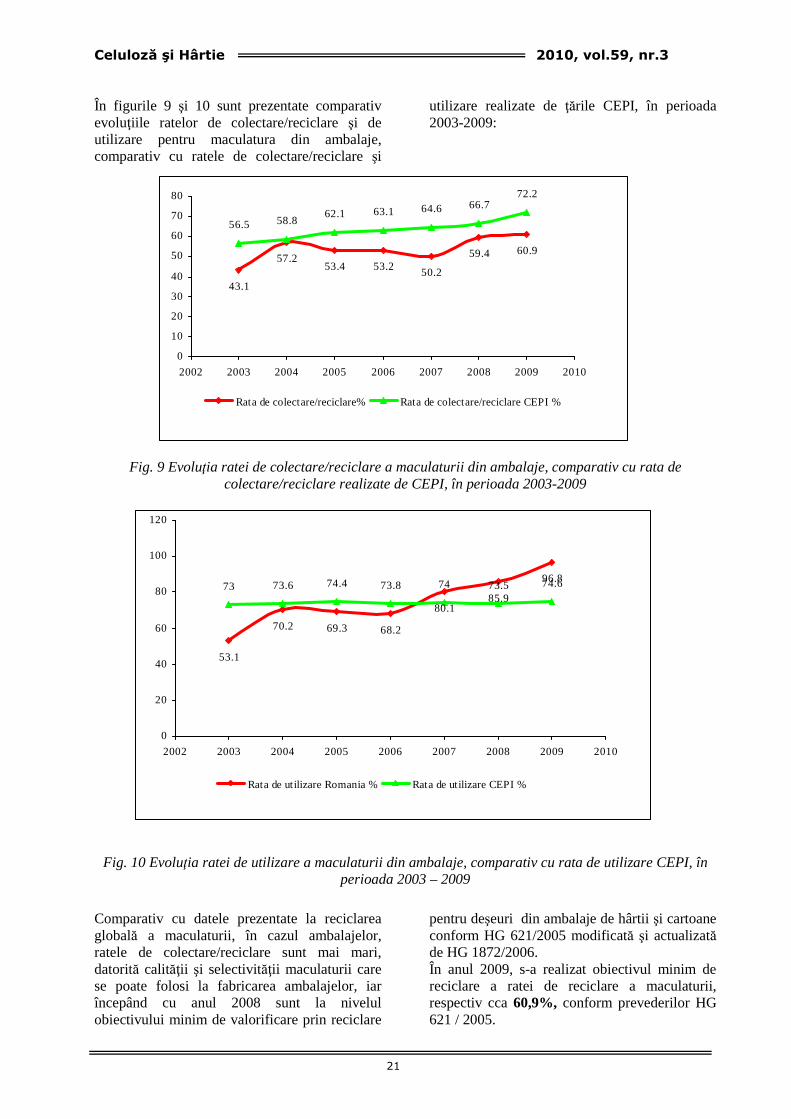
În figurile 9 şi 10 sunt prezentate comparativ evoluţiile ratelor de colectare/reciclare şi de utilizare pentru maculatura din ambalaje, comparativ cu ratele de colectare/reciclare şi
utilizare realizate de ţările CEPI, în perioada 2003-2009:
Fig. 9 Evoluţia ratei de colectare/reciclare a maculaturii din ambalaje, comparativ cu rata de
colectare/reciclare realizate de CEPI, în perioada 2003-2009
Fig. 10 Evoluţia ratei de utilizare a maculaturii din ambalaje, comparativ cu rata de utilizare CEPI, în
perioada 2003 – 2009
Comparativ cu datele prezentate la reciclarea globală a maculaturii, în cazul ambalajelor, ratele de colectare/reciclare sunt mai mari, datorită calităţii şi selectivităţii maculaturii care se poate folosi la fabricarea ambalajelor, iar începând cu anul 2008 sunt la nivelul obiectivului minim de valorificare prin reciclare
pentru deşeuri din ambalaje de hârtii şi cartoane conform HG 621/2005 modificată şi actualizată de HG 1872/2006. În anul 2009, s-a realizat obiectivul minim de reciclare a ratei de reciclare a maculaturii, respectiv cca 60,9%, conform prevederilor HG 621 / 2005.
43.1
57.253.4 53.2 50.2
59.4 60.9
56.5 58.862.1 63.1 64.6 66.7
72.2
0
10
20
30
40
50
60
70
80
2002 2003 2004 2005 2006 2007 2008 2009 2010
Rata de colectare/reciclare% Rata de colectare/reciclare CEPI %
53.1
70.2 69.3 68.2
80.185.9
96.873 73.6 74.4 73.8 74 73.5 74.6
0
20
40
60
80
100
120
2002 2003 2004 2005 2006 2007 2008 2009 2010
Rata de utilizare Romania % Rata de utilizare CEPI %
Celuloză şi Hârtie 2010, vol.59, nr.3
22
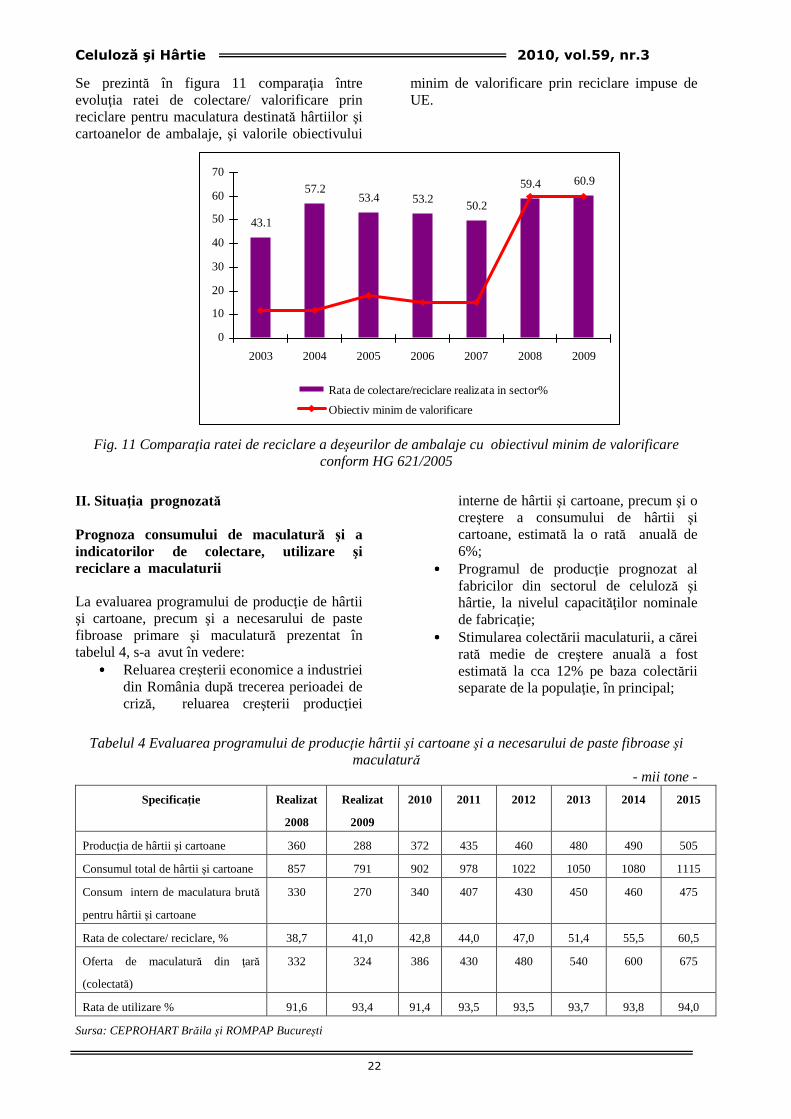
Se prezintă în figura 11 comparaţia între evoluţia ratei de colectare/ valorificare prin reciclare pentru maculatura destinată hârtiilor şi cartoanelor de ambalaje, şi valorile obiectivului
minim de valorificare prin reciclare impuse de UE.
Fig. 11 Comparaţia ratei de reciclare a deşeurilor de ambalaje cu obiectivul minim de valorificare
conform HG 621/2005
II. Situa ţia prognozată Prognoza consumului de maculatură şi a indicatorilor de colectare, utilizare şi reciclare a maculaturii La evaluarea programului de producţie de hârtii şi cartoane, precum şi a necesarului de paste fibroase primare şi maculatură prezentat în tabelul 4, s-a avut în vedere:
•••• Reluarea creşterii economice a industriei din România după trecerea perioadei de criză, reluarea creşterii producţiei
interne de hârtii şi cartoane, precum şi o creştere a consumului de hârtii şi cartoane, estimată la o rată anuală de 6%;
•••• Programul de producţie prognozat al fabricilor din sectorul de celuloză şi hârtie, la nivelul capacităţilor nominale de fabricaţie;
•••• Stimularea colectării maculaturii, a cărei rată medie de creştere anuală a fost estimată la cca 12% pe baza colectării separate de la populaţie, în principal;
Tabelul 4 Evaluarea programului de producţie hârtii şi cartoane şi a necesarului de paste fibroase şi
maculatură - mii tone -
Specificaţie Realizat
2008
Realizat
2009
2010 2011 2012 2013 2014 2015
Producţia de hârtii şi cartoane 360 288 372 435 460 480 490 505
Consumul total de hârtii şi cartoane 857 791 902 978 1022 1050 1080 1115
Consum intern de maculatura brută
pentru hârtii şi cartoane
330
270 340
407 430 450 460 475
Rata de colectare/ reciclare, % 38,7 41,0 42,8 44,0 47,0 51,4 55,5 60,5
Oferta de maculatură din ţară
(colectată)
332 324 386 430 480 540 600 675
Rata de utilizare % 91,6 93,4 91,4 93,5 93,5 93,7 93,8 94,0
Sursa: CEPROHART Brăila şi ROMPAP Bucureşti
43.1
57.253.4 53.2
50.2
59.4 60.9
0
10
20
30
40
50
60
70
2003 2004 2005 2006 2007 2008 2009
Rata de colectare/reciclare realizata in sector%
Obiectiv minim de valorificare
Celuloză şi Hârtie 2010, vol.59, nr.3
23
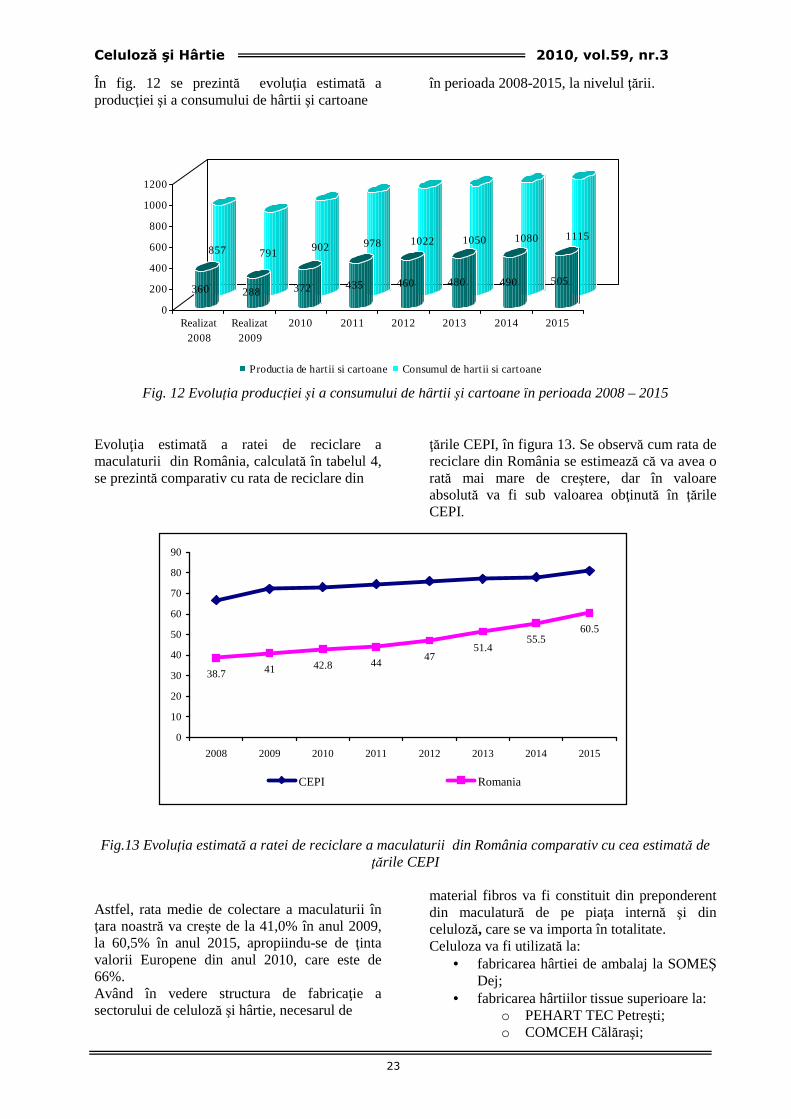
În fig. 12 se prezintă evoluţia estimată a producţiei şi a consumului de hârtii şi cartoane
în perioada 2008-2015, la nivelul ţării.
Fig. 12 Evoluţia producţiei şi a consumului de hârtii şi cartoane în perioada 2008 – 2015 Evoluţia estimată a ratei de reciclare a maculaturii din România, calculată în tabelul 4, se prezintă comparativ cu rata de reciclare din
ţările CEPI, în figura 13. Se observă cum rata de reciclare din România se estimează că va avea o rată mai mare de creştere, dar în valoare absolută va fi sub valoarea obţinută în ţările CEPI.
Fig.13 Evoluţia estimată a ratei de reciclare a maculaturii din România comparativ cu cea estimată de
ţările CEPI Astfel, rata medie de colectare a maculaturii în ţara noastră va creşte de la 41,0% în anul 2009, la 60,5% în anul 2015, apropiindu-se de ţinta valorii Europene din anul 2010, care este de 66%. Având în vedere structura de fabricaţie a sectorului de celuloză şi hârtie, necesarul de
material fibros va fi constituit din preponderent din maculatură de pe piaţa internă şi din celuloză, care se va importa în totalitate. Celuloza va fi utilizată la:
• fabricarea hârtiei de ambalaj la SOMEŞ Dej;
• fabricarea hârtiilor tissue superioare la: o PEHART TEC Petreşti; o COMCEH Călăraşi;
857 791 902 978 1022 1050 1080 1115
360 288 372 435 460 480 490 505
0
200
400
600
800
1000
1200
Realizat2008
Realizat2009
2010 2011 2012 2013 2014 2015
Productia de hartii si cartoaneConsumul de hartii si cartoane
38.7 41 42.8 4447
51.455.5
60.5
0
10
20
30
40
50
60
70
80
90
2008 2009 2010 2011 2012 2013 2014 2015
CEPI Romania
Celuloză şi Hârtie 2010, vol.59, nr.3
24
o MONTE BIANCO Târgovişte; o VRANCART Adjud;
• fabricarea cartonului de transformatoare la PETROCART P. Neamţ.
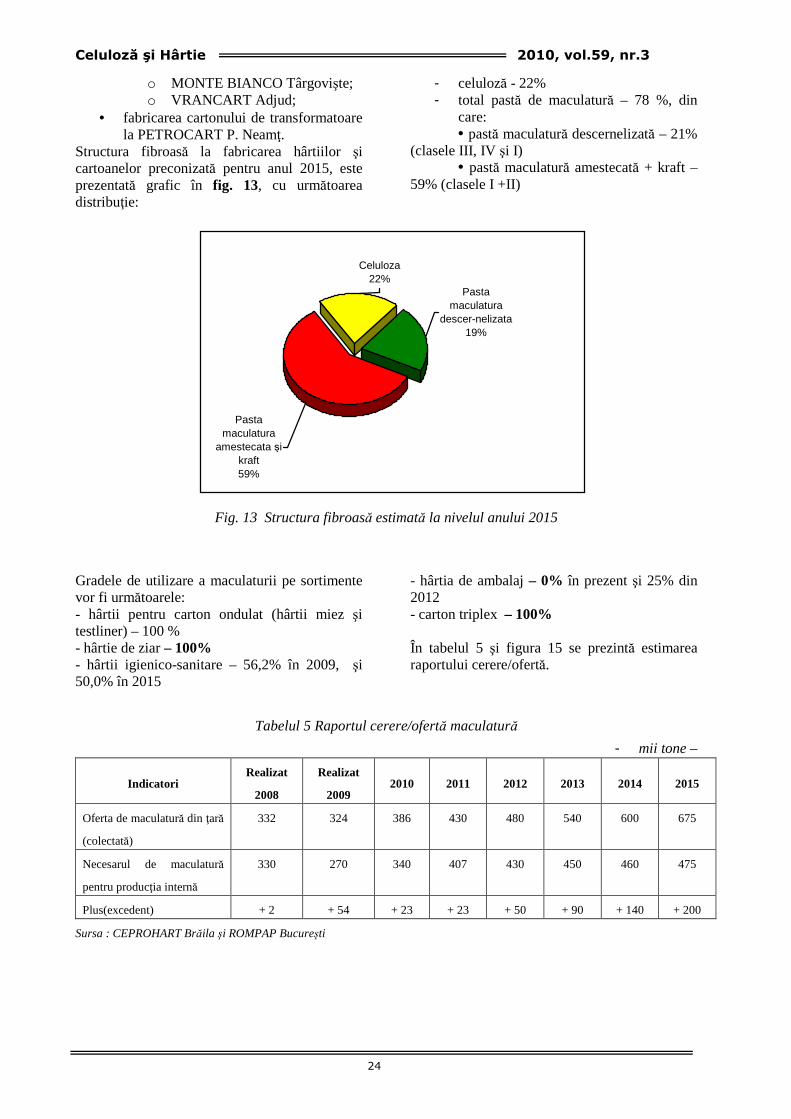
Structura fibroasă la fabricarea hârtiilor şi cartoanelor preconizată pentru anul 2015, este prezentată grafic în fig. 13, cu următoarea distribuţie:
- celuloză - 22% - total pastă de maculatură – 78 %, din
care: � pastă maculatură descernelizată – 21% (clasele III, IV şi I) � pastă maculatură amestecată + kraft – 59% (clasele I +II)
Fig. 13 Structura fibroasă estimată la nivelul anului 2015
Gradele de utilizare a maculaturii pe sortimente vor fi următoarele: - hârtii pentru carton ondulat (hârtii miez şi testliner) – 100 % - hârtie de ziar – 100% - hârtii igienico-sanitare – 56,2% în 2009, şi 50,0% în 2015
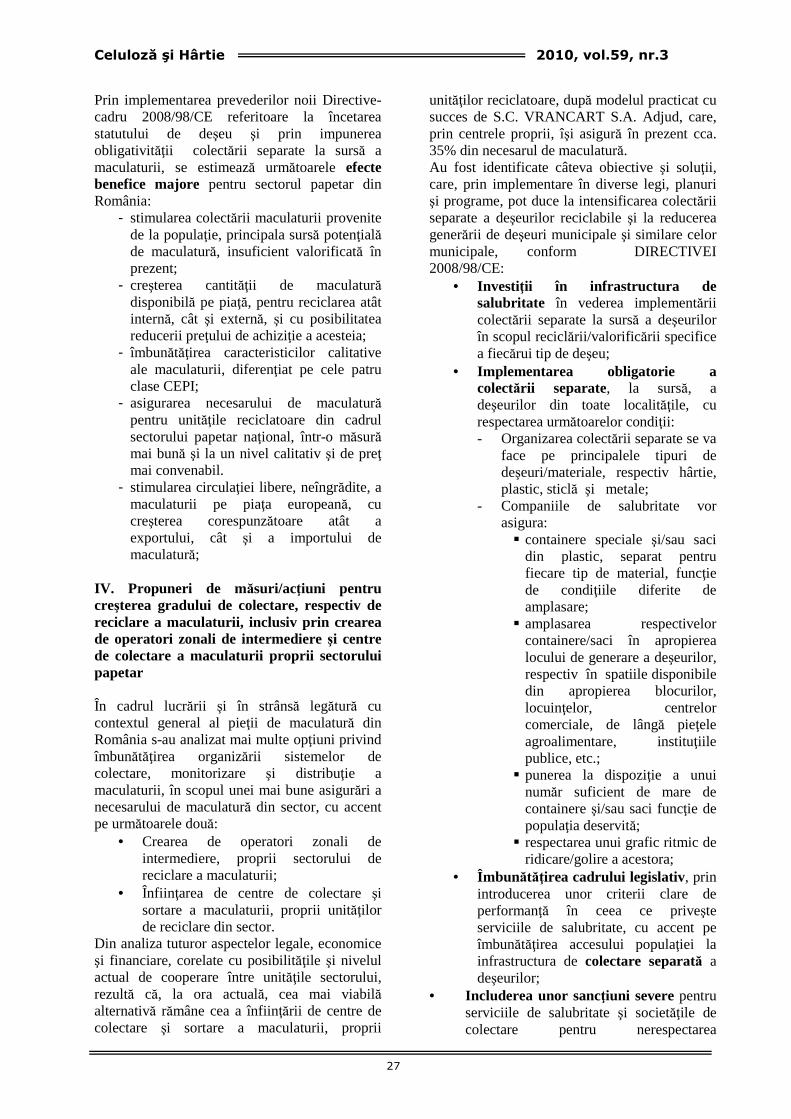
- hârtia de ambalaj – 0% în prezent şi 25% din 2012 - carton triplex – 100% În tabelul 5 şi figura 15 se prezintă estimarea raportului cerere/ofertă.
Tabelul 5 Raportul cerere/ofertă maculatură
- mii tone –
Indicatori Realizat
2008
Realizat
2009 2010 2011 2012 2013 2014 2015
Oferta de maculatură din ţară
(colectată)
332 324 386 430 480 540 600 675
Necesarul de maculatură
pentru producţia internă
330 270 340 407 430 450 460 475
Plus(excedent) + 2 + 54 + 23 + 23 + 50 + 90 + 140 + 200
Sursa : CEPROHART Brăila şi ROMPAP Bucureşti
Celuloza22%
Pasta maculatura
descer-nelizata19%
Pasta maculatura
amestecata şi kraft59%

Celuloză şi Hârtie 2010, vol.59, nr.3
25
Fig. 15 Estimarea raportului cerere/ofertă Concluzia optimistă este că: Oferta internă de maculatură va putea acoperi atât necesarul crescând de maculatură al sectorului papetar, cât şi cererea crescândă la export. III. Implica ţiile transpunerii noii Directive cadru privind deşeurile asupra reciclării interne a maculaturii Directiva cadru veche privind deseurile 2006/12/CE a fost înlocuită cu o directivă nouă Directiva 2008/98/CE, pentru care termenul limită de transpunere în legislaţia naţională este 30.12.2010. Una dintre cele mai importante reglementări aduse de noua Directivă 2008/98/CE este prezentată în Articolul 6, care defineşte încetarea statutului de deşeu: Anumite categorii de deșeuri încetează să mai fie considerate deșeuri, în sensul articolului 3 punctul 1 în momentul în care au trecut printr-o operațiune de valorificare, inclusiv reciclarea și îndeplinesc o serie de criterii specifice, care urmează să fie definite conform următoarelor condiții: (a) substanța sau obiectul sunt utilizate în mod curent pentru îndeplinirea unor scopuri specifice; (b) există o piață sau cerere pentru substanța sau obiectul în cauză;
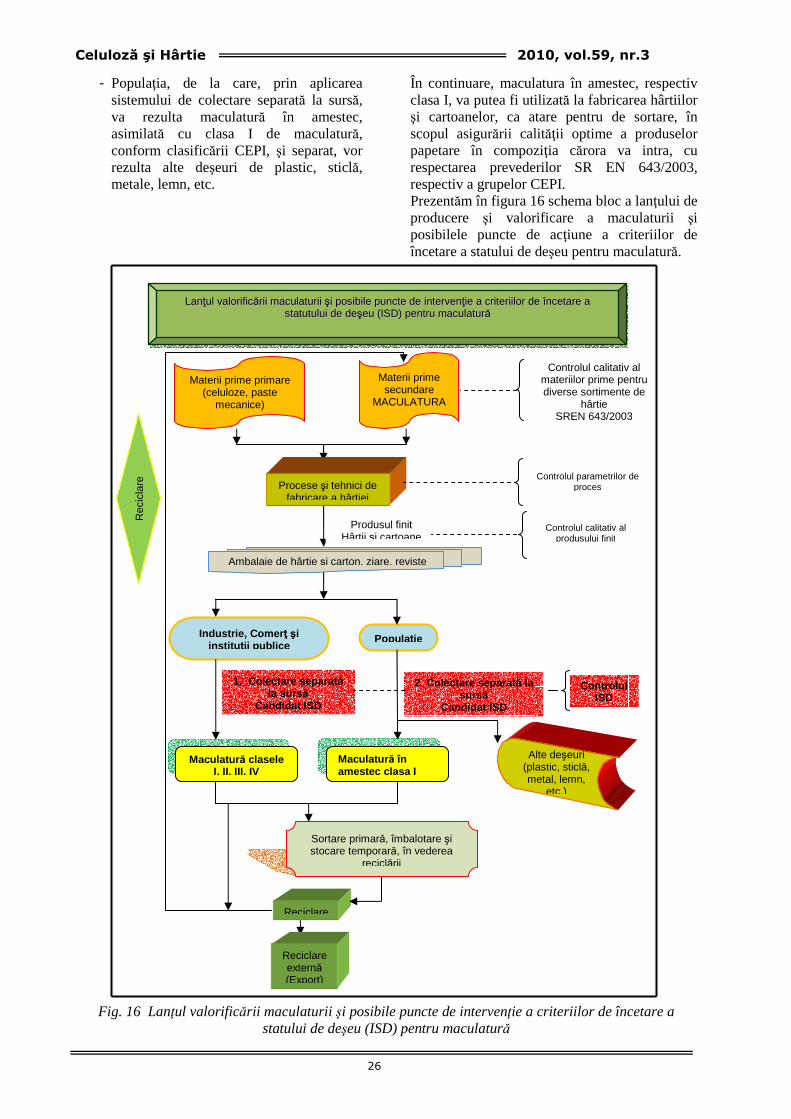
(c) substanța sau obiectul îndeplinește cerințele tehnice pentru îndeplinirea scopurilor specifice și respectă legislația și normele aplicabile produselor; și (d) utilizarea substanței sau a obiectului nu va produce efecte nocive asupra mediului sau a sănătății populației. Încetarea statutului de deşeu pentru maculatură Maculatura îndeplineşte toate cele patru condiţii pentru încetarea statutului de deşeu şi se poate considera că îşi pierde statutul de deşeu din momentul în care se separă de alte tipuri de deşeuri (plastic, sticlă, metale, lemn). Din acest moment devine obligatoriu ca toţi ceilalţi actori implicaţi în lanţul de valorificare (colectori, valorificatori, transportatori) să respecte principiul colectării separate, în vederea asigurării calit ăţii cerute de sortimentele papetare în compoziţia cărora va intra maculatura. Aşa cum se prezintă în figura 16, utilizatorii de hârtii şi cartoane se pot grupa astfel:
- Industria, comerţul şi instituţiile publice, care pot asigura o colectare separată, la sursă, efectivă şi eficientă a diferitelor clase de maculatură;
332
324
386
430
480
540
600
675
330
270
340
407
430
450
460
475
2
54
23
23
50
90
140
200
0 200 400 600 800 1000 1200 1400 1600
Realizat 2008
Realizat 2009
2010
2011
2012
2013
2014
2015
Oferta de maculatura din tara
Necesarul de maculatura pentru productia interna
Plus(Excedent)
Celuloză şi Hârtie 2010, vol.59, nr.3
26
- Populaţia, de la care, prin aplicarea sistemului de colectare separată la sursă, va rezulta maculatură în amestec, asimilată cu clasa I de maculatură, conform clasificării CEPI, şi separat, vor rezulta alte deşeuri de plastic, sticlă, metale, lemn, etc.
În continuare, maculatura în amestec, respectiv clasa I, va putea fi utilizată la fabricarea hârtiilor şi cartoanelor, ca atare pentru de sortare, în scopul asigurării calităţii optime a produselor papetare în compoziţia cărora va intra, cu respectarea prevederilor SR EN 643/2003, respectiv a grupelor CEPI. Prezentăm în figura 16 schema bloc a lanţului de producere şi valorificare a maculaturii şi posibilele puncte de acţiune a criteriilor de încetare a statului de deşeu pentru maculatură.
Fig. 16 Lanţul valorificării maculaturii şi posibile puncte de intervenţie a criteriilor de încetare a statului de deşeu (ISD) pentru maculatură
Controlul calitativ al materiilor prime pentru diverse sortimente de
hârtie SREN 643/2003
Materii prime secundare
MACULATURA
Materii prime primare (celuloze, paste
mecanice)
Procese şi tehnici de fabricare a hârtiei
Controlul parametrilor de proces
Produsul finit Hârtii şi cartoane
Controlul calitativ al produsului finit
Ambalaje de hârtie şi carton, ziare, reviste
Rec
icla
re
LLaannţţuull vvaalloorriiffiiccăărriiii mmaaccuullaattuurriiii şşii ppoossiibbiillee ppuunnccttee ddee iinntteerrvveennţţiiee aa ccrriitteerriiiilloorr ddee îînncceettaarree aa ssttaattuuttuulluuii ddee ddeeşşeeuu ((IISSDD)) ppeennttrruu mmaaccuullaattuurrăă
Popula ţie Industrie, Comer ţ şi institu ţii publice
Reciclare externă (Export)
Reciclare
1. Colectare separat ă la surs ă
Candidat ISD
2. Colectare separat ă la surs ă
Candidat ISD
Controlul ISD
Maculatur ă clasele I, II, III, IV
Maculatur ă în amestec cla sa I
Sortare primară, îmbalotare şi stocare temporară, în vederea
reciclării
Alte deşeuri (plastic, sticlă, metal, lemn,
etc.)
Celuloză şi Hârtie 2010, vol.59, nr.3
27
Prin implementarea prevederilor noii Directive-cadru 2008/98/CE referitoare la încetarea statutului de deşeu şi prin impunerea obligativităţii colectării separate la sursă a maculaturii, se estimează următoarele efecte benefice majore pentru sectorul papetar din România:
- stimularea colectării maculaturii provenite de la populaţie, principala sursă potenţială de maculatură, insuficient valorificată în prezent;
- creşterea cantităţii de maculatură disponibilă pe piaţă, pentru reciclarea atât internă, cât şi externă, şi cu posibilitatea reducerii preţului de achiziţie a acesteia;
- îmbunătăţirea caracteristicilor calitative ale maculaturii, diferenţiat pe cele patru clase CEPI;
- asigurarea necesarului de maculatură pentru unităţile reciclatoare din cadrul sectorului papetar naţional, într-o măsură mai bună şi la un nivel calitativ şi de preţ mai convenabil.
- stimularea circulaţiei libere, neîngrădite, a maculaturii pe piaţa europeană, cu creşterea corespunzătoare atât a exportului, cât şi a importului de maculatură;
IV. Propuneri de măsuri/acţiuni pentru creşterea gradului de colectare, respectiv de reciclare a maculaturii, inclusiv prin crearea de operatori zonali de intermediere şi centre de colectare a maculaturii proprii sectorului papetar În cadrul lucrării şi în strânsă legătură cu contextul general al pieţii de maculatură din România s-au analizat mai multe opţiuni privind îmbunătăţirea organizării sistemelor de colectare, monitorizare şi distribuţie a maculaturii, în scopul unei mai bune asigurări a necesarului de maculatură din sector, cu accent pe următoarele două:
• Crearea de operatori zonali de intermediere, proprii sectorului de reciclare a maculaturii;
• Înfiin ţarea de centre de colectare şi sortare a maculaturii, proprii unităţilor de reciclare din sector.
Din analiza tuturor aspectelor legale, economice şi financiare, corelate cu posibilităţile şi nivelul actual de cooperare între unităţile sectorului, rezultă că, la ora actuală, cea mai viabilă alternativă rămâne cea a înfiinţării de centre de colectare şi sortare a maculaturii, proprii
unităţilor reciclatoare, după modelul practicat cu succes de S.C. VRANCART S.A. Adjud, care, prin centrele proprii, îşi asigură în prezent cca. 35% din necesarul de maculatură. Au fost identificate câteva obiective şi soluţii, care, prin implementare în diverse legi, planuri şi programe, pot duce la intensificarea colectării separate a deşeurilor reciclabile şi la reducerea generării de deşeuri municipale şi similare celor municipale, conform DIRECTIVEI 2008/98/CE:
• Investiţii în infrastructura de salubritate în vederea implementării colectării separate la sursă a deşeurilor în scopul reciclării/valorificării specifice a fiecărui tip de deşeu;
• Implementarea obligatorie a colectării separate, la sursă, a deşeurilor din toate localităţile, cu respectarea următoarelor condiţii: - Organizarea colectării separate se va
face pe principalele tipuri de deşeuri/materiale, respectiv hârtie, plastic, sticlă şi metale;
- Companiile de salubritate vor asigura: � containere speciale şi/sau saci
din plastic, separat pentru fiecare tip de material, funcţie de condiţiile diferite de amplasare;
� amplasarea respectivelor containere/saci în apropierea locului de generare a deşeurilor, respectiv în spatiile disponibile din apropierea blocurilor, locuinţelor, centrelor comerciale, de lângă pieţele agroalimentare, instituţiile publice, etc.;
� punerea la dispoziţie a unui număr suficient de mare de containere şi/sau saci funcţie de populaţia deservită;
� respectarea unui grafic ritmic de ridicare/golire a acestora;
• Îmbunătăţirea cadrului legislativ, prin introducerea unor criterii clare de performanţă în ceea ce priveşte serviciile de salubritate, cu accent pe îmbunătăţirea accesului populaţiei la infrastructura de colectare separată a deşeurilor;
• Includerea unor sancţiuni severe pentru serviciile de salubritate şi societăţile de colectare pentru nerespectarea
Celuloză şi Hârtie 2010, vol.59, nr.3
28
obligativităţii de colectare separată la sursă a deşeurilor, pe tot lanţul de colectare şi reciclare, putându-se merge până la ridicarea autorizaţiei de funcţionare pentru aceste nereguli;
• Creşterea nivelului de conştientizare şi sensibilizare a populaţiei pentru punerea în aplicare a sistemului de colectare separată.
Au fost identificate de asemenea şi diverse măsuri ce pot fi luate la nivel legislativ, de administraţia centrală, locală, sau de către instituţiile publice, pentru prevenirea/ minimizarea impactului generării deşeurilor de hârtii şi cartoane:
• Promovarea principiilor de eco-design, respectiv de integrare sistematică a aspectelor de mediu în proiectarea ambalajelor din hârtii şi cartoane, cu scopul de a îmbunătăţi performanţa de mediu a acestora pe toată durata ciclului de viaţă;
• Proiectarea ambalajelor astfel încât să răspundă cerinţelor consumatorului, dar să fie cât mai puţin voluminoase, rezultând astfel un consum minim de resurse şi implicit un volum minim de deşeuri;
• Promovarea cercetării şi a dezvoltării în vederea realizării de produse papetare noi, prin aplicarea de tehnologii cât mai curate şi mai economice, cu accent pe distribuirea şi utilizarea acestor rezultate;
• Realizarea unor baze de date privind tehnicile de prevenire a generării deşeurilor de hârtii şi cartoane, în vederea implementării celor mai bune tehnici disponibile specifice sectorului papetar;
• Stimularea producţiei de ambalaje din hârtii şi cartoane, care sunt deşeuri uşor biodegradabile, în detrimentul ambalajelor din materiale plastice, sau alte materiale nebiodegradabile.
CONCLUZIE FINAL Ă
Oferta internă de maculatură va putea acoperi atât necesarul crescând de maculatură al sectorului papetar, cât şi cererea crescândă la export, cu condiţia creşterii gradului de colectare a maculaturii de la populaţie, ca urmare a aplicării prevederilor noii Directive – cadru a deşeurilor şi prin eforturile unite ale reciclatorilor de maculatură.
Celuloză şi Hârtie 2010, vol.59, nr.3
29
PHOSPHONATES – ADITIVES FOR SOFTWOOD DELIGNIFICATION
Gheorghe Duţuc*), Dan Gavrilescu**) , Alexandru Botar***) , Grigore Crăciun*)
*)SC SOMES SA Dej Romania, **) Gheorghe Asachi Technical University of Iasi, ***) SC JIALEX SRL Cluj Napoca,
Author correspondence: Somes Dej Paper Mill, Bistritei street, No.63, Dej, Romania,
E-mail: [email protected], phone: 004 0744 646 838
Abstract
Taking in consideration that the penetration speed of the chemicals within the core of the wood chips are the determined stages of the impregnation and consequently to the increasing of the cooking yield and uniformity, the phosphonates influence regarding the reducing of the superficial tension of the cooking liquor within the wood chips capillaries become an research subject more and more actual. The great stability of the phosphonate in the sulphate cooking process, together with the great tensile surface reducing led to its choose for laboratory testing phase. The increase of the cooking uniformity by reducing the screening rejects to the half, and increasing cooking yield values with more than 4 units demonstrate the potential of this type of additives on pulping process. Key words : Phosphonates, Cooking, Chemical Pulp, Yield
Rezumat
Viteza de penetrare a chimicalelor în tocătura din lemn este determinată de fazele de impregnare şi are ca rezultat creşterea randamentului şi uniformităţii procesului de fierbere. La ora actuală, utilizarea fosfonaţilor cu efect asupra reducerii tensiunii superficiale a leşiei de fierbere în interiorul capilarelor tocăturii din lemn, a devenit un subiect de cercetare tot mai mult luat în discuţie. Stabilitatea ridicată a acestor compuşi în procesul de fierbere sulfat, alături de reducerea accentuată a tensiunii superficiale, au constituit argumente pentru testarea lor în fază de laborator. Creşterea uniformităţii procesului de fierbere prin reducerea refuzului la sortare, pe de o parte, şi creşterea randamentului de fierbere cu peste 4 unităţi, demonstrează potenţialul de utilizare a acestor aditivi în procesul de fierbere a tocăturii din lemn. Cuvinte cheie : Fosfonaţi, Fierbere, Celuloză, Randament
INTRODUCTION
1.1 Overview of Reactions during Kraft Pulping The course of dissolution of lignin and carbohydrates reveals three distinct phases of a Kraft cook: initial , bulk, and residual delignification which affects the single wood components as summarized in figure 1 [1].
- Initial phase: the initial stage is characterized by losses in the carbohydrate fraction, which is more pronounced for hardwoods as compared to softwoods [2].
The hemicelluloses undergo deacetylation and physical dissolution, and peeling reactions also start. Cellulose degradation by peeling is negligible in terms of yield loss. Reactive phenol lignin units, such as a-O-4-ethers, are cleaved as early as the initial phase.
- Bulk phase: The core delignification occurs in the bulk phase and, importantly, both phenol and no phenol b-O–4-ether bonds are cleaved. About 70% of the lignin is removed. The reactions of the carbohydrates are characterized by secondary peeling (i.e., alkaline cleavage

Celuloză şi Hârtie 2010, vol.59, nr.3
30
- of the glycoside bonds), but also by stopping reactions, which are favored at elevated temperature. Methanol is liberated from 4-O-methylglucuronic acid side chains, and hexenuronics units are formed.
- Residual phase: the residual phase begins at a delignification rate of about 90%.
- Delignification has slowed down considerably due to depletion of reactive lignin units. It is believed that the chemical nature of the residual lignin hampers further degradation reactions. A slow delignification is accompanied by rapid carbohydrate degradation, causing disproportionate.
- carbohydrate losses.
Fig.1 Phases of delignification and respective reactions of wood components
The initial stage is characterized by a substantial loss of carbohydrates, small but rapid delignification and high alkali consumption. In the second stage – generally referred to as the bulk delignification – the main dissolution of lignin takes place and the amount of carbohydrates and the alkali concentration in the cooking liquor decrease only slightly. Reaching a certain degree of delignification, the continuation of the cook results in the residual delignification phase
where the degradation of carbohydrates, mainly cellulose, predominates. The low selectivity in the final phase of a conventional Kraft cook is a limiting factor, as both the yield loss and the molecular weight degradation of cellulose are unacceptable. Consequently, the cook should be interrupted before the residual phase is attained. Figure 2 shows the course of delignification and carbohydrate degradation during alkaline pulping of beech (Fagus sylvatica) and spruce (Picea abies).
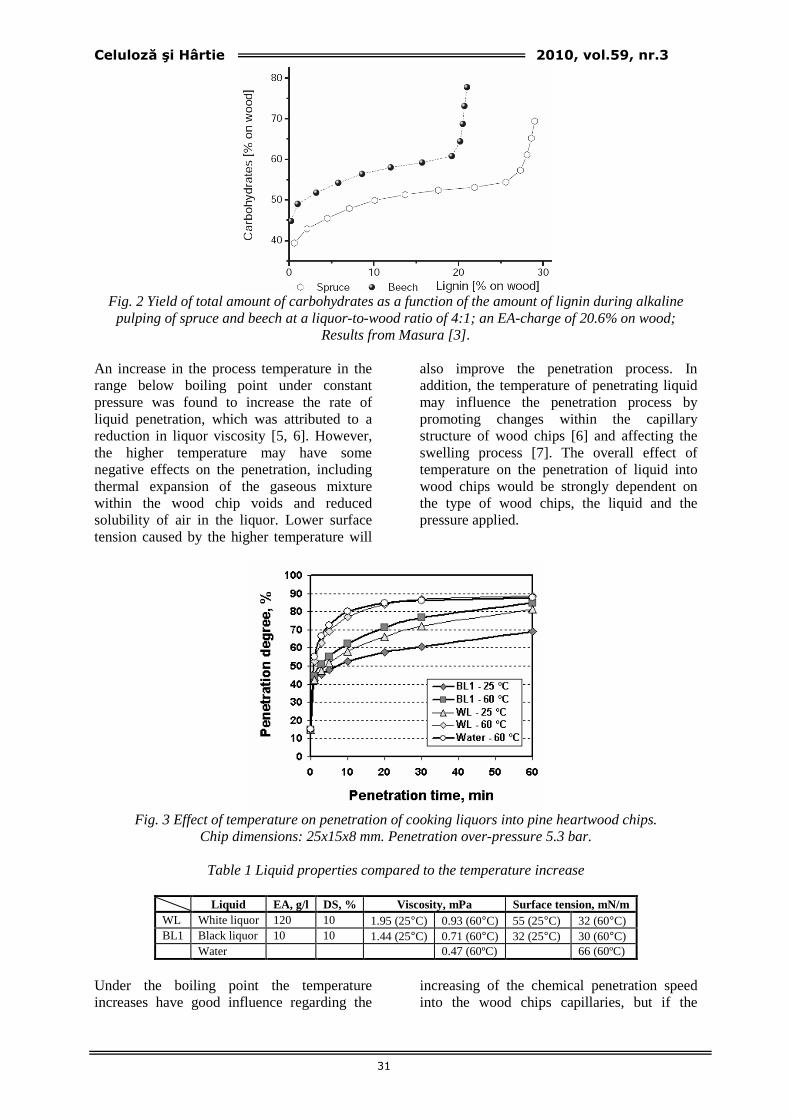
Celuloză şi Hârtie 2010, vol.59, nr.3
31
Fig. 2 Yield of total amount of carbohydrates as a function of the amount of lignin during alkaline pulping of spruce and beech at a liquor-to-wood ratio of 4:1; an EA-charge of 20.6% on wood;
Results from Masura [3]. An increase in the process temperature in the range below boiling point under constant pressure was found to increase the rate of liquid penetration, which was attributed to a reduction in liquor viscosity [5, 6]. However, the higher temperature may have some negative effects on the penetration, including thermal expansion of the gaseous mixture within the wood chip voids and reduced solubility of air in the liquor. Lower surface tension caused by the higher temperature will
also improve the penetration process. In addition, the temperature of penetrating liquid may influence the penetration process by promoting changes within the capillary structure of wood chips [6] and affecting the swelling process [7]. The overall effect of temperature on the penetration of liquid into wood chips would be strongly dependent on the type of wood chips, the liquid and the pressure applied.
Fig. 3 Effect of temperature on penetration of cooking liquors into pine heartwood chips.
Chip dimensions: 25x15x8 mm. Penetration over-pressure 5.3 bar.
Table 1 Liquid properties compared to the temperature increase
Liquid EA, g/l DS, % Viscosity, mPa Surface tension, mN/m WL White liquor 120 10 1.95 (25°C) 0.93 (60°C) 55 (25°C) 32 (60°C) BL1 Black liquor 10 10 1.44 (25°C) 0.71 (60°C) 32 (25°C) 30 (60°C) Water 0.47 (60ºC) 66 (60ºC)
Under the boiling point the temperature increases have good influence regarding the
increasing of the chemical penetration speed into the wood chips capillaries, but if the

Celuloză şi Hârtie 2010, vol.59, nr.3
32
temperature increase the cooking selectivity decreases as it is shown in the table 2. Table 2 Pulping selectivity denoted as the ratio of kL to kc. Kraft cooking of black spruce wood [OH]= 1.1 mol L–1, liquor-to-wood ratio = 24:1; sulfidity = 30% according to [4] Li et al. (2002).
a) Apparent second-order reaction kinetics
Consequently, cooking at low temperatures makes it possible to extend Kraft cooking to lower kappa numbers without impairing pulp quality. Therefore, reducing the surface tension create the conditions to manage the cooking process to the lower temperature, with effects on growth of yield and uniformity.
Phosphonates
Phosphonates as additives in alkaline cooking promise substantial energy savings, increased
efficiency of delignification and bleaching cost reductions. The chosen surfactant is DTPMP-Na7 => C9H21O15N3P5Na7 - the seventh sodium salt of the acid two-ethylene two-amino fifth-phosphorus. It is presented in aqueous solution C = 25%, the molecular weight is 727 and the density of 1,38 g/cm3. The molecular structure it is presented in the figure 4.
NaO
ONa
O
P CH2
N-(CH2)2N-(CH2)2NONa
NaO P CH2
O
ONa
HO
P CH2
O
ONa
ONa
O
PH2C
ONa
ONaPCH2
O
Fig. 4 Molecular structure of DTPMP-Na7 Applications:
- Phosphonates can be added into the cooking liquor in the beginning of the Kraft cooking process to enhance lignin removal; the use of 0.1 - 0.3% phosphonate in the Kraft cooking process makes the degree of
delignification sulfate more advanced by reducing the Kappa number
- Phosphonates may be used in all factories using alkaline cooking processes, because of it’s stability to high temperatures and alkaline pH values
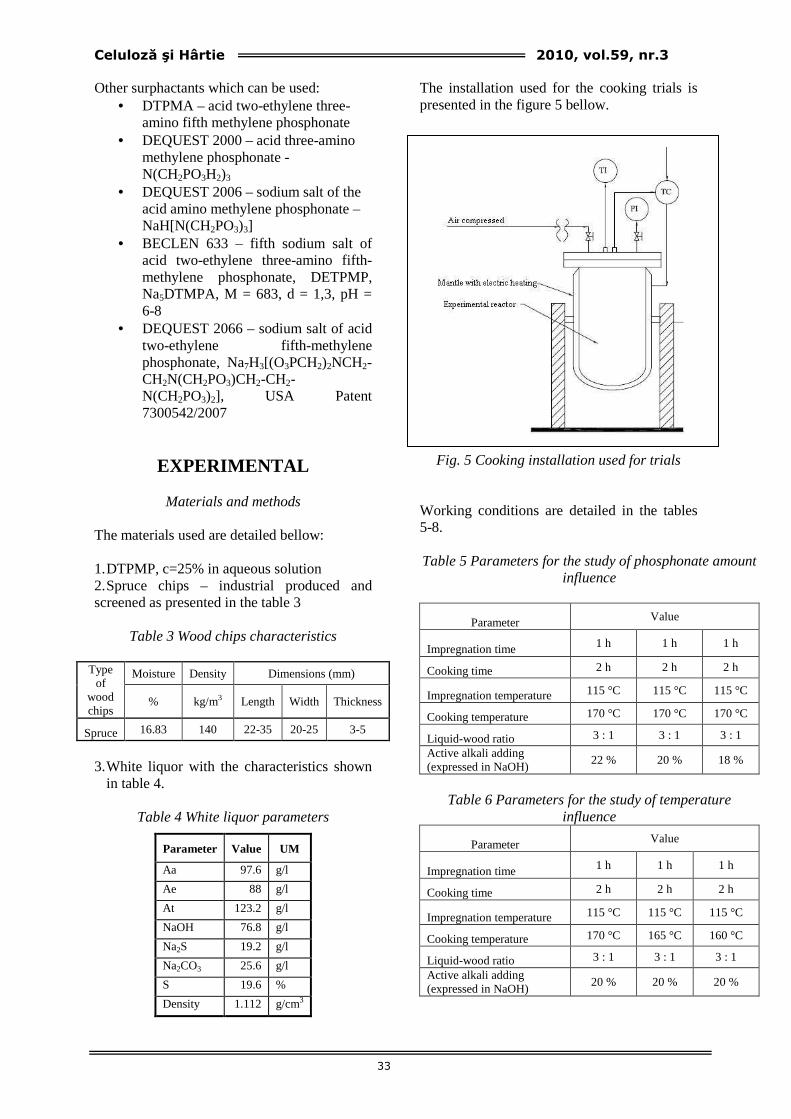
Celuloză şi Hârtie 2010, vol.59, nr.3
33
Other surphactants which can be used:
• DTPMA – acid two-ethylene three-amino fifth methylene phosphonate
• DEQUEST 2000 – acid three-amino methylene phosphonate - N(CH2PO3H2)3
• DEQUEST 2006 – sodium salt of the acid amino methylene phosphonate – NaH[N(CH2PO3)3]
• BECLEN 633 – fifth sodium salt of acid two-ethylene three-amino fifth-methylene phosphonate, DETPMP, Na5DTMPA, M = 683, d = 1,3, pH = 6-8
• DEQUEST 2066 – sodium salt of acid two-ethylene fifth-methylene phosphonate, Na7H3[(O3PCH2)2NCH2-CH2N(CH2PO3)CH2-CH2-N(CH2PO3)2], USA Patent 7300542/2007
EXPERIMENTAL
Materials and methods
The materials used are detailed bellow: 1. DTPMP, c=25% in aqueous solution 2. Spruce chips – industrial produced and screened as presented in the table 3
Table 3 Wood chips characteristics
Moisture Density Dimensions (mm) Type
of wood chips
% kg/m3 Length Width Thickness
Spruce 16.83 140 22-35 20-25 3-5
3. White liquor with the characteristics shown
in table 4.
Table 4 White liquor parameters
Parameter Value UM
Aa 97.6 g/l
Ae 88 g/l
At 123.2 g/l
NaOH 76.8 g/l
Na2S 19.2 g/l
Na2CO3 25.6 g/l
S 19.6 %
Density 1.112 g/cm3
The installation used for the cooking trials is presented in the figure 5 bellow.
Fig. 5 Cooking installation used for trials Working conditions are detailed in the tables 5-8. Table 5 Parameters for the study of phosphonate amount
influence
Parameter Value
Impregnation time 1 h 1 h 1 h
Cooking time 2 h 2 h 2 h
Impregnation temperature 115 °C 115 °C 115 °C
Cooking temperature 170 °C 170 °C 170 °C
Liquid-wood ratio 3 : 1 3 : 1 3 : 1
Active alkali adding (expressed in NaOH)
22 % 20 % 18 %
Table 6 Parameters for the study of temperature
influence
Parameter Value
Impregnation time 1 h 1 h 1 h
Cooking time 2 h 2 h 2 h
Impregnation temperature 115 °C 115 °C 115 °C
Cooking temperature 170 °C 165 °C 160 °C
Liquid-wood ratio 3 : 1 3 : 1 3 : 1
Active alkali adding (expressed in NaOH)
20 % 20 % 20 %
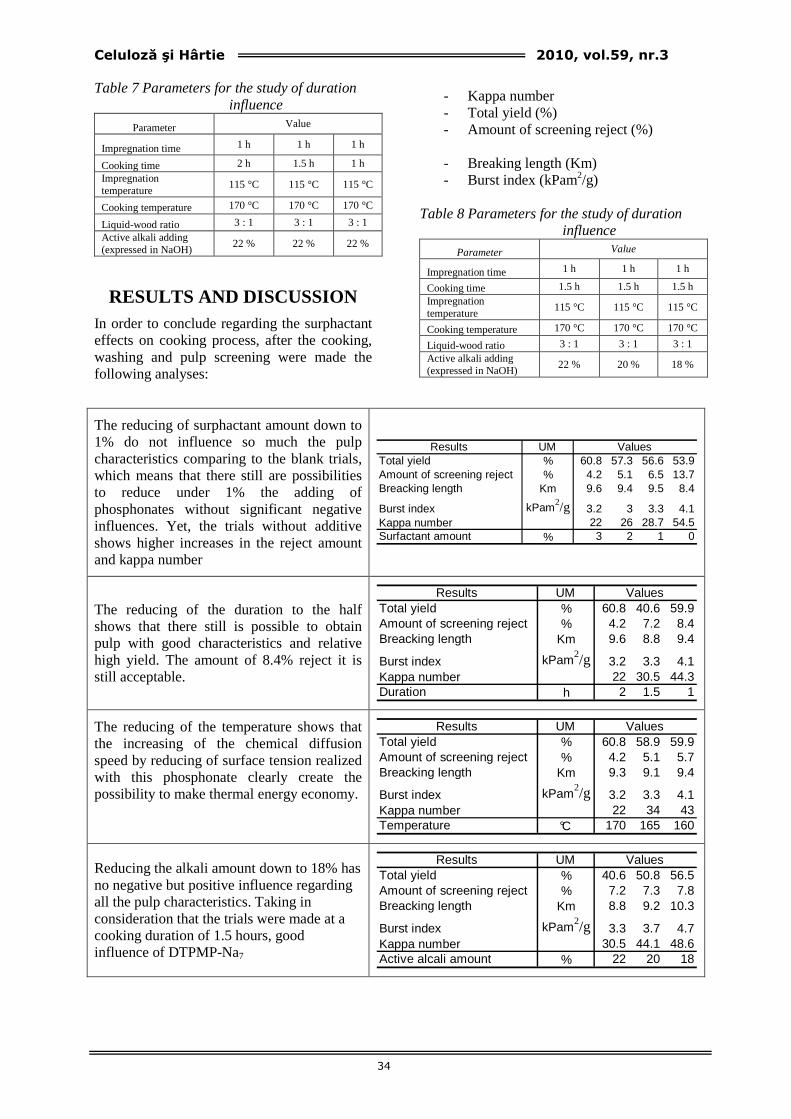
Celuloză şi Hârtie 2010, vol.59, nr.3
34
Table 7 Parameters for the study of duration
influence
Parameter Value
Impregnation time 1 h 1 h 1 h
Cooking time 2 h 1.5 h 1 h
Impregnation temperature
115 °C 115 °C 115 °C
Cooking temperature 170 °C 170 °C 170 °C
Liquid-wood ratio 3 : 1 3 : 1 3 : 1
Active alkali adding (expressed in NaOH)
22 % 22 % 22 %
RESULTS AND DISCUSSION In order to conclude regarding the surphactant effects on cooking process, after the cooking, washing and pulp screening were made the following analyses:
- Kappa number - Total yield (%) - Amount of screening reject (%) - Breaking length (Km) - Burst index (kPam2/g)
Table 8 Parameters for the study of duration
influence
Parameter Value
Impregnation time 1 h 1 h 1 h
Cooking time 1.5 h 1.5 h 1.5 h Impregnation temperature
115 °C 115 °C 115 °C
Cooking temperature 170 °C 170 °C 170 °C
Liquid-wood ratio 3 : 1 3 : 1 3 : 1 Active alkali adding (expressed in NaOH)
22 % 20 % 18 %
The reducing of surphactant amount down to 1% do not influence so much the pulp characteristics comparing to the blank trials, which means that there still are possibilities to reduce under 1% the adding of phosphonates without significant negative influences. Yet, the trials without additive shows higher increases in the reject amount and kappa number
Results UMTotal yield % 60.8 57.3 56.6 53.9Amount of screening reject % 4.2 5.1 6.5 13.7Breacking length Km 9.6 9.4 9.5 8.4
Burst index kPam2/g 3.2 3 3.3 4.1
Kappa number 22 26 28.7 54.5Surfactant amount % 3 2 1 0
Values
The reducing of the duration to the half shows that there still is possible to obtain pulp with good characteristics and relative high yield. The amount of 8.4% reject it is still acceptable.
Results UMTotal yield % 60.8 40.6 59.9Amount of screening reject % 4.2 7.2 8.4Breacking length Km 9.6 8.8 9.4
Burst index kPam2/g 3.2 3.3 4.1
Kappa number 22 30.5 44.3Duration h 2 1.5 1
Values
The reducing of the temperature shows that the increasing of the chemical diffusion speed by reducing of surface tension realized with this phosphonate clearly create the possibility to make thermal energy economy.
Results UMTotal yield % 60.8 58.9 59.9Amount of screening reject % 4.2 5.1 5.7Breacking length Km 9.3 9.1 9.4
Burst index kPam2/g 3.2 3.3 4.1
Kappa number 22 34 43Temperature °C 170 165 160
Values
Reducing the alkali amount down to 18% has no negative but positive influence regarding all the pulp characteristics. Taking in consideration that the trials were made at a cooking duration of 1.5 hours, good influence of DTPMP-Na7
Results UMTotal yield % 40.6 50.8 56.5Amount of screening reject % 7.2 7.3 7.8Breacking length Km 8.8 9.2 10.3
Burst index kPam2/g 3.3 3.7 4.7
Kappa number 30.5 44.1 48.6Active alcali amount % 22 20 18
Values

Celuloză şi Hârtie 2010, vol.59, nr.3
35
CONCLUSIONS
The benefits of phosphonate using as additives are:
- Increasing the cooking yield with 4-6% - Reduction of wood consumption with 8-
12% - Reduced consumption of cooking
chemicals - Reduces to the half the cooking duratio - Reduces cooking temperature, thus the
thermal energy needed - Improve the efficiency of liquor
penetration in wood chips Wood chips are much faster penetrated by the cooking liquor. These benefits are achieved by reducing the surface tension of chips pores, while reducing the links between lignin and cellulose fibers. Thus chemicals have easier access into the wood pores. All these, results in a more uniform cooking and a growing amount of pulp obtained.
REFERENCES
1. Handbook of Pulp. Edited by Herbert Sixta, Copyright © 2006 WILEY-VCH Verlag GmbH &Co. KGaA, Weinheim, ISBN: 3-527-30999-3, p211-212
2. Lönnberg, B., et al. Dissolution of wood components in black liquor started displacement Kraft batch cooking. In International Symposium on Wood and Pulping Chemistry. Beijing, China, 1993.
3. Masura, V., Alkaline degradation of spruce and beech wood. Wood Sci. Technol., 1982; 16: 155–164.
4. Li, J., Gellerstedt, G., Nordic Pulp Paper Res. J., 2002; 17(4): 410.
5. Stone, J.E. and Förderreuther, C., Studies of penetration and diffusion into wood. Tappi 39(1956)10, pp. 679 – 683
6. Paranyi, N. I. and Rabinovitch. W., Determination of penetration rate of liquid media into wood using quartz spiral balance. Pulp Paper Mag. Can. 56(1955)3, pp. 164 - 170.
7. Mantanis, G.I., Young, R.A., and Rowell, R.M., Swelling of wood, Part III. Effect of temperature and extractives on rate and maximum swelling. Holzforschung 49(1995)3, pp. 239 - 248.
Celuloză şi Hârtie 2010, vol.59, nr.3
36
APPLICATIONS OF NANOPARTICLES IN THE WET-END CHEMISTRY
Dan Buteică SC CEPROHART Brăila
Author correspondence: Pulp and Paper Research and Development Institute - SC
Ceprohart SA Brăila,Al.I.Cuza Blvd, no.3, Braila, Romania e-mail:[email protected], tel: 0239 619 741
Abstract
The first part of the paper presents dissolved and colloidal substances at paper machine wet end, their classification and origin and influence over processes at paper machine wet end.The main aspects involved in the application of nanoparticles at paper machine wet end are reviewed further. The main types of nanoparticles used in paper making are described: colloidal silica, bentonite, micropolymers, aluminium based microparticles and cationic microparticles. Applications of colloidal silica in paper making are inclusively summarized. Thus the main action directions are shown: retention – dewatering- strength as well as effects that paper producer can manage in the field of improving paper sheet quality and making production costs more efficient. In the second part the results obtained in the laboratory stage in the elaboration of an operational model of retention/dewatering polymer – modified bentonite and its transfer to industrial pilot are shown. Implementation of a polyacrylamide-modified bentonite retention system is quality paper making on a low speed Fourdrinier paper machine (90 m/min) has proved viable as regards machine functionality, quality characteristics of end product and economic efficiency. Keywords: Nanoparticles, Wet end, Bentonite, Retention, Dewatering
Rezumat
În prima parte a lucrării sunt trecute în revistă substantele dizolvate, coloidale şi disperse din partea umedă. Sunt prezentate substante dizolvate şi coloidale formate în timpul fierberii, defibrării şi din alte surse. În a doua parte a lucrării sunt prezentate rezultatele obţinute în faza de laborator de elaborare a unui model operaţional de retenţie – deshidratare polimer/bentonită modificată şi transferul acestuia în instalaţia pilot. Implementarea unui sistem de retenţie pe bază de poliacrilamidă – bentonită modificată pe o maşină de hârtie cu sită plană de viteză redusă (90 m/min) s-a dovedit viabilă cu privire la funcţionalitatea maşinii de hârtie, caracteristicile de calitate ale produsului şi eficienţa economică. Cuvinte cheie: Nanoparticule, Partea umedă, Bentonită, Retenţie, Deshidratare
INTRODUCTION
The very complex nature of wet end chemistry, makes from this process one the greatest challenges for paper producers. Chemical additives are directed towards the improvement of retention systems in order to decouple retention, dewatering and formation and, particuarly, optimization of retention
programs selected for a certain mill according to the mill’s specific conditions. Another research challenge is the control of flocculation index and its effects in the production process. In conclusion, the flocculation monitoring systems and a deeper understanding of flocculation mechanisms, of flocculation and reflocculation cinetics as well the floc properties are still necessary.
Celuloză şi Hârtie 2010, vol.59, nr.3
37
Approached responsibly, the advanced processing of data and simulation programs are today tools, useful for process optimization, on-line monitoring and statistics. Microparticle nanotechnologies in the nano field (1 – 300 nm) are proved able to provide responses and solutions to these challenges. Dissolved and colloidal substances at paper
machine wet end Classification and origin Anionic impurities usually consist in monomers, olygomers, polymers or hydrocolloids dissolved or colloidal. The origin of anionic impurities can be thus classified: - Colloidal and dissolved substances built up during cooking or wood defibration. - Colloidal and dissolved substances produced during pulp refining. - Other process dissolved and colliodal substances (for instance in fresh water, additives and recycled fibres). During the alkaline delignification lignin is splitted in low molecular weight fragments, and hemicelluloses are transformed up to simple hydroxiacids. These compounds are retrieved in white water at paper machine wet end in amounts that depend on washing, sizing degree and constructive elements of installation. A part of substances is dissolved during pulp refining (table 1) Products released during refining have much higher molecular weights, that present a significant importance as regards paper making chemistry because high molecular weight polymers have an enhanced ability to form complexes with cationic polymers. Table 1 Chemical composition of spent liquor from kraft cooking and dissolved substances
during kraft pulps
Kraft spent liquor
UM
Dissolved substances
during refining
UM
Lignin 47% Lignin 37% Hydroxiacids 28% Arabinose 3.6% Formic acid 7% Xylose 38.5% Acetic acid 4% Manose 1.8% Extractible 5% Galactose 3.2%
Others 9% Glucose 2.8% Others 3.6%
Substances coming from fresh water may contain humus, surfactants, salines and of course, fungi, bacteria or algae. Additives used in paper making are an important source of dissolved and colloidal substances at paper machine wet end. They may come from water- repellent resins, starch used in mass or at surface in the sizing press, dry strength aids, wet strength aids, in dry condition and other operational process additives. The influence of dissolved substances over processes at paper machine wet end has become more significant at the same time with closing the white water circuit and reducing fresh water consumption. Concentration of colloidal and disolved substances in the white water circuits has increased significantly and in some cases, transported material becomes higher than that of fibres. Anionic polymers from wooden mass generally have a lower sorption capacity on fibres and as a result they will concentrate in white water circuit and will influence the paper making process ( table 2).
Table 2 General effects of electrolytes and
anionic polymers in paper making
Specification
High content of electrolytes
High content of wood anionic polymers
Strength properties
_ + hemicelluloses - lignin
Refining speed _ 0
Dewatering + _
Paper sizing _ _ _
Fines retention _
_ _
Generally speaking, hemicelluloses favorably influences interfibres bonding, compared to lignin that provides paper rigidity and the property of being brittle. Anionic impurities react and inactivate cationic retention additives. In production systems with a high closing degree of white water circuits, cationic retention aids cannot be used without a preliminary inactivation of anionic impurities. High charge density cationic polymers that are used for the control of anionic impurities are commonly type epiclorhydrins, polyamidamines, polyethilenimines or polyDADMAC.
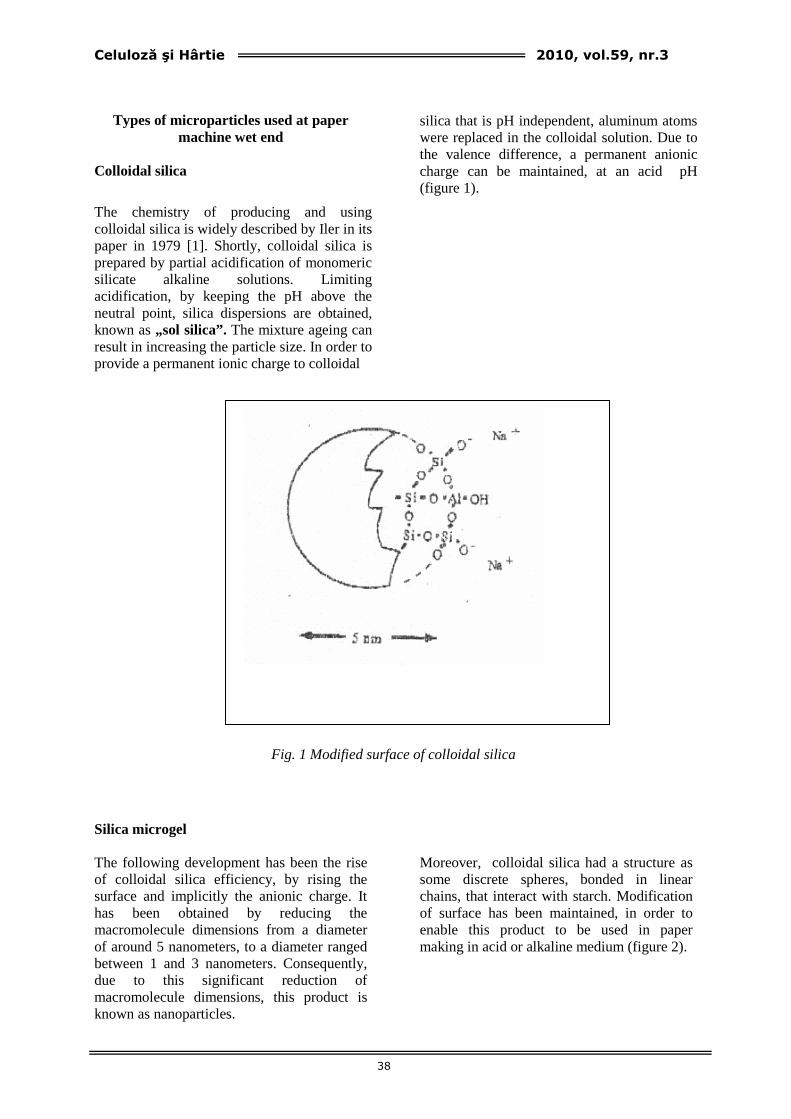
Celuloză şi Hârtie 2010, vol.59, nr.3
38
Types of microparticles used at paper
machine wet end Colloidal silica
The chemistry of producing and using colloidal silica is widely described by Iler in its paper in 1979 [1]. Shortly, colloidal silica is prepared by partial acidification of monomeric silicate alkaline solutions. Limiting acidification, by keeping the pH above the neutral point, silica dispersions are obtained, known as „sol silica”. The mixture ageing can result in increasing the particle size. In order to provide a permanent ionic charge to colloidal
silica that is pH independent, aluminum atoms were replaced in the colloidal solution. Due to the valence difference, a permanent anionic charge can be maintained, at an acid pH (figure 1).
Fig. 1 Modified surface of colloidal silica
Silica microgel The following development has been the rise of colloidal silica efficiency, by rising the surface and implicitly the anionic charge. It has been obtained by reducing the macromolecule dimensions from a diameter of around 5 nanometers, to a diameter ranged between 1 and 3 nanometers. Consequently, due to this significant reduction of macromolecule dimensions, this product is known as nanoparticles.
Moreover, colloidal silica had a structure as some discrete spheres, bonded in linear chains, that interact with starch. Modification of surface has been maintained, in order to enable this product to be used in paper making in acid or alkaline medium (figure 2).
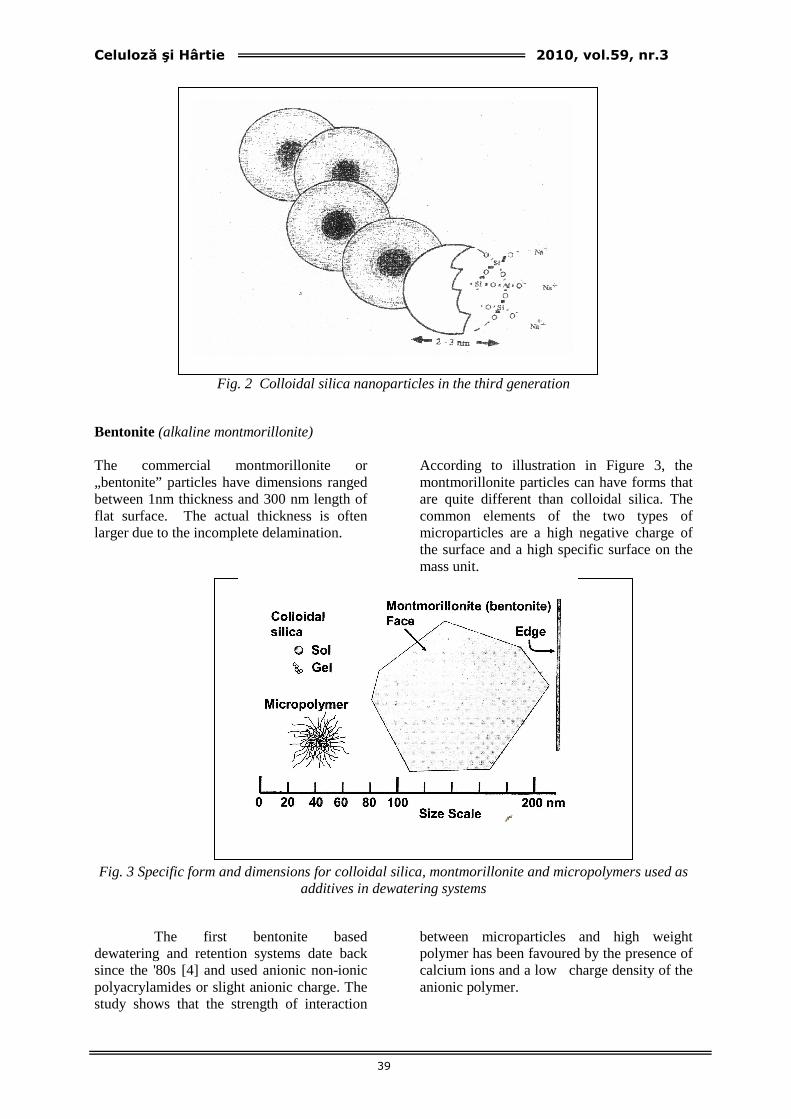
Celuloză şi Hârtie 2010, vol.59, nr.3
39
Fig. 2 Colloidal silica nanoparticles in the third generation
Bentonite (alkaline montmorillonite) The commercial montmorillonite or „bentonite” particles have dimensions ranged between 1nm thickness and 300 nm length of flat surface. The actual thickness is often larger due to the incomplete delamination.
According to illustration in Figure 3, the montmorillonite particles can have forms that are quite different than colloidal silica. The common elements of the two types of microparticles are a high negative charge of the surface and a high specific surface on the mass unit.
Fig. 3 Specific form and dimensions for colloidal silica, montmorillonite and micropolymers used as
additives in dewatering systems
The first bentonite based dewatering and retention systems date back since the '80s [4] and used anionic non-ionic polyacrylamides or slight anionic charge. The study shows that the strength of interaction
between microparticles and high weight polymer has been favoured by the presence of calcium ions and a low charge density of the anionic polymer.
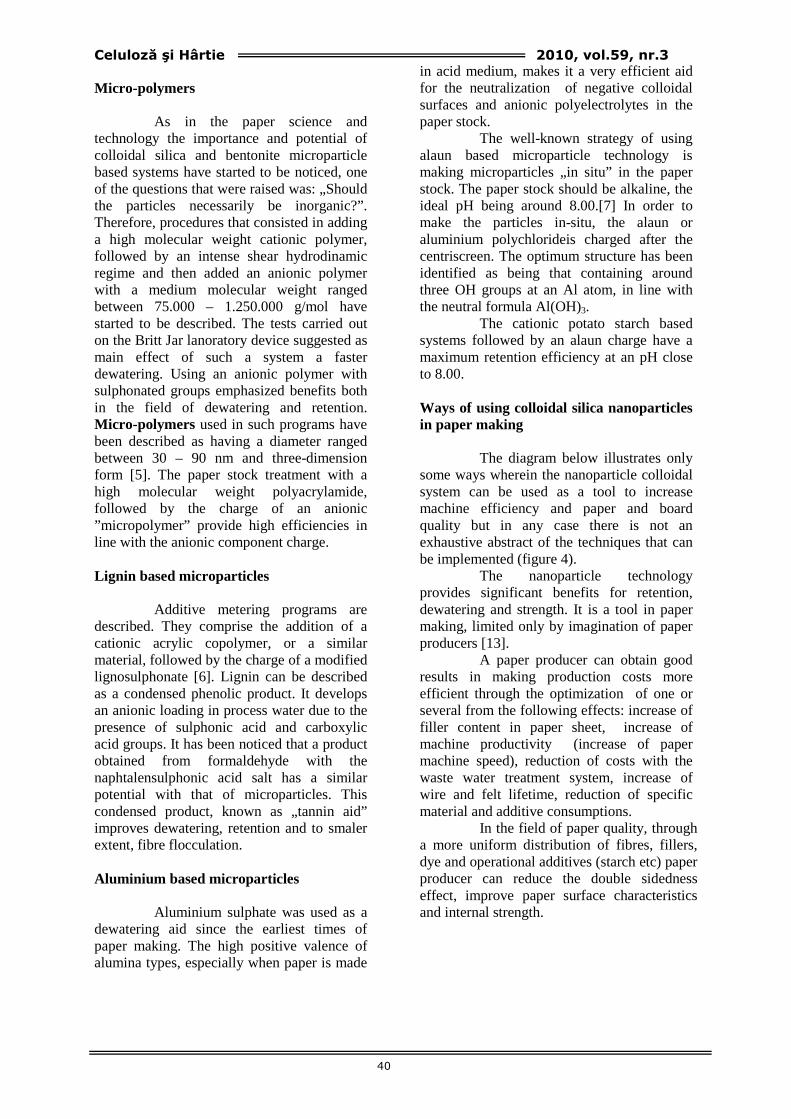
Celuloză şi Hârtie 2010, vol.59, nr.3
40
Micro-polymers
As in the paper science and technology the importance and potential of colloidal silica and bentonite microparticle based systems have started to be noticed, one of the questions that were raised was: „Should the particles necessarily be inorganic?”. Therefore, procedures that consisted in adding a high molecular weight cationic polymer, followed by an intense shear hydrodinamic regime and then added an anionic polymer with a medium molecular weight ranged between 75.000 – 1.250.000 g/mol have started to be described. The tests carried out on the Britt Jar lanoratory device suggested as main effect of such a system a faster dewatering. Using an anionic polymer with sulphonated groups emphasized benefits both in the field of dewatering and retention. Micro-polymers used in such programs have been described as having a diameter ranged between 30 – 90 nm and three-dimension form [5]. The paper stock treatment with a high molecular weight polyacrylamide, followed by the charge of an anionic ”micropolymer” provide high efficiencies in line with the anionic component charge. Lignin based microparticles
Additive metering programs are described. They comprise the addition of a cationic acrylic copolymer, or a similar material, followed by the charge of a modified lignosulphonate [6]. Lignin can be described as a condensed phenolic product. It develops an anionic loading in process water due to the presence of sulphonic acid and carboxylic acid groups. It has been noticed that a product obtained from formaldehyde with the naphtalensulphonic acid salt has a similar potential with that of microparticles. This condensed product, known as „tannin aid” improves dewatering, retention and to smaler extent, fibre flocculation. Aluminium based microparticles
Aluminium sulphate was used as a dewatering aid since the earliest times of paper making. The high positive valence of alumina types, especially when paper is made
in acid medium, makes it a very efficient aid for the neutralization of negative colloidal surfaces and anionic polyelectrolytes in the paper stock.
The well-known strategy of using alaun based microparticle technology is making microparticles „in situ” in the paper stock. The paper stock should be alkaline, the ideal pH being around 8.00.[7] In order to make the particles in-situ, the alaun or aluminium polychlorideis charged after the centriscreen. The optimum structure has been identified as being that containing around three OH groups at an Al atom, in line with the neutral formula Al(OH)3.
The cationic potato starch based systems followed by an alaun charge have a maximum retention efficiency at an pH close to 8.00. Ways of using colloidal silica nanoparticles in paper making
The diagram below illustrates only some ways wherein the nanoparticle colloidal system can be used as a tool to increase machine efficiency and paper and board quality but in any case there is not an exhaustive abstract of the techniques that can be implemented (figure 4).
The nanoparticle technology provides significant benefits for retention, dewatering and strength. It is a tool in paper making, limited only by imagination of paper producers [13].
A paper producer can obtain good results in making production costs more efficient through the optimization of one or several from the following effects: increase of filler content in paper sheet, increase of machine productivity (increase of paper machine speed), reduction of costs with the waste water treatment system, increase of wire and felt lifetime, reduction of specific material and additive consumptions.
In the field of paper quality, through a more uniform distribution of fibres, fillers, dye and operational additives (starch etc) paper producer can reduce the double sidedness effect, improve paper surface characteristics and internal strength.
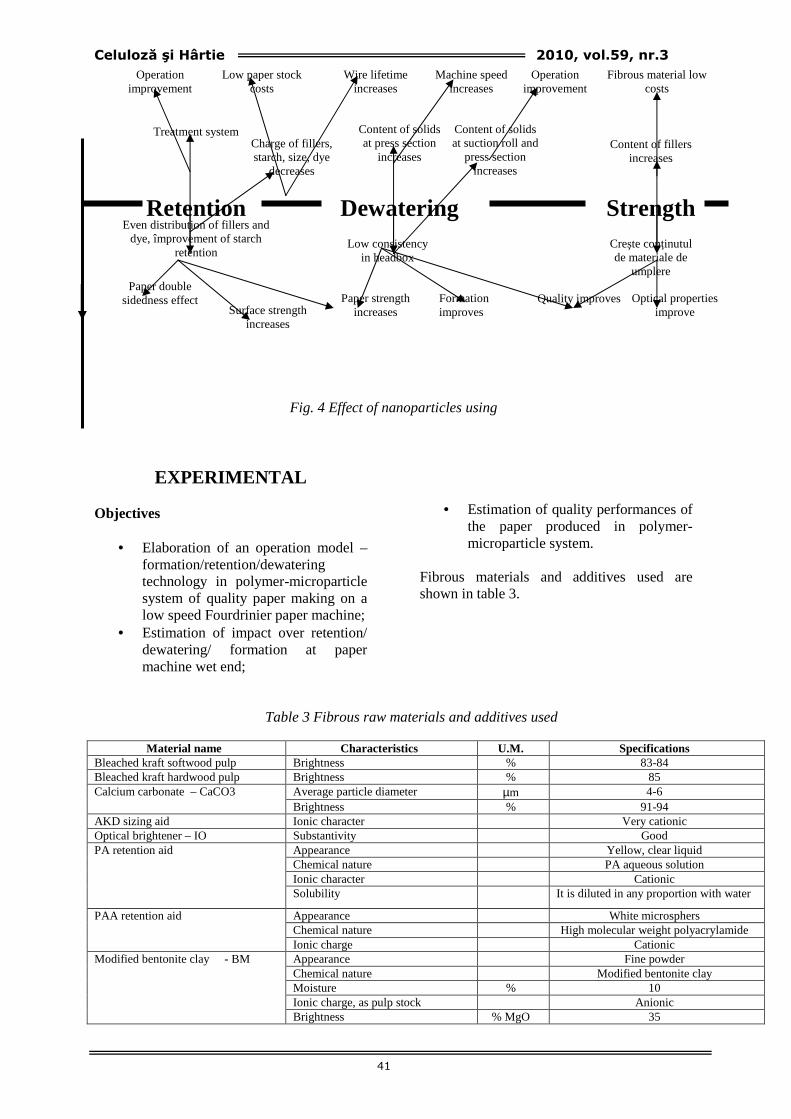
Celuloză şi Hârtie 2010, vol.59, nr.3
41
Fig. 4 Effect of nanoparticles using
EXPERIMENTAL Objectives
• Elaboration of an operation model – formation/retention/dewatering technology in polymer-microparticle system of quality paper making on a low speed Fourdrinier paper machine;
• Estimation of impact over retention/ dewatering/ formation at paper machine wet end;
• Estimation of quality performances of the paper produced in polymer-microparticle system.
Fibrous materials and additives used are shown in table 3.
Table 3 Fibrous raw materials and additives used
Material name Characteristics U.M. Specifications Bleached kraft softwood pulp Brightness % 83-84 Bleached kraft hardwood pulp Brightness % 85
Average particle diameter µm 4-6 Calcium carbonate – CaCO3 Brightness % 91-94
AKD sizing aid Ionic character Very cationic Optical brightener – IO Substantivity Good
Appearance Yellow, clear liquid Chemical nature PA aqueous solution Ionic character Cationic
PA retention aid
Solubility It is diluted in any proportion with water
Appearance White microsphers Chemical nature High molecular weight polyacrylamide
PAA retention aid
Ionic charge Cationic Appearance Fine powder Chemical nature Modified bentonite clay Moisture % 10 Ionic charge, as pulp stock Anionic
Modified bentonite clay - BM
Brightness % MgO 35
Retention Dewatering Strength
Operation improvement
Wire lifetime increases
Low paper stock costs
Machine speed increases
Operation improvement
Treatment system
Fibrous material low costs
Charge of fillers, starch, size, dye
decreases
Content of solids at press section
increases
Content of solids at suction roll and
press section increases
Content of fillers increases
Even distribution of fillers and dye, împrovement of starch
retention Low consistency
in headbox Creşte conţinutul de materiale de
umplere Paper double
sidedness effect Surface strength
increases
Paper strength increases
Formation improves
Quality improves Optical properties improve
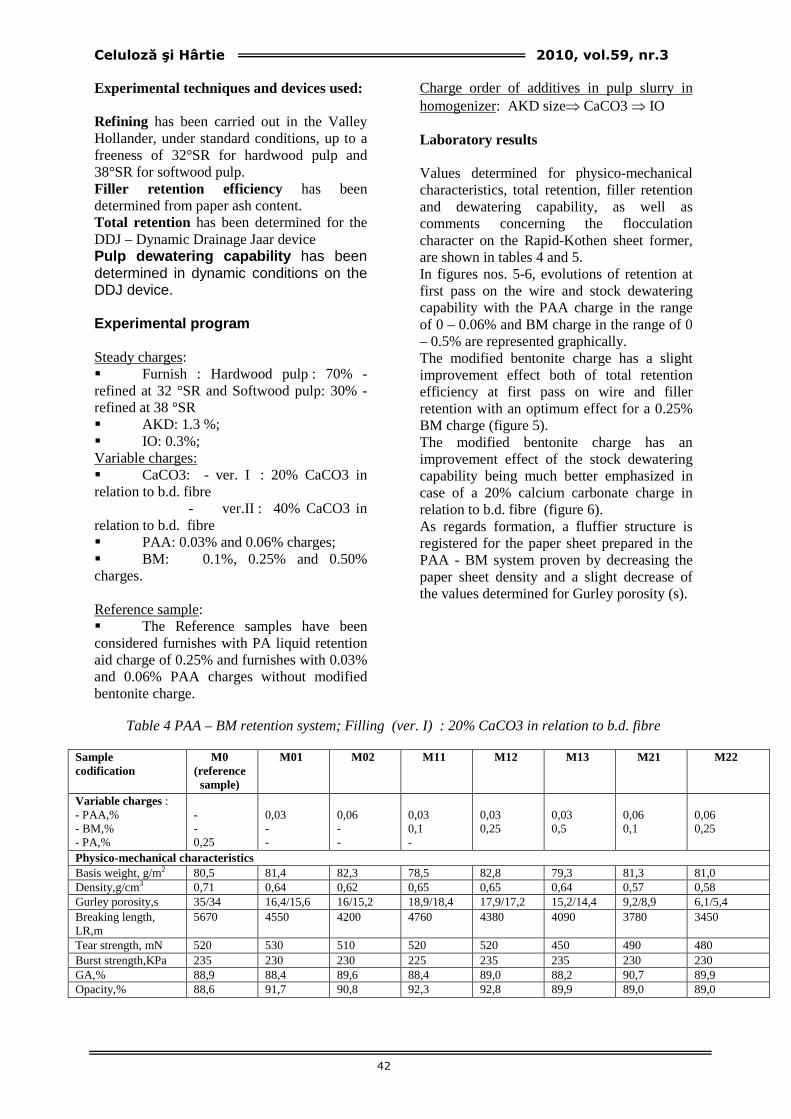
Celuloză şi Hârtie 2010, vol.59, nr.3
42
Experimental techniques and devices used: Refining has been carried out in the Valley Hollander, under standard conditions, up to a freeness of 32°SR for hardwood pulp and 38°SR for softwood pulp. Filler retention efficiency has been determined from paper ash content. Total retention has been determined for the DDJ – Dynamic Drainage Jaar device Pulp dewatering capability has been determined in dynamic conditions on the DDJ device.
Experimental program
Steady charges: � Furnish : Hardwood pulp : 70% - refined at 32 °SR and Softwood pulp: 30% - refined at 38 °SR � AKD: 1.3 %; � IO: 0.3%; Variable charges: � CaCO3: - ver. I : 20% CaCO3 in relation to b.d. fibre - ver.II : 40% CaCO3 in relation to b.d. fibre � PAA: 0.03% and 0.06% charges; � BM: 0.1%, 0.25% and 0.50% charges. Reference sample: � The Reference samples have been considered furnishes with PA liquid retention aid charge of 0.25% and furnishes with 0.03% and 0.06% PAA charges without modified bentonite charge.
Charge order of additives in pulp slurry in homogenizer: AKD size⇒ CaCO3 ⇒ IO Laboratory results Values determined for physico-mechanical characteristics, total retention, filler retention and dewatering capability, as well as comments concerning the flocculation character on the Rapid-Kothen sheet former, are shown in tables 4 and 5. In figures nos. 5-6, evolutions of retention at first pass on the wire and stock dewatering capability with the PAA charge in the range of 0 – 0.06% and BM charge in the range of 0 – 0.5% are represented graphically. The modified bentonite charge has a slight improvement effect both of total retention efficiency at first pass on wire and filler retention with an optimum effect for a 0.25% BM charge (figure 5). The modified bentonite charge has an improvement effect of the stock dewatering capability being much better emphasized in case of a 20% calcium carbonate charge in relation to b.d. fibre (figure 6). As regards formation, a fluffier structure is registered for the paper sheet prepared in the PAA - BM system proven by decreasing the paper sheet density and a slight decrease of the values determined for Gurley porosity (s).
Table 4 PAA – BM retention system; Filling (ver. I) : 20% CaCO3 in relation to b.d. fibre
Sample codification
M0 (reference sample)
M01 M02 M11 M12 M13 M21 M22
Variable charges : - PAA,% - BM,% - PA,%
- - 0,25
0,03 - -
0,06 - -
0,03 0,1 -
0,03 0,25
0,03 0,5
0,06 0,1
0,06 0,25
Physico-mechanical characteristics Basis weight, g/m2 80,5 81,4 82,3 78,5 82,8 79,3 81,3 81,0 Density,g/cm3 0,71 0,64 0,62 0,65 0,65 0,64 0,57 0,58 Gurley porosity,s 35/34 16,4/15,6 16/15,2 18,9/18,4 17,9/17,2 15,2/14,4 9,2/8,9 6,1/5,4 Breaking length, LR,m
5670 4550 4200 4760 4380 4090 3780 3450
Tear strength, mN 520 530 510 520 520 450 490 480 Burst strength,KPa 235 230 230 225 235 235 230 230 GA,% 88,9 88,4 89,6 88,4 89,0 88,2 90,7 89,9 Opacity,% 88,6 91,7 90,8 92,3 92,8 89,9 89,0 89,0
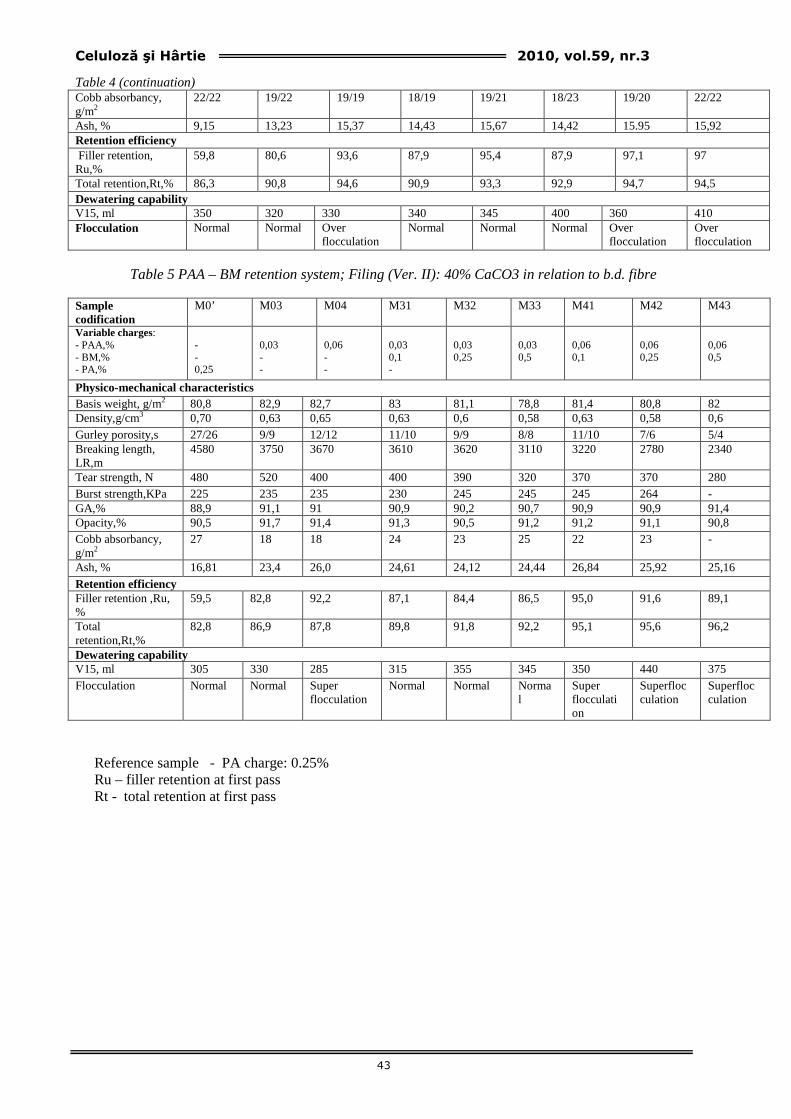
Celuloză şi Hârtie 2010, vol.59, nr.3
43
Table 4 (continuation) Cobb absorbancy, g/m2
22/22 19/22 19/19 18/19 19/21 18/23 19/20 22/22
Ash, % 9,15 13,23 15,37 14,43 15,67 14,42 15.95 15,92 Retention efficiency Filler retention, Ru,%
59,8 80,6 93,6 87,9 95,4 87,9 97,1 97
Total retention,Rt,% 86,3 90,8 94,6 90,9 93,3 92,9 94,7 94,5 Dewatering capability V15, ml 350 320 330 340 345 400 360 410 Flocculation Normal Normal Over
flocculation Normal Normal Normal Over
flocculation Over flocculation
Table 5 PAA – BM retention system; Filing (Ver. II): 40% CaCO3 in relation to b.d. fibre
Sample codification
M0’ M03 M04 M31 M32 M33 M41 M42 M43
Variable charges: - PAA,% - BM,% - PA,%
- - 0,25
0,03 - -
0,06 - -
0,03 0,1 -
0,03 0,25
0,03 0,5
0,06 0,1
0,06 0,25
0,06 0,5
Physico-mechanical characteristics Basis weight, g/m2 80,8 82,9 82,7 83 81,1 78,8 81,4 80,8 82 Density,g/cm3 0,70 0,63 0,65 0,63 0,6 0,58 0,63 0,58 0,6 Gurley porosity,s 27/26 9/9 12/12 11/10 9/9 8/8 11/10 7/6 5/4 Breaking length, LR,m
4580 3750 3670 3610 3620 3110 3220 2780 2340
Tear strength, N 480 520 400 400 390 320 370 370 280 Burst strength,KPa 225 235 235 230 245 245 245 264 - GA,% 88,9 91,1 91 90,9 90,2 90,7 90,9 90,9 91,4 Opacity,% 90,5 91,7 91,4 91,3 90,5 91,2 91,2 91,1 90,8 Cobb absorbancy, g/m2
27 18 18 24 23 25 22 23 -
Ash, % 16,81 23,4 26,0 24,61 24,12 24,44 26,84 25,92 25,16
Retention efficiency Filler retention ,Ru, %
59,5 82,8 92,2 87,1 84,4 86,5 95,0 91,6 89,1
Total retention,Rt,%
82,8 86,9 87,8 89,8 91,8 92,2 95,1 95,6 96,2
Dewatering capability V15, ml 305 330 285 315 355 345 350 440 375 Flocculation Normal Normal Super
flocculation Normal Normal Norma
l Super flocculation
Superflocculation
Superflocculation
Reference sample - PA charge: 0.25% Ru – filler retention at first pass Rt - total retention at first pass
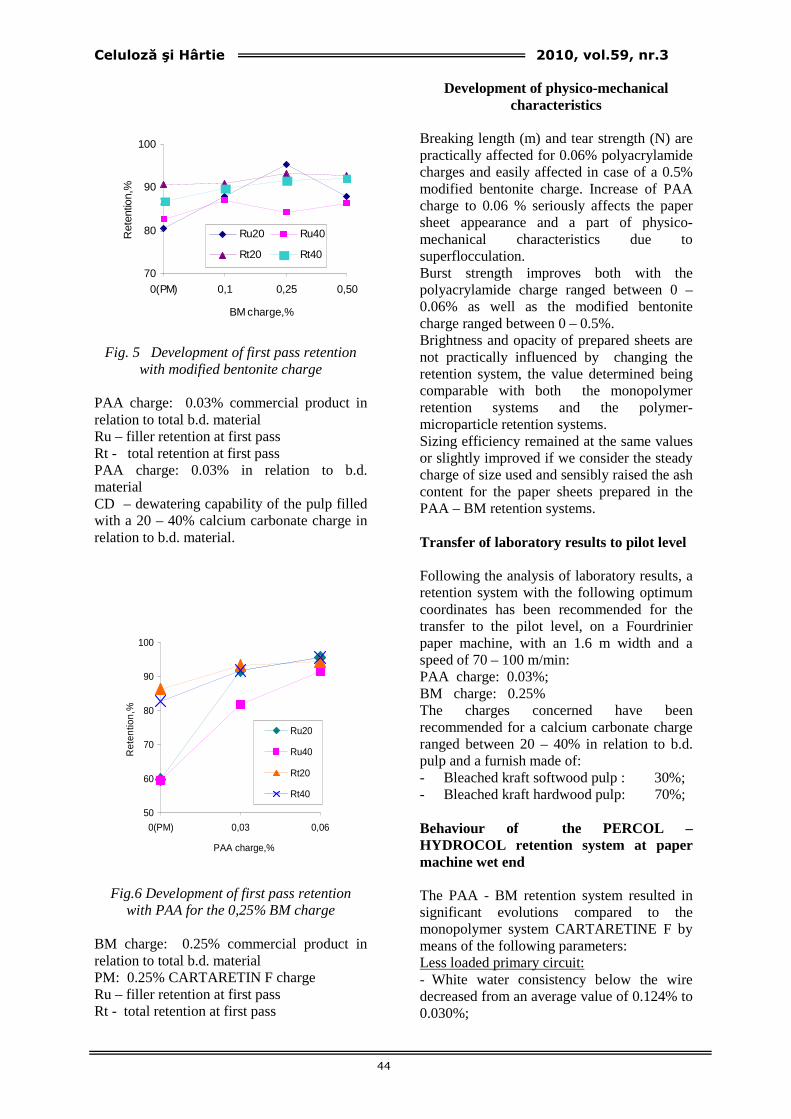
Celuloză şi Hârtie 2010, vol.59, nr.3
44
70
80
90
100
0(PM) 0,1 0,25 0,50
BM charge,%
Ret
entio
n,%
Ru20 Ru40
Rt20 Rt40
Fig. 5 Development of first pass retention with modified bentonite charge
PAA charge: 0.03% commercial product in relation to total b.d. material Ru – filler retention at first pass Rt - total retention at first pass PAA charge: 0.03% in relation to b.d. material CD – dewatering capability of the pulp filled with a 20 – 40% calcium carbonate charge in relation to b.d. material.
50
60
70
80
90
100
0(PM) 0,03 0,06
PAA charge,%
Ret
entio
n,%
Ru20
Ru40
Rt20
Rt40
Fig.6 Development of first pass retention with PAA for the 0,25% BM charge
BM charge: 0.25% commercial product in relation to total b.d. material PM: 0.25% CARTARETIN F charge Ru – filler retention at first pass Rt - total retention at first pass
Development of physico-mechanical
characteristics Breaking length (m) and tear strength (N) are practically affected for 0.06% polyacrylamide charges and easily affected in case of a 0.5% modified bentonite charge. Increase of PAA charge to 0.06 % seriously affects the paper sheet appearance and a part of physico-mechanical characteristics due to superflocculation. Burst strength improves both with the polyacrylamide charge ranged between 0 – 0.06% as well as the modified bentonite charge ranged between 0 – 0.5%. Brightness and opacity of prepared sheets are not practically influenced by changing the retention system, the value determined being comparable with both the monopolymer retention systems and the polymer-microparticle retention systems. Sizing efficiency remained at the same values or slightly improved if we consider the steady charge of size used and sensibly raised the ash content for the paper sheets prepared in the PAA – BM retention systems. Transfer of laboratory results to pilot level Following the analysis of laboratory results, a retention system with the following optimum coordinates has been recommended for the transfer to the pilot level, on a Fourdrinier paper machine, with an 1.6 m width and a speed of 70 – 100 m/min: PAA charge: 0.03%; BM charge: 0.25% The charges concerned have been recommended for a calcium carbonate charge ranged between 20 – 40% in relation to b.d. pulp and a furnish made of: - Bleached kraft softwood pulp : 30%; - Bleached kraft hardwood pulp: 70%; Behaviour of the PERCOL – HYDROCOL retention system at paper machine wet end The PAA - BM retention system resulted in significant evolutions compared to the monopolymer system CARTARETINE F by means of the following parameters: Less loaded primary circuit: - White water consistency below the wire decreased from an average value of 0.124% to 0.030%;
Celuloză şi Hârtie 2010, vol.59, nr.3
45
- Launching consistency lowered from 0.57% to 0.43% mainly as a result of reducing water loading in the primary circuit; Improvement of retention efficiency - Retention efficiencies at first pass improved from 78.2% to 93.05% for total retention and from 50.7% to 71.8% for filler retention; - Improvement of filler retention is reflected in decreasing the ash content in the launching stock from 34% to 22.2% . Machine functionality Machine had a very good operation during the demonstrative trial. Some breaks have registered at paper machine calender meaning a better operation compared to the previous reference period. Quality characteristics of end product Analysis of quality characteristics of end product reveals the following: • Paper produced with the PERCOL – HYDROCOL retention system has a fluffier structure confirming that behaviour noticed in laboratory; therefore, paper density decreased from 0.74 g/cm3 for the reference sample at 0.70 g/cm3 and porosity increased sensibly, from average values of Gurley porosity of 16.1/15.8 s to 7.3/7.4 s; • Smoothness of demonstrative sample had average values of 24/24 s compared to 33/29 s for the reference sample; registered decrease can be put on the fluffier structure; • Average breaking length was 5430 m for the reference sample and 5260 m for experimental production and is within the variation regime of this characteristic for the same furnish and filling; • Tear strength has registered a major rise, by around 31%, from 220/260 mN to 290/340 mN, beneficial to improve paper machine functionality; • Ash content in paper sheet has been 12.1% for the reference sample and 12.3% for the experimental sample, proportional with the calcium carbonate charge metered at pulper; Monitoring and analysis of parameters at paper machine wet end revealed that the polymer-microparticle retention system has a higher efficiency compared to the reference production in the monopolymer (polyamidamine) retention system through the following parameters: increase of retention efficiency at first pass, reduction of launching stock consistency, reduction of white water loading below the wire.
As regards quality characteristics, paper produced in the polymer - microparticle retention system had a fluffier structure, a lower smoothness and higher values for tear strength and dusting strength.
CONCLUSIONS Implementation of a polyacrylamide- modified bentonite retention system in the quality paper making on a low speed Fourdrinier paper machine (90 m/min) is proved viable as regards the paper functionality, quality characteristics of end product and economic efficiency. Monitoring and analysis of parameters at paper machine wet end has revealed that the polymer-microparticle retention systemis efficient compared to the reference production in monopolymer (poliamidamină) retention system through the following parameters: increase of retention efficiency at first pass on wire, reduction of launching stock consistency, reduction of white water loading below wire. As regards quality characteristics, paper produced in polymer-microparticle system had a fluffier structure, a lower smoothness and higher values of tear strength and dusting strength. The economic analysis has emphasized the opportunity of obtaining savings even for an ash content in paper sheet of 12 %. Significant savings can be obtained (35-40 Eur/tonne) by rising the ash content in the paper sheet to 24-25%.
REFERENCES
1. Bobu E., Popa V.I., - Procese chimico-coloidale la fabricarea hârtiei, Editura CERMI, Iaşi, 1996, p 272- 303
2. Obrocea P., Bobu E., - Bazele fabricării hârtiei , vol. 1, Iaşi 1993
3. Iler, R.K., „The Chemistry of Silica – Solubility, Polimerization, Colloid and Surface Properties,and Biochemistry,” J. Willey and Sons, New York, 1979
4. On,C., and Thorn,I., „Progress in the Use of Colloidal Silica in Dual-
Celuloză şi Hârtie 2010, vol.59, nr.3
46
Component Systems,” EUR. Papermarker 3 (2): 28 (1995)
5. Moffett,R.H., „On-Site Production of a Silica-Based Microparticulate retention and Drainage Aid,” Tappi J. 77 (12): 133 (1994).
1. Langley, J.,G. „Dewatering aids for Paper Applications,” Proc.Litchfield,E., TAPPI 1986 Papermakers Conf., 89 (1974)
2. Aloi, F.G. and Trksak,R.M., „Retention in Neutral and Alkaline Papermaking”, in J.M.Gess,Ed., Retention of Fines and Fillers during Papermaking”, TAPPI PRESS, 1998, p.80-97
3. Adamsky, F.A., and Williams, B.J.,„Effect of New Drainage, Retention, Formation Technology for Improving Production Rates and Runability of Recycled Fiber Cylinder Machines”, TAPPI J.,79 (8):175 (1996)
4. Nobel J., and Borkvist,M. „A New Microparticles-Based Retention Aid System for Alkaline Papermaking.Hidrosil,” Proc. EUCEPA Symp. Additives, Pigments and Fillers Pulp and Paper Industry (Barcelona), 295-306, oct 22-24, 1990
5. Penniman, J.G., „On-Line Monitoring of Microparticulate Papermaking Process Chemistry’, Proc. TAPPI 1994 Papermakers Conf., 229 (1984)
6. Nobel,J. And Borgkvist,M. „A New Microparticle-Based Retention Aid System for Alkaline Papermaking, Hydrosil”, Proc. EUCEPA Symp. Additives, Pigments, and Fillers Pulp and Paper Industry (Barcelona), 295-306, Oct 22-24, 1990
7. Paul Fish „Micro and nanoparticles in papermaking, chapter 3: Colloidal Silica, TAPPI PRESS, Atlanta, 2005
8. Main,S. and Simonson,P. „Retention Aids for High Speed Paper Machines”, TAPPI Journal 82 (4), 1999
9. D. Carr „Effects of Nanoparticles in Wood Containing Furnishes”, TAPPI Paper Sumit, Martie 2002
10. K.Moburg and L. Nilsson „Improving Base Sheet Quality with a Silica Microparticle Wet End System”, TAPPI Coating Conference, 1991
11. Buteica D. - Nanotehnologii in partea umeda a masinii de hartie”, Al V lea Simpozion International, „Tehnologii avansate pentru industria celulozei, hartiei şi mediu”, Braila, 3-5 septembrie 2008
Celuloză şi Hârtie 2010, vol.59, nr.3
47
BOOK REVIEW
Jean-Luc Wertz, Olivier Bedue and Jean P. Mercier
CELLULOSE SCIENCE AND TECHNOLOGY
2010, 368 pages, 16x24 cm, Hardcover, EPFL Press, ISBN 978-2-940222-41-4, CRC Press, ISBN 978-1-42000-6688-3
Cellulose represents the most widely
spread organic polymer found in nature and it was used for a long time as a raw material for paper, textiles, film and flexible packing material. Due to its accessibility in huge amounts by photosynthesis process as a renewable material, cellulose is considered at present as a chance to answer to many problems connected with sustainable development. This explains the great scientific interest for this compound along with a lot of preoccupations to systematize the accumulated information in reviews and books. In the following, one of the last books dedicated to cellulose will be presented. In chapter 1, some general aspects concerning molecular structure of cellulose, along with its glucose monomer and related di- and polysaccharides such as amylose, chitin and chitosan are discussed. In the chapter 2 cellulose biosynthesis is described. This process which has been elucidated in the last years is comparatively analyzed in different organisms including plants and bacteria. It was established that cellulose biogenesis is a multi-step process involving terminal complexes containing cellulose synthase enzymes and spin cellulose microfibrils. The obtained information was made possible in vitro and chemical synthesis of cellulose. The structure and properties of cellulose are approached in the chapter 3. Having in mind aspects of molecular structure presented in chapter 1, the authors analyze supramolecular level of organization of cellulose. It is known that the properties of this polymer are influenced by crystalline structure which in the case of cellulose is different as a function of its polymorphs. Each polymorph is defined by its unit cell parameters determined by a special distribution of cellulose chains which influence the behaviour of the polymer. Further level of organization of crystals is into
microfibrils, layers or lamellae, cell walls, fibers, tissues or other morphological forms which are changed by the subsequent product processing. These aspects are discussed in the case of microfibrils, plant cell walls and bacterial celluloses related with biosynthesis processes. Cellulose is characterized by valuable mechanical and physical properties appreciated by its large scale utilizations. At the same time cellulose is biodegradable and non-toxic to living organism and interesting reinforced materials can be obtained using micro- or nanofibrils. Many aspects concerning utilization of cellulose are correlated with its swelling and dissolution, as resulting in chapter 4. The relationships between cellulose and water are very important in the processing, application, and storage of cellulosic materials which are discussed in term of intercrystalline swelling. This phenomenon is also characteristic when an interaction between cellulose and organic liquids take place. Intracrystalline swelling is induced by alkali metal hydroxides, salts in strongly alkaline solution, some inorganic acids, certain amines, ammonia and hydrazine. These problems are analyzed from the important applications point of view. Thus, dissolution is one of them, several proposals have been made and a variety of cellulose solvents already exist.
The dissolution of cellulose is discussed in detail and the possibilities of cellulose fibers obtaining are analyzed in the context of ecological problems along with increasing needs of fibers. Biodegradability of cellulose is determined by enzymes produced by some fungi and bacteria. This process is associated with carbon cycle in nature but its knowledge has a lot of advantages because both biodegradation and biostabilization of cellulose are important for some applications.
Celuloză şi Hârtie 2010, vol.59, nr.3
48
The enzymatic hydrolysis of
cellulose represents the subject of chapter 5. The characteristics of enzyme and mechanism are very important for their applications. The peculiarities of enzymatic complexes are evidenced for different microorganisms including both fungi and bacteria, which are very important to develop genetic modification experiments and to obtain enzyme with specific activity for dedicated application. In the category of cellulose degradation are also included non-biological procedures presented in chapter 6.
The main reactions included are acid hydrolysis, alkaline degradation, oxidative degradation, thermal degradation, mechanical and radiation degradations which are very important for utilization, processing, stability and valorification of cellulose or lignocelluloses with the aim to obtain different chemicals. A lot of applications of celluloses refer to its derivatives. These are obtained from purified pulps using esterification, etherification, crosslinking and grafting (chapter 7). Taking into account the versality of cellulose to be modified and valuable properties of cellulose derivatives, it is expected that their production will be developed in the future. Renewable resources defined as biomass are expected to be used to produce fuels and chemicals (chapter 8). There is a lot of information that demonstrates feasibility of different procedures based on biochemical or thermochemical conversion to solve the problems connected with the fuels and chemicals. At the same time, some processing steps may be implemented in integrated systems according to the new concept of biorefinery.
These possibilities are presented in
optimistic view in the last chapter 9 (Perspectives) along with new tendencies of researches in the field of cellulose (biosynthesis, cellulose nanofibers, ionic liquid as new cellulose solvents). But successful solutions could be assured only by a large international cooperation between specialists from different fields and corresponding financial resources. This book is presented in an excellent graphics and printed form and it will be useful to scientist and postgraduate students working in the field of cellulose and should be of interest for people working in the areas of complex processing of biomass.
Prof.dr.eng. Valentin I.Popa – Gheorghe Asachi Technical University of Iasi