ANALIZA COINTEGRĂRII COINTEGRATION ANALYSIS URSIERE...
16
INFORMATICĂ, STATISTICĂ ȘI CIBERNETICĂ ECONOMICĂ/INFORMATICS, STATISTICS AND ECONOMIC CIBERNETICS CZU: 336.761(44+430+438+498) ANALIZA COINTEGRĂRII PIEȚELOR BURSIERE EUROPENE (ROMÂNIA, GERMANIA, FRANȚA ȘI POLONIA) DIN PERSPECTIVA INVESTIRII ACTIVELOR NETE ALE FONDURILOR DE PENSII ADMINISTRATE PRIVAT DIN ROMÂNIA Lect. drd. Andreea-Cristina PETRICĂ, ASE Bucureşti [email protected] Prof. univ. dr. Stelian STANCU, ASE Bucureşti, Centrul de Servicii Industriale şi Economice. Academia Română [email protected] Prof. univ. dr. Ion PÂRŢACHI, ASEM [email protected] Scopul acestei lucrări constă în studierea cointegrării pieței bursiere românești (Bursa de Valori București) cu trei dintre piețele bursiere europene, respectiv: Germania, Franța și Polo- nia. Alegerea piețelor europene are la bază investițiile activelor nete ale fondurilor de pensii administrate privat din România. În conformitate cu Autoritatea de Supraveghere Financiară din România, la data de 30 iunie 2016, 91,28% din totalul investițiilor fondurilor de pensii admi- nistrate privat în acțiuni au fost efectuate în acțiuni românești, în timp ce restul de 8,72% (0,44 miliarde lei) au fost efectuate în acțiuni emise de Germania (2,34%), Franța (2,23%), Polonia (0,89%) și alte țări. Având în vedere maximizarea randamentelor prin gestionarea riscurilor și, de asemenea, captarea mișcărilor piețelor sus-menționate, realizăm analiza coin- tegrării pentru a examina diversificarea porto- foliului de acțiuni al fondurilor de pensii admi- CZU: 336.761(44+430+438+498) COINTEGRATION ANALYSIS OF EUROPEAN STOCK MARKETS (ROMANIA, GERMANY, FRANCE AND POLAND) FROM THE PERSPECTIVE OF THE NET ASSETS INVESTMENT OF THE ROMANIAN MANDATORY PRIVATE PENSION FUNDS Lecturer, PhD candidate, Andreea-Cristina PETRICA, [email protected] Bucharest Academy of Economic Studies Professor, PhD Stelian STANCU, Bucharest Academy of Economic Studies, Centre for Industrial and Services Economics, Romanian Academy [email protected] Professor, PhD Ion PARTACHI, ASEM [email protected] The goal of this paper is to investigate cointegration between Bucharest Stock Exchange and three European Stock Markets: Germany, France and Poland, respectively. The choice of the European markets is based on the net assets investment of the Romanian mandatory private pension funds. On June 30, 2016, according to the Romanian Financial Supervisory Authority 91.28% of all investments in shares of private pension funds have been performed in Romanian shares, while the rest of 8.72% (0.44 billion lei) have been performed in shares issued by Germany (2.34%), France (2.23%), Poland (0.89%) and other countries. Having the intention of achieving maximizing returns by managing risk, and also to capture the co-movements in the above markets, we perform the cointegration analysis to examine portfolio diversification of the Romanian man- datory private pension funds. The empirical Revista / Journal „ECONOMICA” nr.4 (98) 2016 104
Transcript of ANALIZA COINTEGRĂRII COINTEGRATION ANALYSIS URSIERE...

INFORMATICĂ, STATISTICĂ ȘI CIBERNETICĂ ECONOMICĂ/INFORMATICS, STATISTICS AND ECONOMIC CIBERNETICS
CZU: 336.761(44+430+438+498)
ANALIZA COINTEGRĂRII PIEȚELOR BURSIERE
EUROPENE (ROMÂNIA, GERMANIA, FRANȚA ȘI
POLONIA) DIN PERSPECTIVA INVESTIRII ACTIVELOR NETE ALE FONDURILOR DE PENSII ADMINISTRATE PRIVAT DIN
ROMÂNIA
Lect. drd. Andreea-Cristina PETRICĂ, ASE Bucureşti
[email protected] Prof. univ. dr. Stelian STANCU,
ASE Bucureşti, Centrul de Servicii Industriale şi Economice.
Academia Română [email protected]
Prof. univ. dr. Ion PÂRŢACHI, ASEM [email protected]
Scopul acestei lucrări constă în studierea
cointegrării pieței bursiere românești (Bursa de Valori București) cu trei dintre piețele bursiere europene, respectiv: Germania, Franța și Polo-nia. Alegerea piețelor europene are la bază investițiile activelor nete ale fondurilor de pensii administrate privat din România. În conformitate cu Autoritatea de Supraveghere Financiară din România, la data de 30 iunie 2016, 91,28% din totalul investițiilor fondurilor de pensii admi-nistrate privat în acțiuni au fost efectuate în acțiuni românești, în timp ce restul de 8,72% (0,44 miliarde lei) au fost efectuate în acțiuni emise de Germania (2,34%), Franța (2,23%), Polonia (0,89%) și alte țări. Având în vedere maximizarea randamentelor prin gestionarea riscurilor și, de asemenea, captarea mișcărilor piețelor sus-menționate, realizăm analiza coin-tegrării pentru a examina diversificarea porto-foliului de acțiuni al fondurilor de pensii admi-
CZU: 336.761(44+430+438+498)
COINTEGRATION ANALYSIS OF EUROPEAN STOCK MARKETS (ROMANIA,
GERMANY, FRANCE AND POLAND) FROM THE
PERSPECTIVE OF THE NET ASSETS INVESTMENT OF THE
ROMANIAN MANDATORY PRIVATE PENSION FUNDS
Lecturer, PhD candidate,
Andreea-Cristina PETRICA, [email protected]
Bucharest Academy of Economic Studies Professor, PhD Stelian STANCU,
Bucharest Academy of Economic Studies, Centre for Industrial and Services
Economics, Romanian Academy [email protected]
Professor, PhD Ion PARTACHI, ASEM [email protected]
The goal of this paper is to investigate
cointegration between Bucharest Stock Exchange and three European Stock Markets: Germany, France and Poland, respectively. The choice of the European markets is based on the net assets investment of the Romanian mandatory private pension funds. On June 30, 2016, according to the Romanian Financial Supervisory Authority 91.28% of all investments in shares of private pension funds have been performed in Romanian shares, while the rest of 8.72% (0.44 billion lei) have been performed in shares issued by Germany (2.34%), France (2.23%), Poland (0.89%) and other countries. Having the intention of achieving maximizing returns by managing risk, and also to capture the co-movements in the above markets, we perform the cointegration analysis to examine portfolio diversification of the Romanian man-datory private pension funds. The empirical
Revista / Journal „ECONOMICA” nr.4 (98) 2016
104

INFORMATICĂ, STATISTICĂ ȘI CIBERNETICĂ ECONOMICĂ/INFORMATICS, STATISTICS AND ECONOMIC CIBERNETICS
nistrate privat din România. Analiza empirică se bazează pe prețurile de închidere ale indicilor bursieri ai piețelor din România (indicele BET), Germania (indicele DAX 30), Franța (indicele CAC 40) și Polonia (indicele WIG 20) pentru perioada 30 ianuarie 2006 – 27 septembrie 2016 (2713 observații zilnice).
Cuvinte-cheie: cointegrare, piețe bursiere
europene, testul de cointegrare Johansen, legătură internațională.
JEL: C58, F36, G11, G15. 1. Introducere Pentru asigurarea sustenabilității sistemu-
lui public de pensii (Pilonul I), sistem de tipul „pay-as-you-go”1, România a trecut printr-o serie de reforme, fapt concretizat prin introducerea a două scheme de pensii administrate privat (Pilonul II – fonduri de pensii administrate privat, cu participare obligatorie pentru persoanele sub 35 de ani și participare voluntară pentru per-soanele cu vârsta cuprinsă între 35 și 45 de ani, respectiv Pilonul III – fonduri de pensii facul-tative, în care participarea este voluntară.
Sistemul public de pensii din România este lezat de creșterea șomajului, pensionări anticipate, dar și de lipsa transparenței între nivelurile contribuțiilor și beneficiilor încasate la pensie. De asemenea, necesitatea existenței unei protecţii reale şi corecte a standardului de viaţă la pensionare a condus la introducerea sistemului de pensii private, sistem bazat pe acumularea con-tribuțiilor salariaților cu scopul asigurării unor pensii proprii suficient de mari.
În această lucrare, dorim să studiem miș-cările de pe patru piețe europene, respectiv: România, Germania, Franța și Polonia, din pers-pectiva investiției activelor nete ale fondurilor de pensii administrate privat din România. Conform Raportului Autorității de Supraveghere Finan-ciară „Evoluția piețelor financiare nebancare, în semestrul I 2016”2, la 30 iunie 2016 – 91,28%
analysis is based on daily closing prices of the BET Index, DAX 30 Index, CAC 40 Index and WIG 20 Index and covers the period from 30 January 2006 to 27 September 2016 (2713 obser-vations).
Key words: cointegration analysis, Euro-pean Stock Markets, Johansen cointegration test, international linkage.
JEL: C58, F36, G11, G15.
1. Introduction For ensuring the sustainability of public
pay-as-you-go1 pension system (Pillar I), Romania went through a series of reforms, which resulted in the implementation of two private pension schemes: Pillar II - with mandatory participation for people aged up to 35 years and voluntary participation for people aged between 35 and 45, and Pillar III – with voluntary participation.
The Romanian public pension system is harmed by rising unemployment, early retirement and lack of transparency in the levels of con-tributions and retirement benefits. Also, the need for real protection and fair standard of living after retirement led to the introduction of the private pension system, which is based on employee contributions and its goal is to provide a suffi-ciently high pension.
In this paper we want to study the co-move-ments in four European markets: Romania, Germany, France and Poland. We chose the stock market indices from the perspective of the net assets investment of the Romanian mandatory private pension funds. On June 30, 2016, accor-ding to “The evolution of non-banking financial markets in the first half of 2016”2 91,28% (4,56 billion lei) of all investments in shares of private pension funds have been performed in Romanian shares, while the rest of 8,72% (0.44 billion lei) have been performed in shares issued by Germany (2,34%), France (2,23%), Poland (0,89%) and
1 Sistem bazat pe solidaritatea dintre generații./System based on solidarity between generations. 2 http://asfromania.ro/publicatii/rapoarte-de-piata
Revista / Journal „ECONOMICA” nr.4 (98) 2016
105

INFORMATICĂ, STATISTICĂ ȘI CIBERNETICĂ ECONOMICĂ/INFORMATICS, STATISTICS AND ECONOMIC CIBERNETICS
(4,56 miliarde lei) din totalul investițiilor fondu-rilor de pensii administrate privat în acțiuni au fost efectuate în acțiuni românești, în timp ce restul de 8,72% (0,44 miliarde lei) au fost efec-tuate în acțiuni emise de Germania (2,34%), Franța (2,23%), Polonia (0,89%) și alte țări. Ast-fel, vom efectua analiza cointegrării pentru a examina diversificarea portofoliului de acțiuni al fondurilor de pensii administrate privat din România. Importanța prezentei analize este dată de relația invers proporțională existentă între cointegrarea piețelor bursiere și diversificarea portofoliului. În cele ce urmează, facem o scurtă trecere în revistă a studiilor recente: • Khan, T. A. (2011) cercetează convergența pe
termen lung între Statele Unite ale Americii și 22 de țări dezvoltate și în curs de dezvoltare, și a arătat că piețele bursiere, din cele mai multe țări, au devenit cointegrate începând cu anul 2010, precum și faptul că riscul relativ al unei țări este un bun predictor al performanței unei țări în recesiune.
• Masood, O., Bellalah, M., Chaudhary, S., Mansour, W. și Teulon, F. (2010) investi-ghează relația pe termen lung prin studierea cointegrării între bursele din țările baltice (Estonia, Letonia și Lituania), precum și relația de cauzalitate dintre acestea și observă că variabilele analizate sunt cointegrate.
• Assidenou, K. E. (2011) studiază cointegrarea pe piețele bursiere internaționale, prin inter-mediul indicilor din grupurile OCDE, Pacific și Asia, în timpul crizei financiare din Statele Unite ale Americii, septembrie 2008 – august 2009, și obține că piețele sunt cointegrate cel puțin printr-un vector de cointegrare.
• Stancu, I. & Radu, E. (2010) realizează o ana-liză comparativă privind portofoliile bazate pe acțiuni cu ajutorul analizei de cointegrare dintre indicele BET-FI (portofolii bazate pe acțiunile fondurilor de investiții) și indicele BET (portofolii bazate pe acțiunile din indicele BET). În cazul strategiei „long-short” concepută astfel, încât portofoliile să urmă-rească cei doi indici artificiali, analiza coin-
other countries. Thus, we perform the cointeg-ration analysis to examine shares portfolio diver-sification of the Romanian mandatory private pension funds. The importance of cointegration analysis is given by the inversely proportional relationship to portfolio diversification. In the following, we make a brief overview of the recent studies:
• Khan, T. A. (2011) examines the long-run convergence of the United States and 22 other developed and developing countries and showed that stock markets of most countries have become cointegrated by 2010 and also that the relative risk of a country is a good predictor of country performance in a recession.
• Masood, O., Bellalah, M., Chaudhary, S., Mansour, W. and Teulon, F. (2010) in-vestigate the long-run relationship between Baltic bench, Riga and Tallinn by studying the cointegration and causal relationship between the above stock exchanges of the Baltic Countries (Tallinn Stock Exchange of Estonia, Riga Stock Exchange of Latvia, and Vilnius Stock Exchange of Lithuania) and observe that the variables are coin-tegrated.
• Assidenou, K. E. (2011) studies cointeg-ration of international stock markets during the financial crisis in the United States of America, September 2008 – August 2009, and indicates that the indices of OECD group, Pacific group and Asia group have at least one cointegrating vector.
• Stancu, I. & Radu, E. (2010) make a com-parative analysis regarding the stocks-based portfolios with the help of coin-tegration between the BET-FI Index (investment funds stocks-based portfolios) and the BET Index (BET stocks-based portfolios). In case of the long-short stra-tegy designed for targeting two artificial indices, the cointegration analysis did not supply significant results, though the conclusion driven from the analysis was
Revista / Journal „ECONOMICA” nr.4 (98) 2016
106

INFORMATICĂ, STATISTICĂ ȘI CIBERNETICĂ ECONOMICĂ/INFORMATICS, STATISTICS AND ECONOMIC CIBERNETICS
tegrării nu a furnizat rezultate semnificative, iar concluzia trasată constă în eficiența investirii pe timpul crizei în același domeniu economic (sector de activitate).
• Pascal, C. E. & Armeanu, D. (2014) subli-niază importanța studierii cointegrării între țări prin analiza contagiunii la nivelul piețelor financiare, fapt ce a relevat că reprezintă o problemă mai degrabă globală decât locală.
De asemenea, fenomenul de contagiune a fost analizat și de către Anghelache, G.-V. & Negru Ciobanu, A. (2012) prin studierea corelării piețelor bursiere din Statele Unite ale Americii, România și Germania atât în condiții normale, cât și în condiții de criză financiară. Ele dovedesc că începând cu al Doilea Război Mondial și până în momentul realizării studiului, gradul de corelare a piețelor internaționale a crescut.
2. Prezentare generală a indicilor euro-peni
Scopul acestei secțiuni este de a între-prinde o trecere în revistă a indicilor analizați. Indicii bursieri reprezintă un indicator statistic, care reflectă evoluția în timp a piețelor de capital. Introducerea lor derivă din necesitatea monito-rizării evoluției pieței ca întreg i.e. evoluția pieței în funcție de timp. Astfel, o creștere a valorii indicelui bursier indică o activitate pozitivă a companiilor listate la bursă.
Indicele BET (Bucharest Exchange Tra-ding Index) este un indice de preț ponderat cu capitalizarea free float-ului și a fost lansat, pe data de 22 septembrie 1997, cu o valoare inițială de 1000 de puncte. Ponderea maximă a unui simbol este de 20%. Indicele este compus din cele mai lichide zece companii listate pe piața reglementată a Bursei de Valori București, fără a lua în considerare societățile de investiții financiare.
Indicele DAX 30 (Deutscher Aktien Index) este un indice bursier „blue chip” și a fost lansat pe 1 iulie 1988 cu o valoare inițială de 1000 de puncte. Acesta este format din cele mai mari și mai lichide treizeci de companii listate la Bursa din Frankfurt și este „un indicator bine stabilit pentru performanța economiei germane în ansamblul său. În plus, indicele este frecvent
that during financial crisis is better to invest in the same economic field.
• Pascal, C. E. & Armeanu, D. (2014) ana-lyze the contagion on financial markets and point out that this is not a local issue but rather a global one, fact that highlights the importance of studying the cointeg-ration between countries. The phenomenon of contagion was also
analysed by Anghelache, G.-V. & Negru Ciobanu, A. (2012), studying the correlation of the stock exchange markets from USA, Romania and Germany, both in normal and financial crisis conditions. They prove that from Second World War so far the degree of correlation of inter-national markets has grown.
2. Overview of the European Indices The aim of this section is to give a brief
overview of the analysed indices. Stock market indices represent a statistical indicator reflecting the time evolution of securities markets. Their introduction derived from the need to monitor the market evolution upon the whole i.e. market changes relative to time. Thus, an increase of the stock index indicates a positive activity of the listed companies.
The BET Index (Bucharest Exchange Tra-ding Index) is a capitalization-weighted price index and it was launched on September 22, 1997 with a starting value of 1000 points. The maxi-mum weight of a symbol is 20%. The index is comprised of the ten most liquid companies listed on Bucharest Stock Exchange regulated market, not taking into account the financial investment companies.
The DAX 30 Index (Deutscher Aktien Index) is a blue chip stock market index and it was launched on July 01, 1988 with a starting value of 1000 points. It is comprised of the thirty major and liquid companies listed on the Frankfurt Stock Exchange and it is “an established indicator for the performance of the German economy as a whole. In addition, the index is frequently used as an underlying instrument for derivatives and structured products. The 30 stocks
Revista / Journal „ECONOMICA” nr.4 (98) 2016
107

INFORMATICĂ, STATISTICĂ ȘI CIBERNETICĂ ECONOMICĂ/INFORMATICS, STATISTICS AND ECONOMIC CIBERNETICS
folosit ca un instrument suport pentru produsele structurate și instrumentele financiare derivate. Cele 30 de acţiuni conținute în DAX reprezintă în jur de 80% din capitalizarea germană”1.
Indicele CAC 40 (Cotation Assistée en Continu) este indicele de referință pentru Bursa din Paris (Paris Bourse) și a fost lansat la 31 decembrie 1987 cu o valoare inițială de 1000 de puncte. Indexul este format din cele mai mari și mai lichide patruzeci de acțiuni listate la bursa franceză. „Indicele servește ca suport pentru produse structurate, fonduri, fonduri tranzacțio-nate pe bursă, opțiuni și contracte futures”2.
Indicele WIG 20 (Warszawski Indeks Gieł-dowy) este un indice modificat, ponderat cu capitalizarea și a fost lansat la 16 aprilie 1994, cu o valoare inițială de 1000 de puncte. Indexul este format din cele mai mari și mai lichide douăzeci de companii poloneze listate la Bursa din Varșovia.
3. Metodologie 3.1. Cointegrarea
În această secțiune, facem o scurtă trecere în revistă a conceptului de cointegrare. Econometria modernă se bazează pe conceptul de procese cointegrate introduse de Granger, C. W. J., în anii 1980. Rachev, S. T. et. al (2007) dau următoarea definiție a cointegrării: „două sau mai multe procese sunt cointegrate, dacă stau aproape unul de celălalt, chiar dacă acestea derivă ca procese individuale”3. În continuare, este prezentată definiția formală a cointegrării, după cum urmează:
contained in DAX represent around 80 per cent of the market capitalization listed in Germany”1.
The CAC 40 Index (Cotation Assistée en Continu) is the benchmark index for the Paris Bourse and it was launched on December 31, 1987 with a starting value of 1000 points. The index is comprised of the forty largest and most liquid stocks listed on the French stock market. “The index serves as an underlying for structured products, funds, exchange traded funds, options and futures”2.
The WIG 20 Index (Warszawski Indeks Giełdowy) is a modified capitalization-weighted index and it was launched on April 16, 1994 with a starting value of 1000 points. The index is comprised of the twenty largest and most liquid Polish companies listed on the Warsaw Stock Exchange.
3. Methodology 3.1. Cointegration In this section we make a brief rundown of
the cointegration concept. Modern econometrics is based on the concept of cointegrated processes introduced by Granger, C.W.J. in the 1980s. Rachev, S.T. et. al (2007) give the following defi-nition of cointegration: “two or more processes are said to be cointegrated if they stay close to each other even if they ‘drift about’ as individual processes”2. Next, we give the formal definition of cointegration as follows:
δt = �βixi,t
n
i=1
unde: n – numărul seriilor de timp; t – timpul; xi,t – serii de timp nestaționare și integrate
de același ordin d (i.e. I(d));
where: n – the number of time series; t – time; xi,t – non-stationary time series and integ-
rated of the same order d (i.e. I(d));
1 http://www.dax-indices.com/EN/MediaLibrary/Document/dax_index_world.pdf. 2 https://www.euronext.com/en/products/indices/FR0003500008-XPAR/market-information. 3 Pp. 373.
Revista / Journal „ECONOMICA” nr.4 (98) 2016
108

INFORMATICĂ, STATISTICĂ ȘI CIBERNETICĂ ECONOMICĂ/INFORMATICS, STATISTICS AND ECONOMIC CIBERNETICS
δt – combinația liniară a seriilor de timp xi,t, integrată de ordinul e, cu e < d.
Astfel, spunem că seriile sunt cointegrate, în cazul în care există o combinație liniară precum cea de mai sus, iar δt reprezintă o relație de cointegrare.
Cointegrarea implică faptul că seriile de timp se află într-o relație de echilibru pe termen lung („long-run relationship”), chiar dacă acestea nu sunt staționare, ceea ce potrivit lui Balios, D. & Xanthakis, M. (2003) „contrazice ipoteza eficienței piețelor transfrontaliere. În cazul în care prețurile sunt cointegrate, acest lucru implică ineficiența pieței, din moment ce un preț poate fi utilizat pentru a prognoza cealaltă valoare”1. Existența a cel puțin unui vector de cointegrare determină evoluții asemănătoare ale seriilor de timp analizate, ceea ce, în cazul analizei de portofoliu, înseamnă că diversificarea nu este obținută.
3.2. Testul de cointegrare Johansen Procedura Johansen, bazată pe metoda
verosimilității maxime, testează existența vecto-rilor de cointegrare (relațiile de echilibru) între seriile de timp nestaționare care sunt integrate de același ordin.
Johansen (1988) a dezvoltat două tipuri de teste statistice, respectiv: testul-urmă (Trace test) și testul valorii proprii maxime (Maximum Eigenvalue test). Statistica urmă (𝜆𝑡𝑟𝑎𝑐𝑒) constă în testarea ipotezei nule H0: Nu există nicio relație de cointegrare (i.e. 𝑟 = 0) versus ipoteza alternativă de prezență a cointegrării, respectiv Halt: 𝑟 > 0. Pe de altă parte, statistica valorii proprii maxime (𝐾𝑚𝑎𝑥) testează ipoteza nulă de existență a fix 𝑟 vectori de cointegrare contra ipotezei alternative de existență a 𝑟 + 1 vectori.
Ipoteza nulă este respinsă în oricare dintre cele două teste statistice dezvoltate de Johansen, în cazul în care probabilitatea asociată acestora are o valoare mai mică de 5%, caz în care avem
δt – the linear combination of the series xi,t and integrated of order e, with e < d.
Thus, if there exists a linear combination like the one above the series are said to be cointegrated and the δt represents a cointegrating relationship.
Cointegration implies that time series are linked in the long-run relationship even if they are not stationary, fact that according to Balios, D. & Xanthakis, M. (2003) “contradicts the cross border market efficiency hypothesis. If prices are cointegrated, this implies market inefficiency since one price can be used to forecast the other value”1. If at least one cointegrating vector is found, then the analyzed time series will not drift apart in the long-term, meaning that in case of portfolio analysis the diversification is not achieved.
3.2. Johansen Cointegration Test The Johansen procedure under the maxi-
mum likelihood method tests the existence of cointegrating vectors (the equilibrium relation-ships) between the non-stationary time series that are integrated of the same order.
Johansen (1988) developed two test sta-tistics: the Trace test and the Maximum Eigen-value test. The first one (𝜆𝑡𝑟𝑎𝑐𝑒 statistic) tests the null hypothesis H0: None (i.e. 𝑟 = 0, meaning that there is no cointegration) against the alternative hypothesis Halt: 𝑟 > 0 (cointegration). On the other hand, the Maximum Eigenvalue statistic (𝐾𝑚𝑎𝑥 statistic) tests the null hypothesis H0: “There are 𝑟 cointegrating vectors.” against the alternative Halt: “There are 𝑟 + 1 cointegrating vectors.”
The null hypothesis is rejected in any of the two tests developed by Johansen if the p-value is less than 5%, case in which we are dealing with long-run relationship between the time series.
4. Data and Empirical Analysis The sample data is retrieved from Bloom-
berg database and consists of 2713 daily closing
1 Pp. 108.
Revista / Journal „ECONOMICA” nr.4 (98) 2016
109

INFORMATICĂ, STATISTICĂ ȘI CIBERNETICĂ ECONOMICĂ/INFORMATICS, STATISTICS AND ECONOMIC CIBERNETICS
de-a face cu o relație de echilibru pe termen lung între seriile de timp.
4. Datele utilizate și rezultatele empirice Datele utilizate sunt preluate din platforma
Bloomberg și constau în 2713 observații zilnice (reprezentând prețul de închidere) aferent perioadei 30 ianuarie 2006 – 27 septembrie 2016 pentru studierea mișcărilor pe patru piețe europene: România, Germania, Franța și Polonia. Indicii bursieri au fost aleși pe baza investițiilor activelor nete ale fondurilor de pensii admi-nistrate privat din România, iar anul de debut al analizei a fost ales 2006, întrucât dorim să urmărim perioada recentă, dar, de asemenea, să acoperim o perioadă suficient de mare pentru a putea fi considerată „long-run”.
Folosim seria logaritmică a prețurilor zil-nice de închidere aferente celor patru indici (moneda euro) pentru a capta mișcările pe piețele analizate. Prețurile de închidere în moneda euro sunt preluate automat din platforma Bloomberg. Pentru acele zile când nu există cotații din cauza diferenței zilelor de netranzacționare din fiecare țară, am luat în considerare prețul de închidere al zilei precedente pentru a furniza date consistente.
4.1. Testul Augmented Dickey-Fuller Pentru efectuarea analizei de cointegrare,
primul pas constă în investigarea nestaționarității celor patru serii de timp și integrarea lor de același ordin (adică staționaritatea în diferențe). Astfel, testăm prezența rădăcinii unitate în fiecare serie de timp analizată prin aplicarea testului Augmented Dickey-Fuller pentru a asigura nesta-ționaritatea în nivel și staționaritatea în prima diferență.
Având în vedere acestea, rezultatele testu-lui Augmented Dickey-Fuller sunt prezentate în tabelul 1, respectiv tabelul 2. Primul tabel con-firmă prezența rădăcinii unitare, la toate nive-lurile de încredere convenționale (1%, 5% și 10%), în timp ce al doilea tabel evidențiază sta-ționaritatea în prima diferență (rentabilitățile), la toate nivelurile de încredere convenționale:
prices over the period of 30th January 2006 to 27th September 2016 for studying the co-movements in four European markets: Romania, Germany, France and Poland. We chose stock market indi-ces from the perspective of net assets investment of the Romanian mandatory private pension funds, and the starting year of the analysis as 2006 because we want to track the recent period, but also to have a sufficient period to be considered long-run.
We use the logarithmic series of the daily closing prices of the indices (EURO currency) to capture the co-movements in the analysed mar-kets. The EURO closing prices are automatically retrieved from Bloomberg platform. For those days when there is no quotation because of the different non-trading days in each country, we considered the closing price of the previous day to provide consistent data between the four indices.
4.1. The Augmented Dickey-Fuller Test For performing the cointegration analysis,
first we have to investigate the non-stationarity of those four time series and their integration of the same order (i.e. the stationarity in the diffe-rences). Thus, we will test the time series indivi-dually for unit roots by applying the Augmented Dickey-Fuller Test to ensure non-stationarity in the levels of the data and stationarity in the first difference.
Taking these into account, the findings of the Augmented Dickey-Fuller Test are summa-rized in table 1 and table 2. The first table con-firms the presence of the unit roots at all con-ventional confidence levels (1%, 5% and 10%), while the second table points out the stationarity in the first difference (returns) at all conventional confidence levels:
Revista / Journal „ECONOMICA” nr.4 (98) 2016
110

INFORMATICĂ, STATISTICĂ ȘI CIBERNETICĂ ECONOMICĂ/INFORMATICS, STATISTICS AND ECONOMIC CIBERNETICS
Tabelul 1/Table 1 Rezultatele complete ale testului Augmented Dickey-Fuller, aplicat în nivel,
realizat cu ajutorul software-ului econometric EViews 9 / EViews 9 full results of the Augmented Dickey-Fuller Test in levels
Indice/ Index
Indicatori/ Indicators
Testul ADF/ ADF - Unit root test in levels Intercept Trend & Intercept None
BET t-Statistic (Prob.) -1.046464 (0.7385)
-1.353756 (0.8739)
0.318363 (0.7775)
t-critical 1% -3.432570 -3.961428 -2.565815 5% -2.862407 -3.411465 -1.940941 10% -2.567276 -3.127589 -1.616621
CAC 40 t-Statistic (Prob.)
-2.000425 (0.2868)
-2.146575 (0.5189)
0.092303 (0.7119)
t-critical 1% -3.432569 -3.961427 -2.565815 5% -2.862406 -3.411464 -1.940941 10% -2.567276 -3.127589 -1.616621
DAX 30 t-Statistic (Prob.)
-1.689890 (0.4363)
-2.251994 (0.4598)
-0.854370 (0.3459)
t-critical 1% -3.432569 -3.961427 -2.565815 5% -2.862406 -3.411464 -1.940941 10% -2.567276 -3.127589 -1.616621
WIG 20 t-Statistic (Prob.) -2.237924 ( 0.1929)
-2.625050 (0.2690)
0.541652 (0.8330)
t-critical 1% -3.432570 -3.961428 -2.565815 5% -2.862407 -3.411465 -1.940941 10% -2.567276 -3.127589 -1.616621
Sursa: Calculele autorilor/ Source: Authors’ calculations
Tabelul 2/Table 2 Rezultatele complete ale testului Augmented Dickey-Fuller, aplicat în prima diferență, realizat cu ajutorul software-ului econometric EViews 9 / EViews 9 full results of the
Augmented Dickey-Fuller Test in the first difference
Indice/Index Indicatori/ Indicators
Testul ADF/ ADF - Unit root test in levels Intercept Trend & Intercept None
BET t-Statistic (Prob.) -49.13433
(0.0001) -49.14274 (0.0000)
-49.14076 (0.0001)
t-critical 1% -3.432570 -3.961428 -2.565815 5% -2.862407 -3.411465 -1.940941 10% -2.567276 -3.127589 -1.616621
CAC 40 t-Statistic (Prob.) -54.10074 (0.0001)
-54.09605 (0.0000)
-54.11029 (0.0001)
t-critical 1% -3.432570 -3.961428 -2.565815 5% -2.862407 -3.411465 -1.940941 10% -2.567276 -3.127589 -1.616621
DAX 30 t-Statistic (Prob.) -51.79548 ( 0.0001)
-51.78708 (0.0000)
-51.79271 (0.0001)
Revista / Journal „ECONOMICA” nr.4 (98) 2016
111

INFORMATICĂ, STATISTICĂ ȘI CIBERNETICĂ ECONOMICĂ/INFORMATICS, STATISTICS AND ECONOMIC CIBERNETICS
Indice/Index Indicatori/ Indicators
Testul ADF/ ADF - Unit root test in levels Intercept Trend & Intercept None
t-critical 1% -3.432570 -3.961428 -2.565815 5% -2.862407 -3.411465 -1.940941 10% -2.567276 -3.127589 -1.616621
WIG 20 t-Statistic (Prob.) -48.78278 (0.0001)
-48.77501 (0.0000)
-48.78417 (0.0001)
t-critical 1% -3.432570 -3.961428 -2.565815 5% -2.862407 -3.411465 -1.940941 10% -2.567276 -3.127589 -1.616621
Sursa: Calculele autorilor/ Source: Authors’ calculations
Până în momentul de față, am verificat că toate cele patru serii de timp sunt integrate de ordinul unu, astfel, cerința testului de cointegrare Johansen este îndeplinită și putem trece la efectuarea analizei de cointegrare propriu-zise.
4.2. Statistici descriptive ale seriilor de randamente
Tabelul 3 prezintă caracteristicile empirice ale randamentelor indicilor bursieri analizați, precum urmează:
Thus far, we have checked that all the four time series are integrated of order one, so the requirement of the Johansen Cointegration Test is fulfilled and we can now proceed to the coin-tegration analysis.
4.2. Summary Statistics of Returns Table 3 gives a general view of the stock
indices returns, as follows:
Tabelul 3/ Table 3
Statistici descriptive ale randamentelor/ Descriptive statistics of returns
BET CAC40 DAX30 WIG20 Medie -0.000131 -3.97E-05 0.000225 -0.000240 Maxim 0.113549 0.105946 0.107975 0.109293 Minim -0.144473 -0.094715 -0.074335 -0.109954 Deviație standard 0.017078 0.015053 0.014493 0.018449 Skewness -0.581380 -0.022714 -0.025002 -0.290963
Kurtosis 11.46302 8.653182 8.557159 6.790371 Jarque-Bera (p-value)
8246.139 (0.000000)
3611.540 (0.000000)
3489.950 (0.000000)
1661.727 (0.000000)
Sursa: Calculele autorilor/ Source: Authors’ calculations Astfel, tabelul 3 subliniază faptul că toate
piețele, exceptând-o pe cea germană (0.000225), au randamente medii zilnice negative, ceea ce se reflectă în valorile negative ale mediilor. Pe de altă parte, cea mai mică valoare a randamentului este înregistrată de către indicele WIG 20, având o valoare de –0.000240.
În ceea ce privește volatilitatea pieței, având în vedere valorile deviației-standard, indicele WIG
Thus, table 3 points out that all markets but Germany’s (0.000225) have negative average daily returns, which is reflected in negative means. On the other hand, the WIG 20 Index recorded the lowest average return with a value of -0.000240.
In terms of market volatility, given the standard deviation values, the WIG 20 Index arise as being the most volatile index (0.018449),
Revista / Journal „ECONOMICA” nr.4 (98) 2016
112

INFORMATICĂ, STATISTICĂ ȘI CIBERNETICĂ ECONOMICĂ/INFORMATICS, STATISTICS AND ECONOMIC CIBERNETICS
20 se prezintă ca fiind cel mai volatil (0.018449), în timp ce cea mai mică volatilitate este atinsă de indicele DAX 30 (0.014493). Acest lucru poate fi explicat prin stabilitatea, respectiv instabilitatea politică și economică a țărilor.
În plus, testul Jarque-Bera indică faptul că cele patru serii analizate nu sunt distribuite normal, ținând cont de valorile ridicate ale statisticii prezentate în tabelul 3 (8246.14, 3611.54, 3489.95, respectiv 1661.73), cu probabilitățile asociate având valoarea zero. De asemenea, statisticile descriptive prezentate în Tabelul 3 denotă asimetrie negativă și distribuție leptokurtică pentru toate seriile de timp analizate (i.e. Skewness <0 și Kurtosis> 3).
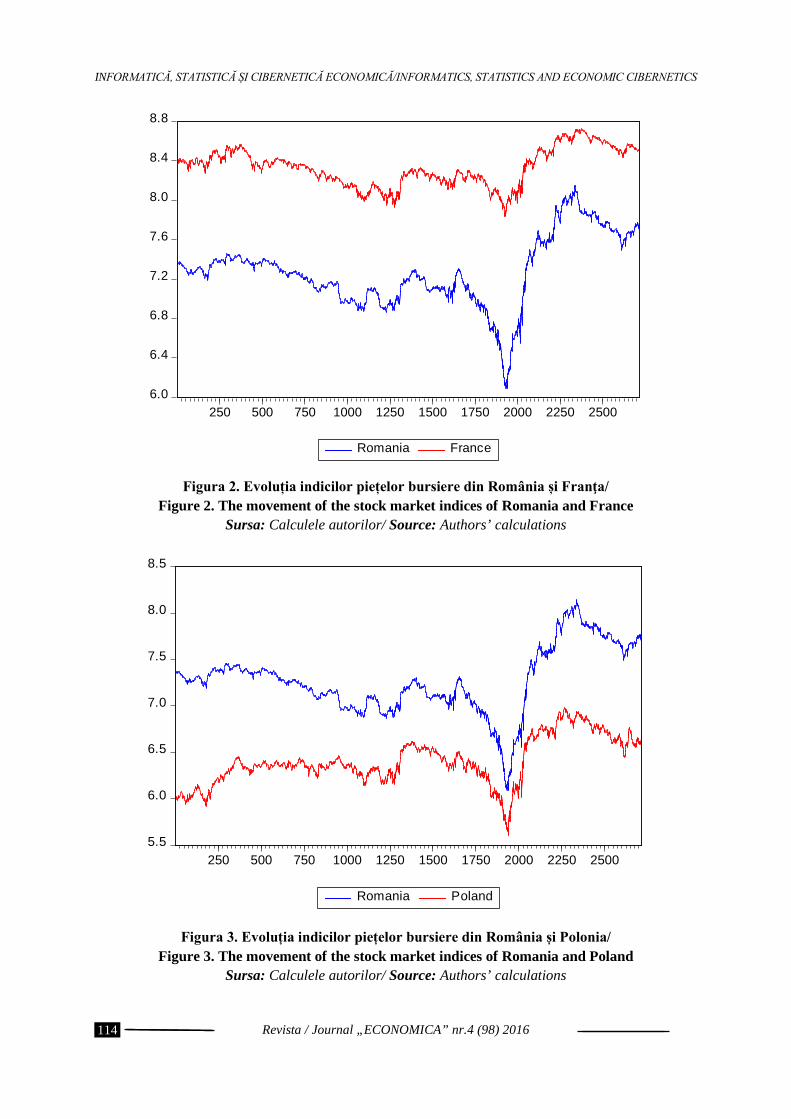
4.3. Testul de cointegrare Johansen Investigăm evoluția indicelui BET în
raport cu indicii DAX 30, CAC 40 și WIG 20, prin reprezentarea grafică a prețurilor de închi-dere (forma logaritmică) a celor trei serii de timp cu cea aferentă României. Rotundu, I. L. & Pricop, O. C. (2010) au subliniat impactul crizei din SUA, din anul 2008, ca fiind unul asupra ordinii economice globale; acest lucru poate fi remarcat în figurile 1-3, când toți indicii urmează un trend descendent, fapt datorat acestei crize:
while the lowest volatility is reached by the DAX 30 Index (0.014493). This can be explained by the politically and economically stable/instable countries. Furthermore, the Jarque-Bera Test indicates that the four analysed series are not normally distributed considering the high values of the aforementioned test presented in table 3 (8246.14, 3611.54, 3489.95 and 1661.73, res-pectively) with zero p-values. Likewise, the descriptive statistics reported in Table 3 show negative asymmetry and leptokurtic distribution for all the analysed time series (i.e. 𝑆𝑘𝑒𝑤𝑛𝑒𝑠𝑠 < 0 and𝐾𝑢𝑟𝑡𝑜𝑠𝑖𝑠 > 3).
4.3. Johansen Cointegration Test We investigate the movement of the BET
Index in relation to the DAX 30 Index, CAC 40 Index and WIG20 Index, by plotting the loga-rithmic closing prices of the three time series with that of Romania. Rotundu, I. L. & Pricop, O. C. (2010) pointed out that the US crisis in 2008 had an impact on the global economic order; this can be seen in figures 1-3 when all indices follow a downtrend as a consequence of the crisis:
6.0
6.5
7.0
7.5
8.0
8.5
9.0
9.5
250 500 750 1000 1250 1500 1750 2000 2250 2500
Romania Germany Figura 1. Evoluția indicilor piețelor bursiere din România și Germania/
Figure 1. The movement of the stock market indices of Romania and Germany Sursa: Calculele autorilor/ Source: Authors’ calculations
Revista / Journal „ECONOMICA” nr.4 (98) 2016
113
INFORMATICĂ, STATISTICĂ ȘI CIBERNETICĂ ECONOMICĂ/INFORMATICS, STATISTICS AND ECONOMIC CIBERNETICS
Figura 2. Evoluția indicilor piețelor bursiere din România și Franţa/ Figure 2. The movement of the stock market indices of Romania and France
Sursa: Calculele autorilor/ Source: Authors’ calculations
Figura 3. Evoluția indicilor piețelor bursiere din România și Polonia/ Figure 3. The movement of the stock market indices of Romania and Poland
Sursa: Calculele autorilor/ Source: Authors’ calculations
6.0
6.4
6.8
7.2
7.6
8.0
8.4
8.8
250 500 750 1000 1250 1500 1750 2000 2250 2500
Romania France
5.5
6.0
6.5
7.0
7.5
8.0
8.5
250 500 750 1000 1250 1500 1750 2000 2250 2500
Romania Poland
Revista / Journal „ECONOMICA” nr.4 (98) 2016
114
INFORMATICĂ, STATISTICĂ ȘI CIBERNETICĂ ECONOMICĂ/INFORMATICS, STATISTICS AND ECONOMIC CIBERNETICS
În cele ce urmează, putem continua cu testul Johansen, pentru a investiga cointegrarea pe piețele bursiere din România, Germania, Franța și Polonia, din moment ce am testat, în cadrul Secțiunii 4.2, ipotezele care stau la baza acestui test, respectiv faptul că toate cele patru variabile nu sunt staționare, dar randamentele afe-rente acestora (prima diferență) sunt staționare.
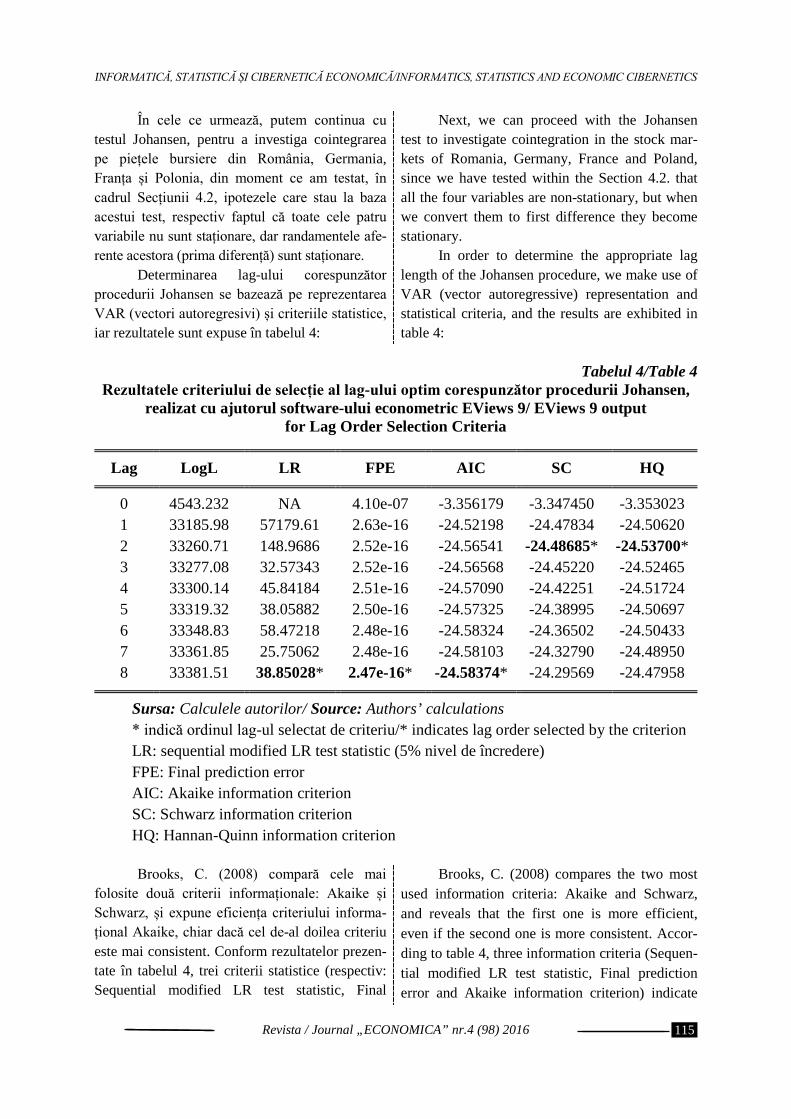
Determinarea lag-ului corespunzător procedurii Johansen se bazează pe reprezentarea VAR (vectori autoregresivi) și criteriile statistice, iar rezultatele sunt expuse în tabelul 4:
Next, we can proceed with the Johansen test to investigate cointegration in the stock mar-kets of Romania, Germany, France and Poland, since we have tested within the Section 4.2. that all the four variables are non-stationary, but when we convert them to first difference they become stationary.
In order to determine the appropriate lag length of the Johansen procedure, we make use of VAR (vector autoregressive) representation and statistical criteria, and the results are exhibited in table 4:
Tabelul 4/Table 4
Rezultatele criteriului de selecție al lag-ului optim corespunzător procedurii Johansen, realizat cu ajutorul software-ului econometric EViews 9/ EViews 9 output
for Lag Order Selection Criteria Lag LogL LR FPE AIC SC HQ 0 4543.232 NA 4.10e-07 -3.356179 -3.347450 -3.353023
1 33185.98 57179.61 2.63e-16 -24.52198 -24.47834 -24.50620 2 33260.71 148.9686 2.52e-16 -24.56541 -24.48685* -24.53700* 3 33277.08 32.57343 2.52e-16 -24.56568 -24.45220 -24.52465 4 33300.14 45.84184 2.51e-16 -24.57090 -24.42251 -24.51724 5 33319.32 38.05882 2.50e-16 -24.57325 -24.38995 -24.50697 6 33348.83 58.47218 2.48e-16 -24.58324 -24.36502 -24.50433 7 33361.85 25.75062 2.48e-16 -24.58103 -24.32790 -24.48950 8 33381.51 38.85028* 2.47e-16* -24.58374* -24.29569 -24.47958
Sursa: Calculele autorilor/ Source: Authors’ calculations
* indică ordinul lag-ul selectat de criteriu/* indicates lag order selected by the criterion LR: sequential modified LR test statistic (5% nivel de încredere) FPE: Final prediction error AIC: Akaike information criterion SC: Schwarz information criterion HQ: Hannan-Quinn information criterion
Brooks, C. (2008) compară cele mai
folosite două criterii informaționale: Akaike și Schwarz, și expune eficiența criteriului informa-țional Akaike, chiar dacă cel de-al doilea criteriu este mai consistent. Conform rezultatelor prezen-tate în tabelul 4, trei criterii statistice (respectiv: Sequential modified LR test statistic, Final
Brooks, C. (2008) compares the two most used information criteria: Akaike and Schwarz, and reveals that the first one is more efficient, even if the second one is more consistent. Accor-ding to table 4, three information criteria (Sequen-tial modified LR test statistic, Final prediction error and Akaike information criterion) indicate
Revista / Journal „ECONOMICA” nr.4 (98) 2016
115

INFORMATICĂ, STATISTICĂ ȘI CIBERNETICĂ ECONOMICĂ/INFORMATICS, STATISTICS AND ECONOMIC CIBERNETICS
prediction error și Akaike information criterion) indică folosirea unui număr de 8 lag-uri, în timp ce Schwarz information criterion și Hannan-Quinn information criterion indică doar două lag-uri. Acest lucru nu este însă surprinzător, întrucât este cunoscut faptul că Schwarz information criterion furnizează un model cu mai puține lag-uri decât ar trebui. Pe baza celor prezentate mai sus, aplicăm testul de cointegrare Johansen, folosind 8 lag-uri, iar rezultatele obținute sunt expuse în tabelul 5 și tabelul 6:
that 8 lags should be used, while Schwarz infor-mation criterion and Hannan-Quinn information criterion indicate that we should select only 2 lags. This is not surprising as it is known that the Schwarz information criterion deliver the model with fewer lags than it should. Based on the facts presented above, we use 8 lags for the Johansen Cointegration Test and the results are shown in table 5 and table 6:
Tabelul 5 /Table 5 EViews 9 output pentru testul Trace/ EViews 9 output for the Trace Test
Hypothesized Trace 0.05
No. of CE(s) Eigenvalue Statistic Critical Value Prob.**
None 0.009011 37.23664 47.85613 0.3365
At most 1 0.003759 12.76094 29.79707 0.9022
At most 2 0.000944 2.576454 15.49471 0.9828
At most 3 7.91E-06 0.021379 3.841466 0.8837 Trace test indicates no cointegration at the 0.05 level
* denotes rejection of the hypothesis at the 0.05 level **MacKinnon-Haug-Michelis (1999) p-values
Sursa: Calculele autorilor/ Source: Authors’ calculations Tabelul 6/Table 6
EViews 9 output pentru testul Maximum Eigenvalue/ EViews 9 output for the Maximum Eigenvalue Test
Hypothesized Max-Eigen 0.05
No. of CE(s) Eigenvalue Statistic Critical Value Prob.**
None 0.009011 24.47570 27.58434 0.1190
At most 1 0.003759 10.18449 21.13162 0.7271
At most 2 0.000944 2.555075 14.26460 0.9718
At most 3 7.91E-06 0.021379 3.841466 0.8837
Max-eigenvalue test indicates no cointegration at the 0.05 level
* denotes rejection of the hypothesis at the 0.05 level **MacKinnon-Haug-Michelis (1999) p-values Sursa: Calculele autorilor/ Source: Authors’ calculations
Revista / Journal „ECONOMICA” nr.4 (98) 2016
116

INFORMATICĂ, STATISTICĂ ȘI CIBERNETICĂ ECONOMICĂ/INFORMATICS, STATISTICS AND ECONOMIC CIBERNETICS
Statistica Trace (testul urmă), prezentată în Tabelul 5, testează ipoteza nulă H0: None (r = 0) conform căreia nu există nicio relație de cointe-grare împotriva următoarei ipoteze alternative Halt: 𝑟 > 0 (cointegrare).
În cazul statisticii Maximum Eigenvalue (testul valorii proprii maxime), se testează ipo-teza nulă de existență a exact 𝑟 vectori de coin-tegrare, împotriva ipotezei alternative de exis-tență a 𝑟 + 1 vectori de cointegrare. Ipoteza nulă nu poate fi respinsă în niciunul dintre cele două teste dezvoltate de Johansen, deoarece valorile p-value corespunzătoare acestora sunt mai mari de 5% (𝑝 − 𝑣𝑎𝑙𝑢𝑒 = 0.3365 pentru testul Trace Test, respectiv 0.1190 pentru testul Maximum Eigenvalue).
Prin urmare, cele două teste statistice ale procedurii Johansen nu pot respinge ipoteza nulă și arată faptul că niciun vector de cointegrare nu este găsit. Acest lucru conduce la diversi-ficarea portofoliului de acțiuni ale fondurilor de pensii administrate privat din România pe piețele în cauză.
5. Concluzii Analiza empirică se bazează pe prețurile de
închidere zilnice ale indicilor BET, DAX30, CAC 40 și WIG 20, extrase din baza de date Bloomberg și constă în 2713 observații aferente perioadei 30 ianuarie 2006 – 27 septembrie 2016 pentru studierea mişcărilor pe patru piețe euro-pene: România, Germania, Franța și Polonia. Alegerea indicilor bursieri a fost realizată din perspectiva investițiilor activelor nete ale fondu-rilor de pensii administrate privat din România, iar anul de debut al analizei a fost ales 2006, întrucât dorim să urmărim perioada recentă, dar, de asemenea, să acoperim o perioadă suficient de mare pentru a putea fi considerată „long-run”. Rezultatele testului Augmented Dickey-Fuller indică faptul că toate seriile de timp analizate sunt integrate de ordinul 1, permițându-ne să con-tinuăm analiza cointegrării folosind metoda Johansen. Alegerea lag-ului corespunzător proce-durii Johansen, respectiv 8 lag-uri, a avut la bază folosirea reprezentării VAR, precum și criteriul informațional Akaike. Prin urmare, rezultatele
Trace Statistic, shown in Table 5, tests the null hypothesis H0: None (i.e. 𝑟 = 0, meaning that there is no cointegration) against the following alternative hypothesis Halt: 𝑟 > 0 (cointegration). In case of the Maximum Eigenvalue Statistic, it is tested the null hypothesis H0: “There are 𝑟 coin-tegrating vectors.” against the alternative hypo-thesis Halt: “There are 𝑟 + 1 cointegrating vec-tors.” The null hypothesis can’t be rejected in any of the two tests developed by Johansen since the p-value is greater than 5% (p-value is 0.3365 for the Trace Test and 0.1190 for the Maximum Eigenvalue Test).
Therefore, the two tests statistics under the Johansen procedure can’t reject the null hypo-thesis and show that no cointegrating vector is found. This means that the Romanian mandatory private pension funds can diversify the stock portfolio amongst the markets in question.
5. Conclusions The empirical analysis is based on daily
closing prices of BET Index, DAX 30 Index, CAC 40 Index and WIG 20 Index retrieved from Bloomberg database and consists of 2713 obser-vations over the period of 30th January 2006 to 27th September 2016 for studying the co-move-ments in four European markets: Romania, Germany, France and Poland. We chose stock market indices from the perspective of net assets investment of the Romanian mandatory private pension funds, and the starting year of the analysis as 2006 because we wanted to track the recent period, but also having a sufficient period to be considered long-run. The results of the Aug-mented Dickey Fuller Test indicate that all the analysed time series are integrated of order 1 allowing us to proceed with the cointegration analysis using the Johansen method. The appro-priate lag length of the Johansen procedure, 8 lags respectively, was based on VARs and Akaike information criterion. Therefore, the results of the two tests statistics under the Johansen procedure (Trace Test and Maximum Eigenvalue Test)
Revista / Journal „ECONOMICA” nr.4 (98) 2016
117

INFORMATICĂ, STATISTICĂ ȘI CIBERNETICĂ ECONOMICĂ/INFORMATICS, STATISTICS AND ECONOMIC CIBERNETICS
celor două teste statistice în conformitate cu procedura Johansen (testul urmă și testul valorii proprii maxime) au arătat că ipoteza nulă nu poate fi respinsă, ceea ce înseamnă că nu există niciun vector de cointegrare. Rezultatele obținute indică posibilitatea diversificării portofoliului de acțiuni ale fondurilor de pensii administrate privat din România, pe piețele în cauză. Astfel, piețele bur-siere analizate nu au o relație pe termen lung. Totodată, rezultatele obținute de noi le contrazic pe cele prezentate în lucrarea Ruxanda, G. & Stoe-nescu, S. (2009), care utilizează procedura Engle Granger, dar sunt în concordanță cu rezultatele Khan, T. A. (2011) care, utilizând procedura Johansen, nu a găsit prezența cointegrării.
revealed that the null hypothesis can’t be rejected which means that no cointegrating vector is found. Our findings imply that the Romanian mandatory private pension funds can diversify the stock portfolio amongst the markets in question. Thus, the analyzed stock markets don’t have a long-run relationship. My results contradict the findings of Ruxanda, G. & Stoenescu, S. (2009) who use the Engle Granger procedure, but are consistent with the findings of Khan, T. A. (2011) who didn’t find cointegration when using Johansen procedure.
Bibliografie/Bibliography:
1. ANGHELACHE, G.-V. & NEGRU CIOBANU, A. (2012). “Corelarea unor indici bursieri în condiții normale și în cele de criză financiară”, Economie Teoretică și Aplicată, Vol. XIX, Nr. 11(576), pp. 76-85.
2. ASSIDENOU, K. E. (2011). “Cointegration of Major Stock Market Indices during the 2008 Global Financial Distress”, International Journal of Economics and Finance, Vol. 3, Nr. 2, pp. 212-222.
3. BALIOS, D. & XANTHAKIS, M. (2003). “International interdependence and dynamic linkages between developed stock markets”, South Eastern Europe Journal of Economics, Vol. 1, pp. 105-130.
4. BROOKS, C. (2008). Introductory Econometrics for Finance: 2nd Edition. Cambridge: Cambridge University Press.
5. DICKEY, D. A., FULLER, W. F. (1979). “Distribution of the Estimators for Autoregressive Time Series with a Unit Root”, Journal of the American Statistical Association, Vol. 74, Issue 366, pp. 427-431.
6. ENGLE, R. F. & GRANGER, C. W. J. (1987). “Co-Integration and Error Correction: Representation, Estimation, and Testing”, Econometrica, Vol. 55, Nr. 2, pp. 251-276.
7. GRANGER, C.W.J. (1981). “Some properties of Time Series Data and Their Use in Econometric Model Specification”, Journal of Econometrics, Vol. 16, pp. 121-130.
8. JOHANSEN, S. (1988). “Statistical Analysis of Cointegrating Vectors”, Journal of Economic Dynamics and Control, Vol. 12, pp. 231-254.
9. JOHANSEN, S. (1991). “Estimation and Hypothesis Testing of Cointegrating Vectors in Gaussian Vector Autoregressive Models”, Econometrica, Vol. 59, pp. 1551-1580.
10. KHAN, T. A. (2011). “Cointegration of International Stock Markets: An Investigation of Diversification Opportunities”, Undergraduate Economic Review, Vol. 8, Issue 1, Article 7, Disponibil la: http://digitalcommons.iwu.edu/uer/vol8/iss1/7.
11. MASOOD, O., BELLALAH, M., CHAUDHARY, S., MANSOUR, W. and TEULON, F. (2010). “Cointegration of Baltic Stock Markets in the Financial Tsunami: Empirical Evidence”, International Journal of Business, Vol. 15, No. 1, pp. 120-132.
Revista / Journal „ECONOMICA” nr.4 (98) 2016
118

INFORMATICĂ, STATISTICĂ ȘI CIBERNETICĂ ECONOMICĂ/INFORMATICS, STATISTICS AND ECONOMIC CIBERNETICS
12. PASCAL, C. E. & ARMEANU, D. (2014). “Analiza efectului de contagiune la nivelul piețelor financiare”, Colecția de working papers ABC-ul Lumii Financiare, Nr. 2.
13. RACHEV, S. T., MITTNIK, S., FABOZZI, F. J., FOCARDI, S. M. and JASIC, T. (2007). Financial Econometrics: From Basics to Advanced Modeling Techniques. New Jersey: John Wiley & Sons, Inc., Hoboken.
14. ROTUNDU, I. L. & PRICOP, O. C. (2010). “Criza economică globală și reașezarea centrelor de putere”, Analele Universității “Constantin Brâncuși” din Târgu-Jiu, Seria Economie, Nr. 4, pp. 75-82.
15. RUXANDA, G. & STOENESCU, S. (2009). “Bivariate and Multivariate Cointegration and their Application in Stock Markets”, Economic Computation and Economic Cybernetics Studies and Research, Vol. 43, Nr. 4, pp. 17–31.
16. STANCU, I. & RADU, E. (2010). “Comparative Analysis of Investment Funds Stocks-based Portfolios and BET Stocks-based Portfolios”, Economie Teoretică și Aplicată, Vol. XVII, Nr. 4(545), pp. 35-46.
17. http://www.dax-indices.com/EN/MediaLibrary/Document/dax_index_world.pdf. 18. https://www.euronext.com/en/products/indices/FR0003500008-XPAR/market-information.
Revista / Journal „ECONOMICA” nr.4 (98) 2016
119
![HG 1425 modificata-completata[1]](https://static.fdocumente.com/doc/165x107/577d2a1a1a28ab4e1ea8aa3b/hg-1425-modificata-completata1.jpg)