articol 6
9
Assessment of traffic-related air pollution in the urban streets before and during the 2008 Beijing Olympic Games traffic control period Ting Wang, Shaodong Xie * College of Environmental Sciences and Engineering, State Key Joint Laboratory of Environmental Simulation and Pollution Control, Peking University, Beijing 100871, PR China article info Article history: Received 29 March 2009 Received in revised form 15 July 2009 Accepted 20 July 2009 Keywords: Air pollution Traffic pollution Street canyon OSPM 2008 Olympic Games abstract In order to investigate the air quality and the abatement of traffic-related pollution during the 2008 Olympic Games, we select 12 avenues in the urban area of Beijing to calculate the concentrations of PM 10 , CO, NO 2 and O 3 before and during the Olympic traffic controlling days, with the OSPM model. Through comparing the modeled results with the measurement results on a representative street, the OSPM model is validated as sufficient to predict the average concentrations of these pollutants at street level, and also reflects their daily variations well, i.e. CO presents the similar double peaks as the traffic flow, PM 10 concentration is influenced by other sources. Meanwhile, the model predicts O 3 to stay less during the daytime and ascend in the night, just opposite to NO 2 , which reveals the impact of photo- chemical reactions. In addition, the predicted concentrations on the windward side often exceed the leeward side, indicating the impact of the special street shape, as well as the wind. The comparison between the predicted street concentrations before and during the Olympic traffic control period shows that the overall on-road air quality was improved effectively, due to the 32.3% traffic flow reduction. The concentrations of PM 10 , CO and NO 2 have reduced from 142.6 mgm 3 , 3.02 mg m 3 and 118.7 mgm 3 to 102.0 mgm 3 , 2.43 mg m 3 and 104.1 mgm 3 . However, the different pollutants show diverse changes after the traffic control. PM 10 decreases most, and the reduction effect focusing on the first half-day even clears the morning peak, whereas CO and NO 2 have even reductions to minify the daily fluctuations on the whole. Opposite to the other pollutants, ozone shows an increase of concentration. The average reduction rate of PM 10 , CO, NO 2 and O 3 are respectively 28%, 19.3%, 12.3% and 25.2%. Furthermore, the streets in east, west, south and north areas present different air quality improvements, probably induced by the varied background pollution in different regions around Beijing, along with the impact of wind force. This finding suggests the pollution control in the surrounding regions, not only in the urban area. Ó 2009 Elsevier Ltd. All rights reserved. 1. Introduction The air quality of Beijing during the 29th Olympic Games attracts wide attention from the public. It is even the reason that Beijing has once been challenged for, as the concentrations of PM 10 and NO 2 in Beijing in 2004 were 146 mgm 3 and 70.2 mgm 3 respectively (Beijing EPA, 2004), both substantially exceeding the WHO air quality guideline limits (20 mgm 3 for PM 10 , for which the Iinterim target-1 is 70 mgm 3 , and 40 mgm 3 for NO 2 )(WHO, 2006); and the ozone concentration also increased rapidly through recent years (Fang et al., 2009), which caused concerns on the athletes’ health. The vehicle has become an important pollution source of Beijing (Cai and Xie, 2007), and also major reason of severe secondary pollution. In order to improve the air quality, Beijing government has applied comprehensive measures these years to control the vehicle pollution, i.e. adopting stricter emission standard, control- ling heavy-exhaust vehicles, and developing the public trans- portation. Furthermore, from July 1, 2008 to September 20, 2008, Beijing conducted phased reduction of its road-traveling automo- biles, primarily by restricting automobiles of government offices, public institutions, army and police, and enterprises in the Beijing municipal administrative regions, and conducting the strict Olympic traffic demand management (TDM) of odd-even day vehicle operation since July 20, 2008 (Wu and Zhang, 2008). Due to these TDM measures, the road-traveling automobiles reduced about 1.95 million a day during the Olympic Games (Mao, 2008). However, the improving effect on air quality remains to be proved. Westerdahl et al. (2008) measured the on-road and ambient pollutant concentrations during the four-day traffic control experiment conducted by the Beijing Government from * Corresponding author. Tel.: þ86 10 62755852/62751925; fax: þ86 10 62751927. E-mail address: [email protected] (S. Xie). Contents lists available at ScienceDirect Atmospheric Environment journal homepage: www.elsevier.com/locate/atmosenv 1352-2310/$ – see front matter Ó 2009 Elsevier Ltd. All rights reserved. doi:10.1016/j.atmosenv.2009.07.034 Atmospheric Environment 43 (2009) 5682–5690
-
Upload
ancuta-maria -
Category
Documents
-
view
213 -
download
0
Transcript of articol 6

lable at ScienceDirect
Atmospheric Environment 43 (2009) 5682–5690
Contents lists avai
Atmospheric Environment
journal homepage: www.elsevier .com/locate/a tmosenv
Assessment of traffic-related air pollution in the urban streets beforeand during the 2008 Beijing Olympic Games traffic control period
Ting Wang, Shaodong Xie*
College of Environmental Sciences and Engineering, State Key Joint Laboratory of Environmental Simulation and Pollution Control, Peking University, Beijing 100871, PR China
a r t i c l e i n f o
Article history:Received 29 March 2009Received in revised form15 July 2009Accepted 20 July 2009
Keywords:Air pollutionTraffic pollutionStreet canyonOSPM2008 Olympic Games
* Corresponding author. Tel.: þ86 10 62755852/627E-mail address: [email protected] (S. Xie).
1352-2310/$ – see front matter � 2009 Elsevier Ltd.doi:10.1016/j.atmosenv.2009.07.034
a b s t r a c t
In order to investigate the air quality and the abatement of traffic-related pollution during the 2008Olympic Games, we select 12 avenues in the urban area of Beijing to calculate the concentrations of PM10,CO, NO2 and O3 before and during the Olympic traffic controlling days, with the OSPM model.
Through comparing the modeled results with the measurement results on a representative street, theOSPM model is validated as sufficient to predict the average concentrations of these pollutants at streetlevel, and also reflects their daily variations well, i.e. CO presents the similar double peaks as the trafficflow, PM10 concentration is influenced by other sources. Meanwhile, the model predicts O3 to stay lessduring the daytime and ascend in the night, just opposite to NO2, which reveals the impact of photo-chemical reactions. In addition, the predicted concentrations on the windward side often exceed theleeward side, indicating the impact of the special street shape, as well as the wind.
The comparison between the predicted street concentrations before and during the Olympic trafficcontrol period shows that the overall on-road air quality was improved effectively, due to the 32.3%traffic flow reduction. The concentrations of PM10, CO and NO2 have reduced from 142.6 mg m�3,3.02 mg m�3 and 118.7 mg m�3 to 102.0 mg m�3, 2.43 mg m�3 and 104.1 mg m�3. However, the differentpollutants show diverse changes after the traffic control. PM10 decreases most, and the reduction effectfocusing on the first half-day even clears the morning peak, whereas CO and NO2 have even reductions tominify the daily fluctuations on the whole. Opposite to the other pollutants, ozone shows an increase ofconcentration. The average reduction rate of PM10, CO, NO2 and O3 are respectively 28%, 19.3%, 12.3% and�25.2%. Furthermore, the streets in east, west, south and north areas present different air qualityimprovements, probably induced by the varied background pollution in different regions around Beijing,along with the impact of wind force. This finding suggests the pollution control in the surroundingregions, not only in the urban area.
� 2009 Elsevier Ltd. All rights reserved.
1. Introduction
The air quality of Beijing during the 29th Olympic Games attractswide attention from the public. It is even the reason that Beijing hasonce been challenged for, as the concentrations of PM10 and NO2 inBeijing in 2004 were 146 mg m�3 and 70.2 mg m�3 respectively(Beijing EPA, 2004), both substantially exceeding the WHO airquality guideline limits (20 mg m�3 for PM10, for which the Iinterimtarget-1 is 70 mg m�3, and 40 mg m�3 for NO2) (WHO, 2006); and theozone concentration also increased rapidly through recent years(Fang et al., 2009), which caused concerns on the athletes’ health.
The vehicle has become an important pollution source of Beijing(Cai and Xie, 2007), and also major reason of severe secondary
51925; fax: þ86 10 62751927.
All rights reserved.
pollution. In order to improve the air quality, Beijing governmenthas applied comprehensive measures these years to control thevehicle pollution, i.e. adopting stricter emission standard, control-ling heavy-exhaust vehicles, and developing the public trans-portation. Furthermore, from July 1, 2008 to September 20, 2008,Beijing conducted phased reduction of its road-traveling automo-biles, primarily by restricting automobiles of government offices,public institutions, army and police, and enterprises in the Beijingmunicipal administrative regions, and conducting the strictOlympic traffic demand management (TDM) of odd-even dayvehicle operation since July 20, 2008 (Wu and Zhang, 2008).
Due to these TDM measures, the road-traveling automobilesreduced about 1.95 million a day during the Olympic Games (Mao,2008). However, the improving effect on air quality remains to beproved. Westerdahl et al. (2008) measured the on-road andambient pollutant concentrations during the four-day trafficcontrol experiment conducted by the Beijing Government from

Table 1The Chinese fleet composition types and applied emission factors (g km�1$vehicle).
Traffic fleet types PM10 NOX CO
Passenger Car 0.0153 1.3 12.5Light Truck 0.0537 2.8 19Coach 0.146 1.56 23.4Double-bin Coach 2.24 4.66 9Motorcycle 1.15 0.1 14.8Heavy Truck 4.67 3.36 4.65Articulated Truck 8.44 10.11 5.63Single-bin Bus 2.94 2.54 5Double-bin Bus 6.03 10.11 5.63Tractor 1.9 4 2
T. Wang, S. Xie / Atmospheric Environment 43 (2009) 5682–5690 5683
August 17 to 20, 2007, and found it effective in reducing extremeconcentrations. In this article we intend to reveal the traffic-relatedpollution during the Olympic Games, assess the air qualityimprovement for the first time by modeling, and also evaluate thereduction effect of these traffic management measures. Based onthis intention, we focus on the air quality inside urban streetcanyons, which are not only intensively polluted areas, but alsooverwhelmingly influenced by the traffic emission.
There are a few models applied to simulate the pollution inurban streets, i.e. STREET, CPBM, CAR (Mensink and Lewyckyj,2001; Vardoulakis et al., 2002a,b, 2003; Yamartino and Wiegand,1986; Harkonen et al., 1995, 1996). We choose the OperationalStreet Pollution Model (OSPM, by National Environmental ResearchInstitute, Denmark), as it is designed for simulating the dispersionof particulates and gases, mainly emit from vehicles, inside thestreet canyon, which can present us the micro-environment trafficpollution situation (Berkowicz, 2000). On the other hand, thismodel is simple but sufficient, even to estimate ozone concentra-tion, as it has been validated in many countries (Berkowicz et al.,2002; Karppinen et al., 2000; Gokhale et al., 2005; Vardoulakiset al., 2007; Ketzel et al., 2000; Ghenu et al., 2008; Bihan et al.,2002; Ziv et al., 2002; Kukkonen et al., 2003), including China (Heet al., 1999; Fu et al., 1999), and basically estimated the on-roadconcentrations fairly well.
In the following chapters we calculate the concentrations ofPM10, CO, NO2 and ozone before and during the Olympic trafficcontrol days. Then these simulation results, as well as the trafficflow data, are compared to find the air quality improvement andthe reduction effect of traffic control measures. In advance, wevalidate the accuracy of OSPM in forecasting the on-road pollutantconcentrations in Beijing by comparing with the measurementresults on a representative street.
2. Methods
2.1. OSPM model
The OSPM model, developed by Hertel (1989), Hertel and Ber-kowicz (1989), is a practical street pollution model based ona simplified description of flow and dispersion conditions in streetcanyons. Concentrations of on-road exhaust gases can be dividedinto two parts: the direct contribution from street traffic, computedby a plume model; and the recirculation part of pollutants,computed from a box model. The total receptor concentration sumsthem up and adds the background concentration, caused byemission sources other than automobiles. This simplified parame-terization in a street canyon has been deduced from extensiveanalysis of experimental data and model tests (Berkowicz et al.,1996, 1997). In addition, the model includes the basic chemicalreactions involving NO, NO2, O2 and O3 (Kukkonen et al., 2001).
2.2. Input data
2.2.1. Traffic and emissionOSPM calculates the vehicle source emission with traffic flow
data and emission factors computed by default COPERT model.However, the default traffic fleet share file and emission factorsbased on European vehicle and fuel lists may not be suitable forBeijing. As the new version of WinOSPM accepts the total emissionfile (*.TEM) provided by the user, we take this advantage, tocalculate the total emission on each selected street, based on theChinese traffic fleet composition of 10 vehicle types, and corre-sponding emission factors derived from researches done in China(Xie et al., 2005, 2006; Song and Xie, 2006; Wang et al., 2001;Fu et al., 1997, 2000; Wang and Ding, 2002; Li et al., 2003).
The Chinese fleet composition types and applied emission factorsare listed in Table 1.
The hourly traffic flow data (total number of vehicles, h�1) onselected streets before and during Olympics are provided byEnvironment Monitoring Centre, EPB Beijing. The traffic fleetcomposition of each street comes from on-spot survey and docu-mentation. Additionally, we include in the traffic file the long-shortvehicle ratio to furnish the traffic induced turbulence. The averagevelocities of long vehicles and short vehicles are respectively set25.0 km h�1 and 30.0 km h�1 during nighttime (22:00–next 06:00),15.0 km h�1 and 20 km h�1 in daytime (06:00–22:00). In this paperthe cold-start emission is not taken into account.
2.2.2. Meteorology and backgroundWind speed and wind direction are the most important
meteorological factors, which influence the whole dispersionmode and ambient turbulence. Temperature and total solarradiation are needed as input values for the chemical reaction(Hertel, 1989; Hertel and Berkowicz, 1989). Furthermore, themeteorology and background data file contains the hourlymeasured concentrations, for comparison, of PM10 (mg m�3) CO(mg m�3) and NO2 (mg m�3). As done in many researches (Chanand Yao, 2008; Guinot et al., 2006; Chan et al., 2005; Song et al.,2006), we apply the measurement values in Ding Ling Tomb,a national monitoring site in rural area, as background concen-trations. These hourly meteorology and measurement data is allfrom Beijing Meteorology Bureau and Environment MonitoringCentre, EPB Beijing. As ozone is not an officially monitoredspecies on national monitoring sites, the O3 backgroundconcentration comes from measurement in Beijing Iron Tower (aregional background monitoring site) by Atmospheric PhysicsInstitute, Chinese Academy of Sciences.
2.2.3. Streets geometryStreet configuration is also an important parameter for the
dispersion computation. We selected 12 avenues as the targets ofevaluation, from the 2nd, 3rd and 4th ring roads around Beijingurban area, covering East, West, South and North sides on each ringroad. These streets are all expressways and arterial roads, withsteady traffic flow and available measurement data. The maintraffic network of Beijing, including 2nd–6th ring roads, is shown inFig. 1 and the selected 12 avenues are coloured in white. The namesand orientations of these streets are presented in Table 2.
The street geometry data, including the average height of thebuildings, the width and the length of each street, are totallyfrom on-site measurement. The receptor height sets at 2 m. Theorientation of roads on East and West sides is regulated at 180�
north, and 90� for those on North and South sides, approximatelythe true state. The street configuration of Qianmen East Avenue,applied in the model validation, will be specified in the validationpart firstly.

Fig. 1. The main traffic network of Beijing, including 2nd–6th ring roads. The selected 12 avenues are in white. The city center, North Orient and the orientations of Tianjin andLangfang are also shown.
T. Wang, S. Xie / Atmospheric Environment 43 (2009) 5682–56905684
3. Results
3.1. OSPM model validation
We apply the intensive measurement results from Jul 1st to Jul31st, 2004, on Qianmen East Avenue, to validate the OSPM model.This avenue locates inside the 2nd Ring, nearly center of Beijing,including the pavements, cycle paths, green belts and eight vehiclelanes. It ranges from Qianmen (39�5400600N/116�2305700E) to Zhen-gyi road (39�5305800N/116�2400000E), with the length 529 m, width62.5 m and orientation 6.5� east by north. The average height of thebuildings on the south side is 23.4 m and 16.3 m on the north side.
3.1.1. Modeling the average concentrationsThe measured and modeled hourly averaged concentrations of
PM10, CO, NO2 at the street level, during the intensive measurementperiod are shown in Fig. 2a–c.
The model predicts NO2 concentration best, as Fig. 2c shows,and only a minor fraction of data points are located outside the‘‘factor of two’’ lines. Consequently the model predicts fairly wellthe secondary pollutants. Considering the PM10 and CO concen-trations (Fig. 2a–b), the scatter plots are almost symmetrical, thusthe model can also be evaluated as acceptable in predicting thesepollutants. However, there are still a few data points deviated fromthe ‘‘factor of two’’ area, especially the PM10 concentrations inFig. 2a. The reason might be the special street canyon shape ofBeijing. The ‘wide’ canyon causes the dispersion mode differentfrom the default mode in ‘even’ canyon, and results in the deviationbetween measurement and prediction.
Anyhow, the model estimates well the average concentrations,of both primary pollutants and secondary pollutants, at the street
Table 2The names and orientations of the selected twelve streets.
East West
2nd Ring Chaoyangmen Avenue Guanganmen Binhe Road3rd Ring East 3rd Ring South Road West 3rd Ring North Road4th Ring East 4th Ring Mid-Road West 4th Ring Mid-Road
level. The accuracy even exceeds the former validation research onthe same street (Fu et al., 1999), probably because we adoptedChinese emission factors and the total emission amount as theinput data.
3.1.2. Modeling the daily variationWhether the model reflects the daily variation of the air quality
in Beijing is also one of our concerns. Accordingly, we selected 4thJuly as a representative day to calculate the concentrations of PM10,
CO, NO2 on both sides of the street, hour by hour, using themeteorology parameters showed in Table 3. The measured andmodeled concentration values in time sequence are plotted inFig. 3a–c. In addition, we also computed the hourly ozoneconcentrations, shown in Fig. 3d.
From Fig. 3a we discover that the daily variations of the modeledand measured concentrations are almost the same for PM10, thoughthe modeled value reaches the peak at 6pm, earlier than themeasured. The predicted concentration of CO (Fig. 3b), especially onthe leeward side, also presents the similar variation as themeasured, including the peaks at 7am and 6pm. However, duringthe noontime (11am–2pm) the predicted concentration is muchhigher and creates another peak. The predicted NO2 concentrationis relatively higher than the measured (Fig. 3c), but it reflects thebasic trend of peaks at 7am, 3pm, 6pm and bottom value at 8pmwith tiny time differences, especially for the leeward side. Thus weconclude that the daily variation of predicted concentration fromOSPM model basically coincides with the measured concentration,with acceptable difference in concentration value and time.
Compared with the daily variation of the traffic flow in Fig. 3e,the daily variation of pollutants could be better interpreted. Themeasured CO concentration shows the closest trend to the traffic
South North
Yongdingmen East Binhe Road Deshengmen East AvenueSouth 3rd Ring West Road North 3rd Ring East RoadSouth 4th Ring Mid-Road North 4th Ring Mid-Road

Fig. 2. (a–c). Comparison between measured and predicted hourly concentrations of PM10, CO, NO2, July 2004, on Qianmen East Avenue, for the validation of OSPM model. The linesshowing an agreement of predictions and data by a factor of two are also presented. N is the number of data points.
T. Wang, S. Xie / Atmospheric Environment 43 (2009) 5682–5690 5685
(Fig. 3b), with peaks around 7am–9am and 6pm–7pm, though thepeak values are not significantly high. This similarity proves thatCO, a typical primary pollutant, is decisively from the traffic emis-sion on-road. PM10 (Fig. 3a), however, deviates the double-peakmode of the traffic and only holds one peak. As PM10 has complexsources, i.e. secondary aerosol, long-range transport and trafficdust, we presume that the traffic flow can not dominate itsconcentration and on that day the other sources, e.g. a massiveregional transport, might yield the evening peak. The measuredand predicted NO2 concentrations both ascend during the day, andstay lower in the dawn and night (Fig. 3c), when the solar radiationis weaker. To the opposite, O3 concentration keeps low at thedaytime (Fig. 3d), as it reacts with NO, emitted from the vehicles,
Table 3Hourly wind speed (ms�1) and wind direction (�) at roof level, July 4th, 2004, Beijing.
Hour Wind speed Wind direction Hour Wind speed
1 1.7 0 9 12 0.9 0 10 1.63 0.8 0 11 1.74 0.6 3 12 1.25 0.3 0 13 1.26 1.5 0 14 17 0.2 0 15 1.38 0.3 0 16 1.2
and generates NO2, by the catalyzing of radiation and hightemperature. Consequently ozone stays light from sunrise tosunset, while NO2 accumulates.
3.1.3. The influence of wind and street configurationAs Table 3 shows, the prevailing wind direction on that day is
north. Since the Qianmen East Avenue runs east-westward, thesouth side of the street is windward while the north side leeward.The monitoring site locates on the north (also leeward) side of thestreet.
Fig. 3a and 3b show the measured and computed concentrationsof PM10 and CO on both sides of the street. From them we discoverthat the modeled results on the north side (leeward) have better
Wind direction Hour Wind speed Wind direction
0 17 2.1 1474 18 1.3 157
38 19 1.9 20837 20 4.8 13
171 21 3.1 0183 22 3.4 0156 23 1.1 0149 24 1.5 0
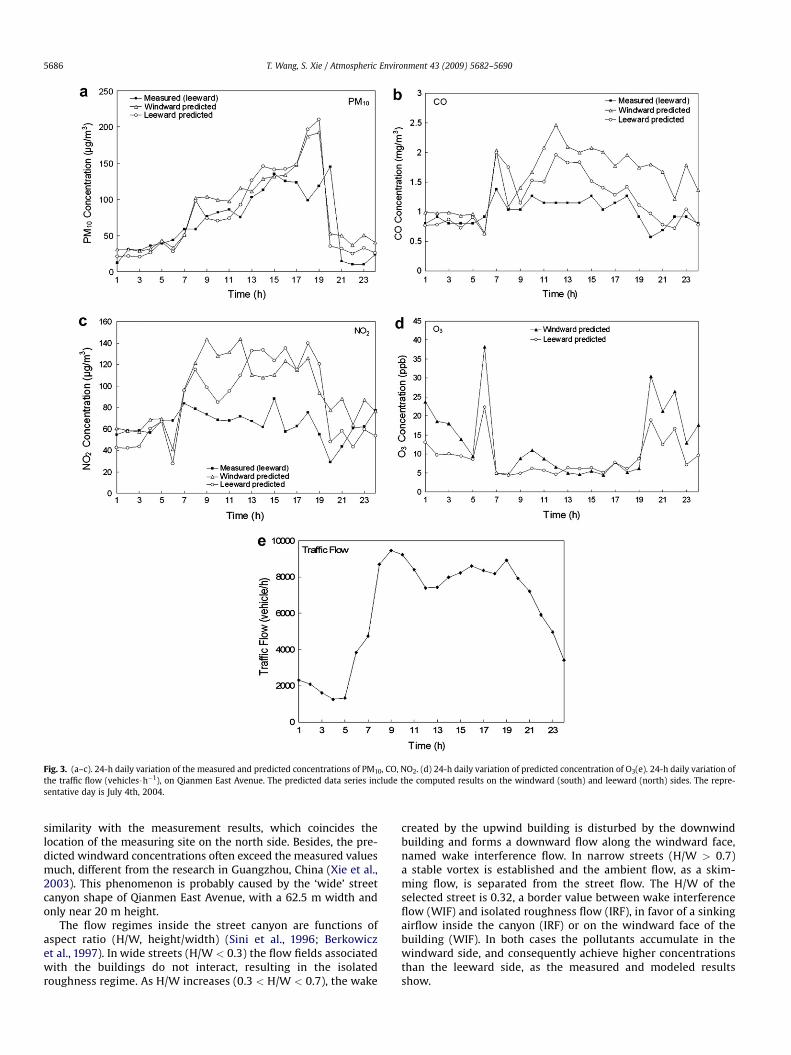
Fig. 3. (a–c). 24-h daily variation of the measured and predicted concentrations of PM10, CO, NO2. (d) 24-h daily variation of predicted concentration of O3(e). 24-h daily variation ofthe traffic flow (vehicles$h�1), on Qianmen East Avenue. The predicted data series include the computed results on the windward (south) and leeward (north) sides. The repre-sentative day is July 4th, 2004.
T. Wang, S. Xie / Atmospheric Environment 43 (2009) 5682–56905686
similarity with the measurement results, which coincides thelocation of the measuring site on the north side. Besides, the pre-dicted windward concentrations often exceed the measured valuesmuch, different from the research in Guangzhou, China (Xie et al.,2003). This phenomenon is probably caused by the ‘wide’ streetcanyon shape of Qianmen East Avenue, with a 62.5 m width andonly near 20 m height.
The flow regimes inside the street canyon are functions ofaspect ratio (H/W, height/width) (Sini et al., 1996; Berkowiczet al., 1997). In wide streets (H/W < 0.3) the flow fields associatedwith the buildings do not interact, resulting in the isolatedroughness regime. As H/W increases (0.3 < H/W < 0.7), the wake
created by the upwind building is disturbed by the downwindbuilding and forms a downward flow along the windward face,named wake interference flow. In narrow streets (H/W > 0.7)a stable vortex is established and the ambient flow, as a skim-ming flow, is separated from the street flow. The H/W of theselected street is 0.32, a border value between wake interferenceflow (WIF) and isolated roughness flow (IRF), in favor of a sinkingairflow inside the canyon (IRF) or on the windward face of thebuilding (WIF). In both cases the pollutants accumulate in thewindward side, and consequently achieve higher concentrationsthan the leeward side, as the measured and modeled resultsshow.

T. Wang, S. Xie / Atmospheric Environment 43 (2009) 5682–5690 5687
Similarly in Fig. 3c and 3d, the estimated concentration of NO2
and O3 on the windward side also exceeds the leeward side, as wellas the measured data from the leeward monitoring site.
Furthermore, wind speed is also considered a vital factor toinfluence the modeled concentrations. On the representing daywe found that the concentration values of PM10, CO and NO2,either measured or predicted, all dropped at around 8pm, mostpossibly because the wind speed soared, boosted the dispersionand diluted the pollution with the ambient air at that time.Meanwhile, the peaks of ozone at 8–10pm and 6am could also beattributed to the high wind speeds in these two periods(4.8 m s�1 and 1.5 m s�1, respectively; Table 3). The ozoneconcentration in the background air is higher than inside thecanyon (Xie et al., 2003), thus when the flow intensifies, more O3
Fig. 4. (a). The daily variation of the traffic flow and the special hourly average traffic flows foaverage predicted concentrations of PM10, CO, NO2, and O3, for east, west, south and northJul.30th (during TDM).
is brought into the street canyon, resulting in the concentrationpeaks.
3.2. Pollution modeling before and during the Olympic trafficmanagement period
Applying the validated OSPM model, we predicted the pollutantconcentrations on the selected 12 avenues, respectively the 2nd,3rd and 4th ring roads in Beijing urban area (see Table 2), beforeand during the Olympic traffic demand management (TDM) period.Fig. 4a–e shows the daily variation of the average traffic flow, andpredicted concentrations of PM10, CO, NO2, and O3 in 24 h. In orderto clarify the air quality improvement in different areas, as wellas the influence of wind force, the average traffic flow and
r east, west, south and north roads. Fig. 4b–e. The daily variation and the special hourlyroads. The calculated time periods are Jul.10th–Jul. 19th (before TDM) and Jul.20th–
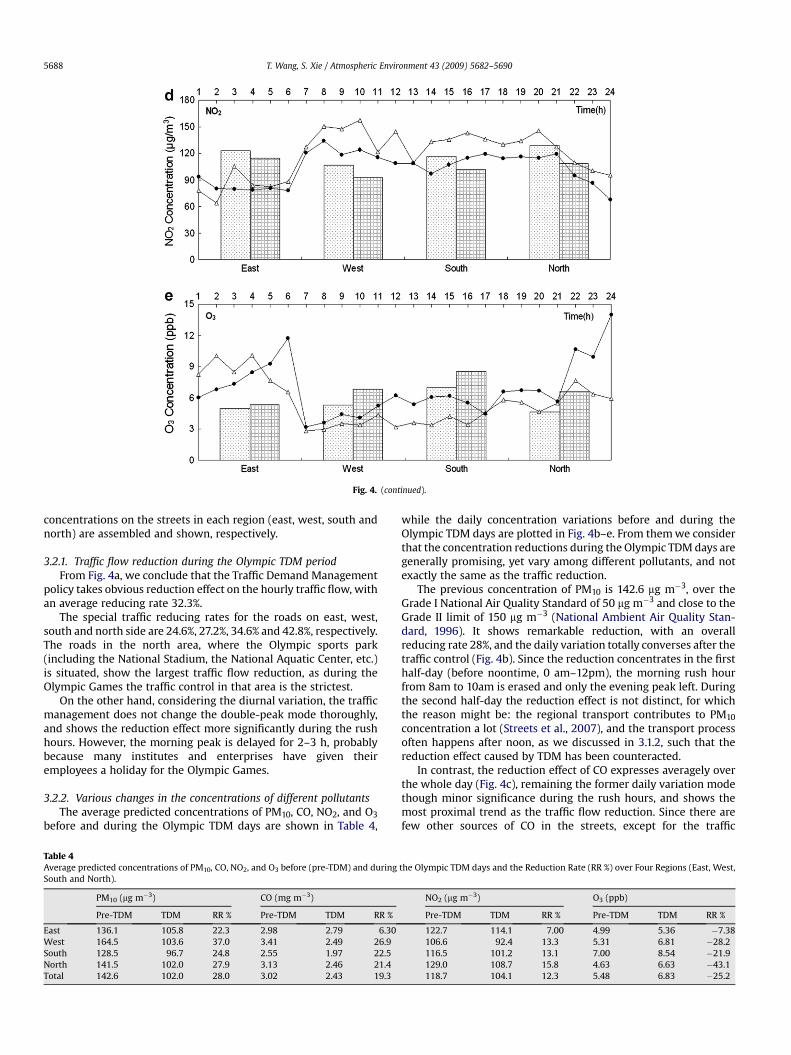
Fig. 4. (continued).
T. Wang, S. Xie / Atmospheric Environment 43 (2009) 5682–56905688
concentrations on the streets in each region (east, west, south andnorth) are assembled and shown, respectively.
3.2.1. Traffic flow reduction during the Olympic TDM periodFrom Fig. 4a, we conclude that the Traffic Demand Management
policy takes obvious reduction effect on the hourly traffic flow, withan average reducing rate 32.3%.
The special traffic reducing rates for the roads on east, west,south and north side are 24.6%, 27.2%, 34.6% and 42.8%, respectively.The roads in the north area, where the Olympic sports park(including the National Stadium, the National Aquatic Center, etc.)is situated, show the largest traffic flow reduction, as during theOlympic Games the traffic control in that area is the strictest.
On the other hand, considering the diurnal variation, the trafficmanagement does not change the double-peak mode thoroughly,and shows the reduction effect more significantly during the rushhours. However, the morning peak is delayed for 2–3 h, probablybecause many institutes and enterprises have given theiremployees a holiday for the Olympic Games.
3.2.2. Various changes in the concentrations of different pollutantsThe average predicted concentrations of PM10, CO, NO2, and O3
before and during the Olympic TDM days are shown in Table 4,
Table 4Average predicted concentrations of PM10, CO, NO2, and O3 before (pre-TDM) and duringSouth and North).
PM10 (mg m�3) CO (mg m�3)
Pre-TDM TDM RR % Pre-TDM TDM RR %
East 136.1 105.8 22.3 2.98 2.79 6.30West 164.5 103.6 37.0 3.41 2.49 26.9South 128.5 96.7 24.8 2.55 1.97 22.5North 141.5 102.0 27.9 3.13 2.46 21.4Total 142.6 102.0 28.0 3.02 2.43 19.3
while the daily concentration variations before and during theOlympic TDM days are plotted in Fig. 4b–e. From them we considerthat the concentration reductions during the Olympic TDM days aregenerally promising, yet vary among different pollutants, and notexactly the same as the traffic reduction.
The previous concentration of PM10 is 142.6 mg m�3, over theGrade I National Air Quality Standard of 50 mg m�3 and close to theGrade II limit of 150 mg m�3 (National Ambient Air Quality Stan-dard, 1996). It shows remarkable reduction, with an overallreducing rate 28%, and the daily variation totally converses after thetraffic control (Fig. 4b). Since the reduction concentrates in the firsthalf-day (before noontime, 0 am–12pm), the morning rush hourfrom 8am to 10am is erased and only the evening peak left. Duringthe second half-day the reduction effect is not distinct, for whichthe reason might be: the regional transport contributes to PM10
concentration a lot (Streets et al., 2007), and the transport processoften happens after noon, as we discussed in 3.1.2, such that thereduction effect caused by TDM has been counteracted.
In contrast, the reduction effect of CO expresses averagely overthe whole day (Fig. 4c), remaining the former daily variation modethough minor significance during the rush hours, and shows themost proximal trend as the traffic flow reduction. Since there arefew other sources of CO in the streets, except for the traffic
the Olympic TDM days and the Reduction Rate (RR %) over Four Regions (East, West,
NO2 (mg m�3) O3 (ppb)
Pre-TDM TDM RR % Pre-TDM TDM RR %
122.7 114.1 7.00 4.99 5.36 �7.38106.6 92.4 13.3 5.31 6.81 �28.2116.5 101.2 13.1 7.00 8.54 �21.9129.0 108.7 15.8 4.63 6.63 �43.1118.7 104.1 12.3 5.48 6.83 �25.2

T. Wang, S. Xie / Atmospheric Environment 43 (2009) 5682–5690 5689
emission, it is natural that CO concentration reflects similar dailyvariation and reduction effect with the traffic flow. On the whole,during the TDM period the concentration of CO in the street stayssafely below the Chinese National Air Quality Standard of 4 mg m�3.
The average concentration of NO2 presents a moderate double-peak mode here (Fig. 4d), with the higher concentration throughthe daytime, as in the validation part 3.1.2. The reduction of NO2 isalso average and close to the traffic flow trend, however, thereduction effect is not that significant as PM10 and CO, with theaverage reducing rate only 12.3%. After the traffic control the dailyNO2 concentration (104.1 mg m�3) is still higher than the Grade IINational Air Quality Standard of 80 mg m�3, though the hourlyconcentrations are almost within the Grade II National Standard of120 mg m�3 and WHO limit of 200 mg m�3. It indicates the trafficcontrol has not decided its reduction exclusively, for the concen-tration of NO2, a secondary pollutant, is influenced by many otherfactors, i.e. the solar radiation, the temperature and the backgroundozone concentration, etc.
Compared with the other pollutants, ozone shows the oppositechange trend: the concentration has not been reduced, butincreased during the traffic management days (Fig. 4e). Thisphenomenon can be interpreted by the same reason as we dis-cussed in 3.1. Since ozone basically reacts with NO, the emittedpollutants of vehicles, when the traffic emission is controlled, theamount of NO is reduced, while ozone accumulates. Therefore, wecan conclude that the traffic demand management of odd-even dayvehicle operation has not obtained the desired effects in controllingozone pollution. The on-road photochemical reaction with NO isalso the reason that the ozone concentration in the street is alwayslower than in the rural area, and also far from the Grade I NationalAir Quality Standard of 120 mg m�3.
3.2.3. Regional differences of air quality improvementsBefore the traffic management, the traffic flows of the streets in
the east, west and north are relatively high, while in the south thelowest. Accordingly, the pollution in these three areas is moresevere, showing a positive correlation with the traffic emission. Inthe most crowded West 2nd Ring, North 3rd Ring and East 4th Ring,where the daily traffic flow over 200,000, the daily concentrationsof PM10 and CO all exceed the Grade II National Air Quality Standardof China (150 mg m�3 and 4 mg m�3).
During the Olympic traffic controlling days, we find that thepollution reduction effects are reflected more significantly in thewest and north regions of Beijing, than in the east and south, whichis not exactly the same as the traffic flow reduction effects (in east,west, south and north the reduction rates are respectively 24.6%,27.2%, 34.6% and 42.8%, as shown in 3.2.1).
The different background pollution can be one of the reasons forthe regional difference of the reduction effect. The east and southareas are influenced by the pollutants transport from Tianjin andLangfang (Fig. 1), thus the composition of pollution sources is morecomplicated. In comparison, the rural areas in the west and northcontributes less in the background contribution, hence the trafficemission takes more significant effect in deciding the on-roadpollutant concentration.
In addition, the wind force accelerates this difference. Due to theprevailing south-east wind in the summertime in Beijing, with theaverage wind direction 115.5�, the east and south areas moreexpose to the disturbance from the long-range transport, andperform not exactly the same as the traffic variation.
From this point of view, to achieve the air quality improvementthe Beijing government should not only rely on the trafficmanagement, but also make efforts in other aspects, for examplecontrol the pollution in the surrounding regions and abate thepollutant transport. The similar conclusion has been achieved by
Streets et al. (2007), when they simulated the concentrations of fineparticulate matter and ozone over the Beijing region with the USEPA’s Models-3/CMAQ model, and found about 34% of PM2.5 onaverage and 35–60% of ozone during high ozone episodes could beattributed to sources outside Beijing, especially from NeighboringHebei Provinces and the Tianjin Municipality (Fig. 1).
4. Conclusion
In this paper we apply the OSPM model to calculate the on-roadconcentrations of PM10, CO, NO2 and O3 before and during thetraffic controlling days in Beijing, to assess the traffic-relatedpollution situation and evaluate the air quality improvement overthe Olympic Games period.
From the validation of OSPM model, we confirm that the modelestimates well the average concentrations, of both primarypollutants and secondary pollutants, at the street level. The dailyvariation of the concentrations inside streets are also reflected, i.e.CO present double peaks as the traffic flow, PM10 has compoundsources, NO2 accumulates during the daytime. The unique variationof O3, which ascends through the night and stays at a low amount,deserves more attention. In addition, the modeling results on theleeward side are more accurate and on the windward side oftenoverestimate, which shows the influence of wind force and thespecial street geometry.
During the Olympic traffic management period, the traffic flowshows an average reducing rate of 32.3%, a good illustration to thepositive reduction effect of the TDM policy. However, the trafficcontrol brings various changes between different pollutants. Theconcentrations of PM10, CO, NO2 and O3 have changed from142.6 mg m�3, 3.02 mg m�3, 118.7 mg m�3 and 5.48 ppb to102.0 mg m�3, 2.43 mg m�3, 104.1 mg m�3 and 6.83 ppb, respectively.PM10 reduces most and even sacrifices the daily variation mode,possibly attributed to the regional transport, whereas the reductioneffects of CO and NO2 express more evenly over the whole day,without major changes on the diurnal variations. The ozoneconcentration has not been reduced as desired, just opposite to thetraffic emission and NO2 concentration change again, as a result ofthe photochemical reactions. In conclusion, the air quality in thestreet after the traffic control meets the Grade II Chinese NationalAir Quality Standard and the WHO Guideline (except PM10).
On the other hand, the air quality improvement shows regionaldifference among the east, west, south and north streets, which isprobably induced by the diverse background pollution on thedifferent directions around Beijing, along with the impact of windforce. This finding reveals that to achieve the air quality improve-ment, the pollution control in the surrounding regions and thepollutant transport should also be taken into consideration, thoughthe traffic control policy takes favorable effects in cutting down thetraffic-related pollution in the urban streets.
Acknowledgement
The authors would like to thank all the mentioned institutes forproviding the raw data. This work was supported by the financialsupport from the Research on Optimizing the Stationing of Moni-toring Sites for Urban Ambient Air Quality (No. 200709001), fromthe US Energy Foundation, and from the Sino-Italian CooperationProgram for Environmental Protection.
References
Berkowicz, R., 2000. OSPM – a parameterised street pollution model. Environ-mental Monitoring and Assessment 65, 323–331.

T. Wang, S. Xie / Atmospheric Environment 43 (2009) 5682–56905690
Berkowicz, R., Hertel, O., Larsen, S.E., Sorensen, N.N., Nielsen, M., 1997. ModelingTraffic Pollution in Streets. NERI, Roskilde, Denmark.
Berkowicz, R., Ketzel, M., Vachon, G., Louka, P., Rosant, J.-M., Mestayer, P.G., Sini, J.-F.,2002. Examination of traffic pollution distribution in a street canyon using theNante’s99 experimental data and comparison with model results. Water, Air,and Soil Pollution, Focus 2, 311–324.
Berkowicz, R., Palmgren, F., Hertel, O., Vignati, E., 1996. Using measurements of airpollution in streets for evaluation of urban air qualitydmeteorological analysisand model calculations. Science of the Total Environment 189/190, 259–265.
Bihan, O.L., Wahlin, P., Ketzel, M., Palmgren, F., Berkowicz, R., 2002. Application ofdispersion modeling for analysis of Particle pollution sources in a street canyon.Water, Air, and Soil Pollution, Focus 2, 395–404.
Cai, H., Xie, S.D., 2007. Estimation of vehicular emission inventories in China from1980 to 2005. Atmospheric Environment 41, 8963–8979.
Chan, C.K., Yao, X.H., 2008. Air pollution in mega cities in China. AtmosphericEnvironment 42, 1–42.
Chan, C.Y., Xu, X.D., Li, Y.S., Wong, K.H., Ding, G.A., Chan, L.Y., Cheng, X.H., 2005.Characteristics of vertical profiles and sources of PM2.5, PM10 and carbonaceousspecies in Beijing. Atmospheric Environment 39, 5113–5124.
Fang, M., Chan, C.K., Yao, X.H., 2009. Managing air quality in a rapidly developingnation: China. Atmospheric Environment 43, 79–86.
Fu, L.X., Hao, J.M., He, D.Q., He, K.B., 1999. Modeling air pollution from traffic inurban street canyon. Journal of Tsinghua University (Science and Technology)39 (6), 99–101.
Fu, L.X., Hao, J.M., He, D.Q., He, K.B., 2000. The emission characteristics of pollutantsfrom motor vehicles in Beijing. Environmental Science 5, 68–70.
Fu, L.X., He, K.B., He, D.Q., Tang, Z.Z., Hao, J.M., 1997. A study on models of mobilesource emission factors. Acta Scientiae Circumstantiae 17 (4), 474–479.
Ghenu, A., Rosant, J.-M., Sini, J.-F., 2008. Dispersion of pollutants and estimation ofemissions in a street canyon in Rouen, France. Environmental Modeling &Software 23, 314–321.
Gokhale, S.B., Rebours, A., Pavageau, M., 2005. The performance evaluation ofWinOSPM model for urban street canyons of Nantes in France. EnvironmentalMonitoring and Assessment 100, 153–176.
Guinot, B., Rogerb, J.-C., Cachier, H., Wang, P.C., Bai, J.H., Yu, T., 2006. Impact ofvertical atmospheric structure on Beijing aerosol distribution. AtmosphericEnvironment 40, 5167–5180.
He, D.Q., Hao, J.M., Fu, L.X., Zhou, Z.P., Liu, Y., Wang, Z.S., Deng, Y.H., 1999. Pollutionassessment in urban street canyons of Macao using OSPM model. Acta ScientiaeCircumstantiae 19 (3), 256–261.
Hertel, O., 1989. Modeling NO2 Concentrations in a Street Canyon. NERI, Roskilde,Denmark.
Hertel, O., Berkowicz, R., 1989. Modeling Pollution from Traffic in a Street Canyon.Evaluation of Data and Model Development. NERI, Roskilde, Denmark.
Harkonen, J., Valkonen, E., Kukkonen, J., Rantakrans, E., Jalkanen, L., Lahtinen, K.,1995. An operational dispersion model for predicting pollution from a road.International Journal of Environment and Pollution 5, 602–610.
Harkonen, J., Valkonen, E., Kukkonen, J., Rantakrans, E., Lahtinen, K., Karppinen, A.,Jalkanen, L., 1996. A Model for the Dispersion of Pollution from a Road Network.In: Publications on Air Quality, 23. Finnish Meteorological Institute, Helsinki.34 pp.
Karppinen, A., Kukkonen, J., Elolahde, T., Konttinen, M., Koskentalo, T., 2000.A modeling system for predicting urban air pollution, comparison of modelpredictions with the data of an urban measurement network. AtmosphericEnvironment 34, 3735–3743.
Ketzel, M., Berkowicz, R., Lohmeyer, A., 2000. Comparison of Numerical streetdispersion models with results from wind Tunnel and field measurements.Environmental Monitoring and Assessment 65, 363–370.
Kukkonen, J., Partanen, L., Karppinen, A., Walden, J., Kartastenpaa, R., Aarnio, P.,Koskentalo, T., Berkowicz, R., 2003. Evaluation of the OSPM model combinedwith an urban background model against the data measured in 1997 inRuneberg Street, Helsinki. Atmospheric Environment 37, 1101–1112.
Kukkonen, J., Valkonen, E., Walden, J., Koskentalo, T., Aarnio, P., Karppinen, A.,Berkowicz, R., Kartastenpaa, R., 2001. A measurement campaign in a streetcanyon in Helsinki and comparison of results with predictions of the OSPMmodel. Atmospheric Environment 35, 231–243.
Li, W., Fu, L.X., Hao, J.M., Ma, H., Li, S.Q., Hu, W., 2003. Emission inventory of 10 kindsof air pollutants for road traffic vehicles in China. Urban Environment & UrbanEcology 16 (2), 36–38.
Mao, B.H., 2008. Analysis on transport policies of post-olympic times of Beijing.Journal of Transportation Systems Engineering and Information Technology 8(6), 138–145.
Mensink, C., Lewyckyj, N., 2001. A simple model for the assessment of air quality instreets. International Journal of the Vehicle Design 27 (1–4), 242–250.
National Ambient Air Quality Standard, GB3095–1996, PRC MEP, http://www.zhb.gov.cn/tech/hjbz/bzwb/dqhjbh/dqhjzlbz/199612/t19961206_67502.htm.
Sini, J.F., Anquetin, S., Mestayer, P.G., 1996. Pollutant dispersion and thermal effectsin urban street canyons. Atmospheric Environment 30, 2659–2677.
Song, X.Y., Xie, S.D., 2006. Development of vehicular emission Inventory in China.Environmental Science 27 (6), 1041–1045.
Song, Y., Xie, S.D., Zhang, Y.H., Zeng, L.M., Salmon, L.G., Zheng, M., 2006. Sourceapportionment of PM2.5 in Beijing using principal component analysis/absoluteprincipal component scores and UNMIX. Science of the Total Environment 371(1), 278–286.
Streets, D.G., Fu, J.S., Jang, C.J., Hao, J.M., He, K.B., Tang, X.Y., Zhang, Y.H., Wang, Z.F.,Li, Z.P., Zhang, Q., Wang, L.T., Wang, B.Y., Yu, C., 2007. Air quality during the 2008Beijing Olympic Games. Atmospheric Environment 41, 480–492.
Vardoulakis, S., Fisher, B.E.A., Gonzalez-Flesca, N., Pericleous, K., 2002a. Modelsensitivity and uncertainty analysis using roadside air quality measurements.Atmospheric Environment 36, 2121–2134.
Vardoulakis, S., Gonzalez-Flesca, N., Fisher, B.E.A., 2002b. Assessment of traffic-related air pollution in two street canyons in Paris: implications for exposurestudies. Atmospheric Environment 36, 1025–1039.
Vardoulakis, S., Fisher, B.E.A., Pericleous, K., Gonzalez-Flesca, N., 2003. Modelingair quality in street canyons: a review. Atmospheric Environment 37,155–182.
Vardoulakis, S., Valiantis, M., Milner, J., ApSimon, H., 2007. Operational air pollutionmodeling in the UKdstreet canyon applications and challenges. AtmosphericEnvironment 41, 4622–4637.
Wang, B.G., Zhang, Y.H., Wu, Z.Q., Chan, L.Y., 2001. Tunnel test for motor vehicleemission factors in Guangzhou. Research of Environmental Sciences 14 (4),13–16.
Wang, Q.D., Ding, Y., 2002. Studies and prospect on Chinese vehicle emissionmodels. Research of Environmental Sciences 15 (6), 52–55.
Westerdahl, D., Wang, X., Pan, X.C., Zhang, K.M., 2008. Characterization of on-roadvehicle emission factors and microenvironmental air quality in Beijing, China.Atmospheric Environment 43, 697–705.
WHO global air quality guidelines, 2006, http://www.euro.who.int/Document%20/E87950.pdf (EB/OL).
Wu, J.S., Zhang, Y.J., 2008. Olympic games promote the reduction in emissions ofgreenhouse gases in Beijing. Energy Policy 36, 3422–3426.
Xie, S.D., Song, X.Y., Shen, X.H., 2006. Calculating vehicular emission factors withCOPERT III mode in China. Environmental Science 27 (3), 415–419.
Xie, S.D., Zhang, Y.H., Qi, Li, Tang, X.Y., 2005. Characteristics of air pollution inBeijing during sand-dust storm periods. Water, Air, and Soil Pollution, Focus 5,217–229.
Xie, S.D., Zhang, Y.H., Qi, Li, Tang, X.Y., 2003. Spatialdistributionof traffic-relatedpollutantconcentration in street canyons. Atmospheric Environment 37, 3213–3224.
Yamartino, R.J., Wiegand, G., 1986. Development and evaluation of simple modelsfor the flow, turbulence and pollutant concentration fields within an urbanstreet canyon. Atmospheric Environment 20, 2137–2156.
Ziv, A., Berkowicz, R., Genikhovich, E., Palmgren, F., Yakovleva, E., 2002. Analysis ofthe St. Petersburg traffic data using the OSPM model. Water, Air, and SoilPollution, Focus 2, 297–310.