
PhD THESIS SUMMARY - upb.ro®rneanu_georgiana... · CHARACTERIZATION OF ADVANCED MATERIALS BASED ON...
40
FONDUL SOCIAL EUROPEAN Investeşte în oameni! Programul Operaţional Sectorial pentru Dezvoltarea Resurselor Umane 2007-2013 Proiect POSDRU/159/1.5/S/132395-Burse doctorale şi postdoctorale în sprijinul inovării şi competitivităţii în cercetare-InnoRESEARCH UNIVERSITY POLITEHNICA of BUCHAREST Faculty of Applied Chemistry and Materials Science Department of Inorganic Chemistry, Physical Chemistry and Electrochemistry Senate Decision No.... from .. PhD THESIS SUMMARY CHARACTERIZATION OF ADVANCED MATERIALS BASED ON SELENIUM AZULENE DERIVATIVES AND NANODIAMONDS CARACTERIZAREA UNOR MATERIALE AVANSATE PE BAZĂ DE DERIVAȚI AZULENICI CU SELENIU ȘI NANODIAMANTE Author: Biochim. Georgiana-Anca INEL (married CÎRNEANU) Supervisor: Prof.Dr.Ing. Eleonora-Mihaela UNGUREANU PhD COMMISION President Prof.Dr. Chim. Elena DIACU from University Politehnica of Bucharest Supervisor Prof.Dr. Iing. Eleonora-Mihaela UNGUREANU from University Politehnica of Bucharest Reviewer Prof.Dr. Ing. Farm. Gabriela STANCIU from University OVIDIUS Constanța Reviewer Prof.Dr. Katherine B. HOLT from University College London, UK Reviewer Conf.Dr. Ing. Anca Elena COJOCARU from University Politehnica of Bucharest Bucharest 2017
Transcript of PhD THESIS SUMMARY - upb.ro®rneanu_georgiana... · CHARACTERIZATION OF ADVANCED MATERIALS BASED ON...
FONDUL SOCIAL EUROPEAN Investeşte în oameni!
Programul Operaţional Sectorial pentru Dezvoltarea Resurselor Umane 2007-2013 Proiect POSDRU/159/1.5/S/132395-Burse doctorale şi postdoctorale în sprijinul inovării şi competitivităţii în cercetare-InnoRESEARCH
UNIVERSITY POLITEHNICA of BUCHAREST
Faculty of Applied Chemistry and Materials Science Department of Inorganic Chemistry, Physical Chemistry and Electrochemistry
Senate Decision No.... from ..
PhD THESIS SUMMARY
CHARACTERIZATION OF ADVANCED MATERIALS BASED ON SELENIUM AZULENE DERIVATIVES AND NANODIAMONDS
CARACTERIZAREA UNOR MATERIALE AVANSATE PE BAZĂ DE DERIVAȚI
AZULENICI CU SELENIU ȘI NANODIAMANTE
Author: Biochim. Georgiana-Anca INEL (married CÎRNEANU)
Supervisor: Prof.Dr.Ing. Eleonora-Mihaela UNGUREANU
PhD COMMISION
President
Prof.Dr. Chim. Elena DIACU
from University Politehnica of Bucharest
Supervisor
Prof.Dr. Iing. Eleonora-Mihaela UNGUREANU
from University Politehnica of Bucharest
Reviewer
Prof.Dr. Ing. Farm. Gabriela STANCIU
from University OVIDIUS Constanța
Reviewer
Prof.Dr. Katherine B. HOLT
from University College London, UK
Reviewer
Conf.Dr. Ing. Anca Elena COJOCARU
from University Politehnica of Bucharest
Bucharest 2017
CHARACTERIZATION OF ADVANCED MATERIALS BASED ON SELENIUM AZULENE DERIVATIVES AND NANODIAMONDS
2
Thesis composition CONTENTS...............................................................................................................................3 INTRODUCTION.....................................................................................................................7 AKNOWLEDGMENTS.........................................................................................................10 LIST OF SYMBOLS............................................................................................................11 I. LITERATURE REPORT CHAPTER 1. ELECTROCHEMICAL AND SPECTROELECTROCHEMIC AL STUDIES OF POLYAZULENE GROWTH....................................................................12
1.1. GENERALITY ABOUT POLYAZULENE FILMS.......................................12 1.2. ELECTROCHEMICAL AND SPECTROELECTROCHEMICAL
PROPERTIES OF POLIAZULENE FILMS.........................................................13 1.3. STUDY ON GROWTH OF POLYMERS BY
SPECTROELECTROCHEMICAL EXPERIMENTS...........................................18 1.4. CONCLUSIONS ON ELECTROCHEMICAL AND
SPECTROELECTROCHEMICAL STUDIES OF POLYAZULENE GROWTH………………………………………………………………………...23
CHAPTER 2. NANODIAMOND SURFACE REDOX CHEMISTRY (ND) ....................24
2.1. CONSIDERATIONS ABOUT ND ELECTRODES.........................................24 2.2. CHARACTERISATION OF NANODIAMOND MATERIALS USING FTIR
AND TEM………………………………………………………………………..26 2.3. CYCLIC VOLTAMMETRY (CV) INVESTIGATIONS OF NANODIAMOND-
MODIFIED ELECTRODES …………………………………………………….27 2.3.1. Effect of nanodiamond particle diameter on the voltammetric response………………………………………………………………………….27 2.3.2. Effect of the solution pH on the CV response at nanodiamond-modified electrodes..........................................................................................................28 2.3.3. Effect of solution ionic strength on the CV response at nanodiamond-modified electrodes..........................................................................................29 2.3.4. Effect of CV scan rate on the CV response at nanodiamond-modified electrodes..........................................................................................................30
2.4. IN SITU ATR IR SPECTROSCOPY FOR ND............................................... ...31 2.5. INFLUENCE OF PHYSICO-CHEMICAL PROPERTIES ON ND CATHALIZED
PROCESSES………………………………………………………………………32 2.5.1. Mechanism of the catalytic current enhancement..................................32 2.5.2. Relationship between the particle size and the catalytic current …..…..33 2.5.3. pH dependence of the catalytic current....................................................33
CHARACTERIZATION OF ADVANCED MATERIALS BASED ON SELENIUM AZULENE DERIVATIVES AND NANODIAMONDS
3
2.5.4. pH dependence of the off-set current........................................................34 2.5.5. Ionic strength dependence of the voltammetric catalytic current ..........34 2.5.6. Contribution of the adsorption processes to the catalytic current……….………………………………...…………………………..……..35 2.5.7. Scan rate dependence of the voltammetric catalytic current ..................36
2.6. CONCLUSIONS ON NANODIAMOND SURFACE REDOX CHEMISTRY...36
CHAPTER 3. EXPERIMENTAL TECHNIQUES FOR THE STUDY OF INVESTIGATED COMPOUNDS ......................................................................38 3.1. MEASUREMENTS OF 2 AND 4 POINTS CONDUCTIVITY (s24) FOR POLYMER FILM CHARACTERIZATION ....................................................38
3.1.1. Generalities on measurement technique................................................38 3.1.2. Experimental for s24 technique............................................................39 3.1.3. Measurement technology...........................................................................40 3.1.4. Measurement of the bulk polymer and the contact resistance………………………………………………………………………...42 3.1.5. Conclusion on the significance of the results of s24................................45
3.2. ATTENUATED TOTAL REFLECTION (ATR).................................................46 3.2.1. Considerații generale asupra metodei ATR............................................46 3.2.2. ATR principle ...........................................................................................47 3.2.3. ATR instrumentation ...............................................................................48 3.2.4. ATR materials – Diamond and germanium..........................................49 3.2.5. Example of ATR application.....................................................................50
II. ORIGINAL RESEARCH
CHAPTER 4. EXPERIMENTAL DETAILS ON THEE CARRIED OUT STUDIES……………………………………………………………………………..52 4.1. SET-UP.............................................................................................................52
4.1.1. Set-up for electrochemical studies and film formation …………..…...52 4.1.2. Set-up for conductivity measurements..................................................52 4.1.3. Set-up for ATR………………................................................................53
4.2. REAGENTS...........................................................................................................54 4.2.1. Reagents for electrochemical studies and films formation....................54 4.2.2. Reagents for conductivity measurements...............................................54 4.2.3. Reagents for studies using the ATR……………………......................55
4.3. PROCEDURE.................................................................................................55
CHARACTERIZATION OF ADVANCED MATERIALS BASED ON SELENIUM AZULENE DERIVATIVES AND NANODIAMONDS
4
4.3.1. Procedure for electrochemical studies and films formation ………...55 4.3.2. Procedure for electrochemical studies for conductivity measurements…………………………………………………………………...55 4.3.3. Procedure for studies using the ATR-FTIR technique........................56
CHAPTER 5. STUDIES ON ELECTROCHEMICAL PROPERTIES OF SOME PHENILSELANYL AZULENES..........................................................................57 5.1. STUDY OF 1-( PHENYLSELANYL) AZULEN (1a)...................................... 57 5.2. STUDY OF 1-[3-(PHENYLSELANYL)AZULEN-1-YL]-2,2,2- TRIFLUOROETHANONE (1d)................................................................................. 61 5.3. STUDY OF (3-NITROAZULEN-1-YL)(PHENYL)SELANE (1b)………….....63 5.4. STUDY OF 3-(PHENYLSELANYL)AZULEN-1- CARBALDEHYDE (1e) …64 5.5. STUDY OF 1-(3-(PHENYLSELANYL)AZULEN-1-IY) ETHANONE(1f)…...64 5.6. STUDY OF 3-(PHENYLSELANYL)AZULEN-1-YL METHYL CARBOXYLATE (1g)………….…………………………………….……………... 65 5.7. STUDY OF 1,3-BIS(PHENYLSELANYL)AZULENE (1i)…........................... 65 5.8. STUDY OF 3-(PHENYLSELANYL)AZULEN-1-YL BENZOATE (1j)............ 67 5.9. STUDY OF PHENYL[3-(PHENYLSELANYL)AZULEN-1-YL]SULFAN(1h) 68 5.10. STUDY OF N-[3-(PHENYLSELANYL)AZULEN-1-YL]ACETAMIDE(1k). 69 5.11. STUDY OF (6-METHYLAZULEN-1-YL) (PHENYL)SELANE (2a).............. 70 5.12. STUDY OF 1-PHENYLSELANYL- 4,6,8-TRIMETHYL AZULENE (2b)..... 72 5.13. STUDY OF (6-t-BUTYL-4,8-DIMETHYLAZULEN-1-YL) (PHENYL)SELANE (2c)……………………………………………………………..73 CHAPTER 6. CORRELATION OF ELECTROCHEMICAL PROPERTIE S WITH STRUCTURE FOR PHENYLSELANYL AZULENES.......... ..................74 6.1. HAMMET TYPE CORRELATIONS FOR 1-PHENYLSELANYL AZULENE DERIVATIVES............................................................................................................74 6.2. CALCULATION OF DIFFUSION COEFFICIENTS FOR 1-PHENYLSELANYL-AZULENE DERIVATIVES.....................................................75 6.3. EXPERIMENTS BY CONTROLLED POTENTIAL ELECTROLYSIS ON 1-PHENILSELANYL -AZULENES.............................................................................76 6.4. ABOUT THE MECHANISM OF ELECTROCHEMICAL PROCESSES OF 1-PHENILSELANYL-AZULENES.............................................................................86 6.5. CONCLUSIONS ON ELECTROCHEMICAL BEHAVIOR DERIVATIVES 1-PHENYLSELANYL-AZULENE..............................................................................91
CHARACTERIZATION OF ADVANCED MATERIALS BASED ON SELENIUM AZULENE DERIVATIVES AND NANODIAMONDS
5
CHAPTER 7. ELECTROCHEMICAL FILMS FORMATION FROM PHENILSELANYL-AZULENE DERIVATIVES................. .................................92 7.1. FILMS BASED ON 1-(PHENYLSELANYL)AZULENE (1a).......................... 92 7.2. FILMS BASED ON (6-METHYLAZULEN-1-YL)(PHENYL)SELANE (2a)... 93
7.2.1. Poly(2a) films on glassy carbon (GC)………………….........................93 7.2.2. Poly(2a) films on microchips..................................................................93
7.3 FILMS BASED ON 1,3-BIS(PHENYLSELANYL)AZULENE (1i).....................95 CHAPTER 8. NANOSTRUCTURED ELECTRODE MATERIALS BASED ON NANODIAMOND (ND)......................................................................................... 96 8.1. SPECTROSCOPY STUDIES OF NANOSTRUCTURED ELECTRODE MATERIALS...........................................................................................................96 8.2. CHARACTERIZATION OF ND POWDERS BY ATR-FTIR, TEM AND XPS...........................................................................................................................97 8.3. IN SITU ATR-FRIR STUDIES OF ND POWDER FILMS IN ETHANOL VAPOUR……………………………………………………………………….….….98
8.3.1. IR spectrum after 2 min exposure to ethanol vapour.............................98 8.3.2 Time dependence of IR response under ethanol vapour.......................99 8.3.3 Changes to the ND surface on exposure to ethanol vapours................99
8.4. INTERACTIONS OF SOLVENTS WITH ND...............................................102 8.5. ELECTROCHEMICAL STUDIES ON BDD and ND-BDD.............................105 8.6 CONCLUSIONS ON THE OPTICAL AND ELECTROCHEMICAL STUDIES OF NANOSTRUCTURED ELECTRODE MATERIALS.......................................108
III.CONCLUSIONS C.1. GENERAL CONCLUSIONS..........................................................................112 C.2. ORIGINAL CONTRIBUTIONS.....................................................................113 C.3. OUTLOOK....................................................................................................114
APPENDICES List of papers elaborated during PhD thesis..........................................................115 List of scientific communications elaborated during PhD thesis ........................116
REFERENCES.................................................................................................................117 PAPERS PUBLISHED IN EXTENSO.............................................................................124
Introduction The Ph.D. thesis entitled CHARACTERIZATION OF ADVANCED MATERIALS
BASED ON SELENIUM AZULENE DERIVATIVES AND NANODIAMONDS is part of the research subjects developed in the Laboratory of Electrochemical Processes in Organic
CHARACTERIZATION OF ADVANCED MATERIALS BASED ON SELENIUM AZULENE DERIVATIVES AND NANODIAMONDS
6
Solvents (PESO) from University POLITEHNICA of Bucharest (UPB), Faculty of Applied Chemistry and Material Science, Department of Inorganic Chemistry, Physical Chemistry and Electrochemistry. The thesis contains the main original contributions brought by the doctoral student Georgiana-Anca INEL (married CÎRNEANU) in the field of characterization of advanced materials based on selenium azulene derivatives and nanodiamonds.
This thesis is part of the team's concerns to investigate new azulene derivatives by advanced electrochemical methods, and opens a pioneering research direction towards new nanodiamond-based electrode materials. The concerns of the research team in which the thesis was elaborated are related to the study of the azulene compounds, field in which the team has a pioneering contribution. Until nowadays, more than 100 azulene compounds have been studied, and a databasis on electrochemical reactivity of these compounds has already been established. In this thesis, a new class of azulene compounds is approached, namely the selenium azulene derivatives. The study of these compounds and especially their electrochemical characterization is of great importance, both because of selenium involvement in the life cycle of living organisms, and from pharmaceutical point of view. Such a study aims to highlight the electrochemical processes of organic compounds with selenium, in order to understand their role in the redox processes that take place in biological systems.
This thesis brings original contributions related to the characterization of new azulene compounds with selenium, recently synthesized in the Institute of Organic Chemistry C.D. Nenitzescu of the Romanian Academy, Bucharest, Romania, in the research team coordinated by Dr. Alexandru C. Răzuş and Dr. Liviu Bîrzan. It proposes correlations of the electrochemical properties with the structure of certain phenylselanyl azulenes. The interest in the chemistry of these compounds is justified by the particular structure of azulene having a five-membered ring attached to a seven-member ring with opposite electron density (high and low, respectively). The push-pull structure makes these derivatives more reactive than the corresponding benzene compounds in all reactions. Substitution of azulene with the phenylselanyl group (PhSe) leads to a decrease in oxidation and reduction potentials in comparison with azulene, despite the relatively high oxidation potential of diaryl selanide. The azulene derivative which is the starting point of these researches is 1-(phenylselanyl) azulene. In addition, substituted compounds at the five-membered ring (type 1) with electron withdrawing groups (nitro, p-tosyl, trifluoroacetyl, formyl, acetyl, carboxymethyl) and electrodonating groups of electrons (phenylthio, phenylsilanyl, or aminoacetyl), as well as compounds substituted at the seven ring (type 2) by electrodonating groups have been studied. Controlled potential electrolyses were run in order to establish the mechanism of the redox processes. On this occasion, the oxidation of the azulene compounds to the the corresponding selenoxide or selenone, and the formation of polymer films have been emphasized. The formation of these films was investigated by performant electrochemical methods, and by two- and four-point conductivity measurements (s24). The last type of measurements se have been perfomed in a doctoral stage at Brandenburg University of Technology, Faculty of Natural Sciences, Department of Nanobiotechnology (Prof. V.M. Mirsky), Cotbus, Germania in the frame of the European Project “New materials and devices based on conducting polymers and their composites” (POLYCON), funded by the German Federal Ministry of Education and Research (Grant no. 01DS13013).
The second research approach addressed in the thesis is related to nanodiamond (ND) nanostructured electrode materials. Spectroscopy studies of nanostructured electrode materials
CHARACTERIZATION OF ADVANCED MATERIALS BASED ON SELENIUM AZULENE DERIVATIVES AND NANODIAMONDS
7
and characterizations of ND powders, as well as in-situ ATR-IR studies on ND films in ethanol vapours, in order to establish the solvent interactions with ND, and electrochemical studies on ND and Boron doped ND. These studies were carried out during a POSDRU doctoral stage at the University College London, Department of Chemistry, Anglia (prof. Katherine HOLT).
The thesis is structured in two parts and contains 8 chapters: PART I - LITERATURE REVIEW (3 chapters) and PART II - ORIGINAL CONTRIBUTIONS (5 chapters). The thesis has 122 pages written at 1 line, of which 51 pages for Part I and 71 pages for Part II, contains 8 tables and 103 figures. At the end of the paper more than 160 bibliographic references in the order of their quotation in the texte, as well as the works in extenso published during the research are presented.
The first part of the thesis (chapters 1-3) presents the state othe art on the current knowledge in the field of nanostructured materials prepared and characterized by electrochemistry.
Chapter 1, entitled ELECTROCHEMICAL AND SPECTROELECTROCHEMICAL STUDIES ON THE POLYAZULENE FORMATION, contains some generalities on polyazulenes films, as well as their electrochemical characterizations and studies on the growth of polymers by spectroelectrochemical experiments.
Chapter 2 entitled REDOX CHEMISTRY OF NANODIAMANT SURFACES (ND) presents the characteristic aspects related to characterization of ND materials by FTIR and TEM methods, as well as investigations of ND modified electrodes by cyclic voltammetry (CV), with details related to the effect of particle ND diameter, solution pH, ionic strength and scanning speed over CV response on ND modified electrodes. In this chapter are presented the literature on ATR IR in situ spectroscopy for ND, as well as the effect of physico-chemical properties on ND catalysed processes. Catalytic flow growth mechanisms are discussed, focusing on the influence of ND particle size and pH on current growth, as well as other parameters such as ionic strength, adsorption, and scanning speed.
Chapter 3, entitled EXPERIMENTAL TECHNIQUES FOR THE STUDY OF INVESTIGATED COMPOUNDS, is dedicated to other experimental techniques, other than electrochemicals on inert electrodes. The principle and advantages of characterization of polymer films by 2 and 4 point (s24) conductivity measurements as well as ATR (which is a versatile instrument for FT-IR spectroscopy) are presented.
The second part of the thesis (chapters 4-8) presents the original contributions . Chapter 4 describes the particular aspects of the experiments: the set-up used, chemical reagents, and methodology to carry out the experiments.
Chapter 5, entitled STUDIES ON ELECTROCHEMICAL PROPERTIES OF SOME PHENILSELANYL AZULENES, presents detailed electrochemical studies of 13 azulenic derivatives of selenium.
Chapter 6 entitled CORRELATION OF ELECTROCHEMICAL PROPERTIES WITH STRUCTURE FOR PHENYLSELANYL AZULENES contains Hammet type correlations of electrochemical properties with the structure for phenylselanyl azulenes as well as the calculation of diffusion coefficients for 1-phenylselanyl-azulene derivatives and controlled potential electrolysis experiments on these derivatives which led to the development of reaction mechanisms explaining the electrochemical behavior of these compounds.
CHARACTERIZATION OF ADVANCED MATERIALS BASED ON SELENIUM AZULENE DERIVATIVES AND NANODIAMONDS
8
Chapter 7, entitled ELECTROCHEMICAL FILMS FORMATION FROM PHENYLSELANYL AZULENE DERIVATIVES, contains experimental evidence on the electrochemical formation of some films of selenium azulene derivatives.
Chapter 8, entitled NANOSTRUCTURED ELECTRODE MATERIALS BASED ON NANODIAMOND (ND), summarizes the results obtained on ND based nanostructured electrode materials (spectroscopy studies, ND powder characterization by ATR, FTIR, TEM and XPS, ATR- IR in situ for ND films in ethanol vapors, interactions of ND with the solvents, and electrochemical studies on BDD and ND-BDD-ND in ferrocene solutions.
Part III of the thesis contains the conclusions chapter, in which all results are summarized and reevaluated in the general context; the original contributions are underlined and an outlook of the work is proposed. The thesis ends with a Bibliography chapter containing 162 references.
Acknowledgements
In the elaboration of this paper, I am thankful for the collaboration of some specialists
with exceptional professional and human qualities. I would like to express my gratitude, respect and thanks to Professor Eleonora-
Mihaela UNGUREANU, from the Department of Inorganic Chemistry, Physical Chemistry and Electrochemistry, Faculty of Applied Chemistry and Material Science, POLITEHNICA University of Bucharest, for her professional competence, with which she guided me during the elaboration of the doctoral thesis, as well as for her outstanding human qualities and the patience she supported me with, along these years of doctoral studies.
Sincere thanks to the members of the doctoral commission: Professor Katherine B. HOLT, Doctor Reader Anca COJOCARU, Professor Gabriela STANCIU, for the thorough concern with which my work has been analyzed. I also thank Professor Elena DIACU, president of the doctoral committee.
I thank the members of the coordination committee: Emeritus Professor Olga IULIAN, Emeritus Professor Teodor VIŞAN, Emeritus Professor Aurelia MEGHEA. I would like to express my special thanks to Mrs. Katherine B. HOLT of University College London (UCL) in London - England, for supervising my surface studies, which have been the subject of a chapter in the thesis.
I also thank Professor Vladimir MIRSKY from the Faculty of Ecology and Natural Sciences (Faculty 2), Brandenburg University of Technology Cottbus - Senftenberg Germany, for his help in performing the conductivity measurements by 2 and 4 points technique.
I especially thank the colleagues from the Laboratory of Electrochemical Processes in Organic Solvents (PESO) from the Department of Inorganic Chemistry, Physical Chemistry and Electrochemistry, Faculty of Applied Chemistry and Materials Science: Doctor George BUICĂ, Doctor Eng. Magdalena-Rodica BUJDUVEANU, Doctor Cristina-Andreea AMARANDEI, Mrs. Technician Elena MANEA, and PhD student Georgiana-Luiza ARNOLD, for their professional help, patience and friendship, as well as for their scientific cooperation.
Finally, I would like to thank my family for accepting all the sacrifices required by my involvement in the activities related to the preparation and elaboration of this thesis.
CHARACTERIZATION OF ADVANCED MATERIALS BASED ON SELENIUM AZULENE DERIVATIVES AND NANODIAMONDS
9
Thank you for the financial support provided by the Sectoral Operational Program Human Resources Development, ID-132395 InnoRESEARCH and the UEFISCDI project PN-II-PT-PCCA-2013-4-2151, Azulene based metal detectors for water quality control, contract no. 236/2014. The author
I. ORIGINAL CONTRIBUTIONS CHAPTER 4
EXPERIMENTAL DETAILS ON STUDIES CARRIED OUT 4.1. SET-UP
4.1.1. Set-up for electrochemical studies and film formation Electrochemical investigations were performed using a AUTOLAB 100 potentiostat
(EcoChemie, Utrecht, The Netherlands) or a PGSTAT 12 AUTOLAB, and the amperometric measurements were performed with a Tacussel PRG-DL potentiostat.
Electrochemical experiments were performed using a conventional three-electrode system [95, 96, 97, 98]. For the aqueous medium a calomel saturated electrode was used, as reference electrode and a platinum sheet served as a counter electrode. For the organic medium (in acetonitrile electrolyte) Ag / Ag + electrodes were used as reference (AgNO3 10-2 mol L-1 in CH3CN + 0,1 mol L-1 LiClO4, respectively 0.1 mol L-1 TBAP). RDE experiments were performed using a Tacussel rotating disk electrode at a scan rate of 0.01Vs-1, with rotating rates between 100 and 2000 rpm.
For the initial electrochemical studies the working electrodes were stationary and rotating glassy carbon disks having diameters of 3 mm. The active surface was polished before each experiment with diamond paste (200 μm) and cleaned with pure solvent (acetonitrile). A platinum wire was used as auxiliary electrode. The reference electrode was Ag/10 mM AgNO3 in 0.1 M TBAP, CH3CN. In experiments performed in acetonitrile, the potential was finally referred to the potential of ferrocene/ferricinium redox couple (Fc/Fc+) which in our experimental conditions was +0.07V. All these experiments were performed at the room temperature under argon atmosphere.
4.1.2. Set-up for conductivity measurements Conductivity measurements were performed using a computerized electrochemical
system, AUTOLAB PG STAT 12 coupled to a teflonated electrochemical cell (Fig. 4.1). As a working electrode, a gold interdigitated electrode (ER) was used (Figure 4.2) [115]. The design of this electrode is described in [80]. The external electrodes have a width of 10 μm, the inner electrodes of 5 μm and the distance between the electrodes was 5 μm. The four strips forming the 2 internal electrodes and the 2 external electrodes were deposited on the surface so that the same outer electrode is common for the inner electrodes placed on both sides [78].
A platinum wire was used as counter electrode. The Ag / AgCl electrode deposited on the microchip was used as reference electrode.
The setup for the in situ simultaneous two- and four- point measurements is shown in Fig. 5. 1. An interdigitated four-point electrode covered with a conducting polymer is connected to a source meter (Keithley 2400), which applies 50 mV voltage pulses of alternating polarity between the two outer electrodes, and measured the resulting current. During applied voltage pulses, a high impedance voltmeter (Keithley 617) measured the voltage drop between the inner electrodes. In contrast to usual schemes with applied current pulses, our measurement configuration fixed the applied voltage, thus providing a protection
CHARACTERIZATION OF ADVANCED MATERIALS BASED ON SELENIUM AZULENE DERIVATIVES AND NANODIAMONDS
10
of both polymer and electrodes against damage by too high voltage. The resistance of connecting gold wires, contributing into the resistance measured by two-point technique, was measured directly and subtracted. To control the redox state of the polymer film, a defined electrical potential relative to the saturated calomel electrode placed into the electrolyte was applied to one of the outer electrodes.
4.1.3. Set-up for ATR Mid-infrared spectra were recorded (100 scans) in ATR mode using a Bruker Tensor 27 FTIR spectrometer, fitted with a room temperature DLaTGS detector at 4 cm−1 resolution. The ATR accessory consisted of a diamond prism operating with one reflection. Background spectra were collected prior to each experiment (100 scans). The diamond prism was cleaned between each experiment by washing and wiping the prism, first with methanol, followed by iso-propanol and finally water.Whatman®105 lens cleaning tissues 100 × 150mm(Maidstone, England) were used for cleaning the ATR prism, which was thoroughly dried between each stepwith a streamof N2 (house supply). A Carbolite MTF 1200 horizontal tube furnacewas used to pre-treat and oxidise the ND sample. The temperature control unit and associated electronics were designed and built in house. TEM images were recorded using a Jeol JEM 2100 TEMwith a 200 kV accelerating voltage using a LaB6 filament. Holey carbon film (50, S147A3) coated copper TEM grids were used as the nanoparticle support (Agar Scientific). Characterisation of the ND was carried out using XPS with a Thermo Scientific K-Alpha XPS system and a monochromated Al K-alpha source (E= 1486.6 eV). High resolution XPS spectra were processed and analysed using CasaXPS (version 2.3.16, Casa Software Ltd.). Spectra were fit with Gaussian–Lorentzian curves, the shape of all peaks is assumed to be 70% Gaussian and 30% Lorentzian after subtracting a Shirley background. The full width at half maximum of all deconvoluted peaks was set equal to the main C–C peak but absolute value was not affected [139].
4.2. REAGENTS 4.2.1. Reagents for electrochemical studies and films formation
Acetonitrile (Rathburn, HPLC grade) and tetra nbutylammonium perchlorate (TBAP) from Fluka used as received were the solvent and supporting salt electrolyte,respectively [95, 96, 97, 98]. Azulene-selenium compounds were synthesized according to the procedure previously described [112, 113]. Synthesis of 1-(phenylselanyl)-3-tosylazulene (1c) was performed as follows: to a solution of 1-tosylazulene (141 mg, 0.5 mmol) in methylene chloride (1 ml) introduced in a round-bottom flask equipped with an oily trap for atmosphere exclusion phenylselenyl chloride (96 mg, 0.5 mmol) was added and the solution was magnetically stirred for 2 h at room temperature. Then the temperature ass raised to 45–50 °C when the solvent evaporated. The solid reaction mixture was stirred for another 30 min. Then it was taken in methylene chloride and it was chromatographed on silica gel with petroleum ether (40 °C)- DCM and then with DCM. The first fraction was yellow (unidentified selenium compounds which do not contain azulene structure), the second one, which contains the desired product (183 mg, 84 % yield), was bluish-violet, while the third one was reddish-violet and contained 1-tosylazulene (13 mg). 1-(phenylselanyl)-3-tosylazulene was separated as cyclamen crystals, m. p. 136 °C.
4.2.2. Reagents for conductivity measurements (6-methylazulene-1-yl) (phenyl) selane was prepared according to the litterature and
was used for conductivity measurements. The other reagents (acetonitrile, tetra-butyl-
CHARACTERIZATION OF ADVANCED MATERIALS BASED ON SELENIUM AZULENE DERIVATIVES AND NANODIAMONDS
11
ammonium perchlorate, sodium citrate, hydrochloric acid and sodium chloride) were used without further purification [115].
4.2.3. Reagents for studies using ATR ND (particle size 10 nm,>97%) was purchased from Sigma-Aldrich (Dorset, England).
Ethanol (>99.5%) was purchased from Merck (Darmstadt, Germany).
4.3. PROCEDURE 4.3.1. Procedure for electrochemical studies and films formation
Electrochemical experiments have been conducted in an electrochemical three-electrode cell under argon atmosphere at 25 °C, using a PGSTAT 12 AUTOLAB potentiostat [95, 96, 97, 98]. The working electrode was a glassy carbon disk (3 mm in diameter from Metrohm) for CV, DPV, and RDE, or a glassy carbon plate of about 2.8 cm2 for CPE. Ag/10 mM AgNO3 in acetonitrile + 0.1 M TBAP system was used as reference electrode, and a platinum sieve served as counter electrode. The working electrode has been polished with 0.1 μm diamond paste before each experiment. The potentials were referred to the potential of ferrocene/ferricinium (Fc/Fc+) couple, which had a value of 0.07 V in our experimental conditions. Anodic and cathodic DPV, CV, and RDE curves were individually recorded, starting from 0 V. CV curves were generally recorded at a scan rate of 0.1 V/s or at various scan rates (0.1–1 V/s), when studying this influence. DPV curves were recorded at 0.01 V/s with a lse height of 0.025 V and a step time of 0.2 s. RDE experiments were recorded at 0.01 V/s with rotation rates between 500 and 2000 rpm. CPE experiments have been performed in a thermo]static three-electrode cell at 25 °C on the glassy carbon plate under argon atmosphereunder mechanical stirring. During the electrolyses, CVand DPV curves have been recorded on a glassy carbon disk (3 mm diameter from CH Instruments) working electrode, and the reaction mixture has been analyzed by thinlayer chromatography (TLC) on silica gel plates, using mixtures of petroleum ether and dichloromethane (DCM) as eluent. The final reaction mixture was put on water, extracted in DCM, washed, and separated by column chromatography on silica gel using mixtures of petroleum ether and DCM as mobile phases. The eluted fractions have been examined by TLC and mass spectrometry (MS).
Electrochemical experiments on ND and ND-BDD were performed in an electrochemical cell at 25 ° C. The work electrode was a BDD disk (3 mm in diameter from UCL) for CV, DPV and RDE. The Ag / 10 mM AgNO3 + 0.1 M TBAP system in acetonitrile was used as a reference electrode and a platinum sieve served as counterelectrode. The working electrode was obtained by drop coating; 1 microliter of 100nm ND suspension in bidistilled water on a BDD (fixed on a polystyrene support) cleansed with a 0.1 μm diamond paste was dropped before each experiment. The electrode was left to dry about 12 hours. DPV and CV anode and cathode curves were individually recorded. In general, CV curves were recorded at a scan rate of 0.01 V / s or at different scan rates (0.01 - 0.5 V / s) when this influence was studied. The DPV curves were recorded at 0.01 V / s, with a pulse height of 0.025 V and a time increment of 0.2 s.
4.3.2. Procedure for conductivity measurements On the interdigitated four contact gold electrode (Fig. 1A) was deposited the reference
electrode (Fig.1B), Ag/ AgCl. The deposition of the reference electrode on the microchip was achieved by [115]:
CHARACTERIZATION OF ADVANCED MATERIALS BASED ON SELENIUM AZULENE DERIVATIVES AND NANODIAMONDS
12
I. immersing the chip in the solution of AgNO3 (10 mM) at constant current I of -5.10-6 A for a time t of 1800s; Ag deposit was observed under the microscope (gray ashes); II. immersing the electrode obtained at point I in 0.1 M HCl solution, and its galvanostatic polarization at i = 5.10-6 A for t = 1200s; AgCl was viewed under the microscope as a bright gray deposit.
After washing with distilled water, the electrode was dried with an air blower. The aqueous buffer solutions for conductivity measurements were freshly prepared
before each experiment according to known recipes from sodium citrate, 0.1 M hydrochloric acid and sodium chloride solutions. The films deposited on the working electrode were examined with Nikon Eclipse LV 100 microscope.
4.3.3. Procedure for ATR As received ND powder was treated in a furnace at 425 °C for 4h (including
temperature ramp times, which were set at 10 °C min−1) in air prior to all experiments [139]. This was to remove any sp2 graphitic carbon from the surface and maximise the number of oxygen terminating functional groups [128]. A ND suspension was prepared by adding the oxidised ND (1.50 μg) to deionised water (1.0 ml). The suspension was shaken and sonicated at low power, but no attempt was made to break up the primary aggregates or to produce a stable colloid. The clean, dry ATR-prism was drop-coated with the ND suspension (1 μL), which was left to dry in air to form an adherent layer before being characterised. It is difficult to determine the thickness of the resulting ND layer, but drop-coating onto similar surfaces produces relatively thick multilayers of ND powder aggregates of thickness N10 μm, as estimated from optical microscopy. As the IR evanescentwave penetrates up to 3 μm above the diamond ATR prism, it therefore probes only the ND powder layer and not the region above. A glass gas cell was placed over the sample and dry air (1 L min−1) passed over the ND layer for 1 h. Dry air was prepared by passing the air from the in-house compressed air line through a filter and a desiccant. An IR spectrum was taken of the dry ND layer and this served as the background for all subsequent spectra. The air line was then switched to bubble through a solution of ethanol before entering the gas cell, thus passing ethanol vapour over the surface of the ND layer. The concentration of ethanol in the gas flow was not measured but the vapour is assumed to be close to saturated with ethanol. IR spectra were then recorded every 90 s for a period of 2 h.
CHAPTER 5 STUDIES ON ELECTROCHEMICAL PROPERTIES OF SOME
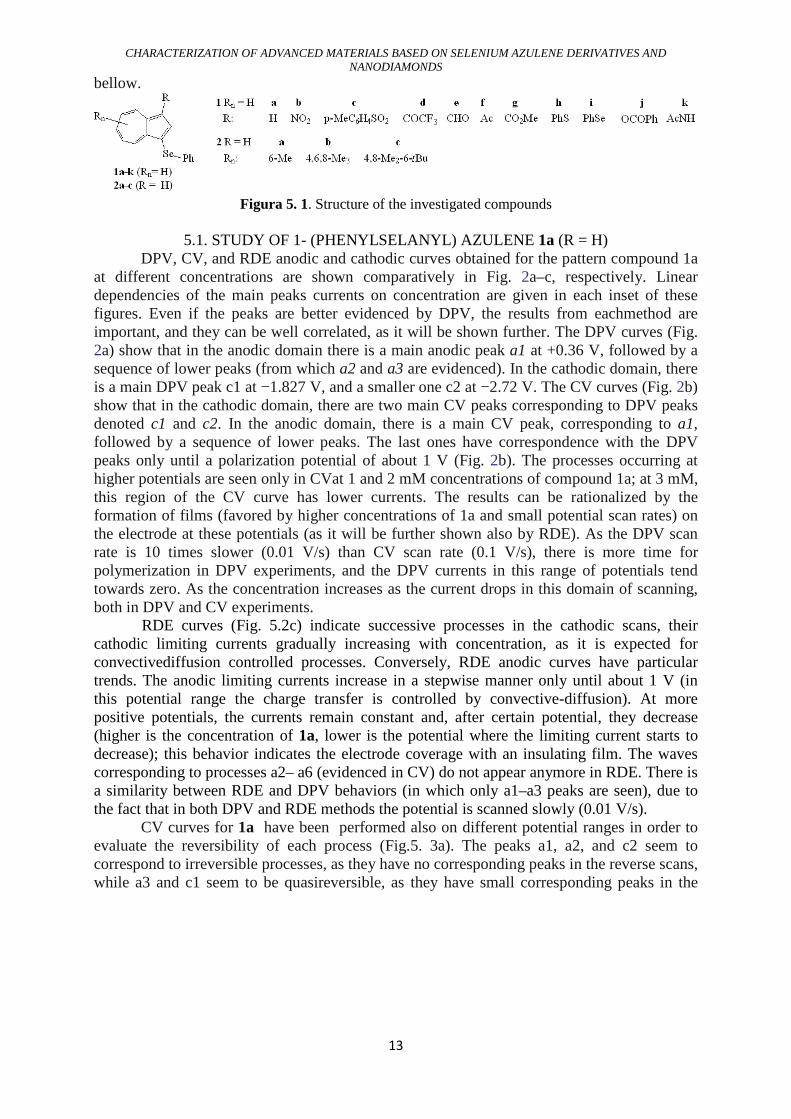
PHENYLSELANYL AZULENES A detailed electrochemical characterization of all 1-phenylselanyl azulenes from Fig. 1
has been performed in similar ways by CV, DPV, and RDE. Anodic and cathodic curves have been recorded by each technique for various concentrations of 1-phenylselanyl azulene (0.5 mM) in acetonitrile (CH3CN) with dissolved TBAP (0.1 M). The reversible (r), irreversible (i), or quasi reversible (q) character of each process has been assigned from the CV curves, and the diffusion coefficients have been evaluated. DPV curves enabled setting the actual number of processes, DPV curves permitted the best evaluation of the peak potentials, while the number of electrons involved in each process has been estimated using DPV and RDE curves. The results obtained for all compounds from Fig. 1 are summarized in Tables 1 and 2 and will be further discussed. Details about some of the investigated compounds are given
CHARACTERIZATION OF ADVANCED MATERIALS BASED ON SELENIUM AZULENE DERIVATIVES AND NANODIAMONDS
13
bellow.
Figura 5. 1. Structure of the investigated compounds
5.1. STUDY OF 1- (PHENYLSELANYL) AZULENE 1a (R = H)
DPV, CV, and RDE anodic and cathodic curves obtained for the pattern compound 1a at different concentrations are shown comparatively in Fig. 2a–c, respectively. Linear dependencies of the main peaks currents on concentration are given in each inset of these figures. Even if the peaks are better evidenced by DPV, the results from eachmethod are important, and they can be well correlated, as it will be shown further. The DPV curves (Fig. 2a) show that in the anodic domain there is a main anodic peak a1 at +0.36 V, followed by a sequence of lower peaks (from which a2 and a3 are evidenced). In the cathodic domain, there is a main DPV peak c1 at −1.827 V, and a smaller one c2 at −2.72 V. The CV curves (Fig. 2b) show that in the cathodic domain, there are two main CV peaks corresponding to DPV peaks denoted c1 and c2. In the anodic domain, there is a main CV peak, corresponding to a1, followed by a sequence of lower peaks. The last ones have correspondence with the DPV peaks only until a polarization potential of about 1 V (Fig. 2b). The processes occurring at higher potentials are seen only in CVat 1 and 2 mM concentrations of compound 1a; at 3 mM, this region of the CV curve has lower currents. The results can be rationalized by the formation of films (favored by higher concentrations of 1a and small potential scan rates) on the electrode at these potentials (as it will be further shown also by RDE). As the DPV scan rate is 10 times slower (0.01 V/s) than CV scan rate (0.1 V/s), there is more time for polymerization in DPV experiments, and the DPV currents in this range of potentials tend towards zero. As the concentration increases as the current drops in this domain of scanning, both in DPV and CV experiments.
RDE curves (Fig. 5.2c) indicate successive processes in the cathodic scans, their cathodic limiting currents gradually increasing with concentration, as it is expected for convectivediffusion controlled processes. Conversely, RDE anodic curves have particular trends. The anodic limiting currents increase in a stepwise manner only until about 1 V (in this potential range the charge transfer is controlled by convective-diffusion). At more positive potentials, the currents remain constant and, after certain potential, they decrease (higher is the concentration of 1a, lower is the potential where the limiting current starts to decrease); this behavior indicates the electrode coverage with an insulating film. The waves corresponding to processes a2– a6 (evidenced in CV) do not appear anymore in RDE. There is a similarity between RDE and DPV behaviors (in which only a1–a3 peaks are seen), due to the fact that in both DPV and RDE methods the potential is scanned slowly (0.01 V/s).
CV curves for 1a have been performed also on different potential ranges in order to evaluate the reversibility of each process (Fig.5. 3a). The peaks a1, a2, and c2 seem to correspond to irreversible processes, as they have no corresponding peaks in the reverse scans, while a3 and c1 seem to be quasireversible, as they have small corresponding peaks in the
CHARACTERIZATION OF ADVANCED MATERIALS BASED ON SELENIUM AZULENE DERIVATIVES AND NANODIAMONDS
14
reverse scans. When scanning with increased scan rates (in order to check the reversibility of the peak a1), in the reverse scans, two peaks a1′ and a1″ are revealed (Fig. 5.3B). This behavior could be caused by a complex process occurring in this potential range, preceding the film formation, according to an ECE mechanism, as it has been previously shown for other azulenes [116]. Also for c1, the corresponding peaks are c1′ and c1″, which increase with the scan rate, showing also a complex behavior. The main peaks’ currents increase linearly with the square root of the scan rate (inset of Fig. 5.3B), having similar slopes of about 330 μA · (V/s)−1/2), indicating processes with similar complexity.
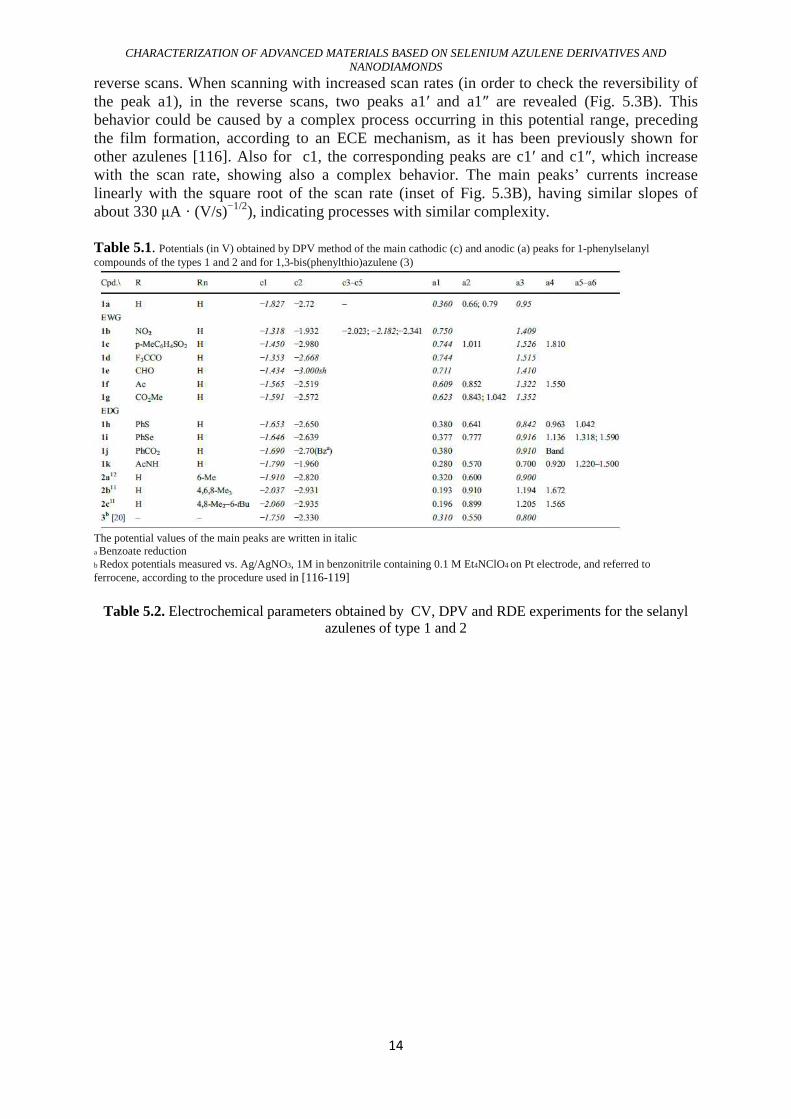
Table 5.1. Potentials (in V) obtained by DPV method of the main cathodic (c) and anodic (a) peaks for 1-phenylselanyl compounds of the types 1 and 2 and for 1,3-bis(phenylthio)azulene (3)
The potential values of the main peaks are written in italic a Benzoate reduction b Redox potentials measured vs. Ag/AgNO3, 1M in benzonitrile containing 0.1 M Et4NClO4 on Pt electrode, and referred to ferrocene, according to the procedure used in [116-119]
Table 5.2. Electrochemical parameters obtained by CV, DPV and RDE experiments for the selanyl
azulenes of type 1 and 2
CHARACTERIZATION OF ADVANCED MATERIALS BASED ON SELENIUM AZULENE DERIVATIVES AND NANODIAMONDS
15
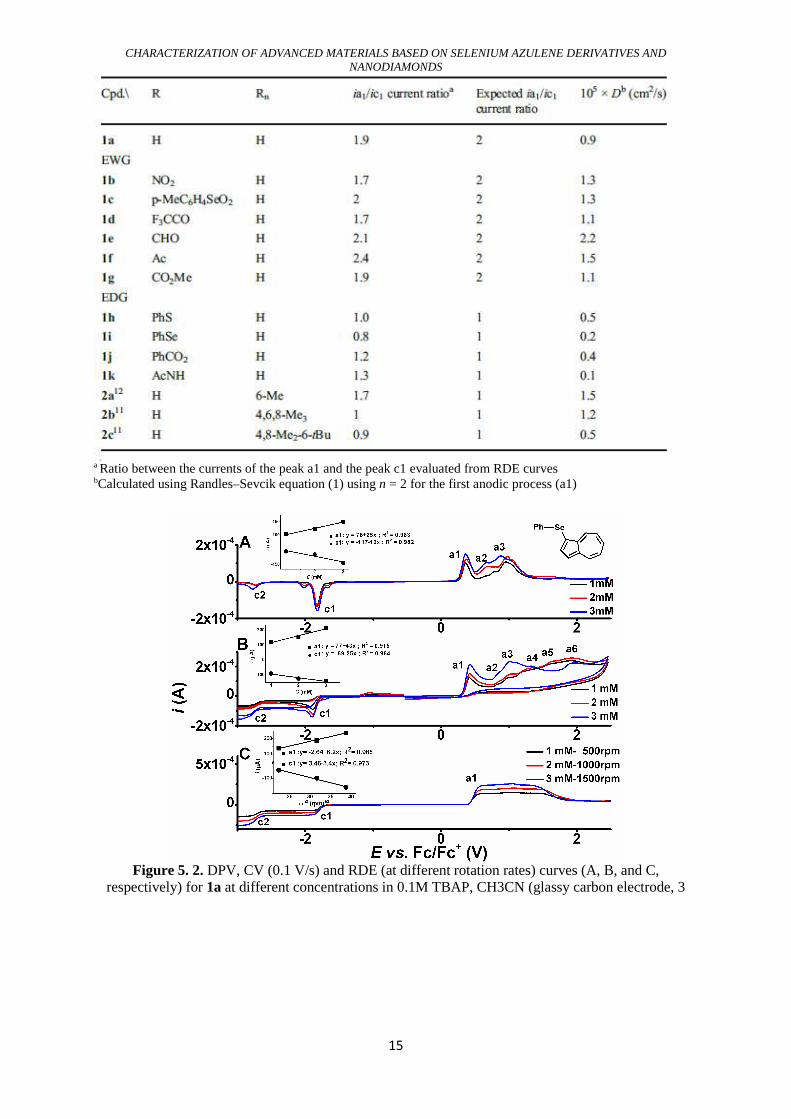
a Ratio between the currents of the peak a1 and the peak c1 evaluated from RDE curves
bCalculated using Randles–Sevcik equation (1) using n = 2 for the first anodic process (a1)
Figure 5. 2. DPV, CV (0.1 V/s) and RDE (at different rotation rates) curves (A, B, and C,
respectively) for 1a at different concentrations in 0.1M TBAP, CH3CN (glassy carbon electrode, 3
CHARACTERIZATION OF ADVANCED MATERIALS BASED ON SELENIUM AZULENE DERIVATIVES AND NANODIAMONDS
16
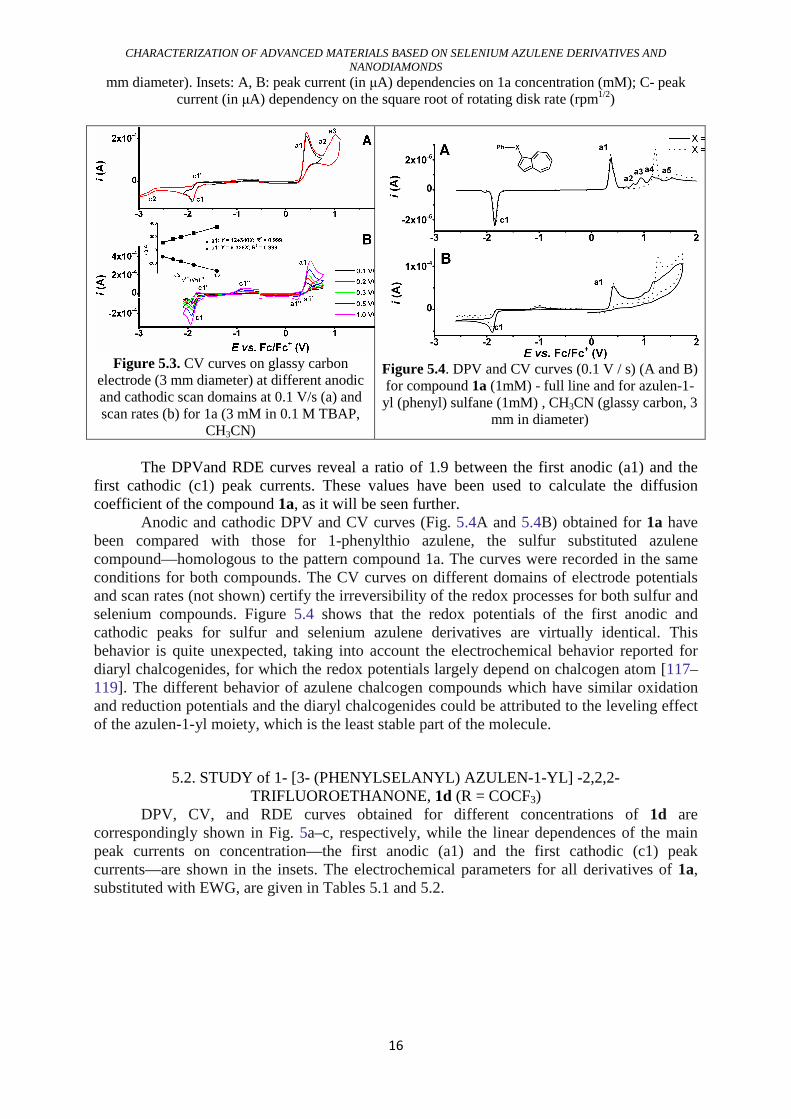
mm diameter). Insets: A, B: peak current (in μA) dependencies on 1a concentration (mM); C- peak current (in μA) dependency on the square root of rotating disk rate (rpm1/2)
Figure 5.3. CV curves on glassy carbon electrode (3 mm diameter) at different anodic and cathodic scan domains at 0.1 V/s (a) and scan rates (b) for 1a (3 mM in 0.1 M TBAP,
CH3CN)
Figure 5.4. DPV and CV curves (0.1 V / s) (A and B) for compound 1a (1mM) - full line and for azulen-1-yl (phenyl) sulfane (1mM) , CH3CN (glassy carbon, 3
mm in diameter)
The DPVand RDE curves reveal a ratio of 1.9 between the first anodic (a1) and the
first cathodic (c1) peak currents. These values have been used to calculate the diffusion coefficient of the compound 1a, as it will be seen further.
Anodic and cathodic DPV and CV curves (Fig. 5.4A and 5.4B) obtained for 1a have been compared with those for 1-phenylthio azulene, the sulfur substituted azulene compound—homologous to the pattern compound 1a. The curves were recorded in the same conditions for both compounds. The CV curves on different domains of electrode potentials and scan rates (not shown) certify the irreversibility of the redox processes for both sulfur and selenium compounds. Figure 5.4 shows that the redox potentials of the first anodic and cathodic peaks for sulfur and selenium azulene derivatives are virtually identical. This behavior is quite unexpected, taking into account the electrochemical behavior reported for diaryl chalcogenides, for which the redox potentials largely depend on chalcogen atom [117–119]. The different behavior of azulene chalcogen compounds which have similar oxidation and reduction potentials and the diaryl chalcogenides could be attributed to the leveling effect of the azulen-1-yl moiety, which is the least stable part of the molecule.
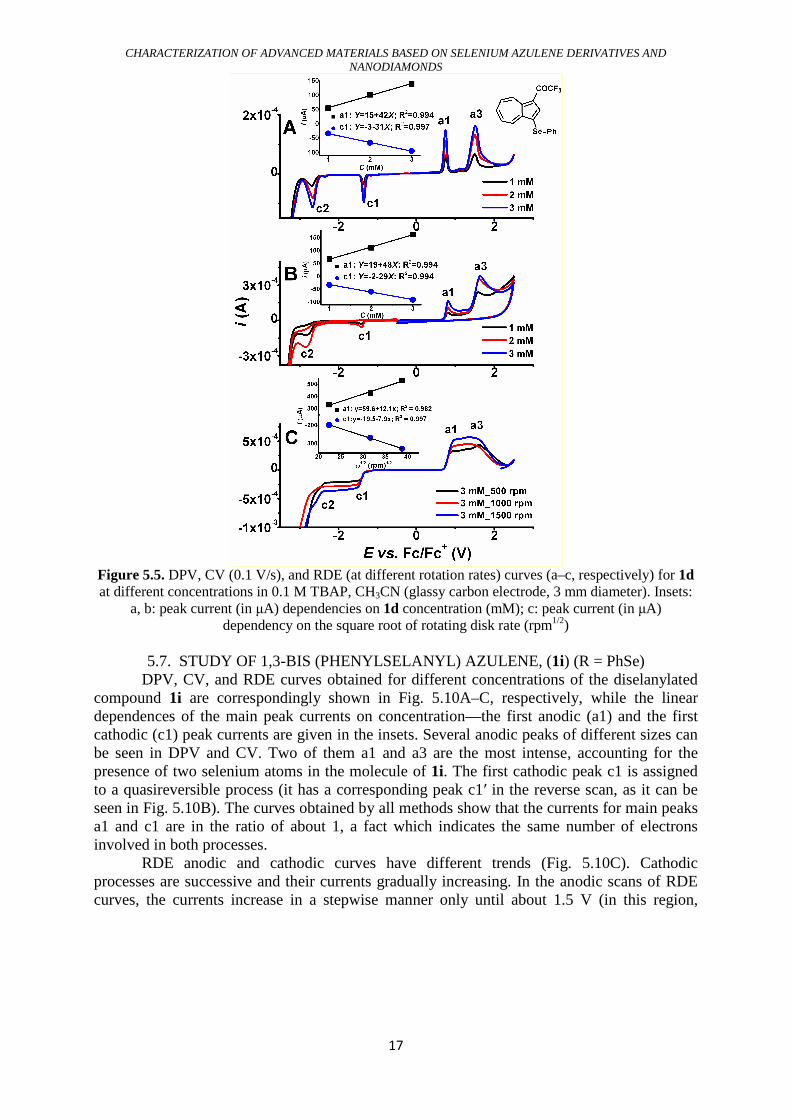
5.2. STUDY of 1- [3- (PHENYLSELANYL) AZULEN-1-YL] -2,2,2-TRIFLUOROETHANONE, 1d (R = COCF3)
DPV, CV, and RDE curves obtained for different concentrations of 1d are correspondingly shown in Fig. 5a–c, respectively, while the linear dependences of the main peak currents on concentration—the first anodic (a1) and the first cathodic (c1) peak currents—are shown in the insets. The electrochemical parameters for all derivatives of 1a, substituted with EWG, are given in Tables 5.1 and 5.2.
CHARACTERIZATION OF ADVANCED MATERIALS BASED ON SELENIUM AZULENE DERIVATIVES AND NANODIAMONDS
17
Figure 5.5. DPV, CV (0.1 V/s), and RDE (at different rotation rates) curves (a–c, respectively) for 1d at different concentrations in 0.1 M TBAP, CH3CN (glassy carbon electrode, 3 mm diameter). Insets:
a, b: peak current (in μA) dependencies on 1d concentration (mM); c: peak current (in μA) dependency on the square root of rotating disk rate (rpm1/2)
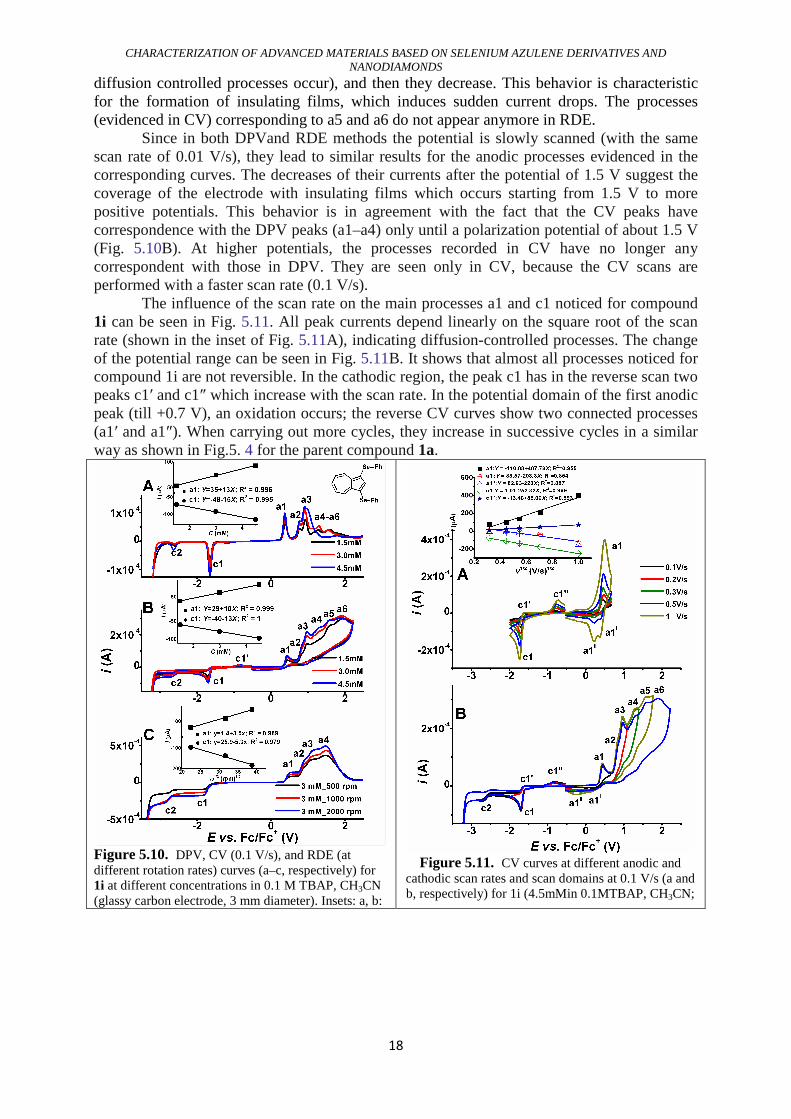
5.7. STUDY OF 1,3-BIS (PHENYLSELANYL) AZULENE, (1i) (R = PhSe)
DPV, CV, and RDE curves obtained for different concentrations of the diselanylated compound 1i are correspondingly shown in Fig. 5.10A–C, respectively, while the linear dependences of the main peak currents on concentration—the first anodic (a1) and the first cathodic (c1) peak currents are given in the insets. Several anodic peaks of different sizes can be seen in DPV and CV. Two of them a1 and a3 are the most intense, accounting for the presence of two selenium atoms in the molecule of 1i. The first cathodic peak c1 is assigned to a quasireversible process (it has a corresponding peak c1′ in the reverse scan, as it can be seen in Fig. 5.10B). The curves obtained by all methods show that the currents for main peaks a1 and c1 are in the ratio of about 1, a fact which indicates the same number of electrons involved in both processes.
RDE anodic and cathodic curves have different trends (Fig. 5.10C). Cathodic processes are successive and their currents gradually increasing. In the anodic scans of RDE curves, the currents increase in a stepwise manner only until about 1.5 V (in this region,
CHARACTERIZATION OF ADVANCED MATERIALS BASED ON SELENIUM AZULENE DERIVATIVES AND NANODIAMONDS
18
diffusion controlled processes occur), and then they decrease. This behavior is characteristic for the formation of insulating films, which induces sudden current drops. The processes (evidenced in CV) corresponding to a5 and a6 do not appear anymore in RDE.
Since in both DPVand RDE methods the potential is slowly scanned (with the same scan rate of 0.01 V/s), they lead to similar results for the anodic processes evidenced in the corresponding curves. The decreases of their currents after the potential of 1.5 V suggest the coverage of the electrode with insulating films which occurs starting from 1.5 V to more positive potentials. This behavior is in agreement with the fact that the CV peaks have correspondence with the DPV peaks (a1–a4) only until a polarization potential of about 1.5 V (Fig. 5.10B). At higher potentials, the processes recorded in CV have no longer any correspondent with those in DPV. They are seen only in CV, because the CV scans are performed with a faster scan rate (0.1 V/s).
The influence of the scan rate on the main processes a1 and c1 noticed for compound 1i can be seen in Fig. 5.11. All peak currents depend linearly on the square root of the scan rate (shown in the inset of Fig. 5.11A), indicating diffusion-controlled processes. The change of the potential range can be seen in Fig. 5.11B. It shows that almost all processes noticed for compound 1i are not reversible. In the cathodic region, the peak c1 has in the reverse scan two peaks c1′ and c1″ which increase with the scan rate. In the potential domain of the first anodic peak (till +0.7 V), an oxidation occurs; the reverse CV curves show two connected processes (a1′ and a1″). When carrying out more cycles, they increase in successive cycles in a similar way as shown in Fig.5. 4 for the parent compound 1a.
Figure 5.10. DPV, CV (0.1 V/s), and RDE (at different rotation rates) curves (a–c, respectively) for 1i at different concentrations in 0.1 M TBAP, CH3CN (glassy carbon electrode, 3 mm diameter). Insets: a, b:
Figure 5.11. CV curves at different anodic and
cathodic scan rates and scan domains at 0.1 V/s (a and b, respectively) for 1i (4.5mMin 0.1MTBAP, CH3CN;
CHARACTERIZATION OF ADVANCED MATERIALS BASED ON SELENIUM AZULENE DERIVATIVES AND NANODIAMONDS
19
peak current (in μA) dependencies on 1i concentration (mM); c: peak current (in μA) dependency on the square root of rotating disk rate (rpm1/2) [95]
glassy carbon electrode, 3 mm diameter)
CHAPTER 6
CORRELATION OF ELECTROCHEMICAL PROPERTIES WITH STRU CTURE FOR PHENYLSELANYL AZULENES
6.1. HAMMET TYPE CORRELATIONS FOR 1-PHENYL SELANYLAZULENE DERIVATIVES
When analyzing the electrochemical curves obtained for the derivatives of 1a (shown in Fig. 5.2 – 5.13), it can be concluded that the substitution modifies the redox properties of the pattern compound 1a (shown in Fig.5. 1). The results concerning the potentials of the main peaks are summarized in Table 6.1, while those for currents in Table 5.2. The compounds of each type have been separated by a free space in all tables [95].
The compounds of type 1 (1b–1g), where azulene is substituted at the 5-membered ringwith substituents with electron withdrawing effect (EWG: nitro, p-tosyl, trifluoroacetyl, formyl, acetyl, carboxymethyl, respectively) constitute the first group; in the second group (1h–1k), there are the compounds with substituents with +E electron donating effect (EDG: phenylthio, phenylselanyl, oxybenzoyl, aminoacetyl). The characteristics collected in Tables 1 and 2 are obtained from DPVexperiments performed in this paper for the selanyl azulenes of types 1 and 2, or they are calculated from the results previously published by our group [112, 114, 115].
Looking to the potentials from Table 6. 1, it can be seen that the substitution at the 5-membered ring influences these values as follows: EWGs increase the potential of the oxidation peaks and decrease the potential of the reduction peaks. For instance, the potential of the 1st oxidation peak a1 appears at 0.75, 0.744, 0.744, 0.711, 0.609, and 0.623 V in compounds 1b–1g, respectively, instead of 0.36 V (in 1a), while the peak c1 appears at −1.450, −1.353, −1.434, −1.565, and −1.591 V instead of −1.827 V (in 1a). Conversely, EDGs slightly affect the oxidation potentials, but decrease the absolute value of the reduction potential. For instance, in compounds of type 1 (1h–1k), the peak a1 appears at potentials close to 1a (0.38, 0.377, 0.370, 0.28 V, respectively), and the peak c1 appears at −1.653, −1.646, −1.690, and −1.790 V instead of −1.827 V (in 1a).
The substitution to the 7-membered ring with alkyl groups in compounds of type 2 (2a–2c) led to a decrease of the oxidation potentials and to an increase of the reduction potentials. For instance, the peak a1 appears at 0.32, 0.193, and 0.196 V, respectively, instead of 0.36V (in 1a), and the peak c1 appears at −1.910, −2.037, and −2.060 V, respectively, instead of −1.827 V (in 1a). This behavior evidenced by the variation of the potentials of the 1st oxidation peak, can be corroborated with their low stability in atmospheric condition; these compounds are stable due to the lattice energy of their crystals.
The electrochemical parameters concerning the current values obtained by CV, DPV, and RDE experiments for the selanyl azulenes of types 1 and 2 given in Table 2 show a1/c1 current ratios of about 2:1 for the compounds of type 1 substituted with EWG (1b–1g). In the case of 1b, this ratio is 1.7; the difference is due to the interference of NO2 group reduction. In
CHARACTERIZATION OF ADVANCED MATERIALS BASED ON SELENIUM AZULENE DERIVATIVES AND NANODIAMONDS
20
the case of 1f, this ratio is higher (2.4) than expected (2), being affected by the oxidation of acetyl group.
For the compounds 1h–1k, substituted with EDGs, a1/c1 current ratios have been found of about 1:1. The peculiarly disubstituted compounds 1i and 1h, with PhSe, respectively, PhS groups in position 3 of the azulene 5-membered ring have a1/c1 current ratios of about 1:1 (1.0 and 0.8), and the same number of electrons (2) involved in the first oxidation peak a1, showing that there is no essential difference between these chalcogen compounds.
In compounds of type 2 (2a, 2b, 2c), where azulene is substituted at the 7-membered ring with EDGs, a1/c1 current ratios have values of about 1, with the exception of 2a which has 1.7. The reason for this is not quite clear. The ratio can be increased due to the possible over oxidation of the radical cation or dication to the side chain. 6-Me group also can be partially oxidized to 6-CH2OH, which increases the ratio a1/ c1 for compound 2a (to 1.7).
6.2. CALCULATION OF DIFFUSION COEFFICIENTS FOR 1-PHENYLSELANYL-
AZULENE DERIVATIVES The diffusion coefficients D for the investigated 1- phenylselanyl azulenes have been
calculated at room temperature (298 K) from CV data, using Randles–Sevcik equation (1), where ip = peak current in A, n = number of electrons transferred in the redox process, A = electrode area in cm2, D = diffusion coefficient in cm2/s, C = concentration in mole/cm3, and ν = scan rate in V/s.
ip= 268,600·n3/2AD1/2C v 1/2 (1)
CV data for each compound allowed the calculation of a1 peak current slopes vs. the
square root of the scan rate (ip/v1/2). The value of the number of electrons transferred in the anodic peak a1 (n in Randles–Sevcik equation) has been taken 2, in agreement with the proposed mechanism (see further). The results for D calculation are given in Table 2. They show that the substituents have influence on the value of diffusion coefficient D.
The compounds of type 1 (1b–1k), where azulene is substituted at the 5-membered ring with EWG, such as nitro, p-tosyl, trifluoroacetyl, formyl, acetyl, and carboxymethyl, have D values of the same order of magnitude (1 × 10⁻⁵– 2.2 × 10⁻⁵ cm2/s) as 1a (0.9 × 10⁻⁵ cm2/s), while those substituted with EDG, such as phenylthio, phenyl selenium, oxybenzoyl, or aminoacetyl in 1h, 1i, 1j, and 1k, respectively, have smaller values of D (0.1 × 10⁻⁵–0. × 10−5 cm2/s) than 1a. The comparison of disubstituted compounds 1i and 1h, with PhSe, respectively, PhS groups in position 3 of the azulene 5- membered ring shows that D has the same order ofmagnitude, being almost doubled for S than for Se. This fact is in agreement with the weight of their molecular masses in the substituted compounds, and indicates that there is no essential difference between these chalcogen compounds.
In compounds of type 2 (2a, 2b, 2c), where azulene is substituted at the 7-membered ring with EDG, D has the same order of magnitude (0.5 × 10⁻⁵–1.5 × 10⁻⁵ cm2/s) as 1a.
Generally, Table 6.2 shows the EWGs increase the value of D, while EDGs decrease its value. These results could be rationalized taking into account the push-pull effect of the azulenic system. It is increased by substitution with EWG because these groups enhance the molecule polarity by means of A type limiting structure, as seen below, where X is CF3 (in
CHARACTERIZATION OF ADVANCED MATERIALS BASED ON SELENIUM AZULENE DERIVATIVES AND NANODIAMONDS
21
1d), H (in 1e), CH3 (in 1f), and OCH3 (in 1g). On the contrary, the substitution with EDG decrease the azulene polarity, as expected from the below B limiting structure, leading to a decrease of the diffusion coefficient (and making the azulene system less stable), where Y is a heteroatom (S, Se,O, N in 1h, 1i, 1j, 1k, respectively) and Z is phenyl in 1h, 1i, or COPh in 1j, and COCH3 in 1k.
6.3. EXPERIMENTS BY CONTROLLED POTENTIAL ELECTROLYSIS ON 1-
PHENYLSELANYL -AZULENES Controlled potential electrolyses have been experienced only for two derivatives, 1a
and 1c, in order to identify the products. Compound 1c has been synthesized because its azulene structure is more stable than that of compound 1a, due to the p-tosyl EWG. Controlled potential electrolyzes have been performed in 0.1 M TBAP, CH3CN solutions at the potential of the first anodic peak, a1, for oxidations, and of the first cathodic peak, c1, for reductions. They have been monitored by TLC. CV and DPV curves in anodic and cathodic scans have been also recorded. The final mixtures have been separated by column chromatography and analyzed by MS-ESI method. Some azulene compounds resulted during electrolyses are not very stable in solution, so that the results are not always obvious.
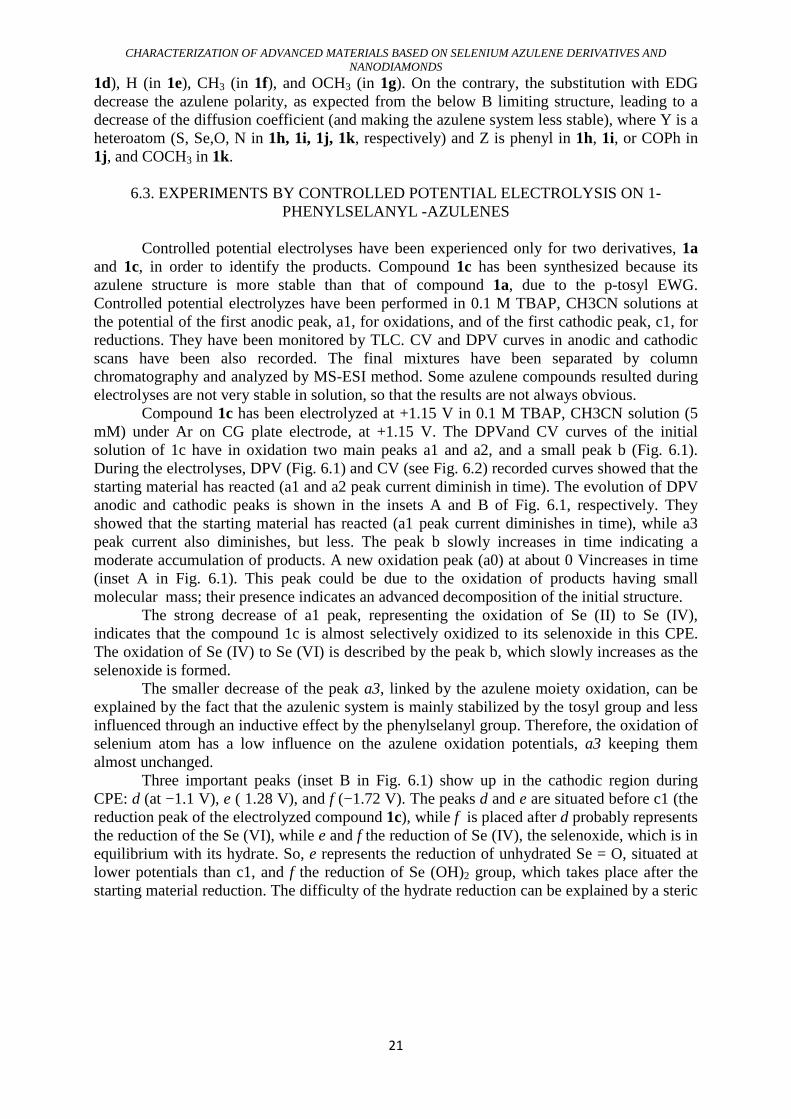
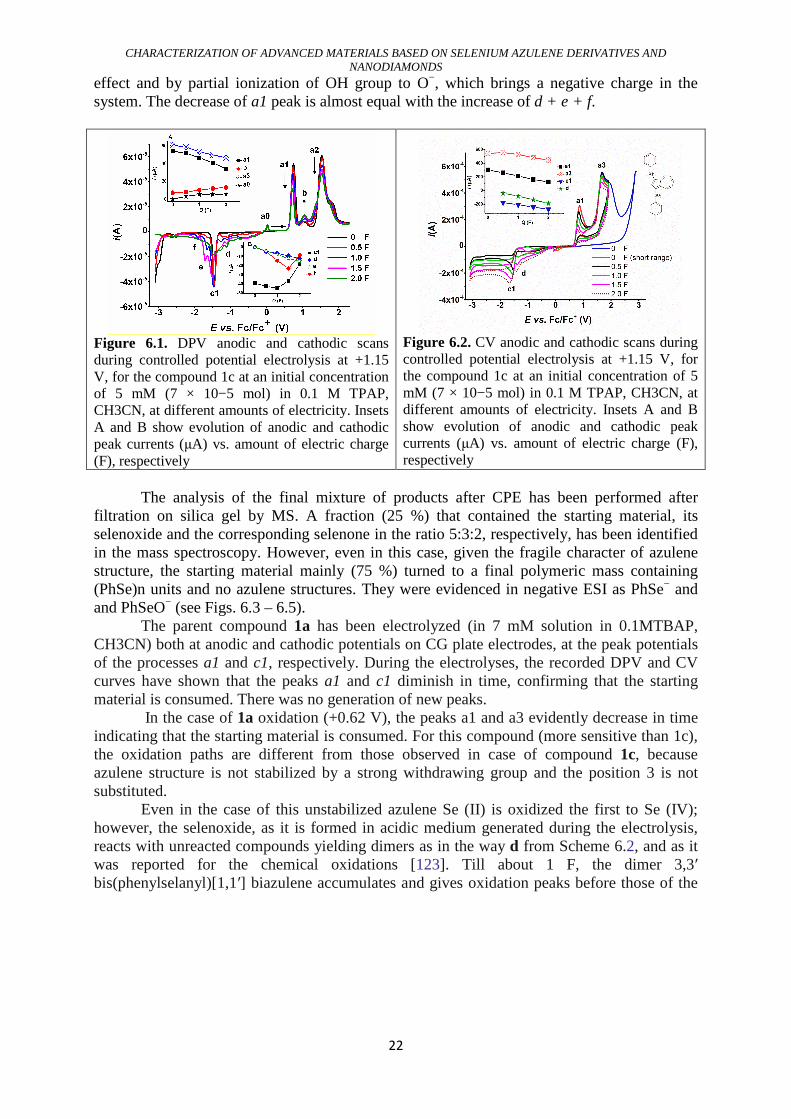
Compound 1c has been electrolyzed at +1.15 V in 0.1 M TBAP, CH3CN solution (5 mM) under Ar on CG plate electrode, at +1.15 V. The DPVand CV curves of the initial solution of 1c have in oxidation two main peaks a1 and a2, and a small peak b (Fig. 6.1). During the electrolyses, DPV (Fig. 6.1) and CV (see Fig. 6.2) recorded curves showed that the starting material has reacted (a1 and a2 peak current diminish in time). The evolution of DPV anodic and cathodic peaks is shown in the insets A and B of Fig. 6.1, respectively. They showed that the starting material has reacted (a1 peak current diminishes in time), while a3 peak current also diminishes, but less. The peak b slowly increases in time indicating a moderate accumulation of products. A new oxidation peak (a0) at about 0 Vincreases in time (inset A in Fig. 6.1). This peak could be due to the oxidation of products having small molecular mass; their presence indicates an advanced decomposition of the initial structure.
The strong decrease of a1 peak, representing the oxidation of Se (II) to Se (IV), indicates that the compound 1c is almost selectively oxidized to its selenoxide in this CPE. The oxidation of Se (IV) to Se (VI) is described by the peak b, which slowly increases as the selenoxide is formed.
The smaller decrease of the peak a3, linked by the azulene moiety oxidation, can be explained by the fact that the azulenic system is mainly stabilized by the tosyl group and less influenced through an inductive effect by the phenylselanyl group. Therefore, the oxidation of selenium atom has a low influence on the azulene oxidation potentials, a3 keeping them almost unchanged.
Three important peaks (inset B in Fig. 6.1) show up in the cathodic region during CPE: d (at −1.1 V), e ( 1.28 V), and f (−1.72 V). The peaks d and e are situated before c1 (the reduction peak of the electrolyzed compound 1c), while f is placed after d probably represents the reduction of the Se (VI), while e and f the reduction of Se (IV), the selenoxide, which is in equilibrium with its hydrate. So, e represents the reduction of unhydrated Se = O, situated at lower potentials than c1, and f the reduction of Se (OH)2 group, which takes place after the starting material reduction. The difficulty of the hydrate reduction can be explained by a steric
CHARACTERIZATION OF ADVANCED MATERIALS BASED ON SELENIUM AZULENE DERIVATIVES AND NANODIAMONDS
22
effect and by partial ionization of OH group to O−, which brings a negative charge in the system. The decrease of a1 peak is almost equal with the increase of d + e + f.
Figure 6.1. DPV anodic and cathodic scans during controlled potential electrolysis at +1.15 V, for the compound 1c at an initial concentration of 5 mM (7 × 10⁻⁵ mol) in 0.1 M TPAP, CH3CN, at different amounts of electricity. Insets A and B show evolution of anodic and cathodic peak currents (μA) vs. amount of electric charge (F), respectively
Figure 6.2. CV anodic and cathodic scans during controlled potential electrolysis at +1.15 V, for the compound 1c at an initial concentration of 5 mM (7 × 10⁻⁵ mol) in 0.1 M TPAP, CH3CN, at different amounts of electricity. Insets A and B show evolution of anodic and cathodic peak currents (μA) vs. amount of electric charge (F), respectively
The analysis of the final mixture of products after CPE has been performed after
filtration on silica gel by MS. A fraction (25 %) that contained the starting material, its selenoxide and the corresponding selenone in the ratio 5:3:2, respectively, has been identified in the mass spectroscopy. However, even in this case, given the fragile character of azulene structure, the starting material mainly (75 %) turned to a final polymeric mass containing (PhSe)n units and no azulene structures. They were evidenced in negative ESI as PhSe− and and PhSeO− (see Figs. 6.3 – 6.5).
The parent compound 1a has been electrolyzed (in 7 mM solution in 0.1MTBAP, CH3CN) both at anodic and cathodic potentials on CG plate electrodes, at the peak potentials of the processes a1 and c1, respectively. During the electrolyses, the recorded DPV and CV curves have shown that the peaks a1 and c1 diminish in time, confirming that the starting material is consumed. There was no generation of new peaks.
In the case of 1a oxidation (+0.62 V), the peaks a1 and a3 evidently decrease in time indicating that the starting material is consumed. For this compound (more sensitive than 1c), the oxidation paths are different from those observed in case of compound 1c, because azulene structure is not stabilized by a strong withdrawing group and the position 3 is not substituted.
Even in the case of this unstabilized azulene Se (II) is oxidized the first to Se (IV); however, the selenoxide, as it is formed in acidic medium generated during the electrolysis, reacts with unreacted compounds yielding dimers as in the way d from Scheme 6.2, and as it was reported for the chemical oxidations [123]. Till about 1 F, the dimer 3,3′ bis(phenylselanyl)[1,1′] biazulene accumulates and gives oxidation peaks before those of the
CHARACTERIZATION OF ADVANCED MATERIALS BASED ON SELENIUM AZULENE DERIVATIVES AND NANODIAMONDS
23
starting compound (a3). Further oxidation leads to the dimer positively charged species, which are less prone to oxidize leading to an envelope of oxidation peaks at more positive potentials than a3 (between 1 and 2 V as seen in Fig. 6.6). In this way, the formation of oligomers with non-regulated structures is assumed. They are polymers containing PhSe group and its oxidized correspondents. The analysis of the reaction mixture has been performed after products extraction in DCM, washing, and finally chromatographic separation on silica gel. No color products were eluted, with the exception of a small pale blue band of starting material and of a brown polar band which contained no azulene structures. The separated products were carefully examined by MS; only very small peaks of compounds with selenium were observed, which had high polymeric masses. They split in MS in compounds such as Ph3Se2O3
+ Ph2Se2+(+ESI) or PhSe−, PhSe3
−, Ph2Se2−, Ph2Se3O2
− (-ESI) (see Figs. 6.7 – 6.16).
In 1a reduction (−2.06 V), the peaks a1 and c1 decrease in time indicating the consumption of the starting material as it can be seen from CVand DPV curves recorded during CPE (see Fig. 6.17 and 6.18). The curves could be rationalized by assuming that the product was split into azulene and phenylselenol anions; phenylselenol is known to be oxidized at about −0.7 V to diphenyldiselenyde; this fact is in agreement with the positive currents recorded at the starting potential of the anodic scans in CV (Fig. 6.17).
The radicals PhSe probably can also combine with azulene polymers generating other polymers that can explain the envelope of the oxidation peaks between 1 and 2 V. Azulene can be observed by the oxidation peak at around 1 V. At the same time, azulene oligomers containing negative charges can be partially oxidized at −1 V, as it can be seen in Fig. S9 in the reverse scans of cathodic scans. Both azulene and PhSeH are not stable in time and decay to polymeric compounds. As the polymeric mass is increasing, new peaks appear even at lower negative potentials, which could be explained by anionic polyenic system reductions. This assumption can be confirmed by the mass spectrum of the final electrolysis solution which has shown the presence of oligomeric compounds containing the PhSe group. No azulene peak was present in MS, which means the intermediate, radical (Az·) or anion (Az−), either reacted with oxygen and decay, or was further reduced to compounds with smaller mass molecules (alkanes). However, some azulene dimer was seen at m/z = 255 in – ESI. An important amount of Se was noticed in –ESI in form of Se4H2
− (m/z = 322), and compounds with Ph and Se: PhSe5H
− (m/z = 478), Ph2Se6−, (m/z = 634)
6.4. ABOUT THE MECHANISM OF ELECTROCHEMICAL PROCESSES OF 1-PHENYLSELANYL-AZULENES
Diaryl selenides (Ph-Se-Ph) can be considered as a model for electrochemical oxidation process of 1-phenylselanyl azulenes (Az-Se-Ph). Their oxidation occurs reversibly to a radical cation, (step (a) in Scheme 6.1), being followed by a bimolecular process [112]. The direct involvement of the heteroatom is generally accepted [118, 119]. This results in the occurrence of a charge-transfer-controlled first-order reaction of the radical cation, namely the formation of a new Se–C bond, along with other reaction routes [120].
Despite the high charge concentration on selenium, the radical cation cannot interact instantly with external nucleophiles, as Jouikov et al. have established [120]. The nature of bimolecular process following the first electron transfer of diphenyl selenide, which has led to stable products, was carefully debated [120, 121]. Both Se–Se and Se–C bonds were formed during the electrochemical oxidation. Se–Se dimer is obtained by spin coupling of the
CHARACTERIZATION OF ADVANCED MATERIALS BASED ON SELENIUM AZULENE DERIVATIVES AND NANODIAMONDS
24
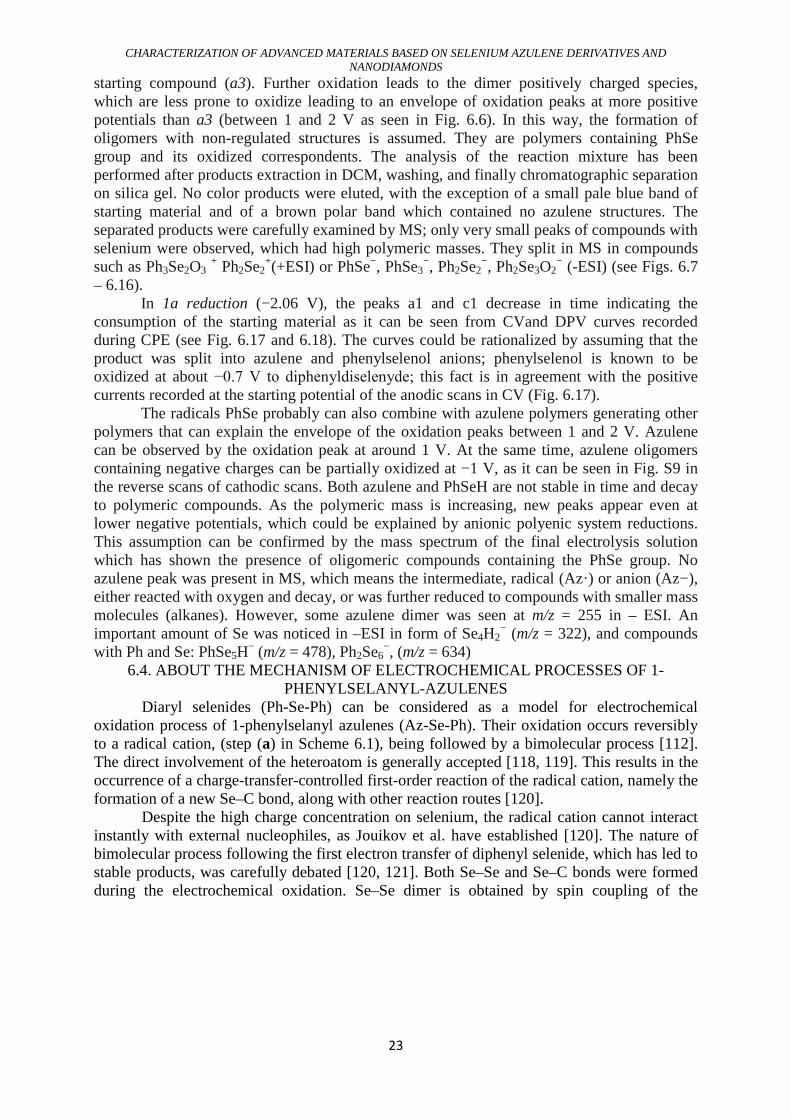
uncoupled selenium electron (step (e) in Scheme 1). More discussions were generated by the formation of the Se–C dimers. While some authors supposed that dimerization of the initially formed radical cation occurs directly (step (c) in Scheme 6.1), others considered as more probable a two-step mechanism consisting in the radical cations disproportionation in a reversible reaction leading to an intermediate Ph2Se2+ dication (step (b) in Scheme 6.1), followed by its interaction with a neutral molecule (step (d) in Scheme 6.1).
Scheme 6.1. Electrochemical oxidation processes of diaryl selenides
The nucleophile reacts with the more reactive dication formed by disproportionation,
and the attack takes place at the selenium atom, because it is more positively charged (step (f) in Scheme 6.1). The route adopted by the radical cation consisting of dimerization with proton elimination (step (c) in Scheme 6.1) seems to be less advantageous. The same dimer can be generated when Ph2Se acts as nucleophile (step (d) in Scheme 6.1).
The above summarized results on diaryl selenides and diaryl sulfides, corroborated with our investigations carried on the electrochemical behavior of phenylselanyl azulenes 1 and 2, enabled us to propose a mechanism which explains the electrochemical redox processes (Scheme 6.2).
The presence of azulene-1-yl as one of the aromatic moieties in the diaryl selenides compounds, AzSePh, changes to some extent the behavior of these selenium compounds, due to the low oxidation potential of azulene moiety. When the intermediate radical cation is generated from Az-Se-Ph, the weak aromatic character and the electron donor ability of azulene favor the conjugation of selenium charge (s) with π-electron system of azulene.
Therefore, in the produced radical cation, azulene moiety competes with selenium as oxidation center, making the reactions that stabilize this intermediate more numerous and complex (Scheme 6. 2). This kind of chemistry is also signaled for other electron-rich diaryl selenides, as bis(p-N,N-dimethylaminophenyl)selenide, which show multiple oxidation steps in cyclic voltammetry [118, 119]. Considering also the ability of azulene system to polymerize, it is expected that the generated AzSe2+Ph induces the oxidative oligomerization of products as well.
The resemblance of the redox peaks shapes in DPV for all phenylselanyl azulenes substituted with EDG (1a–1g) proves a common mechanism for the electrochemical behavior of these compounds. When scanning in anodic or cathodic directions, they all show a strong first oxidation peak (denoted a1) and a strong reduction peak (denoted c1), respectively, followed by several smaller peaks. This behavior can be also observed for AzSPh compound in Fig. 5.4. For the compounds 1i and 1h that contain either two selenium atoms, or both sulfur and selenium atoms, the small peaks are more numerous, fact which proves the implication of these atoms in the redox chain (Figs. 5.5 and 5.13 and Table 6. 1). The values
CHARACTERIZATION OF ADVANCED MATERIALS BASED ON SELENIUM AZULENE DERIVATIVES AND NANODIAMONDS
25
of redox potentials obtained by Shoji et al. [121-124] for 1,3- bis(phenylthio)azulene (compound 3 in Table 5.1) are close to those obtained for 1a and 1i. There are still differences which could result from the different solvent used in our experiments.
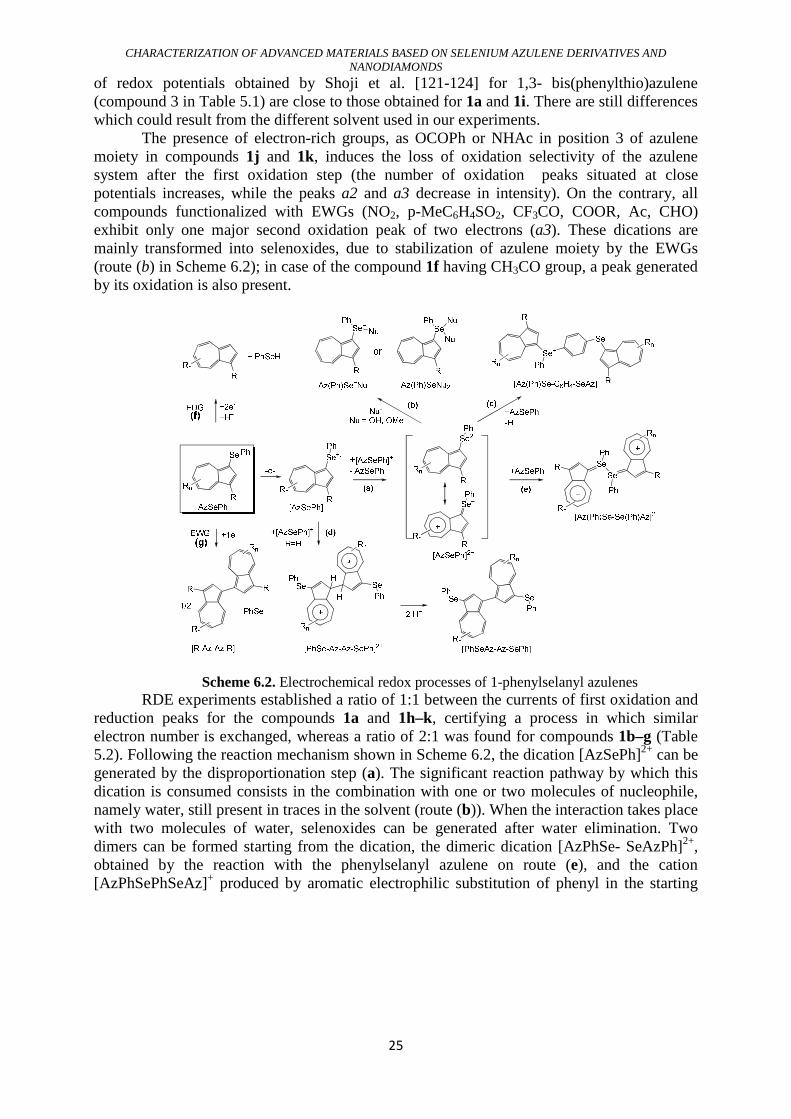
The presence of electron-rich groups, as OCOPh or NHAc in position 3 of azulene moiety in compounds 1j and 1k, induces the loss of oxidation selectivity of the azulene system after the first oxidation step (the number of oxidation peaks situated at close potentials increases, while the peaks a2 and a3 decrease in intensity). On the contrary, all compounds functionalized with EWGs (NO2, p-MeC6H4SO2, CF3CO, COOR, Ac, CHO) exhibit only one major second oxidation peak of two electrons (a3). These dications are mainly transformed into selenoxides, due to stabilization of azulene moiety by the EWGs (route (b) in Scheme 6.2); in case of the compound 1f having CH3CO group, a peak generated by its oxidation is also present.
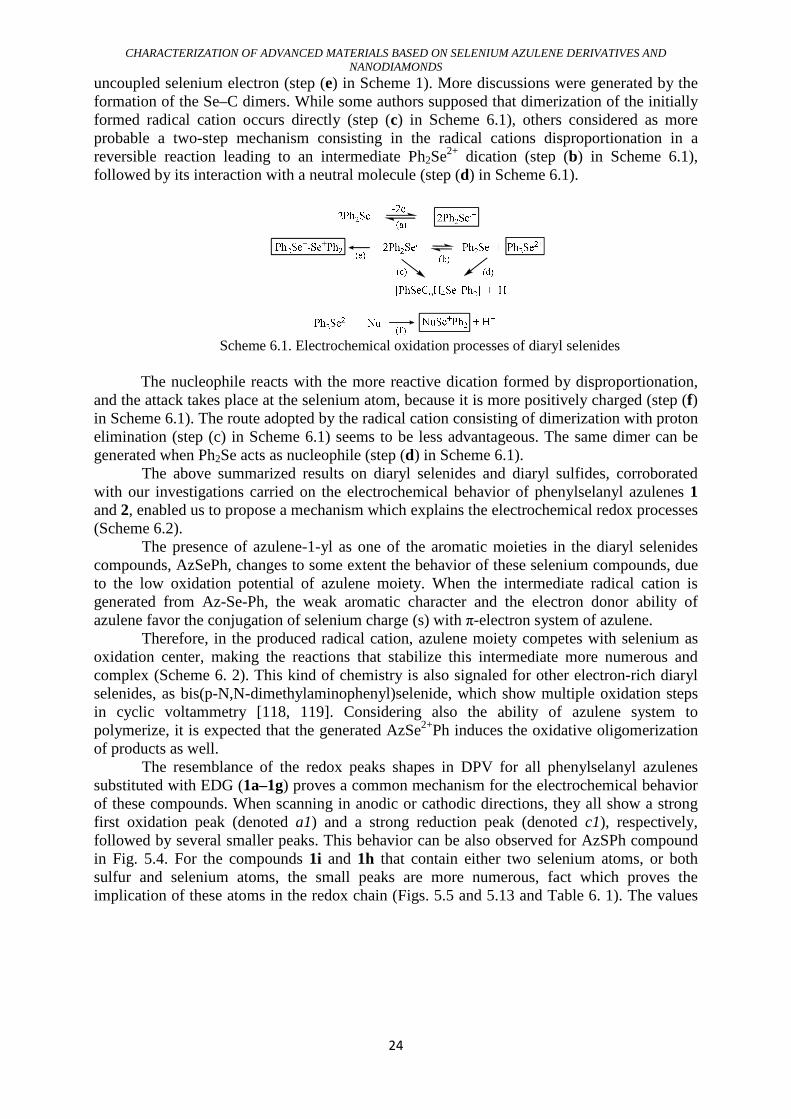
Scheme 6.2. Electrochemical redox processes of 1-phenylselanyl azulenes RDE experiments established a ratio of 1:1 between the currents of first oxidation and
reduction peaks for the compounds 1a and 1h–k, certifying a process in which similar electron number is exchanged, whereas a ratio of 2:1 was found for compounds 1b–g (Table 5.2). Following the reaction mechanism shown in Scheme 6.2, the dication [AzSePh]2+ can be generated by the disproportionation step (a). The significant reaction pathway by which this dication is consumed consists in the combination with one or two molecules of nucleophile, namely water, still present in traces in the solvent (route (b)). When the interaction takes place with two molecules of water, selenoxides can be generated after water elimination. Two dimers can be formed starting from the dication, the dimeric dication [AzPhSe- SeAzPh]2+, obtained by the reaction with the phenylselanyl azulene on route (e), and the cation [AzPhSePhSeAz]+ produced by aromatic electrophilic substitution of phenyl in the starting
CHARACTERIZATION OF ADVANCED MATERIALS BASED ON SELENIUM AZULENE DERIVATIVES AND NANODIAMONDS
26
compound on route (c); however, the last two interactions have probably lower reaction rates than the nucleophile attack. Finally, the charged dimers either stabilize as neutral compounds by proton elimination or decay to complex polymeric structures. They decay to polymeric materials, such as the blue films in which azulene system is partially or even totally destroyed at higher potentials. The PhSe groups are more stable being identified as polymers (oligomers) in MS spectra.
Other reaction route for the radical cation [AzSePh]+ resulted from compound 1a may be the dimerization in position 3, giving the [PhSeAz-AzSePh] compound after protons elimination (route (d)). The further oxidation of the obtained dimer could explain the presence of the visible smaller peaks in CV and DPV curves. The substitution in positions 1 and 3 in compound 1d decreases the number of peaks in the oxidation domain as compared to 1a, whereas the involvement of the second PhSe group in the oxidation process of compound 1i produces a higher number of such peaks.
The reduction ways (f) and (g) are formulated also on the left side of Scheme 2. The acceptance of two electrons (route (f)), reflected by the cathodic peak c1 and noticed for compounds substituted with EDGs, could be attributed to the breaking of AzSePh with the formation of Az− or PhSe−. The disappearance of the Az− occurs by protons transfer from species existing in reaction medium (e.g., water molecules) followed by azulenes generation. PhSe− reacts with water, giving phenylselenol (PhSeH), because the solution becomes acidic during electrolysis experiments at cathodic potentials by partial decomposition of Bu4N
+ ion with the formation of protons. For the compounds substituted with EWGs, only one-electron processes are observed by RDE during the first reduction peak. For these compounds, the radical anions are more stable than those observed in previous cases (compounds without EWG), and they could stabilize as dimers RAz-AzR with the elimination of PhSe−anion (route (g)).
When the position 3 on azulene moiety possesses a substituent having a double bond, such as C=O in compound 1d and 1e, the second reduction process could occur at this carbonyl unsaturated group, which is stabilized by conjugation with the π-electronic system of azulene (it is reduced to radical anion). These peaks are very intense and clear for the compounds having strong EWGs, such as 1d (substituted with COCF3). However, they appear at high negative potentials, close to the reduction peak of the supporting electrolyte as in the case of CHO or COOMe substituents; they can become quite undetectable, being overlapped by the background reduction (as in the case of 1f, substituted with Ac group). Another strong EWG group, namely NO2, induces the occurrence of three reduction peaks; this behavior can be explained by the nitrogen ability to adopt different oxidation states.
The following assignment for the electrochemical reactions have been proposed on the basis of voltammetric results the number of electrons exchanged during the reduction and oxidation steps of the studied compounds: oxidation of selanylazulene to the selenoxide (peak a1) and destructive oxidation of azulene moiety (peak a2). These processes have been evidenced in the DPV curves of all investigated compounds. The oxidation to selenoxide (peak a1) is the main result of the stabilization of the dication intermediate in reaction with water as nucleophile (route (b) in Scheme 2). The peak a2 is the result of the superposition of more processes and could be attributed to the oxidation of azulene moiety from the initial selanylazulene and from the selenoxide and selenone generated by electrooxidation. These remarks are in agreement with the detail examination of the evolution in time of the peak a2
CHARACTERIZATION OF ADVANCED MATERIALS BASED ON SELENIUM AZULENE DERIVATIVES AND NANODIAMONDS
27
during the CPE at positive potential of the main stable azulene compound, 1c. This shows the increasing in time of a small peak, b (Fig. 6.18), which can be attributed to the oxidation of selenoxide (electrogenerated in the peak a1) to selenone.
The electrochemical results are in good correlation with the chemical oxidation results for this class of compounds. Using NaIO4, the compounds are easily oxidized to selenoxides in high yields, but their further oxidation to selenones is sluggish working only in poor yields, most of the material becoming a tarry polymer [113]. At the same time, it is known that in acidic media, if the 3-position is free, the sulfoxide, and probably the seleneoxide, is transposed to 3,3′-bis(phenylthio)-1,1′-biazulene [123].
CHAPTER 7 ELECTROCHEMICAL FILMS FORMATION FROM PHENYLSELANYL-
AZULENE DERIVATIVES
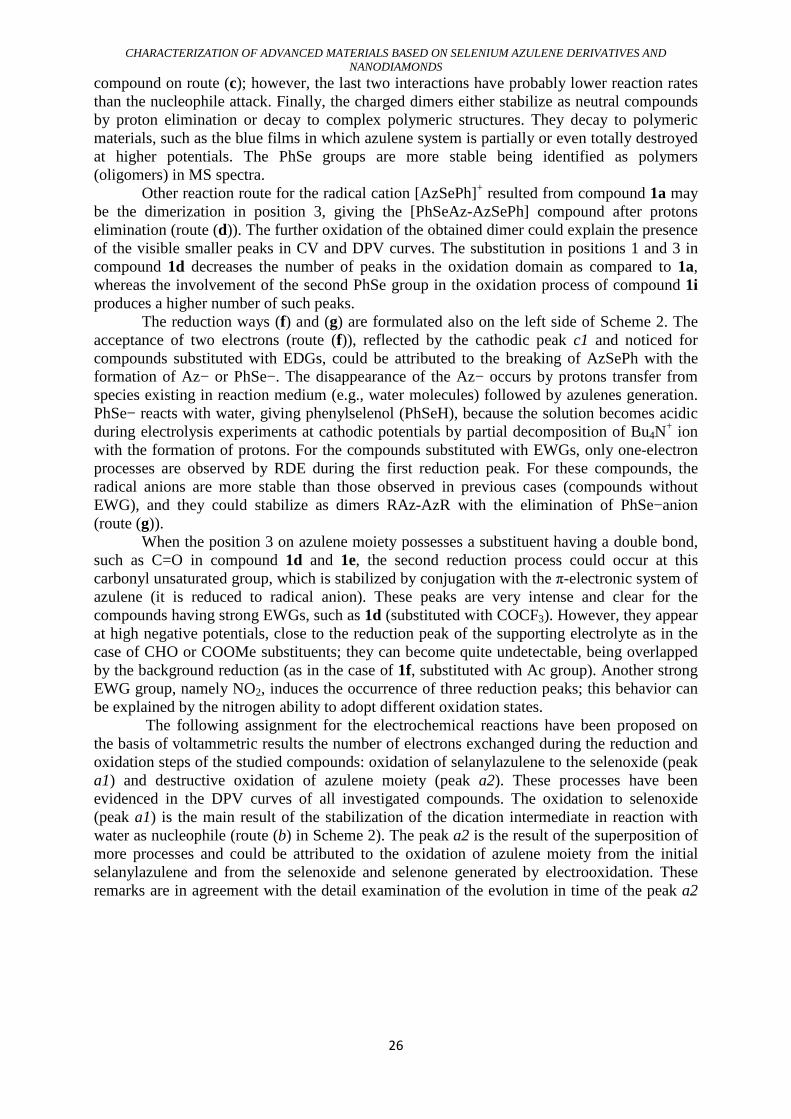
7.1. FILMS BASED ON DE 1-(PHEYLSELANYL)AZULENE (1a) Poliazulenic films based on 1a were obtained by the potentio-dynamic method by
cyclizing the glassy carbon electrode in millimolar concentrations of 1a in 0.1M TBAP CH3CN [95]. During cycling the electrode cover with insulating films takes place, which was evidenced by the decrease of the currents in DPV and RDE after the potential of 1 V, (figure 5.2).
Due to our interest to obtain polymer films by oxidation, more cycles with an anodic limit situated at the end of the peak a1 (Fig. 7.1) have been carried out; a new oxidation process (a1‴) appears in the second cycle, at potentials less positive than that for a1; a1‴ as well as a1′ and a1″ increase in successive cycles. This confirms the formation of a dication (further discussed in the proposed mechanism), followed by its reduction to radical cation (a1′), which is further reduced to the dimer (a1″). The last one is oxidized in the next cycle (a1‴), and so on…; this process precedes the film formation. a1‴ is the oxidation peak of the dimer/trimer/…polymer (all these mers are oxidized at less positive potentials than the monomer). There is also a confirmation of the film formation when examining the electrode surface color that changes to blue after cycling the potential in the range of a1 (as in Fig. 7.1).
Figure 7. 1. Successive CV cycles (0.1 V/s) showing the formation of a film on the glassy carbon
electrode surface (diameter of 3 mm) in solution of 1a (1 mM ) in 0.1 M TPAP, CH3CN
CHARACTERIZATION OF ADVANCED MATERIALS BASED ON SELENIUM AZULENE DERIVATIVES AND NANODIAMONDS
28
7.3. FILMS BASED ON (6-METHYLAZULEN-1-YL)(PHENYL)SELANE (2a) Polyazulenes films from (6-methylazulen-1-il)(phenyl)selane (2a) were obtained on
gold microchips electrodes by potentiodynamic methods. Attempts to obtain films by potentiostatic methods have not led to conclusive results on these microchips.
The RDE curves recorded for the characterization of compound 2a constitutes an evidence for the formation of these films (figure 7.2)
7.2.1. Poly(2a) films on GC The above assessments for the peaks in CV and DPV curves (formation of the radical
cation (peak 1a) and its further oxidation (peaks 2a, 3a), and the formation of the radical-anion (peak 1c)) are in a good agreement with RDE curves (Fig. 7.1). In these curves in the anodic scans, at 500 rpm, can be seen a first wave with a half-wave potential (E1/2) of 0.352 V, followed by a second large wave at 1.179 V; at potentials bigger than 1.36 V the current decays, showing the electrode blocking. At higher rotation rates (1000 and 1500 rpm) the second wave is less visible due to the fast reaching of the polymerization potential, as shown in similar cases for other azulene polymers [122]. This behavior is characteristic for the formation of insulating films from the initially formed radical cation. The ratio between the limiting currents of 1a and 1c is between 1.5 and 2 (2.03, 1.58, and 1.51 for rotation rates of 500, 1000, and 1500 rpm, respectively). This value also supports the film formation through a mechanism involving both radicalic and electrophilic reactions, which finally turns the material into an insulating π-polymer [124]. The slopes of the limiting currents for 1a and 1c vs the square root of the rotation rate are similar (Fig. 7.1B) for both 1a and 1c processes, being of about 2.8*10-6 A (rpm)-1/2.
b Figure 7.2. (a): RDE curves at different rotation rates for [L] = 1mM in 0.1M TBAP, CH3CN; (b) current dependencies on the square root of the rotating rate (rpm) for 1a and 1c processes
7.2.2. Poly(2a) films on microchips The film formation put in evidence by the decrease of DPV and RDE currents (when
scanning the GC electrode potential at values over that of the peak 1a) was confirmed by scanning the potential of interdigitated four contact gold electrode when between -0.2V and
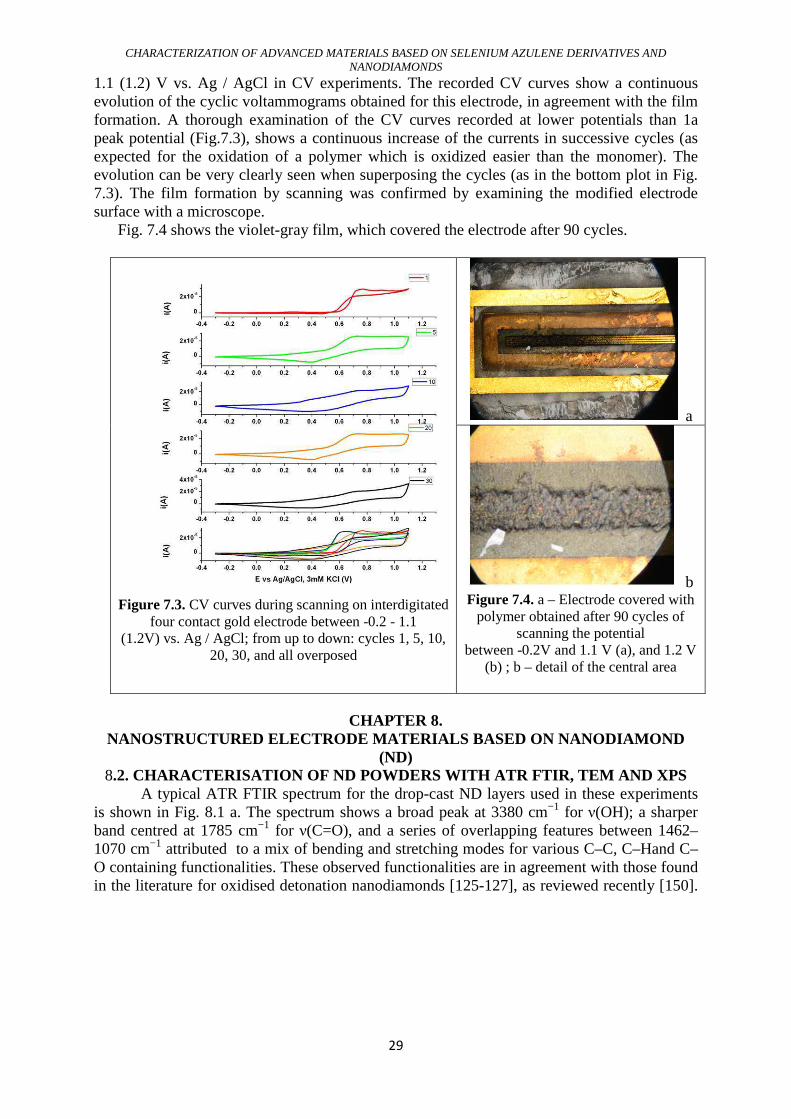
CHARACTERIZATION OF ADVANCED MATERIALS BASED ON SELENIUM AZULENE DERIVATIVES AND NANODIAMONDS
29
1.1 (1.2) V vs. Ag / AgCl in CV experiments. The recorded CV curves show a continuous evolution of the cyclic voltammograms obtained for this electrode, in agreement with the film formation. A thorough examination of the CV curves recorded at lower potentials than 1a peak potential (Fig.7.3), shows a continuous increase of the currents in successive cycles (as expected for the oxidation of a polymer which is oxidized easier than the monomer). The evolution can be very clearly seen when superposing the cycles (as in the bottom plot in Fig. 7.3). The film formation by scanning was confirmed by examining the modified electrode surface with a microscope.
Fig. 7.4 shows the violet-gray film, which covered the electrode after 90 cycles.
Figure 7.3. CV curves during scanning on interdigitated
four contact gold electrode between -0.2 - 1.1 (1.2V) vs. Ag / AgCl; from up to down: cycles 1, 5, 10,
20, 30, and all overposed
a
b Figure 7.4. a – Electrode covered with
polymer obtained after 90 cycles of scanning the potential
between -0.2V and 1.1 V (a), and 1.2 V (b) ; b – detail of the central area
CHAPTER 8. NANOSTRUCTURED ELECTRODE MATERIALS BASED ON NANODIA MOND
(ND) 8.2. CHARACTERISATION OF ND POWDERS WITH ATR FTIR, T EM AND XPS
A typical ATR FTIR spectrum for the drop-cast ND layers used in these experiments is shown in Fig. 8.1 a. The spectrum shows a broad peak at 3380 cm−1 for ν(OH); a sharper band centred at 1785 cm−1 for ν(C=O), and a series of overlapping features between 1462–1070 cm−1 attributed to a mix of bending and stretching modes for various C–C, C–Hand C–O containing functionalities. These observed functionalities are in agreement with those found in the literature for oxidised detonation nanodiamonds [125-127], as reviewed recently [150].
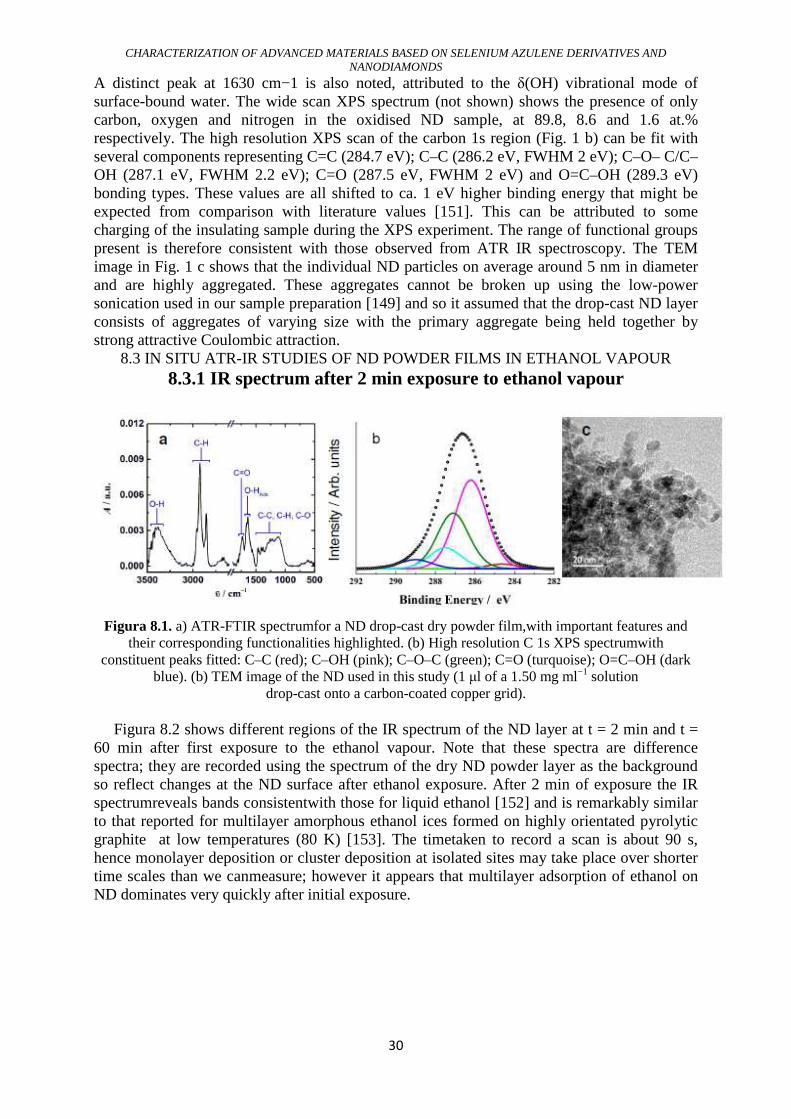
CHARACTERIZATION OF ADVANCED MATERIALS BASED ON SELENIUM AZULENE DERIVATIVES AND NANODIAMONDS
30
A distinct peak at 1630 cm−1 is also noted, attributed to the δ(OH) vibrational mode of surface-bound water. The wide scan XPS spectrum (not shown) shows the presence of only carbon, oxygen and nitrogen in the oxidised ND sample, at 89.8, 8.6 and 1.6 at.% respectively. The high resolution XPS scan of the carbon 1s region (Fig. 1 b) can be fit with several components representing C=C (284.7 eV); C–C (286.2 eV, FWHM 2 eV); C–O– C/C–OH (287.1 eV, FWHM 2.2 eV); C=O (287.5 eV, FWHM 2 eV) and O=C–OH (289.3 eV) bonding types. These values are all shifted to ca. 1 eV higher binding energy that might be expected from comparison with literature values [151]. This can be attributed to some charging of the insulating sample during the XPS experiment. The range of functional groups present is therefore consistent with those observed from ATR IR spectroscopy. The TEM image in Fig. 1 c shows that the individual ND particles on average around 5 nm in diameter and are highly aggregated. These aggregates cannot be broken up using the low-power sonication used in our sample preparation [149] and so it assumed that the drop-cast ND layer consists of aggregates of varying size with the primary aggregate being held together by strong attractive Coulombic attraction.
8.3 IN SITU ATR-IR STUDIES OF ND POWDER FILMS IN ETHANOL VAPOUR 8.3.1 IR spectrum after 2 min exposure to ethanol vapour
Figura 8.1. a) ATR-FTIR spectrumfor a ND drop-cast dry powder film,with important features and
their corresponding functionalities highlighted. (b) High resolution C 1s XPS spectrumwith constituent peaks fitted: C–C (red); C–OH (pink); C–O–C (green); C=O (turquoise); O=C–OH (dark
blue). (b) TEM image of the ND used in this study (1 μl of a 1.50 mg ml−1 solution drop-cast onto a carbon-coated copper grid).
Figura 8.2 shows different regions of the IR spectrum of the ND layer at t = 2 min and t = 60 min after first exposure to the ethanol vapour. Note that these spectra are difference spectra; they are recorded using the spectrum of the dry ND powder layer as the background so reflect changes at the ND surface after ethanol exposure. After 2 min of exposure the IR spectrumreveals bands consistentwith those for liquid ethanol [152] and is remarkably similar to that reported for multilayer amorphous ethanol ices formed on highly orientated pyrolytic graphite at low temperatures (80 K) [153]. The timetaken to record a scan is about 90 s, hence monolayer deposition or cluster deposition at isolated sites may take place over shorter time scales than we canmeasure; however it appears that multilayer adsorption of ethanol on ND dominates very quickly after initial exposure.
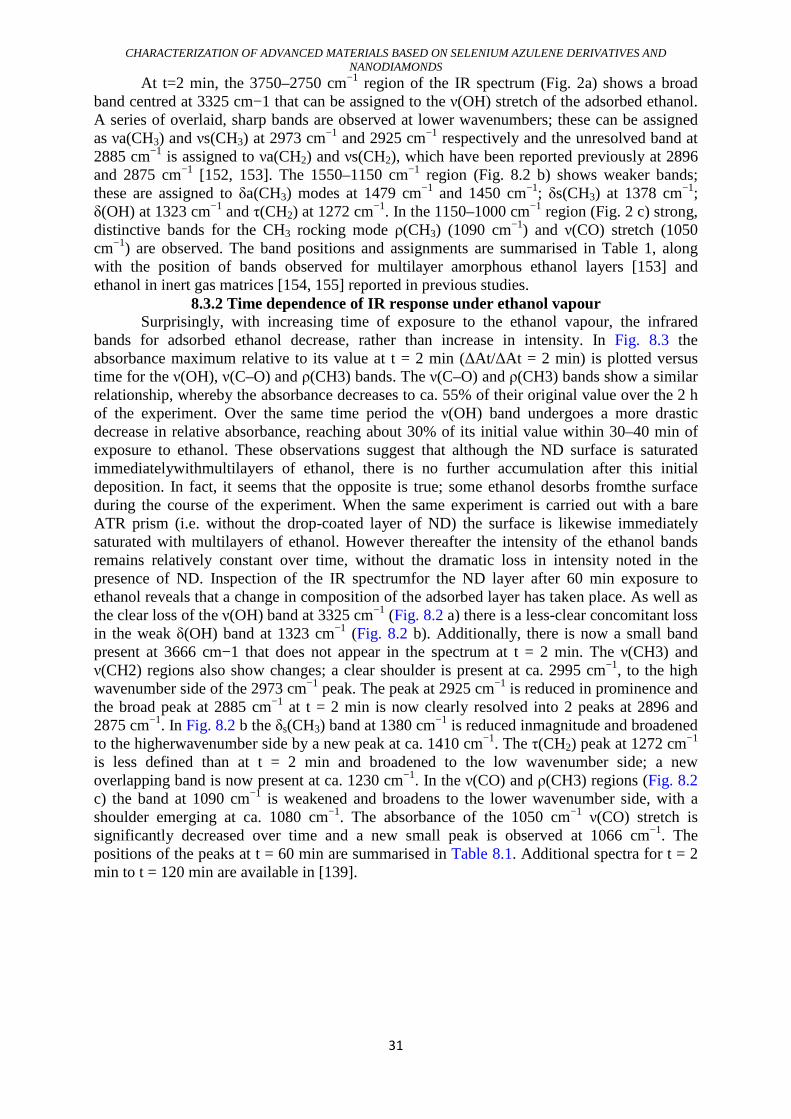
CHARACTERIZATION OF ADVANCED MATERIALS BASED ON SELENIUM AZULENE DERIVATIVES AND NANODIAMONDS
31
At t=2 min, the 3750–2750 cm−1 region of the IR spectrum (Fig. 2a) shows a broad band centred at 3325 cm−1 that can be assigned to the ν(OH) stretch of the adsorbed ethanol. A series of overlaid, sharp bands are observed at lower wavenumbers; these can be assigned as νa(CH3) and νs(CH3) at 2973 cm−1 and 2925 cm−1 respectively and the unresolved band at 2885 cm−1 is assigned to νa(CH2) and νs(CH2), which have been reported previously at 2896 and 2875 cm−1 [152, 153]. The 1550–1150 cm−1 region (Fig. 8.2 b) shows weaker bands; these are assigned to δa(CH3) modes at 1479 cm−1 and 1450 cm−1; δs(CH3) at 1378 cm−1; δ(OH) at 1323 cm−1 and τ(CH2) at 1272 cm−1. In the 1150–1000 cm−1 region (Fig. 2 c) strong, distinctive bands for the CH3 rocking mode ρ(CH3) (1090 cm−1) and ν(CO) stretch (1050 cm−1) are observed. The band positions and assignments are summarised in Table 1, along with the position of bands observed for multilayer amorphous ethanol layers [153] and ethanol in inert gas matrices [154, 155] reported in previous studies.
8.3.2 Time dependence of IR response under ethanol vapour Surprisingly, with increasing time of exposure to the ethanol vapour, the infrared
bands for adsorbed ethanol decrease, rather than increase in intensity. In Fig. 8.3 the absorbance maximum relative to its value at t = 2 min (ΔAt/ΔAt = 2 min) is plotted versus time for the ν(OH), ν(C–O) and ρ(CH3) bands. The ν(C–O) and ρ(CH3) bands show a similar relationship, whereby the absorbance decreases to ca. 55% of their original value over the 2 h of the experiment. Over the same time period the ν(OH) band undergoes a more drastic decrease in relative absorbance, reaching about 30% of its initial value within 30–40 min of exposure to ethanol. These observations suggest that although the ND surface is saturated immediatelywithmultilayers of ethanol, there is no further accumulation after this initial deposition. In fact, it seems that the opposite is true; some ethanol desorbs fromthe surface during the course of the experiment. When the same experiment is carried out with a bare ATR prism (i.e. without the drop-coated layer of ND) the surface is likewise immediately saturated with multilayers of ethanol. However thereafter the intensity of the ethanol bands remains relatively constant over time, without the dramatic loss in intensity noted in the presence of ND. Inspection of the IR spectrumfor the ND layer after 60 min exposure to ethanol reveals that a change in composition of the adsorbed layer has taken place. As well as the clear loss of the ν(OH) band at 3325 cm−1 (Fig. 8.2 a) there is a less-clear concomitant loss in the weak δ(OH) band at 1323 cm−1 (Fig. 8.2 b). Additionally, there is now a small band present at 3666 cm−1 that does not appear in the spectrum at t = 2 min. The ν(CH3) and ν(CH2) regions also show changes; a clear shoulder is present at ca. 2995 cm−1, to the high wavenumber side of the 2973 cm−1 peak. The peak at 2925 cm−1 is reduced in prominence and the broad peak at 2885 cm−1 at t = 2 min is now clearly resolved into 2 peaks at 2896 and 2875 cm−1. In Fig. 8.2 b the δs(CH3) band at 1380 cm−1 is reduced inmagnitude and broadened to the higherwavenumber side by a new peak at ca. 1410 cm−1. The τ(CH2) peak at 1272 cm−1 is less defined than at t = 2 min and broadened to the low wavenumber side; a new overlapping band is now present at ca. 1230 cm−1. In the ν(CO) and ρ(CH3) regions (Fig. 8.2 c) the band at 1090 cm−1 is weakened and broadens to the lower wavenumber side, with a shoulder emerging at ca. 1080 cm−1. The absorbance of the 1050 cm−1 ν(CO) stretch is significantly decreased over time and a new small peak is observed at 1066 cm−1. The positions of the peaks at t = 60 min are summarised in Table 8.1. Additional spectra for t = 2 min to t = 120 min are available in [139].
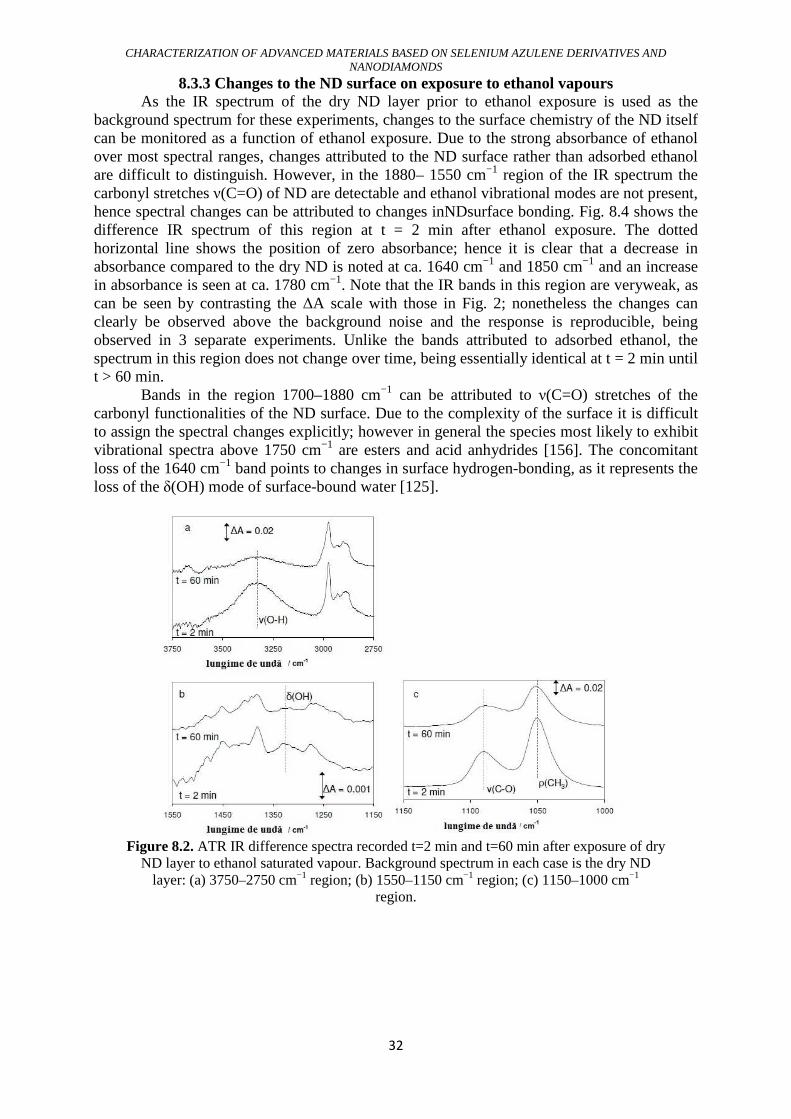
CHARACTERIZATION OF ADVANCED MATERIALS BASED ON SELENIUM AZULENE DERIVATIVES AND NANODIAMONDS
32
8.3.3 Changes to the ND surface on exposure to ethanol vapours As the IR spectrum of the dry ND layer prior to ethanol exposure is used as the
background spectrum for these experiments, changes to the surface chemistry of the ND itself can be monitored as a function of ethanol exposure. Due to the strong absorbance of ethanol over most spectral ranges, changes attributed to the ND surface rather than adsorbed ethanol are difficult to distinguish. However, in the 1880– 1550 cm−1 region of the IR spectrum the carbonyl stretches ν(C=O) of ND are detectable and ethanol vibrational modes are not present, hence spectral changes can be attributed to changes inNDsurface bonding. Fig. 8.4 shows the difference IR spectrum of this region at t = 2 min after ethanol exposure. The dotted horizontal line shows the position of zero absorbance; hence it is clear that a decrease in absorbance compared to the dry ND is noted at ca. 1640 cm−1 and 1850 cm−1 and an increase in absorbance is seen at ca. 1780 cm−1. Note that the IR bands in this region are veryweak, as can be seen by contrasting the ΔA scale with those in Fig. 2; nonetheless the changes can clearly be observed above the background noise and the response is reproducible, being observed in 3 separate experiments. Unlike the bands attributed to adsorbed ethanol, the spectrum in this region does not change over time, being essentially identical at t = 2 min until t > 60 min.
Bands in the region 1700–1880 cm−1 can be attributed to ν(C=O) stretches of the carbonyl functionalities of the ND surface. Due to the complexity of the surface it is difficult to assign the spectral changes explicitly; however in general the species most likely to exhibit vibrational spectra above 1750 cm−1 are esters and acid anhydrides [156]. The concomitant loss of the 1640 cm−1 band points to changes in surface hydrogen-bonding, as it represents the loss of the δ(OH) mode of surface-bound water [125].
Figure 8.2. ATR IR difference spectra recorded t=2 min and t=60 min after exposure of dry
ND layer to ethanol saturated vapour. Background spectrum in each case is the dry ND layer: (a) 3750–2750 cm−1 region; (b) 1550–1150 cm−1 region; (c) 1150–1000 cm−1
region.
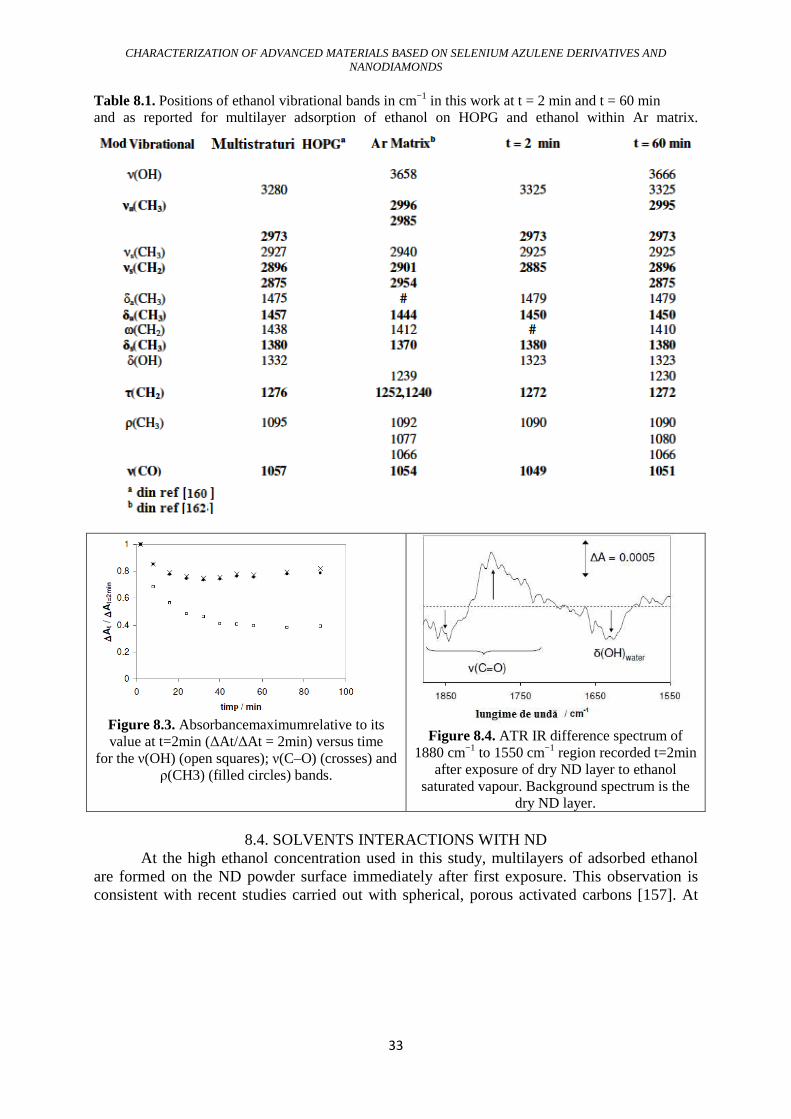
CHARACTERIZATION OF ADVANCED MATERIALS BASED ON SELENIUM AZULENE DERIVATIVES AND NANODIAMONDS
33
Table 8.1. Positions of ethanol vibrational bands in cm−1 in this work at t = 2 min and t = 60 min and as reported for multilayer adsorption of ethanol on HOPG and ethanol within Ar matrix.
Figure 8.3. Absorbancemaximumrelative to its value at t=2min (ΔAt/ΔAt = 2min) versus time
for the ν(OH) (open squares); ν(C–O) (crosses) and ρ(CH3) (filled circles) bands.
Figure 8.4. ATR IR difference spectrum of
1880 cm−1 to 1550 cm−1 region recorded t=2min after exposure of dry ND layer to ethanol
saturated vapour. Background spectrum is the dry ND layer.
8.4. SOLVENTS INTERACTIONS WITH ND
At the high ethanol concentration used in this study, multilayers of adsorbed ethanol are formed on the ND powder surface immediately after first exposure. This observation is consistent with recent studies carried out with spherical, porous activated carbons [157]. At
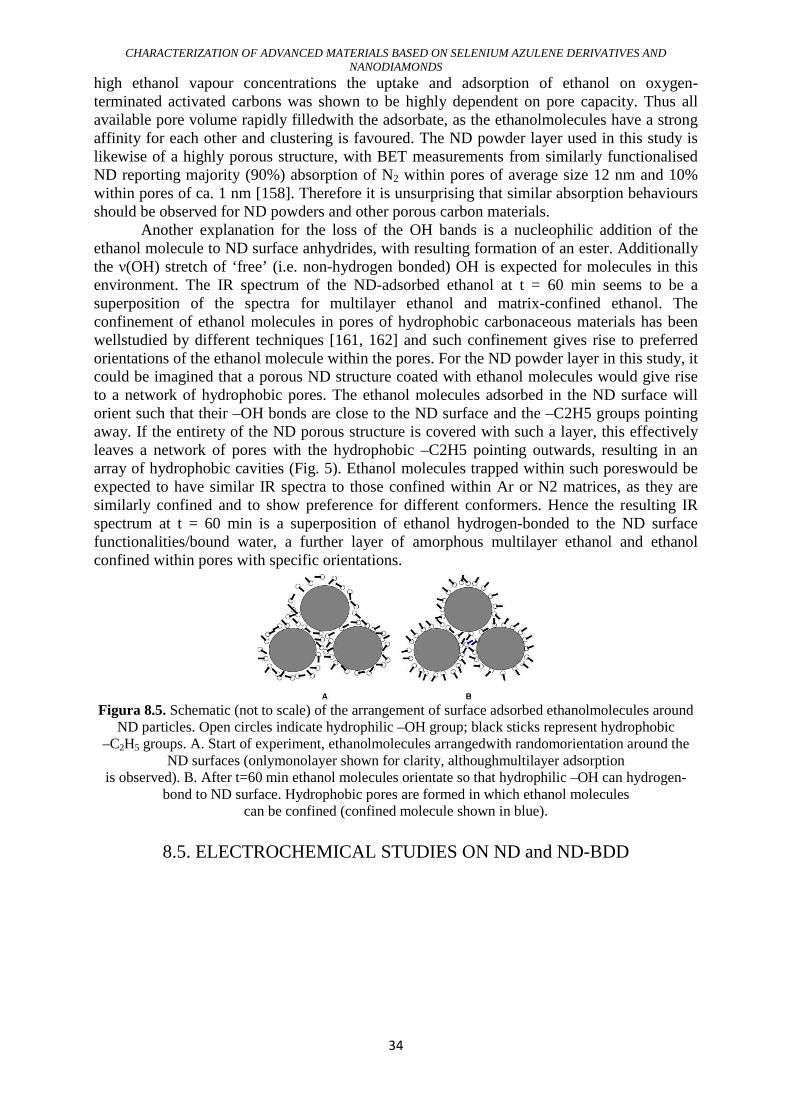
CHARACTERIZATION OF ADVANCED MATERIALS BASED ON SELENIUM AZULENE DERIVATIVES AND NANODIAMONDS
34
high ethanol vapour concentrations the uptake and adsorption of ethanol on oxygen-terminated activated carbons was shown to be highly dependent on pore capacity. Thus all available pore volume rapidly filledwith the adsorbate, as the ethanolmolecules have a strong affinity for each other and clustering is favoured. The ND powder layer used in this study is likewise of a highly porous structure, with BET measurements from similarly functionalised ND reporting majority (90%) absorption of N2 within pores of average size 12 nm and 10% within pores of ca. 1 nm [158]. Therefore it is unsurprising that similar absorption behaviours should be observed for ND powders and other porous carbon materials.
Another explanation for the loss of the OH bands is a nucleophilic addition of the ethanol molecule to ND surface anhydrides, with resulting formation of an ester. Additionally the ν(OH) stretch of ‘free’ (i.e. non-hydrogen bonded) OH is expected for molecules in this environment. The IR spectrum of the ND-adsorbed ethanol at t = 60 min seems to be a superposition of the spectra for multilayer ethanol and matrix-confined ethanol. The confinement of ethanol molecules in pores of hydrophobic carbonaceous materials has been wellstudied by different techniques [161, 162] and such confinement gives rise to preferred orientations of the ethanol molecule within the pores. For the ND powder layer in this study, it could be imagined that a porous ND structure coated with ethanol molecules would give rise to a network of hydrophobic pores. The ethanol molecules adsorbed in the ND surface will orient such that their –OH bonds are close to the ND surface and the –C2H5 groups pointing away. If the entirety of the ND porous structure is covered with such a layer, this effectively leaves a network of pores with the hydrophobic –C2H5 pointing outwards, resulting in an array of hydrophobic cavities (Fig. 5). Ethanol molecules trapped within such poreswould be expected to have similar IR spectra to those confined within Ar or N2 matrices, as they are similarly confined and to show preference for different conformers. Hence the resulting IR spectrum at t = 60 min is a superposition of ethanol hydrogen-bonded to the ND surface functionalities/bound water, a further layer of amorphous multilayer ethanol and ethanol confined within pores with specific orientations.
Figura 8.5. Schematic (not to scale) of the arrangement of surface adsorbed ethanolmolecules around
ND particles. Open circles indicate hydrophilic –OH group; black sticks represent hydrophobic –C2H5 groups. A. Start of experiment, ethanolmolecules arrangedwith randomorientation around the
ND surfaces (onlymonolayer shown for clarity, althoughmultilayer adsorption is observed). B. After t=60 min ethanol molecules orientate so that hydrophilic –OH can hydrogen-
bond to ND surface. Hydrophobic pores are formed in which ethanol molecules can be confined (confined molecule shown in blue).
8.5. ELECTROCHEMICAL STUDIES ON ND and ND-BDD
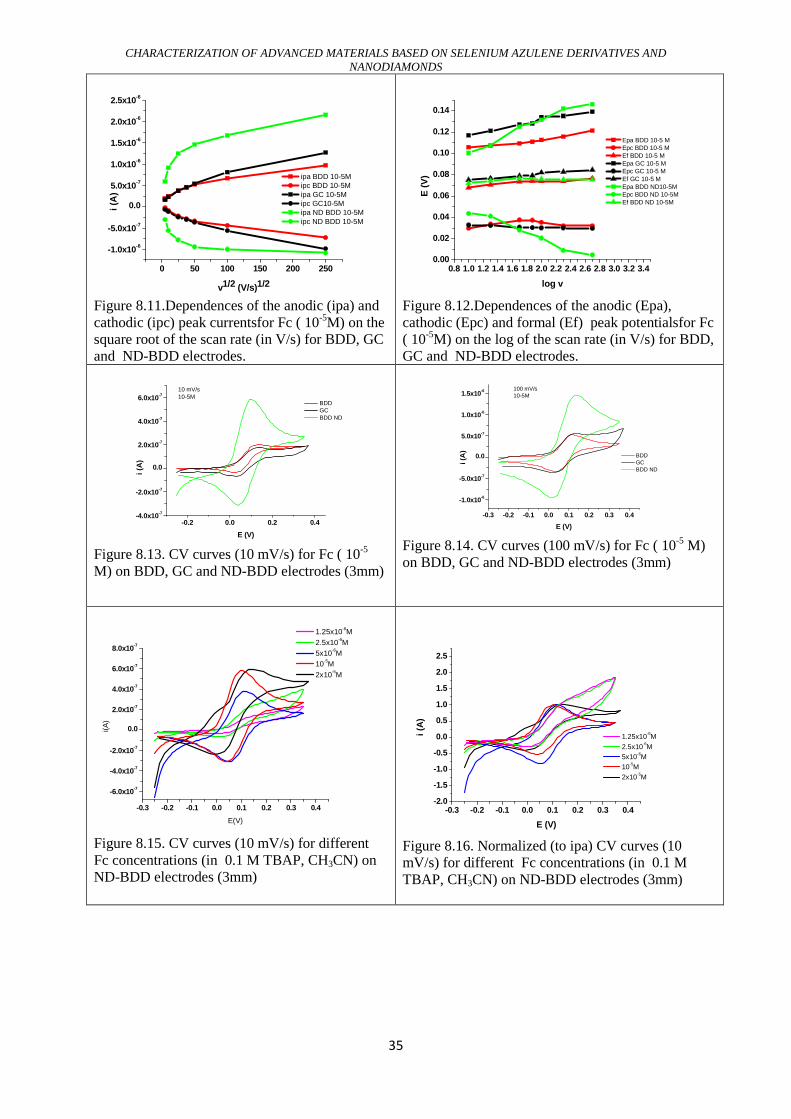
CHARACTERIZATION OF ADVANCED MATERIALS BASED ON SELENIUM AZULENE DERIVATIVES AND NANODIAMONDS
35
0 50 100 150 200 250
-1.0x10⁻⁶
-5.0x10⁻⁷
0.0
5.0x10⁻⁷
1.0x10⁻⁶
1.5x10⁻⁶
2.0x10⁻⁶
2.5x10⁻⁶
ipa BDD 10-5M ipc BDD 10-5M ipa GC 10-5M ipc GC10-5M ipa ND BDD 10-5M ipc ND BDD 10-5M
i (A
)
v1/2 (V/s)1/2
Figure 8.11.Dependences of the anodic (ipa) and cathodic (ipc) peak currentsfor Fc ( 10-5M) on the square root of the scan rate (in V/s) for BDD, GC and ND-BDD electrodes.
0.8 1.0 1.2 1.4 1.6 1.8 2.0 2.2 2.4 2.6 2.8 3.0 3.2 3.40.00
0.02
0.04
0.06
0.08
0.10
0.12
0.14
E (
V)
log v
Epa BDD 10-5 M Epc BDD 10-5 M Ef BDD 10-5 M Epa GC 10-5 M Epc GC 10-5 M Ef GC 10-5 M Epa BDD ND10-5M Epc BDD ND 10-5M Ef BDD ND 10-5M
Figure 8.12.Dependences of the anodic (Epa), cathodic (Epc) and formal (Ef) peak potentialsfor Fc ( 10-5M) on the log of the scan rate (in V/s) for BDD, GC and ND-BDD electrodes.
-0.2 0.0 0.2 0.4-4.0x10⁻⁷
-2.0x10⁻⁷
0.0
2.0x10⁻⁷
4.0x10⁻⁷
6.0x10⁻⁷
i (A
)
E (V)
BDD GC BDD ND
10 mV/s10-5M
Figure 8.13. CV curves (10 mV/s) for Fc ( 10-5 M) on BDD, GC and ND-BDD electrodes (3mm)
-0.3 -0.2 -0.1 0.0 0.1 0.2 0.3 0.4
-1.0x10⁻⁶
-5.0x10⁻⁷
0.0
5.0x10⁻⁷
1.0x10⁻⁶
1.5x10⁻⁶
i (A
)
E (V)
BDD GC BDD ND
100 mV/s10-5M
Figure 8.14. CV curves (100 mV/s) for Fc ( 10-5 M) on BDD, GC and ND-BDD electrodes (3mm)
-0.3 -0.2 -0.1 0.0 0.1 0.2 0.3 0.4
-6.0x10⁻⁷
-4.0x10⁻⁷
-2.0x10⁻⁷
0.0
2.0x10⁻⁷
4.0x10⁻⁷
6.0x10⁻⁷
8.0x10⁻⁷
1.25x10⁻⁶M
2.5x10⁻⁶M 5x10⁻⁶M 10-5M
2x10⁻⁵M
i(A)
E(V)
Figure 8.15. CV curves (10 mV/s) for different Fc concentrations (in 0.1 M TBAP, CH3CN) on ND-BDD electrodes (3mm)
-0.3 -0.2 -0.1 0.0 0.1 0.2 0.3 0.4-2.0
-1.5
-1.0
-0.5
0.0
0.5
1.0
1.5
2.0
2.5
1.25x10⁻⁵M
2.5x10⁻⁶M 5x10⁻⁶M 10-5M
2x10⁻⁵M
i (A
)
E (V)
Figure 8.16. Normalized (to ipa) CV curves (10 mV/s) for different Fc concentrations (in 0.1 M TBAP, CH3CN) on ND-BDD electrodes (3mm)
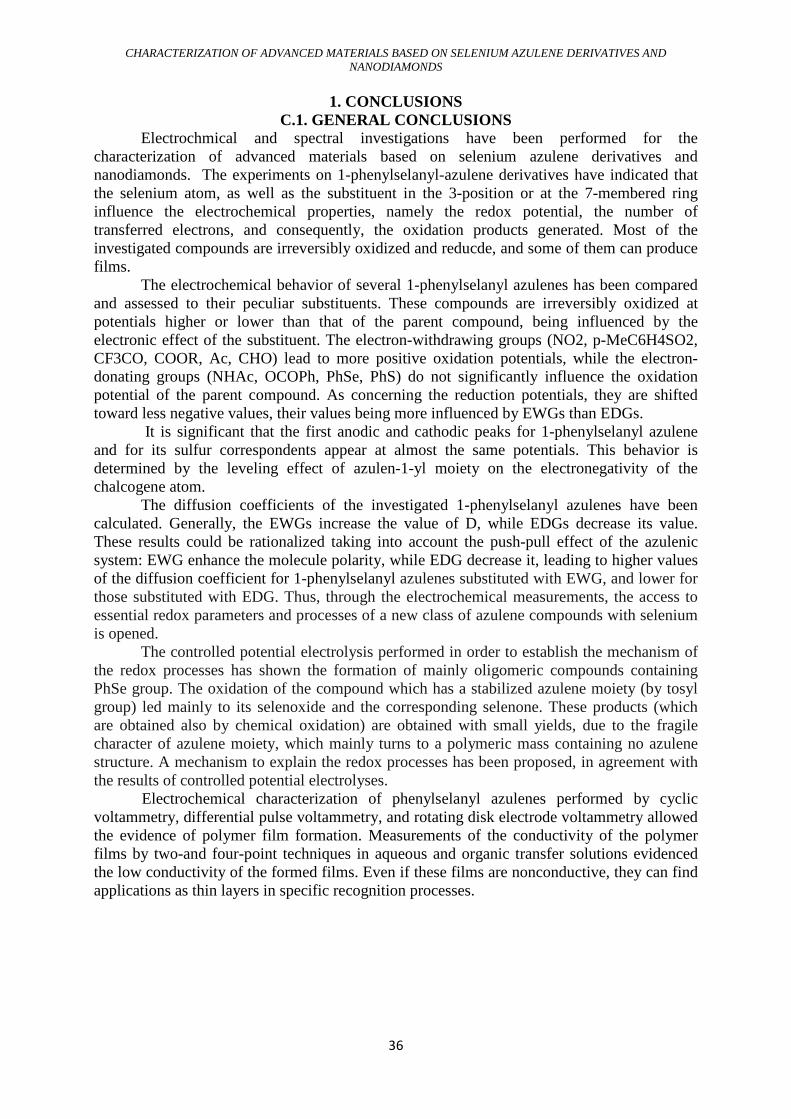
CHARACTERIZATION OF ADVANCED MATERIALS BASED ON SELENIUM AZULENE DERIVATIVES AND NANODIAMONDS
36
1. CONCLUSIONS
C.1. GENERAL CONCLUSIONS Electrochmical and spectral investigations have been performed for the characterization of advanced materials based on selenium azulene derivatives and nanodiamonds. The experiments on 1-phenylselanyl-azulene derivatives have indicated that the selenium atom, as well as the substituent in the 3-position or at the 7-membered ring influence the electrochemical properties, namely the redox potential, the number of transferred electrons, and consequently, the oxidation products generated. Most of the investigated compounds are irreversibly oxidized and reducde, and some of them can produce films.
The electrochemical behavior of several 1-phenylselanyl azulenes has been compared and assessed to their peculiar substituents. These compounds are irreversibly oxidized at potentials higher or lower than that of the parent compound, being influenced by the electronic effect of the substituent. The electron-withdrawing groups (NO2, p-MeC6H4SO2, CF3CO, COOR, Ac, CHO) lead to more positive oxidation potentials, while the electron-donating groups (NHAc, OCOPh, PhSe, PhS) do not significantly influence the oxidation potential of the parent compound. As concerning the reduction potentials, they are shifted toward less negative values, their values being more influenced by EWGs than EDGs.
It is significant that the first anodic and cathodic peaks for 1-phenylselanyl azulene and for its sulfur correspondents appear at almost the same potentials. This behavior is determined by the leveling effect of azulen-1-yl moiety on the electronegativity of the chalcogene atom.
The diffusion coefficients of the investigated 1-phenylselanyl azulenes have been calculated. Generally, the EWGs increase the value of D, while EDGs decrease its value. These results could be rationalized taking into account the push-pull effect of the azulenic system: EWG enhance the molecule polarity, while EDG decrease it, leading to higher values of the diffusion coefficient for 1-phenylselanyl azulenes substituted with EWG, and lower for those substituted with EDG. Thus, through the electrochemical measurements, the access to essential redox parameters and processes of a new class of azulene compounds with selenium is opened.
The controlled potential electrolysis performed in order to establish the mechanism of the redox processes has shown the formation of mainly oligomeric compounds containing PhSe group. The oxidation of the compound which has a stabilized azulene moiety (by tosyl group) led mainly to its selenoxide and the corresponding selenone. These products (which are obtained also by chemical oxidation) are obtained with small yields, due to the fragile character of azulene moiety, which mainly turns to a polymeric mass containing no azulene structure. A mechanism to explain the redox processes has been proposed, in agreement with the results of controlled potential electrolyses.
Electrochemical characterization of phenylselanyl azulenes performed by cyclic voltammetry, differential pulse voltammetry, and rotating disk electrode voltammetry allowed the evidence of polymer film formation. Measurements of the conductivity of the polymer films by two-and four-point techniques in aqueous and organic transfer solutions evidenced the low conductivity of the formed films. Even if these films are nonconductive, they can find applications as thin layers in specific recognition processes.
CHARACTERIZATION OF ADVANCED MATERIALS BASED ON SELENIUM AZULENE DERIVATIVES AND NANODIAMONDS
37
New electrode materials (with potential applications in the field of environmental protection) have been obtained.
This in situ studies show that ATR IR spectroscopy is an ideal technique in order to study the interaction of solvent molecules with ND surfaces. It has been shown that ethanol shows preferential binding to the ND surface via the polar –OH group, and that changes to the surface adsorbed layer take place in time that can be related to the ND functional groups and porous nature of the powder. Although ND is proposed for many high impact applications, there is still much to understand about the interaction of these nanoparticles with their environment and particularly the solvent. As the surface of ND has many similarities to other forms of carbon, the conclusions from this study are applicable to oxidised nanocarbons in general, for example porous activated carbons and graphene oxide.
C.2. ORIGINAL CONTRIBUTIONS The main novelty elements of the thesis are the following:
• performing electrochemical studies by CV, DPV and RDE for 14 new azulene selenium derivatives
• making correlations between the electrochemical properties and the structure of the derivatives studied for the redox potentials and the number of electrons exchanged in the main redox processes were examined in connection with the electronic effects of the substituents
• performing controlled potential electrolyses in order to highlight the formed products and allow the redox peaks assignment
• proposing a reaction mechanism for the oxidation and electrochemical reduction of azulene selenium derivatives to explain the evidenced redox processes
• the first study of selenium-azulene films by the 2 and 4-point conductivity method • the study of the difference between the electrochemical properties of some substituted
azulene compounds with selenium differently substituted, in order to evaluate the influence of the structure on the electrochemical properties, and the ability to form films
• performing total Attenuated Infrared Reflection (ATR-IR) spectroscopy studies to highlight the interaction between solvent molecules and the nanodiamond surface, in order to obtain new ND-based materials with pharmaceutical applications, as curing agents of polymer compositions, as adsorbents in chromatography and as moisture sensors
• using for the first time ATR-IR to monitor in-situ interactions between ethanol molecules and highly oxidized ND powders.
C3. OUTLOOK The results obtained in the thesis aim to:
• Correlate the spectroscopic results on nanodiamonds with electrochemicals studies
• Characterize boron doped nanodiamonds (BDD) and nanodiamond films deposited on boron doped diamonds (ND-BDD) in new electrochemical experiments
Results obtained on phenylselanyl azulenes:
CHARACTERIZATION OF ADVANCED MATERIALS BASED ON SELENIUM AZULENE DERIVATIVES AND NANODIAMONDS
38
• Allow correlations between the electrochemical properties and the structure of the studied compounds
• Lead to an electrochemical database for selenium derivatives • Highlight favorable premises for the formation of redox active polymer films
on the surface of the electrode, showing potential applications for the design of new electrochemical sensors.
It is also necessary to test the biological activity of these compounds, some properties being correlated with the electrochemical results already obtained.
APPENDICES List of contributions elaborated during this thesis
Papers 1. Georgiana Anca Inel, Eleonora-Mihaela Ungureanu, Thomas S. Varleyb, Meetal
Hirani, Katherine B. Holt, “Solvent–surface interactions between nanodiamond and ethanol studied with in situ infrared spectroscopy’’ , Diamond & Related Materials, 61, 2016, pp. 7–13 (Factor de impact FI: 2,125; Scor relativ influenta SRI: 0,707).
2. George-Octavian Buica, Maria-Laura Soare, Georgiana Anca Inel,, Alexandru C. Razus, Liviu Birzan, Alexandra Oprisanu, Eleonora-Mihaela Ungureanu, “On the electrochemical behavior of selanylazulenes”, J. Solid State Electrochemistry, ISSN 1432-8488, DOI 10.1007/s10008-016-3371-8, ),vol. 20, nr.11, pg. 3151-3164, 2016 (FI : 2,265; SRI: 0,703).
3. Cristina-Andreea Amarandei,George-Octavian Buica, Georgiana Anca Inel, Liviu Birzan, Eleonora-Mihaela Ungureanu,’’ Study of the Complexation of 1,3-diethyl 2-(azulen-1-ylmethylene)propanedioate with Lanthanide Cations’’, Acta Chim. Slov. 61, 2014, pp. 662-667 (Factor de impact:0.686 , Scor relativ influenta:0.572)
4. Alexandra Oprisanu, Georgiana Anca Inel, Eleonora-Mihaela Ungureanu, Liviu Birzan, “On the electrochemical behavior of some seleninyl azulene compounds” , U.P.B. Sci. Bull., Series B, 78, Iss. 3, 2016, pp. 3-15.
5. Georgiana Anca Inel, Catalina Cioates (Negut), Vladimir Mirsky, Liviu Birzan, Eleonora-Mihaela Ungureanu,’’Films obtained by electrochemistry from (6-methylazulene-1-yl)(phenyl)selane’’ U.P.B. Sci. Bull., Series B, Vol. 77, Iss. 2, 2015, pp. 3-18.
6. Georgiana Anca Inel, Maria Laura Soare, Magdalena Bujduveanu, Stefan Varga, Eleonora-Mihaela Ungureanu, Liviu Birzan, ’’Electrochemical characterization of some seleninyl azulene compounds” , U.P.B. Sci. Bull., Series B, Vol. 76, Iss. 1, 2014, pp. 3-10.
7. Luisa-Roxana Popescu, Eleonora Mihaela Ungureanu, Mihaela Iordache, Georgiana Anca Inel, Ioan Iordache,’’ Evaluation of the soil mercury pollution induced by the chloro-alkany activities in chemical industrial areas’’ Progress of Cryogenics and Isotopes Separation, 16, 2013, 106-118, ISSN: 1582-2575. Total FI: poz. 1+poz. 2+ poz. 3 = 5.076 Total SRI: 1.98
Conferences 1. Georgiana Anca INEL, Magdalena-Rodica BUJDUVEANU, Ştefan VARGA,
Maria-Laura SOARE, Eleonora-Mihaela UNGUREANU, ‘’ Electrochemical Study of
CHARACTERIZATION OF ADVANCED MATERIALS BASED ON SELENIUM AZULENE DERIVATIVES AND NANODIAMONDS
39
Selenyl-azulene’’ 18th Romanian International Conference on Chemistry and Chemical Engineering, 4-7 September, 2013, Sinaia, Romania
2. Luisa Roxana Popescu, Eleonora Mihaela Ungureanu, Mihaela Iordache, George Octavian Buica, Georgiana Anca Inel, Petronela Pavel, Cristina Dinu, ’’ Assesment of mercury pollution on ecosysmems water/sediment from Olt river basin and soil near industrial sources of pollution’’ 18th Romanian International Conference on Chemistry and Chemical Engineering, 4-7 Septembrie, 2013, Sinaia, Romania
3. Luisa-Roxana Popescu, Eleonora Mihaela Ungureanu, Mihaela Iordache, Georgiana Anca Inel, Ioan Iordache, ’’ Evaluation of the soil mercury pollution induced by the chloro-alkany activities in chemical industrial areas’’ Progress of Cryogenics and Isotopes Separation, 16, 2013, 106-118, ISSN: 1582-2575
4. Georgiana Anca INEL, Alexandra Oprişanu, Liviu BIRZAN, Eleonora-Mihaela Ungureanu, ''Electrochemical study of Selenium Azulene'' Chimia 2014, New Trends In Applied Chemistry, 23-24 Mai, 2014, Constanta, Romania
5. Georgiana Anca INEL, Catalina CIOATES (NEGUT), Vladimir MIRSKY, Liviu BIRZAN, Eleonora-Mihaela UNGUREANU, ‘’Films obtained by electrochemistry from (6-methylazulene-1-yl)(phenyl)selane’’ XXXIII-a National Chemistry Conference, 1-3 october, 2014, Călimaneşti-Căciulata, Romania
6. Alexandra Oprişanu, Georgiana Anca INEL, Liviu BIRZAN, Eleonora-Mihaela Ungureanu, ‘’Comportement électrochimique de seleninylazulène composés’’ XXXIII-a National Chemistry Conference, 1-3 octombrie, 2014, Călimaneşti-Căciulata, România,
7. Georgiana Anca INEL, Magdalena-Rodica BUJDUVEANU, Alexandra OPRIŞANU, Eleonora-Mihaela UNGUREANU, Liviu BIRZAN, Mihaela CRISTEA‘’ Electrochemical behaniour of phenylselanyl-azulene’’ 19th Romanian International Conference on Chemistry and Chemical Engineering, 2-5 September, 2015, Sibiu, Romania
The present summary contains in a concise form the content of chapters 4-8 of original contributions. The numbering of chapters, subchapters and tables corresponds to the sentence. The bibliographic references used in the paper are presented. Selective Bibliography: [2] A. O. Patil, A. J. Heeger, and F. Wudl, Chem. Rev., 88, 1988, 183. [32] K. B. Holt, Electrochemistry of Nanodiamond Particles in Nanodiamond, ed. Oliver A. Williams, Royal Society of Chemistry, 2014, pp. 128–150. [62] U. Lange, N.V. Roznyatovskaya, V.M. Mirsky, Anal. Chim. Acta 614, 2008, 1. [95] G.-O. Buica, M.-L. Soare, G. A. Inel, A.C. Razus, L. Birzan, A. Oprisanu, E.-M. Ungureanu, J. Solid State Electrochemistry 20( 11), 2016, 3151 [96] C.-A. Amarandei,G.-O. Buica, G. A. Inel, L. Birzan, E.-M. Ungureanu,, Acta Chim. Slov., 61, 2014, 662 [97] A. Oprisanu, G. A. Inel, E.-M. Ungureanu, L. Birzan, U.P.B. Sci. Bull., Series B, 78( 3), 2016, 3 [98] L.-R. Popescu, E.- M. Ungureanu, M. Iordache, G. A. Inel, I. Iordache, Progress of Cryogenics and Isotopes Separation, 16, 2013, 106

CHARACTERIZATION OF ADVANCED MATERIALS BASED ON SELENIUM AZULENE DERIVATIVES AND NANODIAMONDS
40
[99] Jaworski JS, Electrochemistry of organic selenium and tellurium compounds. Patai’s Chemistry of Functional Groups, John Wiley & Sons, 2012. [113] A.C. Razus, L. Birzan, M. Cristea, E.A. Dragu, A. Hanganu, Monatsh. Chem., 142, 2011, 1271 [114] G.A. Inel, M.L. Soare, M.R. Bujduveanu, Ş. Varga, E.M. Ungureanu, L.Birzan, U.P.B. Sci Bull Series B, 76, 2014, 3 [115] G.A. Inel, N.C. Cioates, V. Mirsky, L. Birzan, E.M. Ungureanu, U.P.B. Sci Bull Series B, 77, 2015, 3 [139] G.A. Inel, E.-M. Ungureanu, T.S. Varley, M. Hirani, K.B. Holt, Diamond & Related Materials, 61, 2016, 7
![NanomaterialeNanomaterialemembranaremembranare A.2.1... · • Rotaxanes with a calix[6]arene wheel and axles of different length. Synthesis, characterization, and Synthesis, characterization,](https://static.fdocumente.com/doc/165x107/5e0d17a2e6b274545410c686/nanomaterialenanomaterialemem-a21-a-rotaxanes-with-a-calix6arene-wheel.jpg)

![Electrochemical and Corrosion Behaviour of a New Titanium ...40 GPa [9]. Also, Banerjee et al. [10] applied different thermal treatments to Ti-34Nb-9Zr-8Ta alloy (Young’s modulus](https://static.fdocumente.com/doc/165x107/60fe93d964452b4c2c17ec9d/electrochemical-and-corrosion-behaviour-of-a-new-titanium-40-gpa-9-also.jpg)