Articol confocal
12
International Journal International Journal International Journal International Journal of Advanced Science and Technology of Advanced Science and Technology of Advanced Science and Technology of Advanced Science and Technology Vol Vol Vol Volume 13 ume 13 ume 13 ume 13, December, 200 , December, 200 , December, 200 , December, 2009 15 ECG Signal Compression Using 2D Wavelet Foveation Iulian B. Ciocoiu Technical University of Iasi, Romania Faculty of Electronics, Telecommunications, and Information Technology [email protected] Abstract Foveation principles suggested by natural vision systems enable the construction of a proper mask that may modulate the coefficients given by the Discrete Wavelet Transform of an ECG record. The mask is spatially selective and provides maximum accuracy around specific regions of interest. Subsequent denoising and coefficient quantization are further combined with efficient coding techniques such as SPIHT in order to provide high compression ratios at low reconstruction errors. Experimental results reported on a number of MIT-BIH records show improved performances over existing solutions Keywords: Foveation, 2D DWT, compression, ECG. 1. Introduction ECG signal compression has been one of the major biomedical research topics during the last decades. Triggered by the availability of new theoretical tools, technological advances, and e-health initiatives, a plethora of original solutions have been reported and comparative tests on publicly available databases were conducted. Transform-based methods using a broad range of tools such as wavelet analysis, Discrete Cosinus Transform (DCT) or Principal Components Analysis (PCA) have been preferred over direct methods dealing with the raw ECG time series such as AZTEC or CORTES, and have been complemented by further signal processing stages based on optimal quantization and entropy encoding. Special attention has been paid to assessing the clinical quality of the lossy compressed data, hence specific distortion measures have been defined [1, 2, 3] in addition to the classical Euclidean ones. One common aspect shared by many of the top performant compression methods refers to the use of the Discrete Wavelet Transform (DWT). It has been widely used in ECG signal analysis since this type of signals (short high-frequency impulses (R wave) superimposed on slowly varying waveforms (P, T, U waves), including artifacts and noise) favors processing tools with variable time-frequency resolution. Reported results indicate that DWT not only enables reliable identification of specific points and segments characterizing the ECG waveforms, but may also yield high compression ratios since most of the signal energy is concentrated in a limited number of significant coefficients. An interesting line of research focuses on transforming the original one-dimensional ECG waveforms into 2D information, followed by further processing using various image processing tools. Examples include multiresolution analysis, vector quantization, and JPEG2000 coding. In this context, the present paper proposes a novel compression scheme inspired by natural vision systems, based on combining DWT analysis with the construction of a space-scale selective mask obtained following retina-like foveation principles [4].
-
Upload
cristina-petcu -
Category
Documents
-
view
250 -
download
0
Transcript of Articol confocal
International JournalInternational JournalInternational JournalInternational Journal of Advanced Science and Technologyof Advanced Science and Technologyof Advanced Science and Technologyof Advanced Science and Technology
VolVolVolVolume 13ume 13ume 13ume 13, December, 200, December, 200, December, 200, December, 2009999
15
ECG Signal Compression Using 2D Wavelet Foveation
Iulian B. Ciocoiu
Technical University of Iasi, Romania Faculty of Electronics, Telecommunications, and Information Technology
Abstract
Foveation principles suggested by natural vision systems enable the construction of a
proper mask that may modulate the coefficients given by the Discrete Wavelet Transform of
an ECG record. The mask is spatially selective and provides maximum accuracy around
specific regions of interest. Subsequent denoising and coefficient quantization are further
combined with efficient coding techniques such as SPIHT in order to provide high
compression ratios at low reconstruction errors. Experimental results reported on a number
of MIT-BIH records show improved performances over existing solutions
Keywords: Foveation, 2D DWT, compression, ECG.
1. Introduction
ECG signal compression has been one of the major biomedical research topics during the
last decades. Triggered by the availability of new theoretical tools, technological advances,
and e-health initiatives, a plethora of original solutions have been reported and comparative
tests on publicly available databases were conducted. Transform-based methods using a broad
range of tools such as wavelet analysis, Discrete Cosinus Transform (DCT) or Principal
Components Analysis (PCA) have been preferred over direct methods dealing with the raw
ECG time series such as AZTEC or CORTES, and have been complemented by further signal
processing stages based on optimal quantization and entropy encoding. Special attention has
been paid to assessing the clinical quality of the lossy compressed data, hence specific
distortion measures have been defined [1, 2, 3] in addition to the classical Euclidean ones.
One common aspect shared by many of the top performant compression methods refers to
the use of the Discrete Wavelet Transform (DWT). It has been widely used in ECG signal
analysis since this type of signals (short high-frequency impulses (R wave) superimposed on
slowly varying waveforms (P, T, U waves), including artifacts and noise) favors processing
tools with variable time-frequency resolution. Reported results indicate that DWT not only
enables reliable identification of specific points and segments characterizing the ECG
waveforms, but may also yield high compression ratios since most of the signal energy is
concentrated in a limited number of significant coefficients.
An interesting line of research focuses on transforming the original one-dimensional ECG
waveforms into 2D information, followed by further processing using various image
processing tools. Examples include multiresolution analysis, vector quantization, and
JPEG2000 coding. In this context, the present paper proposes a novel compression scheme
inspired by natural vision systems, based on combining DWT analysis with the construction
of a space-scale selective mask obtained following retina-like foveation principles [4].
International JournalInternational JournalInternational JournalInternational Journal of Advancedof Advancedof Advancedof Advanced Science and TechnologyScience and TechnologyScience and TechnologyScience and Technology
VolVolVolVolume 13ume 13ume 13ume 13, December, 200, December, 200, December, 200, December, 2009999
16
Basically, foveation implements the design of the natural retina that provides variable spatial
resolution: it has a very large number of cells in the central region (the fovea) and a
continually decreasing number of cells towards its periphery. As a consequence, the details
present in the original image are kept unaltered along the foveated region, while they
smoothly disappear towards the margins of the visual field (anyway, in order to get a better
picture of “interesting” regions in the inspected scene, the eyes successively switch between
several distinct foveal points).
Using variable spatial resolution by means of foveation yields reduced data dimensionality,
which may be exploited within a compression framework. Previous results have shown the
possibility of treating foveation as an integral operator that may be conveniently
approximated in order to provide a mask that will modulate the DWT coefficients of the
analyzed signal, for both 1D and 2D cases [4]. As a consequence, the number of significant
DWT coefficients will drop, and subsequent quantization will further decrease their number.
Finally, the output data is obtained after applying a general-purpose lossless compression
technique or more sophisticated methods especially efficient within the wavelet analysis
framework such as EZW or SPIHT [5, 6].
Recent studies revealed that a cardiologist would spend most of the time inspecting
specific regions along the ECG waveform [7], hence in order to preserve critical diagnose
information we shall construct the mask by combining the contributions of several distinct
foveal points, placed on the R peak, and the middle of the P and T waves, respectively. As
such, we may preserve the durations, the amplitudes, and the shapes of clinically significant
features that will ultimately contribute to assessing the quality of the compressed waveforms
by means of various performance criteria such as Percent Root-Mean Square Difference
(PRD), Compression Ratio (CR), or more sophisticated Weighted Diagnostic Distortion
(WDD) measure [1]. It is interesting to note that some of the top performant segmentation
procedures aiming at identifying the characteristic points of ECG signals have also been
introduced within the wavelet analysis framework [8], although we may still consider
complementary methods rooted in general pattern recognition theory that are able to detect
specific regions-of-interest (ROI) [9, 10].
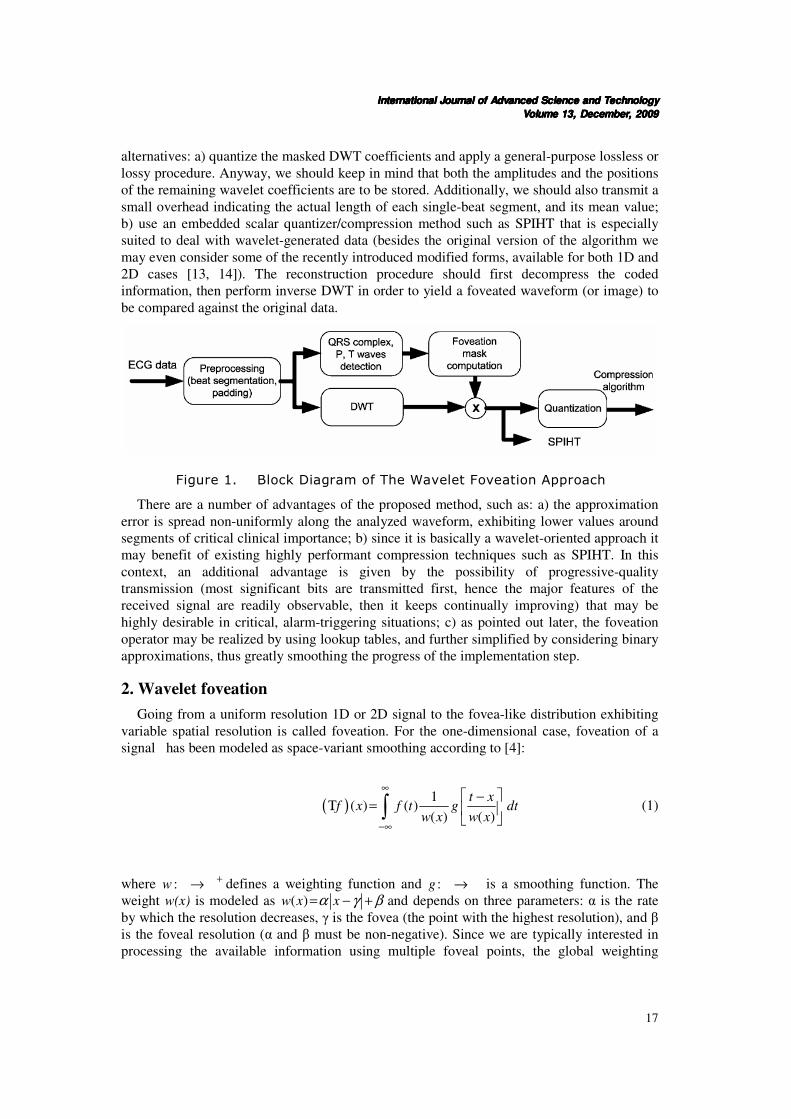
The block diagram of the proposed approach is indicated in Figure 1. It includes a
preprocessing module that splits the original waveform into separate single-beat segments,
identifies the corresponding characteristic points, and performs a padding procedure in order
to equalize the lengths of the individual segments to a common value (that should be chosen
as a power-of-two to accommodate subsequent DWT analysis). For the 2D case, the single-
beat segments should be arranged into a matrix format, and specific sorting procedures will
be applied to fully utilize both intra- and inter-correlation between the lines [11, 12]. Based
on the characteristic points provided by the preprocessing stage, a separate module computes
a (multi-) foveation mask, the parameters of which are mainly influenced by the widths of the
regions-of-interest. For the 1D case we have a distinct mask for each individual segment
(based on its specific PQRST complex), whereas in the 2D case the number of foveation
points will drop significantly, since a single region-of-interest may cover a group of single-
beat segments. We subsequently perform DWT decomposition of the ECG segments and
modulate the resulting coefficients by multiplying those with the corresponding mask. As a
result, the number of (masked) DWT coefficients will decrease considerably, and their
number may further be reduced after applying one of the available denoising procedures. In
order to obtain the final compressed information we may choose between the following
International JournalInternational JournalInternational JournalInternational Journal of Advanced Science and Technologyof Advanced Science and Technologyof Advanced Science and Technologyof Advanced Science and Technology
VolVolVolVolume 13ume 13ume 13ume 13, December, 200, December, 200, December, 200, December, 2009999
17
alternatives: a) quantize the masked DWT coefficients and apply a general-purpose lossless or
lossy procedure. Anyway, we should keep in mind that both the amplitudes and the positions
of the remaining wavelet coefficients are to be stored. Additionally, we should also transmit a
small overhead indicating the actual length of each single-beat segment, and its mean value;
b) use an embedded scalar quantizer/compression method such as SPIHT that is especially
suited to deal with wavelet-generated data (besides the original version of the algorithm we
may even consider some of the recently introduced modified forms, available for both 1D and
2D cases [13, 14]). The reconstruction procedure should first decompress the coded
information, then perform inverse DWT in order to yield a foveated waveform (or image) to
be compared against the original data.
Figure 1. Block Diagram of The Wavelet Foveation Approach
There are a number of advantages of the proposed method, such as: a) the approximation
error is spread non-uniformly along the analyzed waveform, exhibiting lower values around
segments of critical clinical importance; b) since it is basically a wavelet-oriented approach it
may benefit of existing highly performant compression techniques such as SPIHT. In this
context, an additional advantage is given by the possibility of progressive-quality
transmission (most significant bits are transmitted first, hence the major features of the
received signal are readily observable, then it keeps continually improving) that may be
highly desirable in critical, alarm-triggering situations; c) as pointed out later, the foveation
operator may be realized by using lookup tables, and further simplified by considering binary
approximations, thus greatly smoothing the progress of the implementation step.
2. Wavelet foveation
Going from a uniform resolution 1D or 2D signal to the fovea-like distribution exhibiting
variable spatial resolution is called foveation. For the one-dimensional case, foveation of a
signal has been modeled as space-variant smoothing according to [4]:
( )1
( ) ( )( ) ( )
t xf x f t g dt
w x w x
∞
−∞
−Τ =
∫ (1)
where :w+→� � defines a weighting function and :g →� � is a smoothing function. The
weight w(x) is modeled as ( )w x xα γ β= − + and depends on three parameters: α is the rate
by which the resolution decreases, γ is the fovea (the point with the highest resolution), and β
is the foveal resolution (α and β must be non-negative). Since we are typically interested in
processing the available information using multiple foveal points, the global weighting
International JournalInternational JournalInternational JournalInternational Journal of Advancedof Advancedof Advancedof Advanced Science and TechnologyScience and TechnologyScience and TechnologyScience and Technology
VolVolVolVolume 13ume 13ume 13ume 13, December, 200, December, 200, December, 200, December, 2009999
18
function w(x) may be constructed from a set of individual ones {w1(x), w2(x), …} according
to:
From a more general perspective, foveation may be also treated as an integral operator [4]:
( )( ) ( , ) ( )f x k x t f t dt
∞
−∞
Τ = ∫ (2)
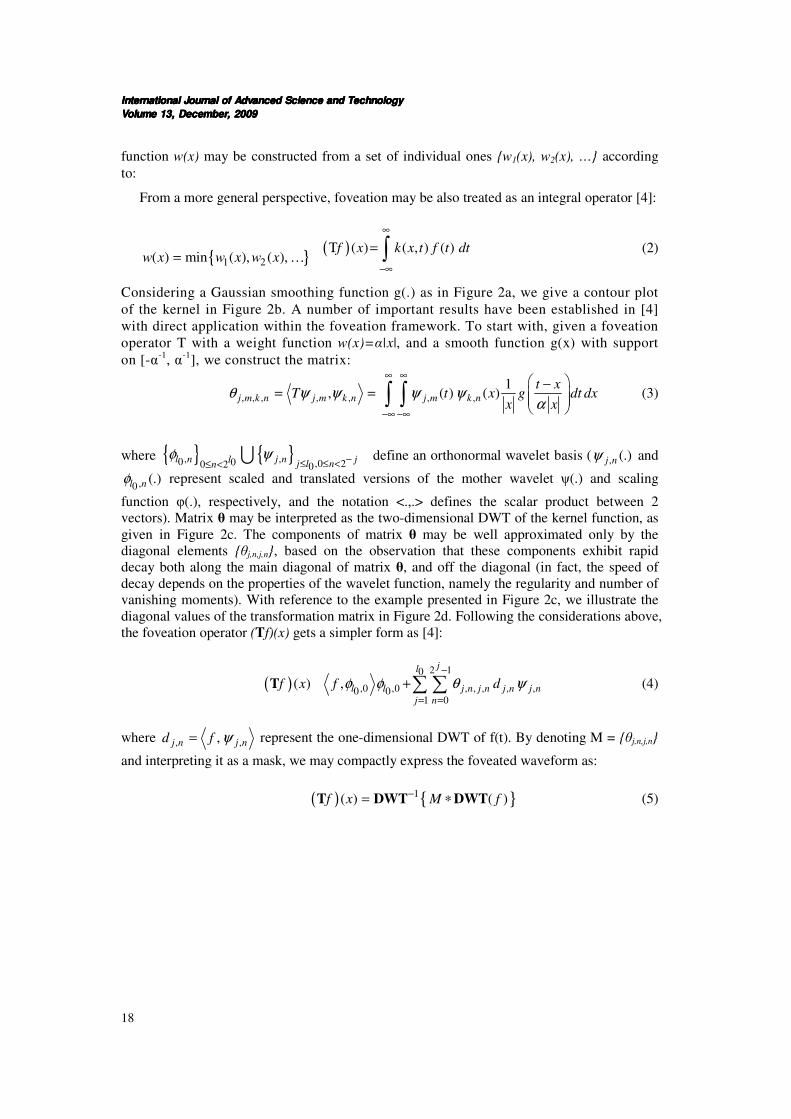
Considering a Gaussian smoothing function g(.) as in Figure 2a, we give a contour plot
of the kernel in Figure 2b. A number of important results have been established in [4]
with direct application within the foveation framework. To start with, given a foveation
operator T with a weight function w(x)=α|x|, and a smooth function g(x) with support
on [-α-1
, α-1
], we construct the matrix:
, , , , , , ,
1, ( ) ( )j m k n j m k n j m k n
t xT t x g dt dx
x xθ ψ ψ ψ ψ
α
∞ ∞
−∞ −∞
−= =
∫ ∫ (3)
where define an orthonormal wavelet basis ( , (.)j nψ and
,0(.)l nφ represent scaled and translated versions of the mother wavelet ψ(.) and scaling
function φ(.), respectively, and the notation <.,.> defines the scalar product between 2
vectors). Matrix θ may be interpreted as the two-dimensional DWT of the kernel function, as
given in Figure 2c. The components of matrix θ may be well approximated only by the
diagonal elements {θj,n,j,n}, based on the observation that these components exhibit rapid
decay both along the main diagonal of matrix θ, and off the diagonal (in fact, the speed of
decay depends on the properties of the wavelet function, namely the regularity and number of
vanishing moments). With reference to the example presented in Figure 2c, we illustrate the
diagonal values of the transformation matrix in Figure 2d. Following the considerations above,
the foveation operator (Tf)(x) gets a simpler form as [4]:
( )2 10
,0 ,0 , , , , ,0 01 0
( ) ,
jl
l l j n j n j n j n
j n
f x f dφ φ θ ψ−
= =
+∑ ∑T � (4)
where , ,,j n j nd f ψ= represent the one-dimensional DWT of f(t). By denoting M = {θj,n,j,n}
and interpreting it as a mask, we may compactly express the foveated waveform as:
( ) { }1( ) ( )f x M f−= ∗T DWT DWT (5)
{ }1 2( ) min ( ), ( ),w x w x w x= K
{ } { }, ,0 0 ,0 20 2 0l n j n jl j l nn
φ ψ −≤ ≤ <≤ <U
International JournalInternational JournalInternational JournalInternational Journal of Advanced Science and Technologyof Advanced Science and Technologyof Advanced Science and Technologyof Advanced Science and Technology
VolVolVolVolume 13ume 13ume 13ume 13, December, 200, December, 200, December, 200, December, 2009999
19
a)
b)
c)
d)
Figure 2. a) Gaussian-type smoothing function g(x); b) contour plot of
the kernel function k(x, t) (darker pixels represent larger values);
c) corresponding θ matrix; d) diagonal entries of matrix θ
One interesting line of research that has attracted much attention recently relies on
transforming the original one-dimensional ECG waveforms into 2D images, and thus
enabling further coding techniques to use both interbeat and intrabeat correlations. As
such, classical general-purpose compression methods such as JPEG2000 or wavelet-
oriented solutions such as SPIHT or EZW have shown impressive performance
improvements over one-dimensional cases [11-13]. Typically, the 1D-2D reshaping is
based on special preprocessing procedures involving cut-and-align successive single-
beat intervals [23] (complemented with constant value padding), or period
normalization [24]. Various improvements of the basic approaches have also been
proposed in order to increase the correlation between successive lines of the resulting
image [11, 12].
The foveation principle previously introduced for the one-dimensional case may be
generalized for the 2D case by considering a two-dimensional smoothing kernel [4]:
(6)
and a corresponding two-dimensional weight function 1 2 2( , ) ( , ) ( , )w x y x yα γ γ β= − + .
Much similar to the 1D case, the kernel is also transformed via the (two-dimensional)
, 2
1( , ) ,
( , ) ( , )( , )x y
s x t yg s t g
w x y w x yw x y
− −=
International JournalInternational JournalInternational JournalInternational Journal of Advancedof Advancedof Advancedof Advanced Science and TechnologyScience and TechnologyScience and TechnologyScience and Technology
VolVolVolVolume 13ume 13ume 13ume 13, December, 200, December, 200, December, 200, December, 2009999
20
DWT, showing again rapid decay away from the foveal point. In order to obtain the
actual expression of the mask, we should consider the following definitions for the two-
dimensional wavelets [4]:
(7)
The expression of the foveated image is approximated as:
(8)
where { [ , ]}kjd m n define the two-dimensional DWT transform of the original (constant
resolution) image I along the diagonal, vertical, and horizontal directions, respectively,
and the masking coefficients { }[ , ]kjc m n approximate the dominant (diagonal) entries of
the transformed kernel. These coefficients may be computed as follows [4]:
(9)
where 2 2r m n= + , [ ]jc m is the one-dimensional mask computed as in equation (3),
and coefficients [ ]jb n approximate the scalar product , ,, ( )fovj m j mTφ φ . As a
consequence, we only need to keep two one-dimensional masks and compute the two-
dimensional mask as indicated in equation (9).
3. Experimental results
We have performed extensive computer simulations in order to validate the
compression performances of the foveation approach. Tests were conducted using 10-
minute long signals extracted from a number of records in the MIT-BIH Arrhythmia
database [25], namely records 100, 101, 102, 103, 105, 106, 115, 117. 119, 202, 209, and
212. The data is sampled with 360 Hz, and is represented with 11 bits resolution. The records
first undergo a preprocessing step that is merely driven by the 2D experiments. Specifically,
we automatically detected the characteristic points of the ECG waveforms using the wavelet-
based procedure introduced in [8]. It relies on an important theoretical result reported by S.
Mallat that illustrates the possibility of characterizing the local shape of irregular structures
by means of the evolution of DWT local maxima along successive dyadic scales [26]. A
number of several such modulus-maxima based approaches have been reported [8], showing
, , , ,
, , , ,
, , , ,
, , , ,
( , ) ( ) ( )
( , ) ( ) ( )
( , ) ( ) ( )
( , ) ( ) ( )
j m n j m j n
dj m n j m j n
vj m n j m j n
hj m n j m j n
x y x y
x y x y
x y x y
x y x y
φ φ
ψ ψ
ψ φ
φ ψ
= ⋅
= ⋅
= ⋅
= ⋅
Φ
Ψ
Ψ
Ψ
( ) ,2
,0,0 ,0,0 , ,0 0, , ,
( , ) ( , ) ( , )
, [ , ] [ , ]
fovx y
R
k k kl l j j j m n
k m n j
T x y s t g s t ds dt
c m n d m n
= =
= +
∫∑
I I
I Φ Φ Ψ
[ ] [ ],
[ , ] [ ] [ ],
[ ] [ ],
j j
kj j j
j j
c r b r if k v
c m n b r c r if k h
c r c r otherwise
⋅ =
= ⋅ =
⋅
International JournalInternational JournalInternational JournalInternational Journal of Advanced Science and Technologyof Advanced Science and Technologyof Advanced Science and Technologyof Advanced Science and Technology
VolVolVolVolume 13ume 13ume 13ume 13, December, 200, December, 200, December, 200, December, 2009999
21
remarkable performances on several publicly available databases. Basically, a multiscale
decomposition is first performed on the given ECG record, and afterwards the presence of
min-max pairs of coefficients is identified on successive distinct resolution scales. Only pairs
that are present on all scales are selected and further processed, the rest are treated as parasitic
and eliminated, with the additional benefit of removing also many sources of noise and/or
artifacts. We begin by first detecting the R peaks, since they yield modulus maxima with
highest amplitudes. This enables the segmentation of the original ECG record into individual
single-beat signals. In fact, following the procedure in [11], we cut the raw data at every
130th sample before each R peak in order to avoid large variations between the edge values.
Next, we apply mean-padding of the individual beats to obtain a common length for all the
segments by augmenting them with an appropriate number of constant values given by the
average amplitude of each segment. The common length is given by the next power-of-two of
the longest original single-beat segment in order to accommodate the data to the subsequent
DWT processing (more specifically, the common length was set to 512 samples). The next
step consists in detecting the onset and final points of the T and P waves, respectively, using
the same modulus-maxima approach described earlier. Although the method has been used
with remarkable success in practical applications, we should nevertheless note that the
performances of this strategy rely on existing medical experience that provides statistical
information on average segments durations, refractory periods, and typical artifacts. For the
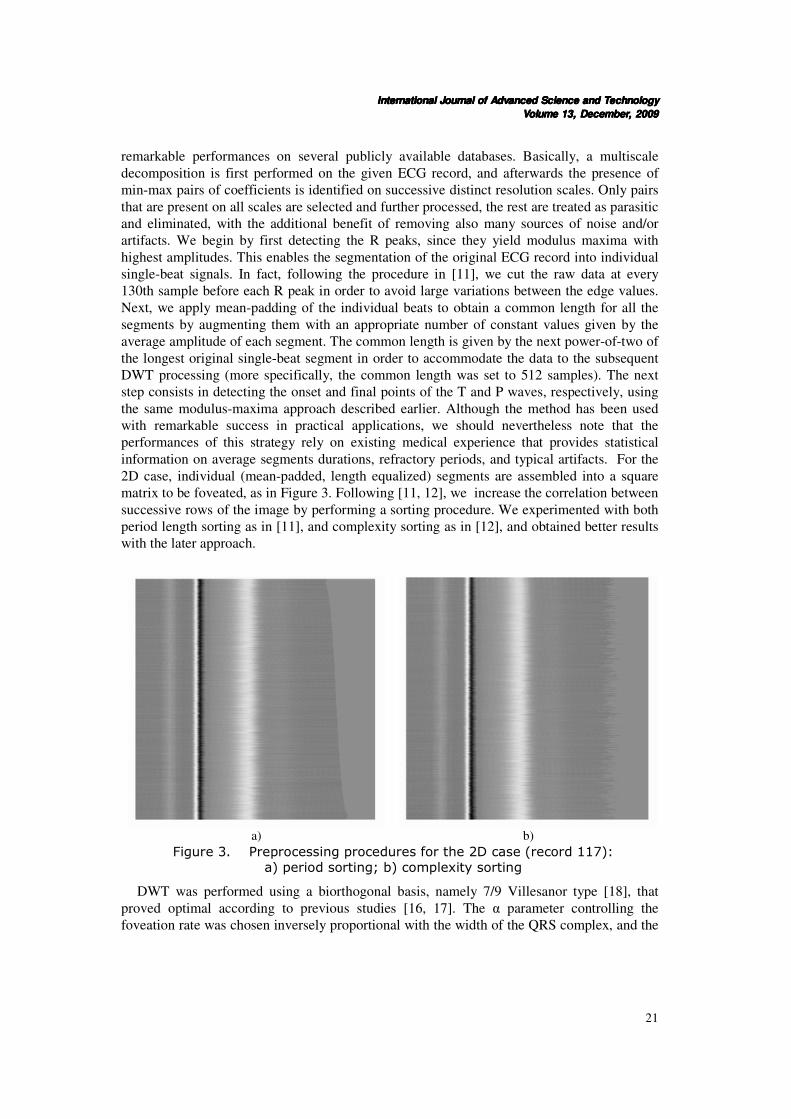
2D case, individual (mean-padded, length equalized) segments are assembled into a square
matrix to be foveated, as in Figure 3. Following [11, 12], we increase the correlation between
successive rows of the image by performing a sorting procedure. We experimented with both
period length sorting as in [11], and complexity sorting as in [12], and obtained better results
with the later approach.
a)
b)
Figure 3. Preprocessing procedures for the 2D case (record 117):
a) period sorting; b) complexity sorting
DWT was performed using a biorthogonal basis, namely 7/9 Villesanor type [18], that
proved optimal according to previous studies [16, 17]. The α parameter controlling the
foveation rate was chosen inversely proportional with the width of the QRS complex, and the
International JournalInternational JournalInternational JournalInternational Journal of Advancedof Advancedof Advancedof Advanced Science and TechnologyScience and TechnologyScience and TechnologyScience and Technology
VolVolVolVolume 13ume 13ume 13ume 13, December, 200, December, 200, December, 200, December, 2009999
22
P and T waves, respectively. The values of the β parameter controlling the foveal resolution
was selected at a common value of 1 for all the foveal points.
The compression performances were computed in terms of the Percent Root-Mean Square
Difference (PRD) and the Compression Ration (CR) defined as follows:
(10)
where denotes the original signal and the compressed version. Nbits defines the total number
of bits used to encode the original and the compressed signal, respectively. We have further
compressed the masked wavelet coefficients using both a general purpose compression
algorithm, namely the Lempel-Ziv coding strategy implemented in the gzip tool [27], and the
wavelet-oriented SPIHT algorithm [5]. In the former case, we first quantized the amplitudes
of the coefficients using a 8-bit scalar quantizer (the compressed information includes both
the amplitudes of the masked wavelet coefficients and their positions). As regarding the
SPIHT algorithm, we used the code developed by the authors of the original method to deal
with the 1D case (code available at http://www.cipr.rpi.edu/research/SPIHT/). For the 2D
case we used the MATLAB Wavelet Toolbox, ver. 4.3.
The full benefit of the foveation approach is obtained in the 2D case, since we not only
exploit both intra-beat and inter-beat correlations, but we may also decrease significantly the
number of foveal points, since each point would extend its “region of influence” in both
coordinates. Within this context, we will exploit the observation at the end of Section 3, by
using distinct α parameters to define the weighting functions (and corresponding one-
dimensional masks) along the horizontal and vertical coordinates. More specifically, while we
keep the idea of choosing the α parameter along the horizontal direction inversely
proportional to the durations of the foveal segments (QRS complex, and the P and T waves,
respectively), we will set the α parameter along the vertical direction inversely proportional to
the number of selected foveal points. As such, we may obtain a uniform covering of the
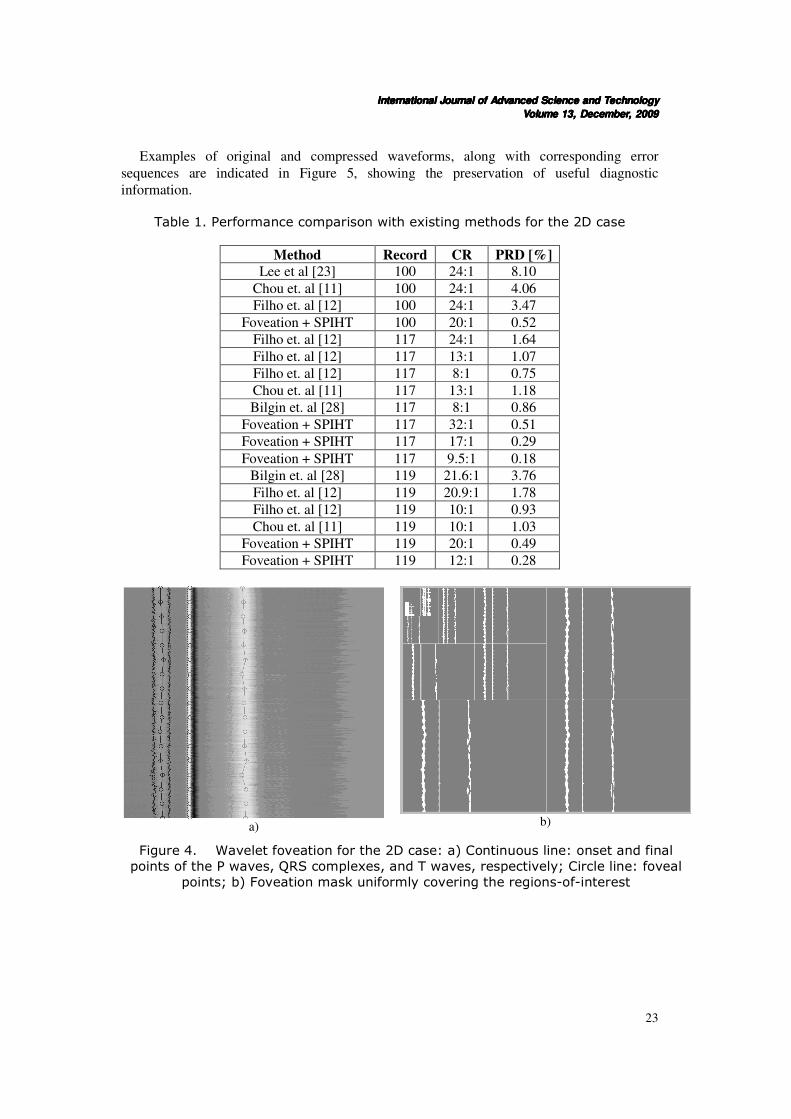
foveal regions using a small number of actual foveal points. Comparative analysis with
existing reported data is indicated in Table 1 for records 100, 117, and 119, showing
improved performances. The dimensions of the images in all cases is 512x512 pixels, and
number of fovetion points was 16. End-effects were tackled by performing symmetric
extensions along both coordinates.
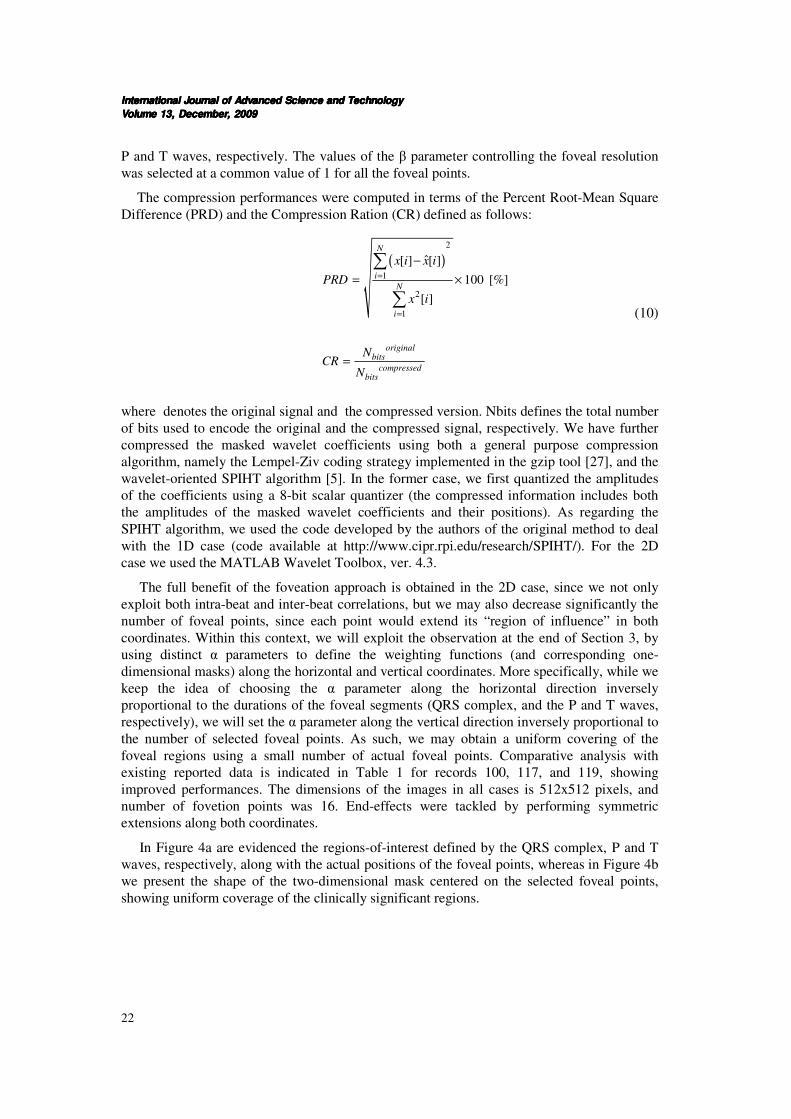
In Figure 4a are evidenced the regions-of-interest defined by the QRS complex, P and T
waves, respectively, along with the actual positions of the foveal points, whereas in Figure 4b
we present the shape of the two-dimensional mask centered on the selected foveal points,
showing uniform coverage of the clinically significant regions.
( )2
1
2
1
ˆ[ ] [ ]
100 [%]
[ ]
N
i
N
i
originalbits
compressedbits
x i x i
PRD
x i
NCR
N
=
=
−
= ×
=
∑
∑
International JournalInternational JournalInternational JournalInternational Journal of Advanced Science and Technologyof Advanced Science and Technologyof Advanced Science and Technologyof Advanced Science and Technology
VolVolVolVolume 13ume 13ume 13ume 13, December, 200, December, 200, December, 200, December, 2009999
23
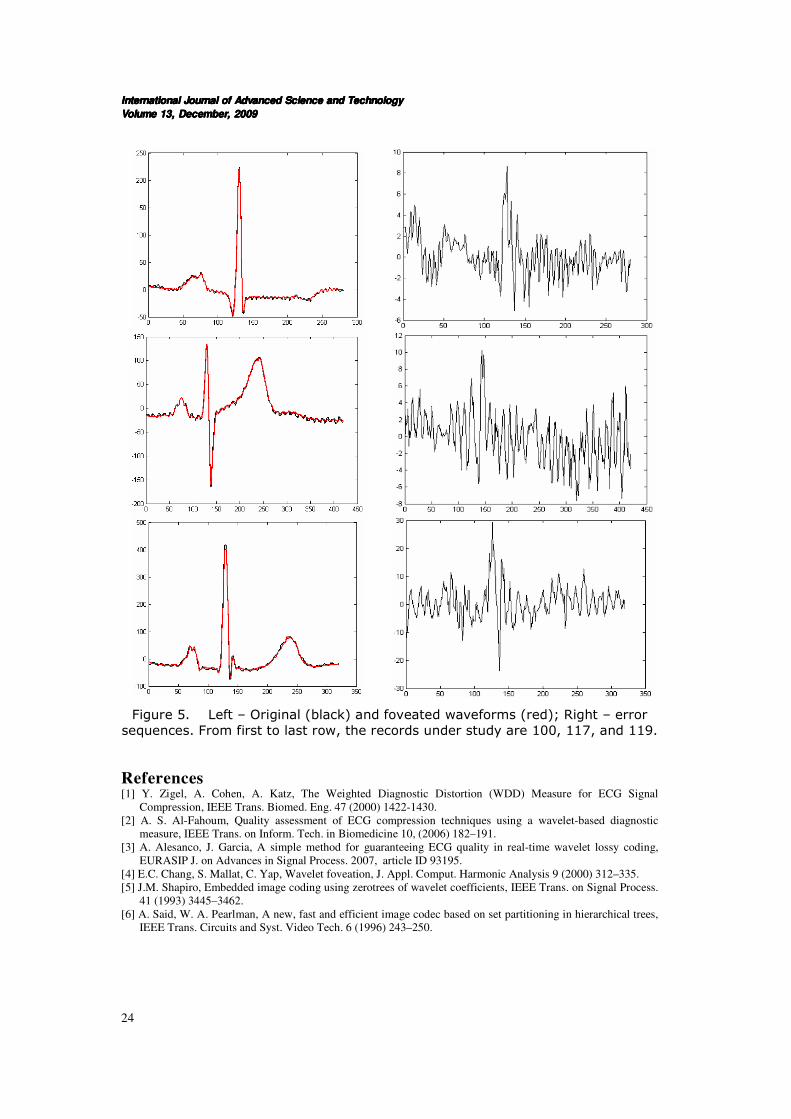
Examples of original and compressed waveforms, along with corresponding error
sequences are indicated in Figure 5, showing the preservation of useful diagnostic
information.
Table 1. Performance comparison with existing methods for the 2D case
Method Record CR PRD [%]
Lee et al [23] 100 24:1 8.10
Chou et. al [11] 100 24:1 4.06
Filho et. al [12] 100 24:1 3.47
Foveation + SPIHT 100 20:1 0.52
Filho et. al [12] 117 24:1 1.64
Filho et. al [12] 117 13:1 1.07
Filho et. al [12] 117 8:1 0.75
Chou et. al [11] 117 13:1 1.18
Bilgin et. al [28] 117 8:1 0.86
Foveation + SPIHT 117 32:1 0.51
Foveation + SPIHT 117 17:1 0.29
Foveation + SPIHT 117 9.5:1 0.18
Bilgin et. al [28] 119 21.6:1 3.76
Filho et. al [12] 119 20.9:1 1.78
Filho et. al [12] 119 10:1 0.93
Chou et. al [11] 119 10:1 1.03
Foveation + SPIHT 119 20:1 0.49
Foveation + SPIHT 119 12:1 0.28
a)
b)
Figure 4. Wavelet foveation for the 2D case: a) Continuous line: onset and final
points of the P waves, QRS complexes, and T waves, respectively; Circle line: foveal
points; b) Foveation mask uniformly covering the regions-of-interest
International JournalInternational JournalInternational JournalInternational Journal of Advancedof Advancedof Advancedof Advanced Science and TechnologyScience and TechnologyScience and TechnologyScience and Technology
VolVolVolVolume 13ume 13ume 13ume 13, December, 200, December, 200, December, 200, December, 2009999
24
Figure 5. Left – Original (black) and foveated waveforms (red); Right – error
sequences. From first to last row, the records under study are 100, 117, and 119.
References [1] Y. Zigel, A. Cohen, A. Katz, The Weighted Diagnostic Distortion (WDD) Measure for ECG Signal
Compression, IEEE Trans. Biomed. Eng. 47 (2000) 1422-1430.
[2] A. S. Al-Fahoum, Quality assessment of ECG compression techniques using a wavelet-based diagnostic
measure, IEEE Trans. on Inform. Tech. in Biomedicine 10, (2006) 182–191.
[3] A. Alesanco, J. Garcia, A simple method for guaranteeing ECG quality in real-time wavelet lossy coding,
EURASIP J. on Advances in Signal Process. 2007, article ID 93195.
[4] E.C. Chang, S. Mallat, C. Yap, Wavelet foveation, J. Appl. Comput. Harmonic Analysis 9 (2000) 312–335.
[5] J.M. Shapiro, Embedded image coding using zerotrees of wavelet coefficients, IEEE Trans. on Signal Process.
41 (1993) 3445–3462.
[6] A. Said, W. A. Pearlman, A new, fast and efficient image codec based on set partitioning in hierarchical trees,
IEEE Trans. Circuits and Syst. Video Tech. 6 (1996) 243–250.
International JournalInternational JournalInternational JournalInternational Journal of Advanced Science and Technologyof Advanced Science and Technologyof Advanced Science and Technologyof Advanced Science and Technology
VolVolVolVolume 13ume 13ume 13ume 13, December, 200, December, 200, December, 200, December, 2009999
25
[7] P Augustyniak et al, Assessment of electrocardiogram visual interpretation strategy based on scanpath analysis,
Physiol. Meas. 27 (2006) 597-608.
[8] S. Kadambe, R. Murray, F. Boudreaux-Bartels, Wavelet Transform-Based QRS Complex Detector, IEEE
Trans. Biomed. Eng. 46 (1999) 838-847.
[9] T. Lindeberg, Scale-space, in: B. Wah (Ed.), Encyclopedia of Computer Science and Engineering, John Wiley
and Sons, Hoboken, NJ, 2009, pp. 2495-2504.
[10] K. Mikolajczyk, T. Tuytelaars, et al., A comparison of affine region detectors, Int. J. Comput. Vision 65
(2005) 43–72.
[11] H.-H. Chou, Y.-J. Chen, Y.-C. Shiau, T.-S. Kuo, An Effective and Efficient Compression Algorithm for ECG
Signals with Irregular Periods, IEEE Trans. Biomed. Eng. 53 (2006) 1198–1205.
[12] E.B.L. Filho, N.M.M. Rodrigues, et al., ECG Signal Compression Based on DC Equalization and Complexity
Sorting, IEEE Trans. Biomed. Eng. 55 (2008) 1923-1926.
[13] S.C. Tai, C.C. Sun, W.C. Yan, A 2-D ECG Compression Method Based on Wavelet Transform and Modified
SPIHT, IEEE Trans. Biomed. Eng. 52 (2005) 999-1008.
[14] Z. Lu, D. Y. Kim, W. A. Pearlman, Wavelet compression of ECG signals by the set partitioning in
hierarchical trees (SPIHT) algorithm, IEEE Trans. Biomed. Eng. 47 (2000) 849–856.
[15] G. Beylkin, R. Coifman, V. Rokhlin, Wavelets in numerical analysis, in: M.B. Rushkai et al. (Ed.), Wavelets
and Their Applications, Jones and Bartlett, Boston, MA, 1992, pp. 181–210.
[16] M. L. Hilton, Wavelet and wavelet packet compression of electrocardiograms, IEEE Trans. Biomed. Eng. 44
(1997) 394–402.
[17] M. Nielsen, E.N. Kamavuako, et al., Optimal wavelets for biomedical signal compression, Med. Bio. Eng.
Comput. 44 (2006) 561–568.
[18] J. D. Villasenor, B. Belzer, J. Liao, Wavelet filter evaluation for image compression, IEEE Trans. Image
Process. 4 (1995) 1053–1060.
[19] C. M. Brislawn, Classification of symmetric wavelet transforms, Los Alamos National Laboratory, Los
Alamos, NM, Tech. Rep., 1993.
[20] S. Mallat, A wavelet tour of signal processing, Academic, New York, 1998.
[21] Birgé, L., P. Massart, From model selection to adaptive estimation, in: D. Pollard (Ed.), Festchrift for Lucien
Le Cam, Springer, New York, 1997, pp. 55-87.
[22] Donoho, D.L., De-Noising by soft-thresholding, IEEE Trans. on Inf. Theory 41 (1995) 613-627.
[23] H. Lee, K. M. Buckley, ECG data compression using cut and align beats approach and 2-D transforms, IEEE
Trans. Biomed. Eng. 46 (1999) 556–565.
[24] J.-J. Wei, C.-J. Chang, N.-K. Chou, G.-J. Jan, ECG data compression using truncated singular value
decomposition, IEEE Trans. Inf. Technol. Biomed. 5 (2001) 290–299.
[25] PhysioBank, physiologic signal archives for biomedical research [Online]. Available:
http://www.physionet.org/physiobank/
[26] S. G. Mallat, S. Zhong, Characterization of signals from multiscale edges, IEEE Trans. on Pattern Anal.
Machine Intell. 14 (1992) 710–732.
[27] gzip compression algorithm. Available: http://www.gzip.org/
[28] A. Bilgin, M. W. Marcellin, M. I. Altbach, Compression of electrocardiogram signals using JPEG2000, IEEE
Trans. Consum. Electron. 49 (2003) 833–840.
[29] C.M. Fira, L. Goras, An ECG signals compression method and its validation using NNs”, IEEE Trans.
Biomed. Eng. 55 (2008) 1319-1326.
[30] J.S. Walker, Transform and Data Compression. A Primer on Wavelets and Their Scientific Applications, CRC
Press, Boca Raton, 1999.

International JournalInternational JournalInternational JournalInternational Journal of Advancedof Advancedof Advancedof Advanced Science and TechnologyScience and TechnologyScience and TechnologyScience and Technology
VolVolVolVolume 13ume 13ume 13ume 13, December, 200, December, 200, December, 200, December, 2009999
26
Author
Iulian B. Ciocoiu was born in Miercurea-Ciuc, Romania, in 1963. He
received the B.S. degree in electronic engineering from Technical
University of Iasi, Romania, in 1988, and the PhD degree in electronic
engineering from the same University, in 1996. He published more than
40 papers, 2 books (in Romanian), and 2 book chapters. His research
interests include artificial neural networks, adaptive filtering, biometric
applications.